 Zhaoju Deng
 Kun Wang2
 Jie Cao
 Chong Ma
- 1Department of Clinical Veterinary Medicine, College of Veterinary Medicine, China Agricultural University, Beijing, China
- 2Institute of Cereal and Oil Crops, Hebei Academy of Agricultural and Forestry Sciences, Shijiazhuang, China
This study aimed to (1) estimate the prevalence of cow-level high somatic cell count (SCC) in Chinese dairy herds and (2) identify potential factors associated with cow- and herd-level SCC variables. The monthly data on dairy herd improvement were collected from a total of 131 dairy herds in 11 provinces in China in 2019. Mixed models were constructed using the cow composite milk SCC and the variance of cow SCC as dependent variables separately and parity, seasons, days in milk (DIM), herd size, and farm types (family-owned vs. company-owned) as fixed effects, accounting for the nested random herd and cow effect. We used negative binomial regression using herd-level SCC-related variables, namely, monthly proportion of high SCC, monthly proportion of new high SCC, monthly proportion of chronic high SCC, and monthly proportion of new chronic high SCC as dependent variables separately against seasons, herd size, and farm types with the random herd effect. The overall average prevalence of high SCCs for each month per farm was 0.26 (2.5–97.5% quantile: 0–0.56). Company-owned farms performed better in herd SCC management. Seasons were significantly associated with all the aforementioned variables, and summer and autumn were the seasons associated with worse outcomes in herd SCCs. This study is the first to assess high SCC in a large number of Chinese dairy herds, which is useful for farms to tailor the on-farm mastitis control programs in China.
Introduction
Udder health management is of high importance in dairy farming (1). The common indicators of poor udder health are clinical and subclinical mastitis. Clinical mastitis is mostly diagnosed by the visual inspection of milk and udders for clinical symptoms, while the detection of subclinical mastitis relies on enumerating the somatic cell count (SCC) using the on-farm California mastitis test (2) or SCC sensors (3, 4) or via the bacteriologic culturing of milk samples in a laboratory (2).
The dairy herd improvement (DHI) program has long been used to monitor subclinical mastitis (5), and many research studies used it to estimate the prevalence of herd-level subclinical mastitis (6–8). The DHI program was founded in the 1990s in China; in recent decades, we have witnessed increased participation of farms in the program and more reliable data being generated from the program.
Herd size has significantly increased as compared with that in the last decade; the percentage of herds with more than 100 cows has increased from 20% (2008) to 60% (2018) (9). Small family-owned farms have ceased operations because of low production and environmental pressure in the last decade. According to the China Dairy Data Report (2020), the average lactational milk production per cow increased from 4,800 kg (2009) to 7,800 kg (2019) during the last decade (10). The average herd geometric mean SCC was comparable to that at farms in developed dairy industries (11–13). In addition to the improvement in milk production, the udder health status of Chinese dairy herds improved as compared to that in previous years (10).
Isolated attempts have been made to estimate the prevalence (or incidence) of (sub)clinical mastitis and the distribution of mastitis-causing pathogens in different regions in China. Gao et al. reported that the incidence of clinical mastitis was 3.3 cases per 100 cows every month, and the corresponding major mastitis-causing pathogens were environmental pathogens coexisting with a relatively low prevalence of contagious pathogens in clinical mastitis cases among Chinese dairy herds (14). According to Bi et al., the most prevalent mastitis pathogen species in bulk milk samples of Chinese dairy herds were Streptococcus agalactiae, Streptococcus dysgalactiae, Trueperella pyogenes, and Staphylococcus aureus (15).
Current research mostly focuses on clinical mastitis; however, mastitis-related expenses attributed to subclinical mastitis (48%) are higher than those associated with clinical mastitis (34%) (13). Therefore, controlling subclinical mastitis is more important. The SCC is a key indicator of subclinical mastitis. Therefore, this study aimed to (1) estimate the prevalence of a high SCC in cows and (2) identify the potential factors associated with a high SCC in Chinese dairy herds.
Materials and methods
Data collection
Dairy farms that participated in the DHI program and that we were acquainted with were approached. Farms were included in the study based on their willingness to participate in the study and their access to DHI data. Finally, the DHI data of 134 farms in 11 provinces in 2019 were collected.
Data cleaning
A total of 924,970 records from 105,644 cows at 134 farms in 11 provinces were collected. These records were cleaned using the following steps:
1) Records without parity information were deleted (48 records from 48 cows at one farm).
2) Records with a milk yield < 1 kg were deleted (751 records from 695 cows at 51 farms in 10 provinces).
3) Records with a percentage of fat exceeding the range of 1.5–8 were deleted (20,801 records from 13,765 cows at 74 farms in 10 provinces).
4) Records without SCC were deleted (109 records from 107 cows in 22 herds from eight provinces).
5) Records with SCC exceeding the performance range (1–9,999 × 1,000 cells/mL) of the Fossomatic SCC measurement were deleted (49,390 records from 15,301 cows at 95 farms in 10 provinces) (16).
6) Records from days in milk (DIM) exceeding the range of 7–305 days were deleted (154,496 records from 48,808 cows at 134 farms in 11 provinces).
7) Records from cows that had undergone fewer than two consecutive DHI tests were deleted (27,245 records from 18,466 cows at 134 farms in 11 provinces).
A total of 672,078 records from 85,407 cows at 131 farms in 11 provinces were included in the final dataset after data cleaning.
SCC variables
To identify factors associated with a high SCC, we used cow- and herd-level SCC variables derived from the cow composite milk SCC.
Cow-level SCC variables
The cow composite milk SCC and the variance of cow SCC for each cow in 2019 were used as the cow-level SCC variables. The variance of cow SCC in 2019 was calculated as the variance of SCC for each cow.
Herd-level SCC variables
We calculated the following herd-level SCC variables for each month: herd average SCC (SCCav), herd average variance of SCC (SCCvar), herd average proportion of high SCC (HiSCC), herd average proportion of new high SCC (NHiSCC), herd average proportion of chronic high SCC (CHiSCC), and herd proportion of new chronic high SCC (NCHiSCC). The SCCav was calculated as the herd geometric average of SCC for each month, followed by log10 transformation; the herd average variance of SCC was calculated in the same way as SCCav. The HiSCC was calculated as the herd average proportion of SCC more than or equal to 200,000 cells/mL for each month. The herd average proportion of new high SCC was calculated as the herd average proportion of new high SCC for each month. New high SCC cases were defined as records with SCC revealing more than or equal to 200,000 cells/mL on the current DHI test date and revealing fewer than 200,000 cells/mL on the preceding DHI test date. The herd average proportion of chronic high SCC was the herd average proportion of SCC with more than two consecutive SCCs revealing ≥200,000 cells/mL on all DHI test dates, and chronic high SCC was defined as more than two consecutive SCCs revealing ≥200,000 cells/mL. The herd proportion of new chronic high SCC was calculated as the herd average proportion of new chronic high SCC, followed by more than two consecutive SCCs revealing fewer than 200,000 cells/mL.
Statistical analyses
Cow-level SCC variables
To identify factors associated with the cow composite milk SCC and the variance of cow SCC in 2019, a mixed model with the cow composite milk SCC (linear mixed model) and the variance of cow SCC (negative binomial mixed model) used as a dependent variable separately against parity (1, 2, 3, 4, ≥5), DIM (categorized as 7–40, 41–100,101–200, 200–305), season (spring, summer, autumn, winter), farm type (family-owned farm vs company-owned farm), and herd size, accounting for the random herd and cow effect (only random herd effect for the variance of cow SCC).
Herd-level SCC variables
Negative binomial mixed models were constructed by considering herd-level SCC variables as dependent variables and herd size, season, and farm type as independent variables, accounting for the random herd effect. Negative binomial mixed models were built using the glmer.nb function in the lme4 package version 1.1–26 (17), and model selection was performed using the backward stepwise method via the Akaike information criterion. Statistical significance was considered when the P-value was < 0.05 in a two-tailed test, and all analyses were performed using R version 4.0.2 (18).
Results
The farms were mostly located in north China, which covers major milk production areas in China.
Descriptive statistics
The overall average number of DHI tests per cow was 6.8 (2.5−97.5% quantile: 3–11), ranging from 5.8 (2.5−97.5% quantile: 3–10) to 7.8 (2.5−97.5% quantile: 3–11) per province. The overall average of daily milk yield per cow was 34.3 kg (2.5−97.5% quantile: 11.0–57.7), ranging from 30.2 (2.5−97.5% quantile: 12.6–51.5) to 38.4 (2.5-97.5% quantile: 10.4–75.4) per province. Detailed milk production data of each farm within each province are given in Table 1. Scatterplot and the corresponding Pearson's correlation coeffciient (r) among herd-level subclinical mastitis-related variables were illustrated in Figure 1.
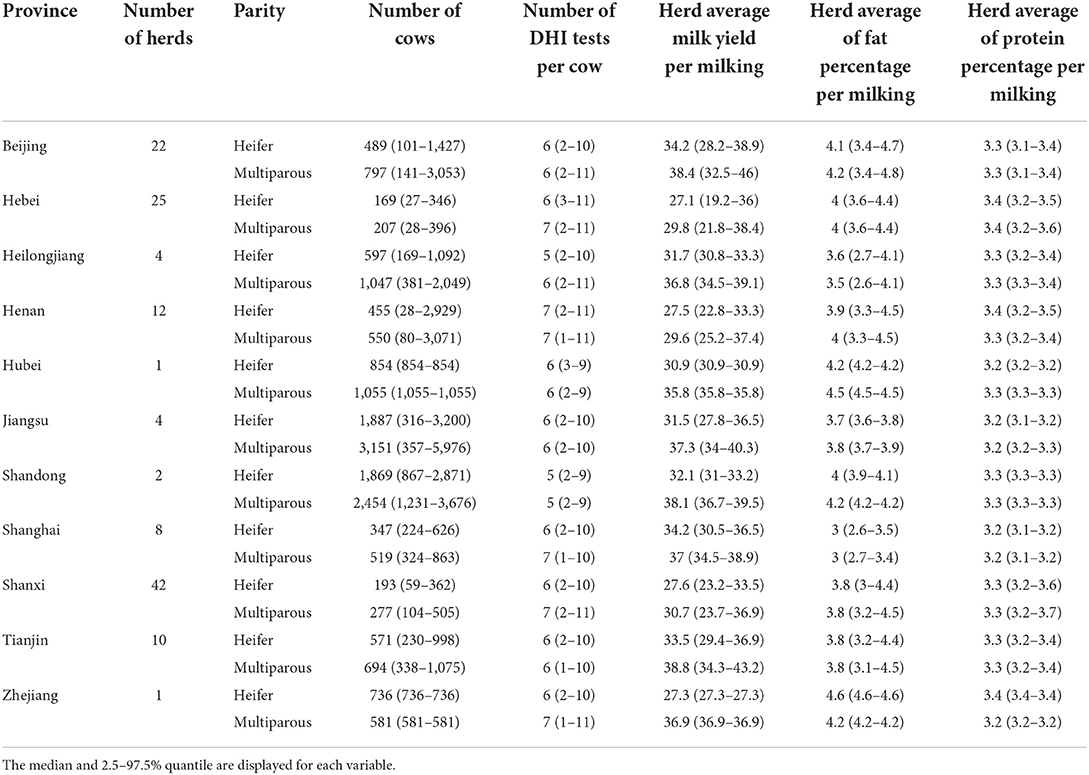
Table 1. Descriptive statistics of the 131 farms in 11 provinces in 2019 in the final dataset.
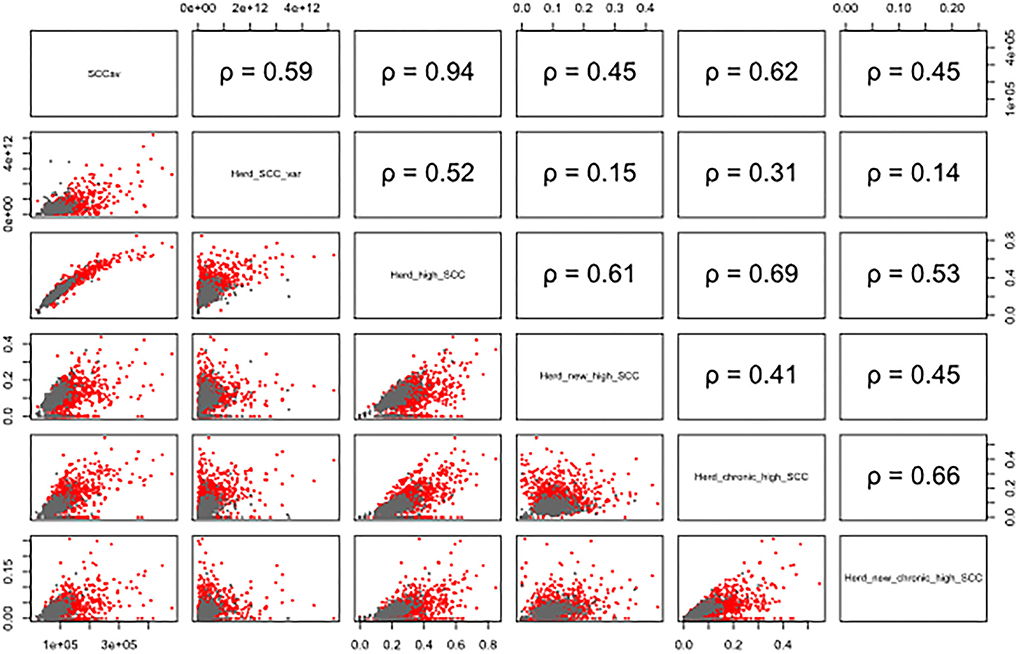
Figure 1. Scatterplot and the corresponding Pearson's correlation coefficient (ρ) among herd-level subclinical mastitis-related variables of the 131 farms in 11 provinces on a monthly basis. The gray points represent data from company-owned large herds, and red points show the data from family-owned small herds. Herd_SCC, monthly herd average of SCC; Herd_SCC_var, monthly variance of SCC within herd; Herd_high_SCC, monthly proportion of high SCC (>200,000 cells/mL); Herd_new_high_SCC, monthly proportion of new high SCC (SCC <200,000 cells/mL in the previous test, while >200,000 cells/mL in the current DHI test); Herd_chronic_high_SCC, monthly proportion of chronic high SCC (>200,000 cells/mL in ≥2 consecutive DHI tests); Herd_new_chronic_high_SCC, monthly proportion of new chronic high SCC (SCC <200,000 cells/mL in previous two consecutive DHI tests, >200,000 cells/mL in the current DHI test, and >200,000 in the following DHI test).
The overall average monthly prevalence of high SCC was 0.26 (2.5–97.5% quantile: 0–0.59), ranging from 0.15 (2.5–97.5% quantile: 0.02–0.30) to 0.31 (2.5–97.5% quantile: 0–0.65) per province; the average prevalence values of high SCC in company-owned large herds and family-owned small herds were 0.21 (2.5−97.5%: 0.06–0.37) and 0.33 (2.5−97.5%: 0.14–0.60), respectively. Heifers exhibited fewer SCC-related variables than multiparous cows. The overall SCCav of all farms was 109.9 (2.5–97.5% quantile: 39.3–271.0), ranging from 61.7 (2.5–97.5% quantile: 40.1–94.9) to 131.6 (2.5–97.5% quantile: 48.2–312.1) per province; the overall average of log10-transformed herd average variance of SCC was 11.4 (2.5–97.5% quantile: 10.0–12.3), ranging from 11.1 (2.5–97.5% quantile: 9.6–12.1) to 11.5 (2.5–97.5% quantile: 10.9–11.9) per province; the overall average of HiSCC was 0.26 (2.5–97.5% quantile: 0–0.59), ranging from 0.15 (2.5–97.5% quantile: 0.02–0.30) to 0.31 (2.5–97.5% quantile: 0–0.65) per province; the overall average of herd average proportion of new high SCC was 0.09 (2.5−97.5% quantile: 0–0.27), ranging from 0.05 (2.5−97.5% quantile: 0–0.10) to 0.12 (2.5−97.5% quantile: 0–0.34) per province; the overall average of herd average proportion of chronic high SCC was 0.09 (2.5–97.5% quantile: 0–0.32), ranging from 0.05 (2.5–97.5% quantile: 0–0.11) to 0.13 (2.5–97.5% quantile: 0–0.40) per province; and the overall average of herd proportion of new chronic high SCC was 0.03 (2.5−97.5% quantile: 0–0.11), ranging from 0.01 (2.5−97.5% quantile: 0–0.03) to 0.04 (2.5−97.5% quantile: 0–0.17) per province. The detailed descriptive statistics of SCC variables are provided in Table 2.
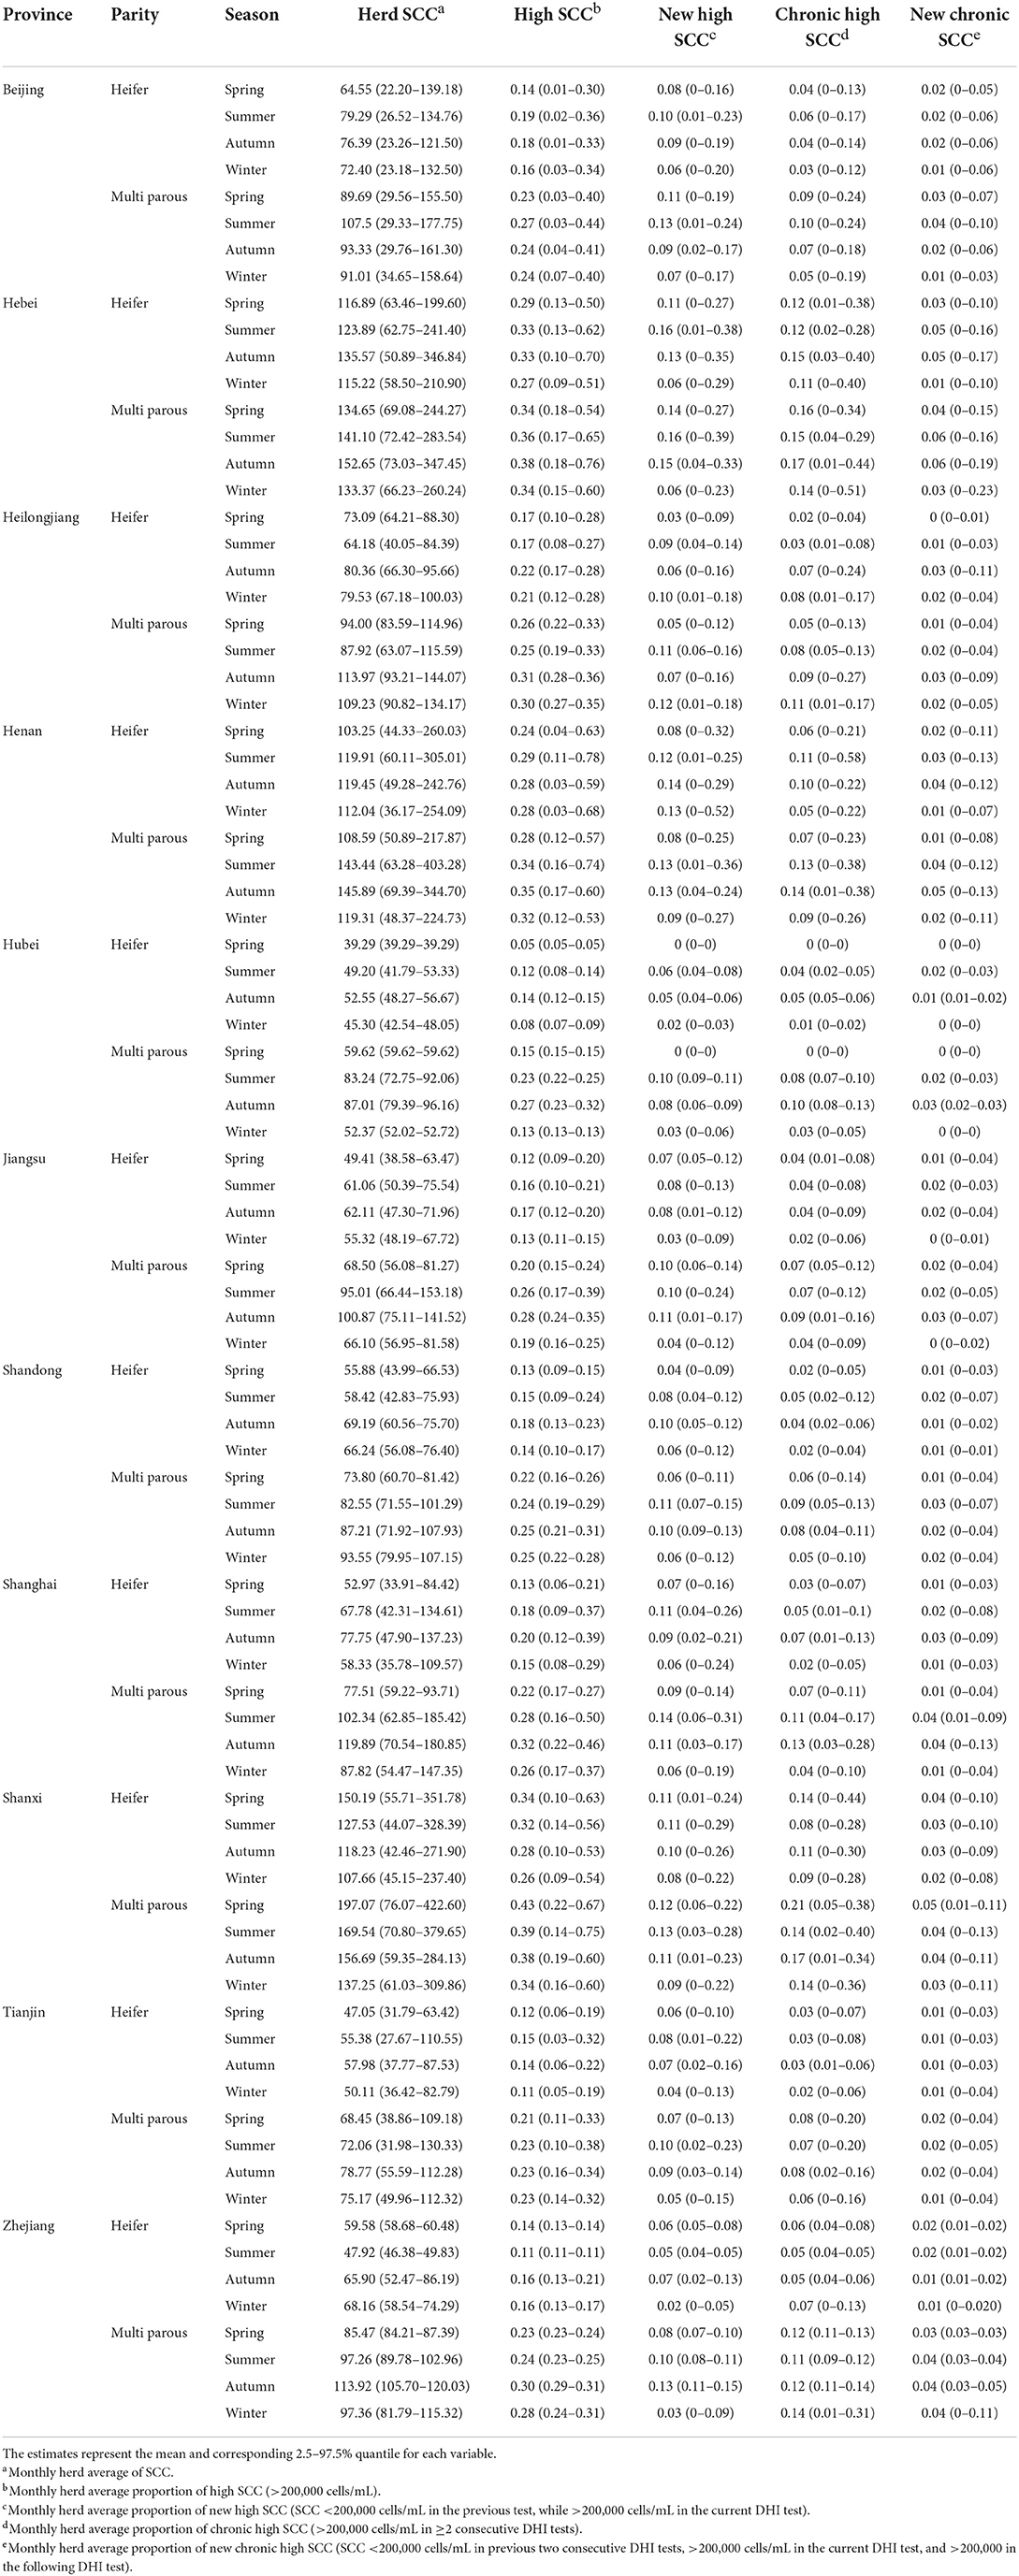
Table 2. Descriptive statistics of herd-level subclinical mastitis-related variables among 131 herds in 11 provinces in 2019.
Factors associated with subclinical mastitis-related variables
Cow-level high SCC risk factors
The number of DHI tests was significantly negatively associated with the log10-transformed cow SCC. Parity was significantly positively associated with the cow SCC. The cow SCC decreased during 41–100 DIM and then increased on the following days as compared with that observed in the first 40 DIM. Season was significantly associated with the cow SCC; summer and autumn were the seasons with a high cow SCC as compared with spring. Variance of cow SCC was positively associated with parity, and cows in company-owned large herds had more stable SCCs than those in family-owned small herds. The estimates of each variable are listed in Table 3.
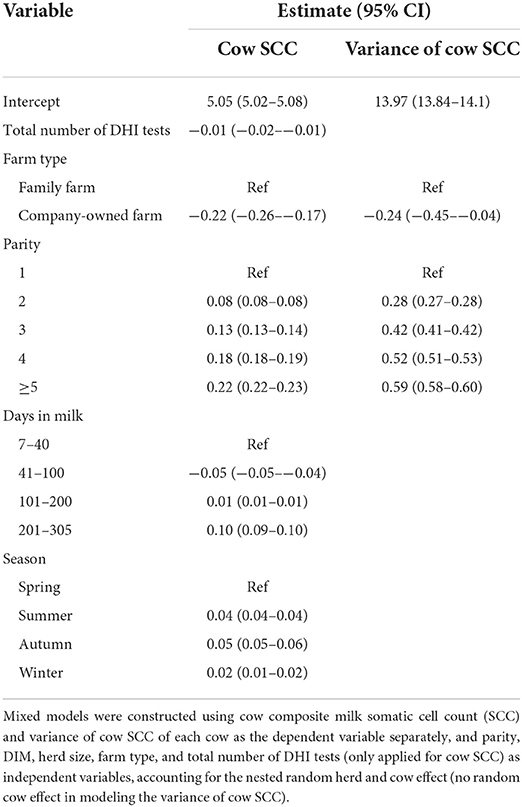
Table 3. Factors associated with cow-level high SCC among 131 herds in 11 provinces.
Herd-level high SCC risk factors
Of the variables included in modeling (farm type, season, and herd size), farm type and season were significantly associated with herd-level SCC variables. Though, company-owned large herds performed better in terms of herd SCC-related variables. Meanwhile, the company-owned large herds were more stable in intramammary infection dynamics than the family-owned small herds, as indicated by new high SCC and variation in SCC. Milk in summer and autumn seasons had a higher SCC than milk in spring and winter. Detailed estimates of each herd-level SCC variables are provided in Table 4.
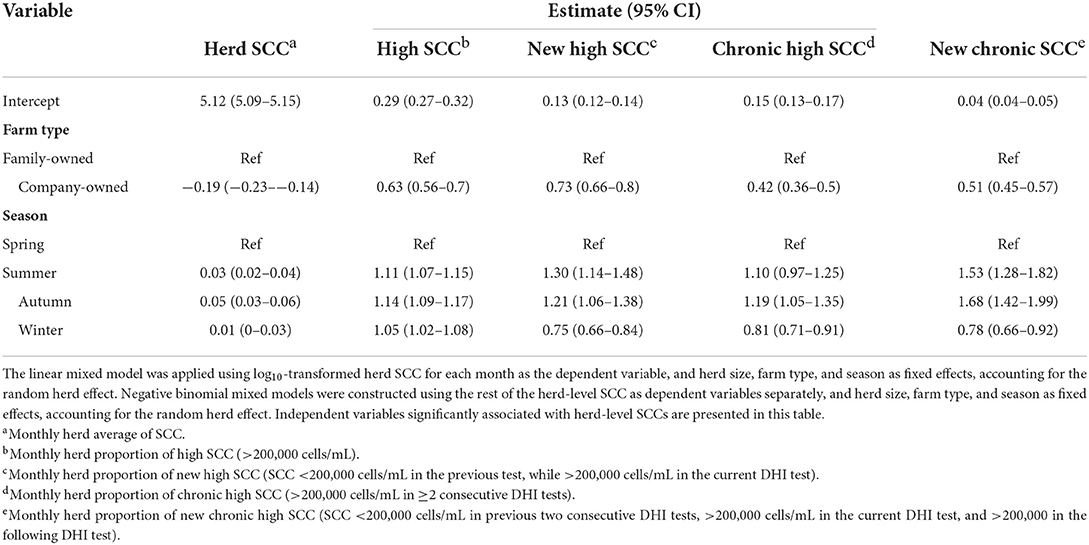
Table 4. Factors associated with herd-level SCC among 131 herds in 11 provinces.
Discussion
Herds were included in this study based on the willingness of the farms and their access to the DHI data. Herds were mostly located in north China. The distribution of herd size was in line with that of the China Dairy Data Report (2020) (10); this indicates that the herd size in our study is representative of the current Chinese dairy herds. However, because the current DHI program provides free laboratory tests for farms, extremely large herds (a herd size with >10,000 cows) were not included in this study, while large herds did not participate in the DHI program possibly due to the cost of milk sampling and the constraints of the testing capacity of the DHI laboratories.
The overall prevalence of high SCC (defined as an SCC in a single DHI test of >200,000 cells/mL) for all farms was 0.26 (2.5−97.5% quantile: 0–0.56), which is lower than 0.34 (19) and 0.54 (20), but it was identical to that (0.26) recorded in another recent study (21). The data from the China Dairy Data Report (2020) also indicate decreasing herd SCCs in recent decades. The prevalence of a high SCC was comparable to that in developed dairy industries (22). The overall proportion of new high SCC was 0.11 (2.5−97.5%: 0–0.27), which was higher than that in developed dairy industries (23, 24). These results suggest that the overall performance of the presumptive subclinical mastitis status in Chinese herds has improved, while efforts are required to further improve the udder health status in Chinese dairy herds.
Factors associated with subclinical mastitis
Udder health was better managed in company-owned large herds than in family-owned small herds, as indicated by the SCC variables. The estimated average cow SCC in large herds was 69,183 cells/mL, which was lower than that in family-owned small herds, 114,815 cells/mL. One possible explanation for this may be that large herds are managed in a modularized way by professionals. In addition, the dynamics of intramammary infections (indicated by the variance of cow SCC, new high SCC, and new chronic high SCC) were less in company-owned large herds than in family-owned small herds. This could possibly be because of dilutive effect of SCC infected cow in a large number of cows. As the proportion of large herds increased to 60% during the last decade (9), udder health management in large herds is gaining importance in China.
Season was significantly associated with cow composite milk SCC: the SCC was highest in summer, followed by autumn, indicating the detrimental effect of heat stress on udder health. Ferreira and De Vries found that high temperature and humidity were positively associated with a decrease in milk production and an increase in the herd SCC (25). The number of dairy farms in recent years in south China, which has higher temperatures and humidity (e.g., Guangdong Province, Hubei Province, Zhejiang Province, and Shanghai), than in north China (e.g., Beijing, Hebei Province, and Heilongjiang Province) is growing. Therefore, in addition to animal welfare considerations, heat stress in these areas should also be considered when designing udder health management programs.
Parity was positively associated with the cow SCC and the variance of cow SCC, indicating that multiparous cows are likely to be more susceptible to intramammary infections (26). The dilutive effect was also detected in our study as the cow SCC was estimated to be the lowest during 40–100 DIM. Cows undergoing more DHI tests tend to have a slightly lower SCC (Table 3), possibly due to a positive effect of active participation in the DHI program for improving udder health.
Outlook and challenges in udder health management in Chinese dairy herds
The current status of high SCC in Chinese dairy herds is, to a moderate extent, comparable to that in developed dairy industries, while efforts are still needed to further reduce the prevalence of subclinical mastitis. However, the establishment of national databases in the DHI data collection that can facilitate data-driven decision-making is still in its early stages of development. We noticed that the DHI data quality remained a concern, and the tools to analyze these on-farm data to produce understandable and easy-to-implement measurements for farms were still lacking. The proportion of discontinuation of participation in DHI tests was relatively high; however, the underlying explanations are unclear.
In our view, as the DHI program is free for dairy farms, the major hurdles of non-participation in the DHI program are the lack of human labor for sample collection and milk sample processing capacity in the DHI laboratories. Therefore, an increase in the processing capacity of the laboratories is needed in addition to the motivation of farms to participate in the DHI program to facilitate data-driven decision-making in subclinical mastitis management.
Conclusion
In this study, we aimed to estimate the prevalence of a high SCC in Chinese dairy herds and to identify the factors associated with it. The prevalence of a high SCC was estimated at 0.26 (2.5–97.5% quantile: 0–0.56). Heterogeneity in udder health was observed among different provinces. Seasons with high temperature and humidity were associated with worse outcomes in high SCC. Company-owned large farms performed better than family-owned small farms in SCC management. Efforts to motivate farms to participate in the DHI program and utilize the DHI data to assist on-farm udder health decision-making are also warranted.
Data availability statement
The original contributions presented in the study are included in the article/supplementary material, further inquiries can be directed to the corresponding author/s.
Ethics statement
Ethical review and approval was not required for the study of animals in accordance with the local legislation and institutional requirements.
Author contributions
ZD, CX, JC, and CM: conceptualization. ZD: methodology, software, formal analysis, investigation, data curation, writing—original draft preparation, and visualization. KW, JC, and CM: resources. ZD, KW, JC, and CM: writing—review and editing. JC and CM: supervision. All authors have read and agreed to the published version of the manuscript.
Acknowledgments
We acknowledge the farms and the DHI testing laboratories for providing the data.
Conflict of interest
The authors declare that the research was conducted in the absence of any commercial or financial relationships that could be construed as a potential conflict of interest.
Publisher's note
All claims expressed in this article are solely those of the authors and do not necessarily represent those of their affiliated organizations, or those of the publisher, the editors and the reviewers. Any product that may be evaluated in this article, or claim that may be made by its manufacturer, is not guaranteed or endorsed by the publisher.
References
1. Bradley AJ. Bovine mastitis: an evolving disease. Vet J. (2002) 164:116–28. doi: 10.1053/tvjl.2002.0724
2. NMC. Laboratory Handbook on Bovine Mastitis. 3rd ed. New Prague, MN: National Mastitis Council (2017).
3. Sørensen LP, Bjerring M, Løvendahl P. Monitoring individual cow udder health in automated milking systems using online somatic cell counts. J Dairy Sci. (2016) 99:608–20. doi: 10.3168/jds.2014-8823
4. Deng Z, Hogeveen H, Lam TJGM, van der Tol R, Koop G. Performance of online somatic cell count estimation in automatic milking systems. Front Vet Sci. (2020) 7:221. doi: 10.3389/fvets.2020.00221
5. Schukken Y, Wilson D, Welcome F, Garrison-tikofsky L. Monitoring udder health and milk quality using somatic cell counts. Vest Res. (2003) 34:579–96. doi: 10.1051/vetres:2003028
6. Lukas JM, Hawkins DM, Kinsel ML, Reneau JK. Bulk tank somatic cell counts analyzed by statistical process control tools to identify and monitor subclinical mastitis incidence. J Dairy Sci. (2005) 88:3944–52. doi: 10.3168/jds.S0022-0302(05)73080-0
7. Lievaart JJ, Kremer WDJ, Barkema HW. Short communication: comparison of bulk milk, yield-corrected, and average somatic cell counts as parameters to summarize the subclinical mastitis situation in a dairy herd. J Dairy Sci. (2007) 90:4145–8. doi: 10.3168/jds.2006-871
8. Torres AH, Rajala-Schultz PJ, DeGraves FJ, Hoblet KH. Using dairy herd improvement records and clinical mastitis history to identify subclinical mastitis infections at dry-off. J Dairy Res. (2008) 75:240–7. doi: 10.1017/S0022029908003257
9. PwC. The ongonig modernisation of China's dairy sector. (2020). Available online at: https://www.pwccn.com/en/food-supply/publications/modernization-of-china-dairy-industry.pdf (accessed June 22, 2022).
11. Steeneveld W, Hogeveen H. Characterization of Dutch dairy farms using sensor systems for cow management. J Dairy Sci. (2015) 98:709–17. doi: 10.3168/jds.2014-8595
12. Damm M, Holm C, Blaabjerg M, Bro MN, Schwarz D. Differential somatic cell count—a novel method for routine mastitis screening in the frame of Dairy Herd Improvement testing programs. J Dairy Sci. (2017) 100:4926–40. doi: 10.3168/jds.2016-12409
13. Aghamohammadi M, Haine D, Kelton DF, Barkema HW, Hogeveen H, Keefe GP, et al. Herd-level mastitis-associated costs on Canadian dairy farms. Front Vet Sci. (2018) 5:100. doi: 10.3389/fvets.2018.00100
14. Gao J, Barkema HW, Zhang L, Liu G, Deng Z, Cai L, et al. Incidence of clinical mastitis and distribution of pathogens on large Chinese dairy farms. J Dairy Sci. (2017) 100:4797–806. doi: 10.3168/jds.2016-12334
15. Bi Y, Wang YJ, Qin Y, Vallverdú RG, García JM, Sun W, et al. Prevalence of bovine mastitis pathogens in bulk tank milk in China. PLoS ONE. (2016) 11:e0155621. doi: 10.1371/journal.pone.0155621
16. Foss. Fossomatic TM FC somatic cell counting for raw milk testing. (2017). Available online at: https://www.fossanalytics.com/-/media/files/documents/brochuresanddatasheets/products/fossomatic-7/fossomatic-7-and-fossomatic-7-dc_solution_brochure_gb.pdf (accessed June 22, 2022).
17. Bates D, Mächler M, Bolker BM, Walker SC. Fitting linear mixed-effects models using lme4. J Stat Softw. (2015) 67:1–48. doi: 10.18637/jss.v067.i01
18. R Core Team,. R: A language environment for statistical computing. (2020). Available online at: https://www.r-project.org/ (accessed December 10, 2021).
19. Chen YY, Yang ZT, Liu WB, Chang QC, Wang LG, Zhang NS. Prevalence and major pathogen causes of dairy cows subclinical mastitis in Northeast China. J Anim Vet Adv. (2012) 11:1278–80. doi: 10.3923/javaa.2012.1278.1280
20. Li JP, Zhou HJ, Yuan L, He T, Hu SH. Prevalence, genetic diversity, and antimicrobial susceptibility profiles of Staphylococcus aureus isolated from bovine mastitis in Zhejiang Province, China. J Zhejiang Univ Sci B. (2009) 10:753–60. doi: 10.1631/jzus.B0920072
21. Wang L, Yang F, Wei XJ, Luo YJ, Guo WZ, Zhou XZ, et al. Prevalence and risk factors of subclinical mastitis in lactating cows in Northwest China. Isr J Vet Med. (2019) 74:17–22. Available online at: https://www.ivis.org/library/israel-journal-of-veterinary-medicine/israel-journal-of-veterinarymedicine-vol-741-mar-3
22. Borne BHP Van Den, Schaik G Van, Lam TJGM, Nielen M. Variation in herd level mastitis indicators between primi- and multiparae in Dutch dairy herds. Prev Vet Med. (2010) 96:49–55. doi: 10.1016/j.prevetmed.2010.05.010
23. Mohd Nor N, Steeneveld W, Hogeveen H. The average culling rate of Dutch dairy herds over the years 2007 to 2010 and its association with herd reproduction, performance and health. J Dairy Res. (2014) 81:1–8. doi: 10.1017/S0022029913000460
24. Nickerson SC, Kautz FM, Ely LO, Rowson AD, Hurley DJ, Chapman JD, et al. Effects of an immunomodulatory feed additive on intramammary infection prevalence and somatic cell counts in a dairy herd experiencing major health issues. Res Vet Sci. (2019) 124:186–90. doi: 10.1016/j.rvsc.2019.03.013
25. Ferreira FC, De Vries A. Effects of season and herd milk volume on somatic cell counts of Florida dairy farms. J Dairy Sci. (2015) 98:4182–97. doi: 10.3168/jds.2014-8695
26. Taponen S, Liski E, Heikkilä AM, Pyörälä S. Factors associated with intramammary infection in dairy cows caused by coagulase-negative staphylococci, Staphylococcus aureus, Streptococcus uberis, Streptococcus dysgalactiae, Corynebacterium bovis, or Escherichia coli. J Dairy Sci. (2017) 100:493–503. doi: 10.3168/jds.2016-11465
Keywords: subclinical mastitis, risk factors, dairy herd improvement, somatic cell count, prevalence
Citation: Deng Z, Wang K, Xu C, Cao J and Ma C (2022) Prevalence and risk factors associated with high somatic cell count in Chinese dairy herds. Front. Vet. Sci. 9:967275. doi: 10.3389/fvets.2022.967275
Received: 12 June 2022; Accepted: 30 August 2022;
Published: 02 November 2022.
Edited by:
Massimo Amadori, Italian Network of Veterinary Immunology, ItalyCopyright © 2022 Deng, Wang, Xu, Cao and Ma. This is an open-access article distributed under the terms of the Creative Commons Attribution License (CC BY). The use, distribution or reproduction in other forums is permitted, provided the original author(s) and the copyright owner(s) are credited and that the original publication in this journal is cited, in accordance with accepted academic practice. No use, distribution or reproduction is permitted which does not comply with these terms.
*Correspondence: Chong Ma, bWFjaF9jYXVAY2F1LmVkdS5jbg==; Jie Cao, Y2FvamllMDEwQDE2My5jb20=