 Xiaohu Su
 Guangqi Gao
 Liqiang Chen1
- 1State Key Laboratory of Reproductive Regulation and Breeding of Grassland Livestock, School of Life Sciences, Inner Mongolia University, Hohhot, Inner Mongolia Autonomous Region, China
- 2Key Laboratory of Dairy Products Processing, Ministry of Agriculture and Rural Affairs, Inner Mongolia Agricultural University, Hohhot, Inner Mongolia Autonomous Region, China
- 3Ulanqab Animal Husbandry Workstation, Ulanqab Agriculture and Animal Husbandry Bureau, Ulanqab, Inner Mongolia Autonomous Region, China
- 4Tumor Radiotherapy Department, Inner Mongolia People’s Hospital, Hohhot, Inner Mongolia Autonomous Region, China
Superovulation and embryo transfer technologies provide strong support for improving the productivity of cattle population. A non-invasive diagnostic method for superovulation prediction is necessary to improve its efficiency. Compared to macromolecular substances, there has been an increasing number of studies on small molecular metabolites as biomarkers. This study aimed to identify key biomarkers associated with superovulation outcomes in cows through serum metabolomics analysis. In this study, 36 induced estrus cows were selected, and the blood samples were collected at three time points: before FSH injection, before artificial insemination, and before embryo collection. Then, the cows were classified into high embryonic yield (HEY) and low embryonic yield (LEY) groups based on the total number of embryos. Furthermore, a serum untargeted metabolomics analysis of the two groups was conducted using liquid chromatography with tandem mass spectrometry (LC–MS/MS). A total of 372 embryos were collected. The metabolomics analysis revealed that 1,158 metabolites were detected, and 617 were annotated. In the before FSH injection samples, 121 differential metabolites were identified between the two groups. In the before artificial insemination samples, 129 differential metabolites were identified. In the before embryo collection samples, 201 differential metabolites were identified. A total of 11 differential metabolites were shared between the before FSH injection and before artificial insemination samples, while five differential metabolites were shared across all three samples. The majority of the differential metabolites were significantly enriched in pathways related to amino acid and fatty acid metabolism, digestive system secretion, and ovarian steroidogenesis. This study showed that phosphatidylcholine [PC; 14:0/22:1(13Z)], phosphatidylethanolamine [PE; DiMe (11, 3)], triacylglycerol [TG; 15:0/16:0/22:4 (7Z, 10Z, 13Z, 16Z)], phosphatidylinositol [PI; 16:0/22:2 (13Z, 16Z)], and phosphatidylserine [PS; 18:0/20:4(8Z, 11Z, 14Z, 17Z)] were differentially expressed in the serum during the superovulation period. These could serve as potential biomarkers for embryonic yield prediction in bovine superovulation. The lipid and amino acid metabolic pathways may have an impact on the ovarian response. The results of this study could provide novel screening indexes of donors for bovine superovulation, although the accuracy of the relevant factors requires further investigation.
Introduction
The cattle industry is an important part of animal husbandry. Superovulation and embryo transfer technologies provide powerful support for improving the productivity of cattle population. However, the efficiency of bovine superovulation is affected by multiple factors, including genetics, age, body condition, diseases, and management, likely through their influence on the uterine environment, oocyte quality, and embryo development (1). To improve the screening efficiency of donors for bovine superovulation, several strategies have been established, including small follicle detection by ultrasound (2), genotype analysis (3–5), reproductive hormone detection (AMH, P4, E2, and FSH) (6–13), blood vitamin levels (14), paraoxonase-1 (15), serum biochemical parameters (16), and partial metabolic parameters (17, 18). However, the ovarian antral follicle count does not have a linear correlation with the outcome of embryo production (19). The prediction efficiency of reproductive hormone levels varies with age (11). In addition, the detection time is also important. Compared to macromolecular substances, there have been an increasing number of studies on small molecule metabolites as biomarkers.
Metabolites are the end products of various biochemical reactions in cells. Their composition and activity are influenced by both internal and external factors. Many studies have been conducted on the metabolome and bovine reproduction, including reproductive performance (17, 18, 20), pregnancy prediction (21–24), and reproductive disorders (1, 25–27). In the research by Horn et al., the preovulatory serum metabolome was analyzed in cows with different body condition scores to explain the mechanisms by which extreme body conditions affect reproductive capacity (18). However, more studies are necessary to identify reliable metabolic biomarkers related to bovine superovulation and to more comprehensively reveal the regulatory mechanisms, as metabolites are affected by many factors.
In this study, differences in serum reproductive hormones and metabolites between high embryonic yield (HEY) and low embryonic yield (LEY) HuaXi cows were analyzed during the superovulation period to identify key biomarkers related to superovulation outcomes. The study results may provide novel screening indexes of donors for bovine superovulation.
Results
Embryo production
In this study, 36 cows were selected and treated using the standard superovulation process (Figure 1). The results are shown in Table 1. A total of 372 embryos were collected, with an average of 10.33 ± 1.25 embryos per cow. Of these, 286 embryos were viable, with an average of 7.94 ± 1.16 embryos per cow. Finally, 11 cows were assigned to the HEY group, while 9 cows were assigned to the LEY group.
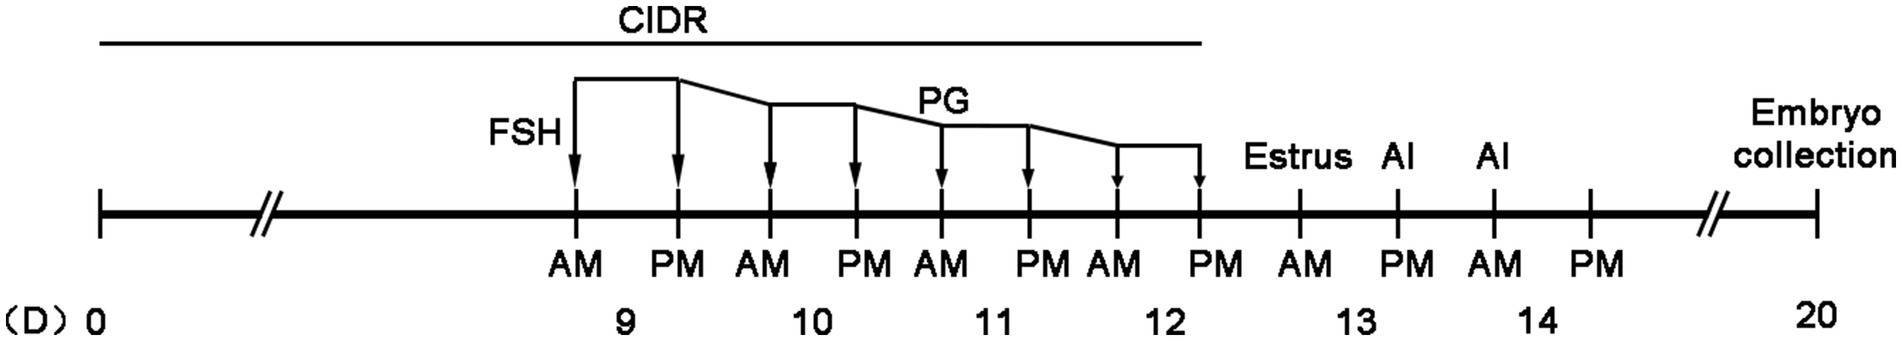
Figure 1. CIDR (Zoetis, New Zealand) was inserted into the vagina on day 0 (D0). Between days 9 and 12, a total of 500 μg of FSH (Stimufol®, Belgium) was injected in eight doses, with each dose decreasing by 10%. On the fifth FSH injection (morning of D11), 300 μg of PG (Reprobiol, New Zealand) was injected synchronously. The CIDR was removed at the time of the final FSH injection. Estrus detection occurred on D13, and AI was performed twice (12 h interval). On D20, embryos were collected via uterus flushing after the cows were anesthetized with a caudal spinal injection of lidocaine hydrochloride.

Table 1. Statistics of embryonic production after superovulation in cows (mean ± S.D.).
Untargeted metabolic profiling of the cows’ serum during superovulation
To explore the serum metabolic differences between HEY and LEY groups, untargeted metabolomics analysis was performed. In total, 13,222 features were detected, of which 5,654 metabolites were annotated (Supplementary Table S1). According to the Human Metabolome Database (HMDB) analysis, the most enriched category was lipids and lipid-like molecules (353 metabolites), followed by organic acids and derivatives (75 metabolites) and benzenoids (69 metabolites; Supplementary Figure S1A). According to the Kyoto Encyclopedia of Genes and Genomes (KEGG) analysis, the most enriched pathway was metabolic pathways (206 metabolites), followed by glycerophospholipid metabolism (135 metabolites) and the biosynthesis of secondary metabolites (75 metabolites; Supplementary Figure S1B).
Multivariate statistical analysis
Principal component analysis (PCA) was conducted to determine the separation and aggregation of samples between HEY and LEY groups. The first principal component (PC1) and the second principal component (PC2) were 12.3 and 8.2%, respectively (Figure 2A). Orthogonal partial least squares discriminant analysis (OPLS-DA) was performed to further investigate the variables responsible for classification and to achieve better group separation. For the before FSH injection samples, the R2 of the OPLS-DA model was 0.996 and the Q2 was 0.736 (Figure 2B). In the before artificial insemination samples, the R2 and Q2 were 0.996 and 0.796, respectively (Figure 2C). In the before embryo collection samples, the R2 and Q2 were 0.988 and 0.553, respectively (Figure 2D). The results showed that serum metabolites could be used to distinguish between the two groups.
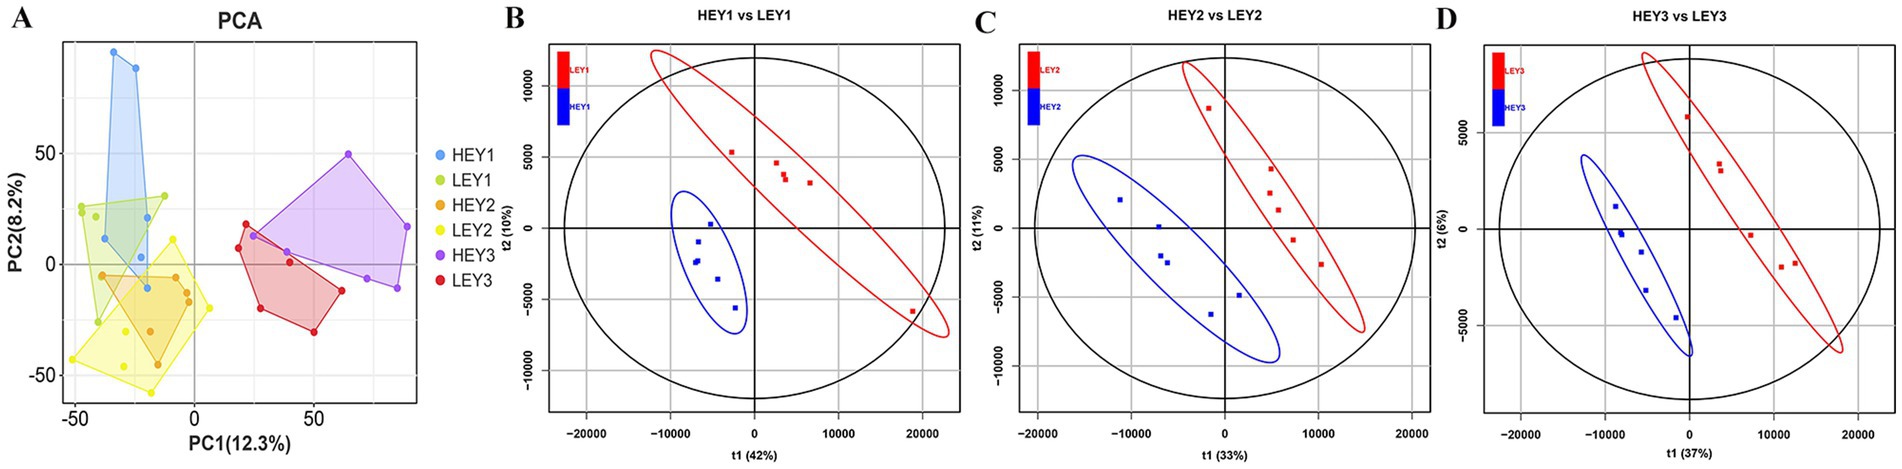
Figure 2. Multivariate statistical analysis results of the metabolome. (A) PCA results. B–D: OPLS-DA results from three sampling time points: (B) before FSH injection; (C) before artificial insemination; and (D) before embryo collection. HEY1: High embryonic yield group at the sampling before FSH injection. LEY1: Low embryonic yield group at the sampling before FSH injection. HEY2: High embryonic yield group at the sampling before artificial insemination. LEY2: Low embryonic yield group at the sampling before artificial insemination. HEY3: High embryonic yield group at the sampling before embryo collection. LEY3: Low embryonic yield group at the sampling before embryo collection.
Identification of differential metabolites
The liquid chromatography with tandem mass spectrometry (LC–MS/MS) data were used to analyze the metabolites of different substances. Differential metabolites were screened based on the following criteria: VIP ≥ 1, FC > 1.2 or < 0.83, and p ≤ 0.05. A comprehensive statistical analysis was performed.
In the before FSH injection samples, 121 differential metabolites were identified, of which 23 were upregulated in the HEY group and 98 were upregulated in the LEY group (Figure 3A; Supplementary Table S2). In the before artificial insemination samples, 129 differential metabolites were identified, of which 28 were upregulated in the HEY group and 101 were upregulated in the LEY group (Figure 3B; Supplementary Table S3). In the before embryo collection samples, 201 differential metabolites were identified, of which 53 were upregulated in the HEY group and 148 were upregulated in the LEY group (Figure 3C; Supplementary Table S4).
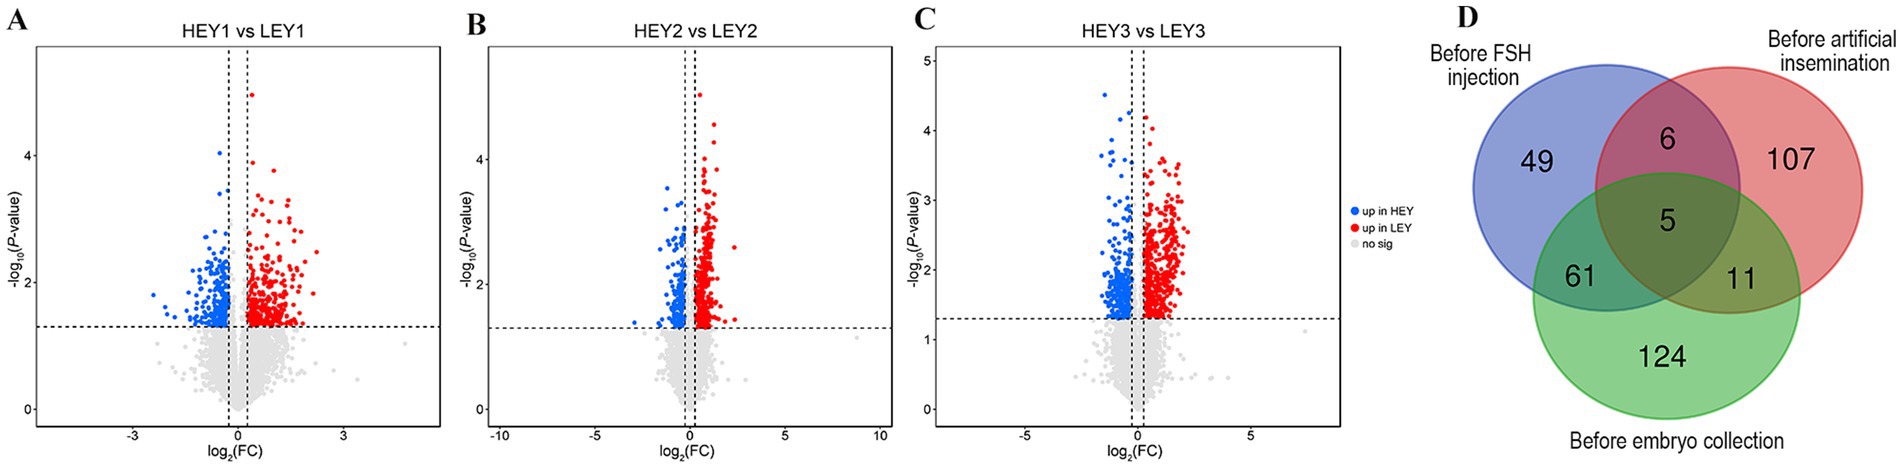
Figure 3. Differential metabolite analysis results. (A–C) Volcano plots for three sampling time points: (A) Before FSH injection; (B) before artificial insemination; and (C) before embryo collection. (D) Venn diagram of the differential metabolites across three sampling time points. HEY1: High embryonic yield group at the sampling before FSH injection. LEY1: Low embryonic yield group at the sampling before FSH injection. HEY2: High embryonic yield group at the sampling before artificial insemination. LEY2: Low embryonic yield group at the sampling before artificial insemination. HEY3: High embryonic yield group at the sampling before embryo collection. LEY3: Low embryonic yield group at the sampling before embryo collection.
Among the differential metabolites at three sampling time points, there were 11, 16, and 66 shared differential metabolites between the before FSH injection and before artificial insemination samples, the before artificial insemination and before embryo collection samples, and the before FSH injection and before embryo collection samples, respectively (Figure. 3D; Supplementary Tables S5–S7). In addition, five shared differential metabolites were identified across all three sampling time points. Among them, phosphatidylcholine [PC; 14:0/22:1(13Z)] was upregulated in the HEY group, while phosphatidylethanolamine [PE; DiMe (11, 3)], triacylglycerol [TG; 15:0/16:0/22:4 (7Z, 10Z, 13Z, 16Z)], phosphatidylinositol [PI; 16:0/22:2 (13Z, 16Z)], and phosphatidylserine [PS; 18:0/20:4(8Z, 11Z, 14Z, 17Z)] were upregulated in the LEY group at all three time points (Figure 3D; Table 2).
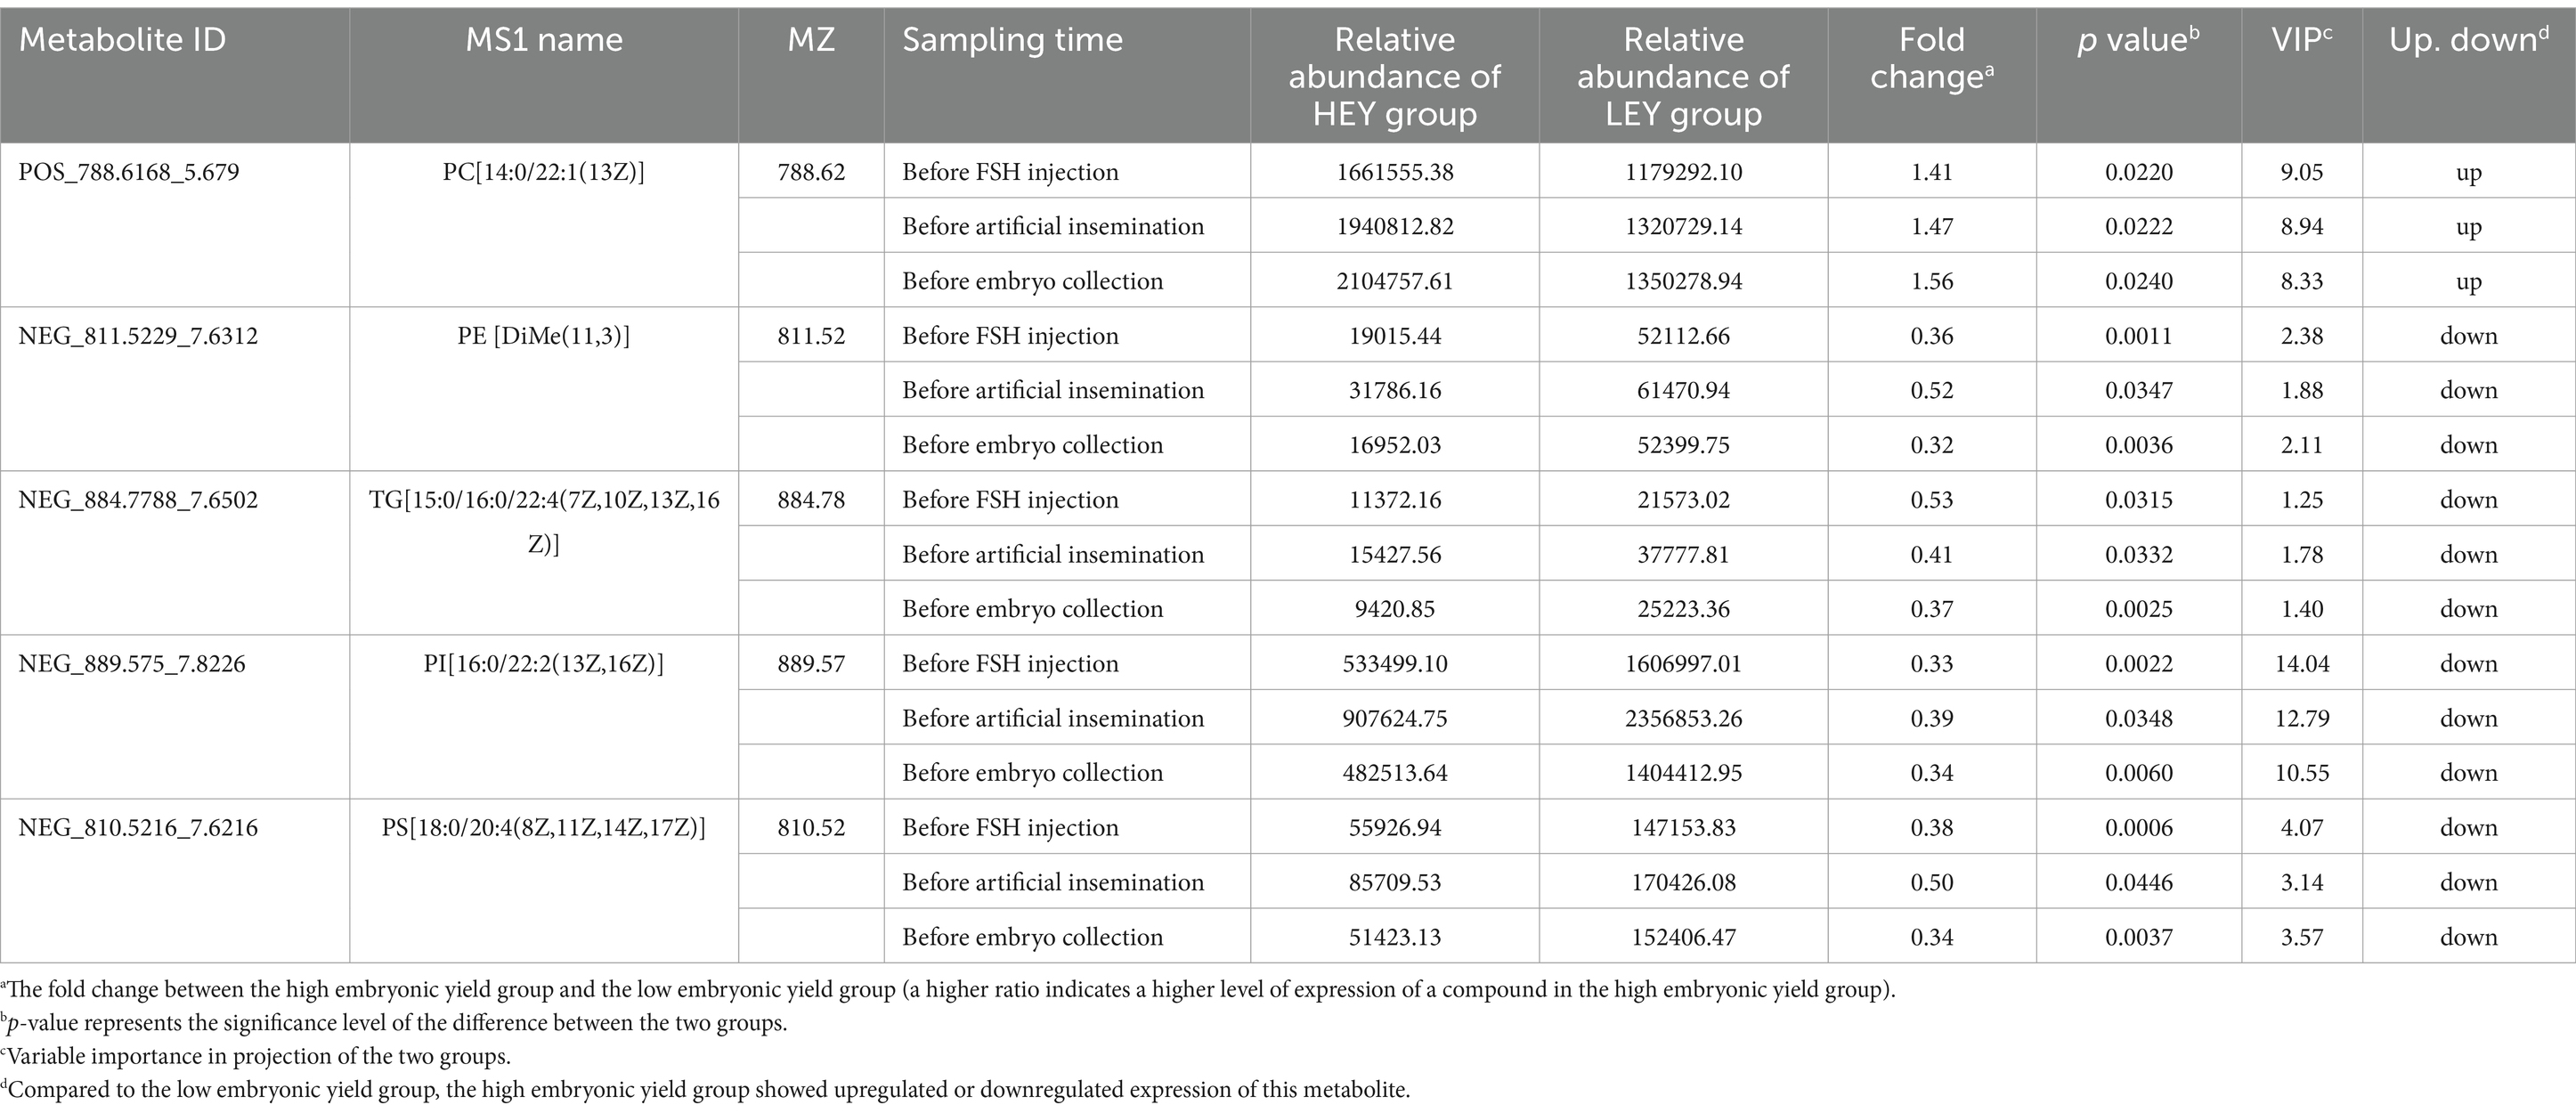
Table 2. Shared differential metabolites across three sampling time points.
Functional enrichment of the differential metabolites
The functional enrichment of differential metabolites was performed following the method described by Kanehisa et al. (28). The results showed that 21 pathways were enriched in the before FSH injection samples. Among these, nine pathways were significantly enriched, including inositol phosphate metabolism, phosphatidylinositol signaling system, and glycosylphosphatidylinositol (GPI)-anchored biosynthesis, among others (Figure 4A). A total of 24 pathways were enriched in the before artificial insemination samples. Among these, three pathways were significantly enriched, including fatty acid biosynthesis, phototransduction–fly, and shigellosis (Figure 4B). A total of 24 pathways were enriched in the before embryo collection samples. Among these, 13 pathways were significantly enriched, including inositol phosphate metabolism, fat digestion and absorption, and regulation of lipolysis in adipocytes, among others (Figure 4C).
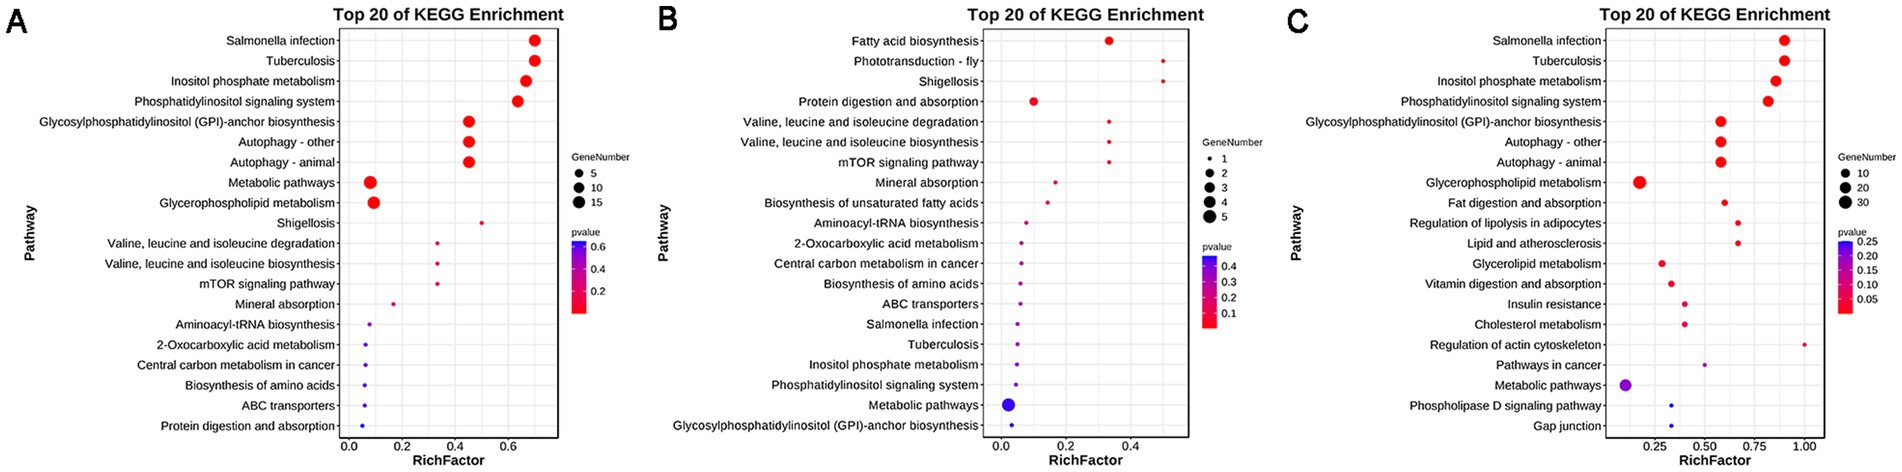
Figure 4. KEGG enrichment results of differential metabolites. (A) Before FSH injection; (B) before artificial insemination; (C) before embryo collection.
Discussion
In bovine superovulation, the physiological status of the donor plays an important role in the outcome. Metabolites in the blood can reflect the physiological status of the body (29). Here, we found that there were distinct serum metabolites between bovine donors with different embryo yields at the time points before FSH injection, before artificial insemination, and before embryo collection. Phosphatidylcholine [PC; 14:0/22:1(13Z)], phosphatidylethanolamine [PE; DiMe (11, 3)], triacylglycerol [TG; 15:0/16:0/22:4 (7Z, 10Z, 13Z, 16Z)], phosphatidylinositol [PI; 16:0/22:2 (13Z, 16Z)], and phosphatidylserine [PS; 18:0/20:4(8Z, 11Z, 14Z, 17Z)] were the shared differential metabolites. The functions of these differential metabolites include fatty acid and protein metabolism and GPI-anchor biosynthesis, among others.
Several studies have shown that lipids present in follicular fluid are associated with the development of oocyte, and the concentration of lipids in the blood can reflect the concentration of follicular fluid. Furthermore, obesity is associated with irregular reproductive cycles. In obese horses, oocytes had lower concentrations of lipids consistent with PC and PE, while lipids consistent with TG tended to be higher (30). In patients with polycystic ovary syndrome, lipid profiling of follicular fluid showed differences in PC, PS, PI, and PE, strongly suggesting that these lipids may serve as biomarkers for pregnancy outcomes (31). In a study comparing human lipid profiles of follicular fluid between young poor ovarian responders and normal responders, lipids related to PC, PE, and PI were differentially expressed. These lipids may be involved in hormonal responses and oocyte development processes (32). PE, a glycerophospholipid, plays a role in the biosynthesis of PC (33). In this study, PE-NMe(11D3/11D3) was identified as a differential metabolite and may serve as a biomarker for the ovarian response during bovine ovulation.
A study on PC in bovine follicular fluid found variations during superovulation and estrous synchronization treatments, indicating that superovulation could increase the phospholipid content in follicular fluid (34). Additionally, a human superovulation study showed that some PC-related lipids in follicular fluid had higher concentrations in the successful group (32). In an ovine superovulation study, we found that certain PC-related metabolites in donor serum were significantly different between HEY and LEY populations (35). In this study, we found that PC [14:0/22:1(13Z)] was significantly higher in the HEY group than in the LEY group at all three time points. PC [14:0/22:1(13Z)] is a glycerophospholipid in which a PC moiety occupies the glycerol substitution site. Phospholipids are ubiquitous in nature and are key components of the lipid bilayer in cells. They also play crucial roles in metabolism and signaling (36). Taken together, PC [14:0/22:1(13Z)] may serve as a serum biomarker for bovine superovulation.
Lipid metabolism provides the energy source during oocyte maturation. Lipids in oocytes are primarily triglycerides composed of specific fatty acids, which differ by species (37). In cumulus–oocyte complexes (COCs), TG are metabolized by lipases and through β-oxidation in mitochondria for ATP production (37). In dairy cows, follicular fluid TG levels were lower than those in serum, but there was a significant correlation between the two (38). In humans, studies have indicated that the majority of serum metabolites, including TG, are also present in follicular fluid, albeit at reduced levels (39). In adult zebrafish, high blood TG levels had negative effects on their offspring (40). Interestingly, Calonge et al. (41) found that the lipid profiles in follicular fluid and plasma inversely and significantly influenced ovarian response and the number of matured oocytes recovered. In this study, we found that TG composition [15:0/16:0/22:4(7Z,10Z,13Z,16Z)] was higher in the LEY group comparted to the HEY group. This suggests that excessively high blood TG levels affect the ovarian response during bovine superovulation.
PI could help maintain the low activity levels of the Hippo pathway (42). Emerging studies have discovered that the Hippo pathway plays an important role in regulating ovarian physiology and fertility (43). The process of oocyte maturation depends on follicle development. Previous studies have demonstrated that the Hippo pathway regulates the activation and growth of follicles (44–47). Related research has suggested that the upstream Hippo component, SAV1/MST1/2, contributes to the suppression of ovarian granulosa cell proliferation, while the Hippo effector YAP1 is essential for the proliferation of these granulosa cells (48). In summary, the serum metabolites related to PI may regulate follicle development through the Hippo pathway. In this study, we found that the level of PI [16:0/22:2 (13Z, 16Z)] was significantly higher in the HEY group than in the LEY group at all three sampling time points. This finding may be associated with the outcome of embryo production.
Conclusion
Serum metabolomics analysis provides a feasible approach to explore the predictors of superovulation in bovine. This study showed that PC [14:0/22:1(13Z)], PE [DiMe (11, 3)], TG [15:0/16:0/22:4 (7Z, 10Z, 13Z, 16Z)], PI [16:0/22:2 (13Z, 16Z)], and PS [18:0/20:4(8Z, 11Z, 14Z, 17Z)] were differentially expressed in the serum during the superovulation period. These could serve as potential biomarkers for embryonic yield prediction in bovine superovulation. The lipid and amino acid metabolic pathways may have an impact on the ovarian response. The study results may provide novel screening indexes of donors for bovine superovulation, although the accuracy of the relevant factors requires further investigation.
Methods
Experimental location and cows’ management
This study was conducted at the Livestock Experimental Base of Inner Mongolia University in Hohhot (Inner Mongolia, China). This region has a tropical mid-temperate, semi-arid continental monsoon climate, characterized by long dry winters and short rainy summers.
A total of 36 sexually mature and clinically healthy Huaxi cows, aged 2 to 4 years, were used in this study. The cows’ diet was designed to meet their nutritional needs, with unified management during feeding in the barn. The cows were fed a total mixed ration consisting of 15.00% alfalfa hay, 50.00% whole corn silage, and 35.00% cow concentrate supplement, resulting in a forage-to-concentrate ratio of 65:35.
Superovulation protocols
The cows were treated as follows (Figure 1): A CIDR (Zoetis, New Zealand) was inserted into the vagina on day 0 (D0). Between days 9 and 12, a total of 500 μg of FSH (Stimufol®, Belgium) was injected in eight doses, with each dose decreasing by 10%. On the fifth FSH injection (morning of D11), 300 μg of PG (Reprobiol, New Zealand) was injected synchronously. The CIDR was removed at the time of the final FSH injection. Estrus detection occurred on D13, and artificial insemination (AI) was performed twice (12 h interval). On D20, embryos were collected via uterus flushing after the cows were anesthetized with a caudal spinal injection of lidocaine hydrochloride.
Blood sampling
Blood samples were collected in the mornings on D9, before FSH injection; on D13, before artificial insemination; and on D20, before embryo collection. The samples were collected in vacuum blood collection tubes. Then, the samples were centrifuged at 10000 × g for 10 min to obtain the serum. All serum samples were stored in liquid nitrogen until further use.
LC–MS/MS measurements for serum metabolomics
Based on the total embryonic yield, the cows with ≥ 13 embryos were classified into the high embryonic yield (HEY) group, and the cows with ≤ 5 embryos were classified into the low embryonic yield (LEY) group. Six cows from each group (n = 6) were selected for serum metabolomics analysis. The LC–MS/MS-based serum metabolomics analysis was performed by LC-Bio Co. Ltd. (Hangzhou, China), following the methodology described by Xu et al. (35).
Briefly, the serum samples were purified with methanol and diluted in LC–MS grade water. UHPLC–MS/MS analyses were performed using a Vanquish UHPLC system (Thermo Fisher Scientific, Germany) coupled with an Orbitrap Q ExactiveTM HF mass spectrometer (Thermo Fisher Scientific, Germany). The solvent gradient was set as follows: 2% B, 1.5 min; 2–85% B, 3 min; 100% B, 10 min; 100–2% B, 10.1 min; and 2% B, 12 min. The Q ExactiveTM HF mass spectrometer was operated in both positive and negative polarity modes, with a spray voltage of 3.5 kV, a capillary temperature of 320°C, a sheath gas flow rate of 35 psi, an auxiliary gas flow rate of 10 L/min, an S-lens RF level of 60, and an auxiliary gas heater temperature of 350°C.
Data processing and metabolite identification
Briefly, raw data files generated through UHPLC–MS/MS were processed using Compound Discoverer 3.1 (CD3.1, Thermo Fisher Scientific, Germany). Then, the peaks were matched with mzCloud,1 mzVault, and MassList databases to obtain accurate qualitative and relative quantitative results. Statistical analyses were performed using R statistical software (version R-3.4.3), Python (Python 2.7.6 version), and CentOS (CentOS release 6.6).
Data analysis
The Kyoto Encyclopedia of Genes and Genomes (KEGG),2 the LIPID MAPS (Lipidmaps),3 and the Human Metabolome Database (HMDB)4 were used to annotate the biological functions of the metabolites. Bioinformatic analysis was performed using R software (v.4.0.2) or the OmicStudio tools available at https://www.omicstudio.cn/tool. The metabolism data were statistically analyzed using the two-sided Wilcoxon rank sum test and finally visualized using the ggpubr package (version 0.6.0). The metabolites with a variable importance in projection (VIP) > 1, a p-value < 0.05, and a fold change (FC) ≥ 1.2 or ≤ 0.83 were considered differential metabolites. Volcano plots were used to filter the metabolites of interest based on log2(FoldChange) and -log10(p-value) of metabolites using ggplot2 in R language. A Venn diagram of the differential metabolites was created at http://bioinformatics.psb.ugent.be/webtools/Venn/. The functions of differential metabolites were analyzed using the KEGG database.
Data availability statement
The original contributions presented in the study are publicly available. This data can be found here: https://db.cngb.org/search/project/CNP0006676/.
Ethics statement
The animal study was approved by Inner Mongolia University Research Ethics Committee. The study was conducted in accordance with the local legislation and institutional requirements.
Author contributions
XS: Data curation, Methodology, Writing – original draft, Writing – review & editing. GG: Data curation, Funding acquisition, Methodology, Writing – original draft. LC: Methodology, Writing – original draft. LZ: Methodology, Writing – original draft. GL: Methodology, Writing – original draft. CB: Data curation, Writing – original draft. GS: Conceptualization, Investigation, Methodology, Validation, Writing – original draft. LY: Conceptualization, Formal analysis, Funding acquisition, Project administration, Resources, Supervision, Validation, Visualization, Writing – review & editing.
Funding
The author(s) declare that financial support was received for the research and/or publication of this article. This study was supported by the Scientific and Technological Innovation 2030: 2023ZD0404803; National Natural Science Foundation of China: 32360837, 32341052; Inner Mongolia Science and Technology Leading Team: 2022LJRC0006; Inner Mongolia Science and Technology Major Projects: to leiyang; Xinjiang Uygur Science and Technology Major Project: 2023A02011-1; Research support funds for high-level talents in public institutions at the autonomous region level in Inner Mongolia in 2022 (2022110).
Acknowledgments
We would like to express our sincere gratitude to LC-Bio Co. Ltd. (Hangzhou, China) for their assistance with metabolomics processing.
Conflict of interest
The authors declare that the research was conducted in the absence of any commercial or financial relationships that could be construed as a potential conflict of interest.
Generative AI statement
The author(s) declare that no Gen AI was used in the creation of this manuscript.
Publisher’s note
All claims expressed in this article are solely those of the authors and do not necessarily represent those of their affiliated organizations, or those of the publisher, the editors and the reviewers. Any product that may be evaluated in this article, or claim that may be made by its manufacturer, is not guaranteed or endorsed by the publisher.
Supplementary material
The Supplementary material for this article can be found online at: https://www.frontiersin.org/articles/10.3389/fvets.2025.1552045/full#supplementary-material
Supplementary Figure S1 | Classification of cows’ serum metabolites during superovulation (A) Classification result of annotated metabolites by HMDB analysis. (B) KEGG pathway enrichment analysis result of annotated metabolites.
Footnotes
References
1. Kasimanickam, R, Kasimanickam, V, Kastelic, JP, and Ramsey, K. Metabolic biomarkers, body condition, uterine inflammation and response to superovulation in lactating Holstein cows. Theriogenology. (2020) 146:71–9. doi: 10.1016/j.theriogenology.2020.02.006
2. Kawamata, M. Relationships between the number of small follicles prior to superovulatory treatment and superovulatory response in Holstein cows. J Vet Med Sci. (1994) 56:965–7. doi: 10.1292/jvms.56.965
3. Yang, W-C, Yang, LG, Riaz, H, Tang, KQ, Chen, L, and Li, SJ. Effects in cattle of genetic variation within the IGF1R gene on the superovulation performance and pregnancy rates after embryo transfer. Anim Reprod Sci. (2013) 143:24–9. doi: 10.1016/j.anireprosci.2013.10.008
4. Hirayama, H. Effects of genetic background on responses to superovulation in Japanese black cattle. J Vet Med Sci. (2019) 81:373–8. doi: 10.1292/jvms.18-0537
5. Rasheed, ST, Younis, LS, and Aboud, QM. Association between bovine GDF9 SNPs and calving rate (superovulation) in Holstein-Friesian cows. Archives of Razi Institute. (2021) 76:1035–45. doi: 10.22092/ari.2021.354310.1632
6. Testart, J, Kann, G, Saumande, J, and Thibier, M. Oestradiol-17beta, progesterone, FSH and LH in prepubertal calves induced to superovulate. J Reprod Fertil. (1977) 51:329–36. doi: 10.1530/jrf.0.0510329
7. Callesen, H, Greve, T, and Hyttel, P. Preovulatory evaluation of the superovulatory response in donor cattle. Theriogenology. (1988) 30:477–88. doi: 10.1016/0093-691X(88)90197-5
8. Guilbault, LA, Lussier, JG, and Grasso, F. Interrelationships of hormonal and ovarian responses in superovulated heifers pretreated with FSH-P at the beginning of the estrous cycle. Theriogenology. (1992) 37:1029–40. doi: 10.1016/0093-691X(92)90101-V
9. Kitahara, G, Kamimura, S, and Hamana, K. Relationship between the peripheral concentrations of estradiol-17β (E<sub>2</sub>) and Preovulatory characteristics of cumulus-oocyte complexes (COCs) during superovulation treatment in Japanese black cows. J Reprod Dev. (2011) 57:159–62. doi: 10.1262/jrd.09-155T
10. Kafi, M, and McGowan, MR. Relationship between different concentrations of the plasma progesterone at the time of FSH-P treatment and the Superovulatory response in Holstein dairy heifers. Reprod Domest Anim. (2012) 47:e75–8. doi: 10.1111/j.1439-0531.2011.01966.x
11. Fushimi, Y, Monniaux, D, and Takagi, M. Efficacy of a single measurement of plasma anti-Miillerian hormone concentration for ovum pick-up donor selection of Japanese black heifers in herd breeding programs. J Reprod Dev. (2019) 65:369–74. doi: 10.1262/jrd.2019-003
12. Karl, KR, Jimenez-Krassel, F, Gibbings, E, Ireland, JLH, Clark, ZL, Tempelman, RJ, et al. Negative impact of high doses of follicle-stimulating hormone during superovulation on the ovulatory follicle function in small ovarian reserve dairy heifers. Biol Reprod. (2021) 104:695–705. doi: 10.1093/biolre/ioaa210
13. Karl, KR, Ireland, JLH, Clark, ZL, Tempelman, RJ, Latham, KE, and Ireland, JJ. Limitations in use of ovarian reserve biomarkers to predict the superovulation response in small ovarian reserve heifers. Theriogenology. (2022) 182:53–62. doi: 10.1016/j.theriogenology.2022.01.033
14. Sekizawa, F. Relationship between embryo collection results after superovulation treatment of Japanese black cows and their plasma β-carotene and vitamin concentrations. J Reprod Dev. (2012) 58:377–9. doi: 10.1262/jrd.11-075H
15. Alkan, H. Evaluation of the relationship between serum paraoxonase-1 activity and superovulation response/embryo yield in Holstein cows. J Vet Med Sci. (2021) 83:535–41. doi: 10.1292/jvms.20-0578
16. Chorfi, Y, Lanevschi, A, Dupras, R, Girard, V, and Tremblay, A. Serum biochemical parameters and embryo production during superovulatory treatment in dairy cattle. Res Vet Sci. (2007) 83:318–21. doi: 10.1016/j.rvsc.2007.01.010
17. Watanabe, U, Takagi, M, Yamato, O, Otoi, T, and Okamoto, K. Retrospective surveillance of metabolic parameters affecting reproductive performance of Japanese black breeding cows. J Vet Sci. (2014) 15:283–8. doi: 10.4142/jvs.2014.15.2.283
18. Horn, EJ, Read, CC, Edwards, JL, Schrick, FN, Rhinehart, JD, Payton, RR, et al. Preovulatory follicular fluid and serum metabolome profiles in lactating beef cows with thin, moderate, and obese body condition. J Anim Sci. (2022) 100:1–14. doi: 10.1093/jas/skac152
19. Alward, KJ, Cockrum, RR, and Ealy, AD. Associations of antral follicle count with fertility in cattle: a review. JDS communications. (2023) 4:132–7. doi: 10.3168/jdsc.2022-0283
20. Silva, F. Peri-estrus ovarian, uterine, and hormonal variables determine the uterine luminal fluid metabolome in beef heifers. Biol Reprod. (2021) 105:1140–53. doi: 10.1093/biolre/ioab149
21. Gimeno, I, Salvetti, P, Carrocera, S, Gatien, J, le Bourhis, D, and Gómez, E. The recipient metabolome explains the asymmetric ovarian impact on fetal sex development after embryo transfer in cattle. J Anim Sci. (2024) 102:skae081. doi: 10.1093/jas/skae081
22. Gómez, E, Salvetti, P, Gatien, J, Carrocera, S, Martín-González, D, and Muñoz, M. Blood plasma metabolomics predicts pregnancy in Holstein cattle transferred with fresh and vitrified/warmed embryos produced in vitro. J Proteome Res. (2020) 19:1169–82. doi: 10.1021/acs.jproteome.9b00688
23. Guo, YS, and Tao, JZ. Metabolomics and pathway analyses to characterize metabolic alterations in pregnant dairy cows on D 17 and D 45 after AI. Sci Rep. (2018) 8:8. doi: 10.1038/s41598-018-23983-2
24. Phillips, KM, Read, CC, Kriese-Anderson, LA, Rodning, SP, Brandebourg, TD, Biase, FH, et al. Plasma metabolomic profiles differ at the time of artificial insemination based on pregnancy outcome, in Bos taurus beef heifers. Sci Rep. (2018) 8:8. doi: 10.1038/s41598-018-31605-0
25. Funeshima, N, Miura, R, Katoh, T, Yaginuma, H, Kitou, T, Yoshimura, I, et al. Metabolomic profiles of plasma and uterine luminal fluids from healthy and repeat breeder Holstein cows. BMC Vet Res. (2021) 17:54. doi: 10.1186/s12917-021-02755-7
26. Jawor, P, Ząbek, A, Wojtowicz, W, Król, D, Stefaniak, T, and Młynarz, P. Metabolomic studies as a tool for determining the post-mortem interval (PMI) in stillborn calves. BMC Vet Res. (2019) 15:15. doi: 10.1186/s12917-019-1935-4
27. Ji, G, Zhang, J, Feng, X, Sheng, H, Hu, H, Li, F, et al. Analysis of blood biochemistry and non-targeted metabolomics of endometritis in dairy cows. Anim Reprod Sci. (2024) 264:107460. doi: 10.1016/j.anireprosci.2024.107460
28. Kanehisa, M, Furumichi, M, Sato, Y, Ishiguro-Watanabe, M, and Tanabe, M. KEGG: integrating viruses and cellular organisms. Nucleic Acids Res. (2021) 49:D545–d551. doi: 10.1093/nar/gkaa970
29. Jensch, R, Baber, R, Körner, A, Kiess, W, Ceglarek, U, Garten, A, et al. Association of Whole Blood Amino Acid and Acylcarnitine Metabolome with anthropometry and IGF-I serum levels in healthy children and adolescents in Germany. Meta. (2024) 14:489. doi: 10.3390/metabo14090489
30. Sessions-Bresnahan, DR, Schauer, KL, Heuberger, AL, and Carnevale, EM. Effect of obesity on the Preovulatory follicle and lipid fingerprint of equine oocytes. Biol Reprod. (2016) 94:15. doi: 10.1095/biolreprod.115.130187
31. Cordeiro, FB, Cataldi, TR, do Vale Teixeira da Costa, L, de Lima, CB, Stevanato, J, Zylbersztejn, DS, et al. Follicular fluid lipid fingerprinting from women with PCOS and hyper response during IVF treatment. J Assist Reprod Genet. (2015) 32:45–54. doi: 10.1007/s10815-014-0375-0
32. Cataldi, T, Cordeiro, FB, da Costa, LDVT, Pilau, EJ, Ferreira, CR, Gozzo, FC, et al. Lipid profiling of follicular fluid from women undergoing IVF: young poor ovarian responders versus normal responders. Hum Fertil (Camb). (2013) 16:269–77. doi: 10.3109/14647273.2013.852255
33. Chang, W. Lipidomics and spatial metabolomics reveal the heterogeneity in lipid distribution within pecan kernels. Food Chem. (2024) 467:142368. doi: 10.1093/jas/skae081
34. Santos, PH, Fontes, PK, Franchi, FF, Nogueira, MFG, Belaz, KRA, Tata, A, et al. Lipid profiles of follicular fluid from cows submitted to ovarian superstimulation. Theriogenology. (2017) 94:64–70. doi: 10.1016/j.theriogenology.2017.02.002
35. Xu, Q, Wang, C, Wang, L, Feng, R, Guo, Y, Feng, S, et al. Correlation analysis of serum reproductive hormones and metabolites during multiple ovulation in sheep. BMC Vet Res. (2022) 18:290. doi: 10.1186/s12917-022-03387-1
36. Scholpa, NE. Evolution of lipid metabolism in the injured mouse spinal cord. J Neurotrauma. (2024) 42:182–196. doi: 10.1089/neu.2024.0385
37. Dunning, KR, Russell, DL, and Robker, RL. Lipids and oocyte developmental competence: the role of fatty acids and β-oxidation. Reproduction. (2014) 148:R15–27. doi: 10.1530/REP-13-0251
38. Leroy, JL. Metabolite and ionic composition of follicular fluid from different-sized follicles and their relationship to serum concentrations in dairy cows. Anim Reprod Sci. (2004) 80:201–11. doi: 10.1016/S0378-4320(03)00173-8
39. Valckx, S. BMI-related metabolic composition of the follicular fluid of women undergoing assisted reproductive treatment and the consequences for oocyte and embryo quality. Hum Reprod. (2012) 27:3531–9. doi: 10.1093/humrep/des350
40. Virote, B, Moreira, AMS, Silva Souza, JGD, Castro, TFD, Melo, N, Carneiro, WF, et al. Obesity induction in adult zebrafish leads to negative reproduction and offspring effects. Reproduction. (2020) 160:833–42. doi: 10.1530/REP-20-0119
41. Núñez Calonge, R, Guijarro, JA, Andrés, C, Cortés, S, Saladino, M, Caballero, P, et al. Relationships between lipids levels in blood plasma, follicular fluid and seminal plasma with ovarian response and sperm concentration regardless of age and body mass index. Rev Int Androl. (2022) 20:178–88. doi: 10.1016/j.androl.2021.02.004
42. Li, FL, Fu, V, Liu, G, Tang, T, Konradi, AW, Peng, X, et al. Hippo pathway regulation by phosphatidylinositol transfer protein and phosphoinositides. Nat Chem Biol. (2022) 18:1076–86. doi: 10.1038/s41589-022-01061-z
43. Clark, KL, George, JW, Przygrodzka, E, Plewes, MR, Hua, G, Wang, C, et al. Hippo signaling in the ovary: emerging roles in development, fertility, and disease. Endocr Rev. (2022) 43:1074–96. doi: 10.1210/endrev/bnac013
44. Grosbois, J, and Demeestere, I. Dynamics of PI3K and hippo signaling pathways during in vitro human follicle activation. Hum Reprod. (2018) 33:1705–14. doi: 10.1093/humrep/dey250
45. Kawamura, K, Cheng, Y, Suzuki, N, Deguchi, M, Sato, Y, Takae, S, et al. Hippo signaling disruption and Akt stimulation of ovarian follicles for infertility treatment. Proc Natl Acad Sci USA. (2013) 110:17474–9. doi: 10.1073/pnas.1312830110
46. Hu, LL, Su, T, Luo, RC, Zheng, YH, Huang, J, Zhong, ZS, et al. Hippo pathway functions as a downstream effector of AKT signaling to regulate the activation of primordial follicles in mice. J Cell Physiol. (2019) 234:1578–87. doi: 10.1002/jcp.27024
47. Devos, M, Grosbois, J, and Demeestere, I. Interaction between PI3K/AKT and hippo pathways during in vitro follicular activation and response to fragmentation and chemotherapy exposure using a mouse immature ovary model. Biol Reprod. (2020) 102:717–29. doi: 10.1093/biolre/ioz215
Keywords: cow, superovulation, metabolome, serum, biomarker
Citation: Su X, Gao G, Chen L, Zhang L, Liu G, Bian C, Su G and Yang L (2025) Identification of candidate blood biomarkers through metabolomics analysis in bovine superovulation. Front. Vet. Sci. 12:1552045. doi: 10.3389/fvets.2025.1552045
Edited by:
Manuel Garcia-Herreros, National Institute for Agricultural and Veterinary Research (INIAV), PortugalReviewed by:
Karima Mahmoud, National Research Centre, EgyptAykut Gram, Erciyes University, Türkiye
Copyright © 2025 Su, Gao, Chen, Zhang, Liu, Bian, Su and Yang. This is an open-access article distributed under the terms of the Creative Commons Attribution License (CC BY). The use, distribution or reproduction in other forums is permitted, provided the original author(s) and the copyright owner(s) are credited and that the original publication in this journal is cited, in accordance with accepted academic practice. No use, distribution or reproduction is permitted which does not comply with these terms.
*Correspondence: Lei Yang, bGVpeWFuZ0BpbXUuZWR1LmNu; Guanghua Su, c3VndWFuZ2h1YTA3MDdAMTYzLmNvbQ==
†These authors have contributed equally to this work