 Xiaokang Chang
 Zihan Zhang1†
 Xinkui Yao
 Wanlu Ren
 Yaqi Zeng
- 1College of Animal Science, Xinjiang Agricultural University, Urumqi, China
- 2Xinjiang Key Laboratory of Equine Breeding and Exercise Physiology, Urumqi, China
The equine lipid metabolism is activated during and after endurance exercise to provide energy in response to the metabolic and physiological changes in the body caused by prolonged exercise; however, the specific regulatory mechanisms remain controversial and identifying differential lipid metabolites associated with equine endurance is essential to elucidate these regulatory mechanisms. In this study, blood samples for lipid metabolomic analysis and biochemical indices were collected before and after a 26 km race from 12 Yili horses with different endurance performance. The biochemical results showed that: the albumin (ALB) level was significantly higher in the general group than in the excellent group before the competition, but significantly lower in the ordinary group after the competition (p < 0.05); the pre-competition alanine aminotransferase (ALT) in the excellent group was significantly higher than that of the general group (p < 0.05); and the urea nitrogen (BUN) in the general group was significantly higher than that of the excellent group after the competition (p < 0.05). The lipid metabolism results showed that a total of 1,537 lipid differential metabolites were obtained, mainly enriched in the pathways of fatty acid biosynthesis, cortisol synthesis and secretion, bile secretion, aldosterone regulation of sodium reabsorption, biotin metabolism, steroid hormone biosynthesis, and neuroactive ligand-receptor interactions. Metabolomics and biochemical correlation analyses screened PC (18:3/18:4) and PI (18:1/18:2) as potential biomarkers to identify endurance performance in Yili horses. The results of this study provide a solid foundation for improving equine racing performance and for the selection and breeding of endurance horses by providing a comprehensive reference on the mechanisms of lipid metabolism in equine endurance.
1 Introduction
Equine endurance racing places high demands on the physiological adaptations of the horse, and endurance exercise in horses results in increased cardiac output and fluid loss, which can lead to severe imbalances in homeostasis (1). Metabolomics is an important tool for understanding the metabolic response of athletes to prolonged strenuous exercise (2–5). Some studies have found (6), Twenty-three metabolites were altered in horses after moderate-intensity exercise, while 54 differential metabolites associated with pathways such as amino acid, fatty acid, nucleic acid, and vitamin metabolism were identified after high-intensity exercise. Klein (7) found that 142 metabolites changed significantly after 3 h of treadmill exercise in horses. Therefore, an in-depth study of the molecular regulatory mechanisms and physiological states of endurance racehorses under sustained exercise can provide a theoretical basis for enhancing the horse’s race performance and optimizing training programs.
Lipidomics is considered a subfield of metabolomics, focusing on the study of the composition, structure, and function of all lipid molecules in an organism and their changes during physiological and pathological processes (8–10). Lipid metabolism is a central process of energy storage, cellular structure and signaling in organisms and is extremely important for aerobic and anaerobic exercise (11), causing strong changes in lipid metabolites during and after endurance exercise (12, 13). Previously Nolazco (14) used an untargeted lipidomic approach to compare changes in the plasma lipidome of Thoroughbreds before and after ultramaximal exercise and found that 13 lipids were altered after exercise, including seven fatty acids (FAs) and three phosphatidylcholines (PCs), one lysophosphatidylcholine (LPC) and two sphingomyelins (SMs). However, this study had a small sample size (four Thoroughbreds) and the results were limited to the finding that high-intensity exercise induces changes in the plasma lipidome of racehorses, and there was no deeper dive into the biomarkers associated with endurance performance. Since there is some variability in the athletic performance of different horses breed, which makes their race performance and body metabolism different, further studies on how lipids are supplied as energy in horses are needed to better elucidate the pathways related to lipid metabolism.
The Yili horse is the only riding horse breed independently bred in China. Through long-term complex multi-breed crossbreeding and selection under unchanged grazing conditions and continuous improvement, it has the characteristics of strong resistance to adversity and good endurance performance, and has become one of the main racing breeds in Xinjiang, China (15, 16). In this study, we investigated the differences in plasma lipid metabolites before and after 26 km endurance races of different endurance horses through lipidomics, analyzed the energy supply pathways of endurance horses by combining blood biochemical indexes, and gained an in-depth understanding of the ways in which energy is produced and utilized by lipid metabolism in long-distance exercise, which provides scientific evidence for the in-depth understanding of the physiological mechanisms of the endurance horse, the improvement of endurance performance, and the refinement of selection, breeding and management strategies for endurance horses.
2 Materials and methods
2.1 Animal and sample collection
In this study, horses participating in the 26 km traditional endurance race for Yili horses were selected as research subjects. The rules of the competition are strictly enforced in accordance with the “Rules of Racing of the Chinese National Horse Race Traditional Endurance Race”. All participating horses have a Yili Horse Registration Passport issued by the Xinjiang Horse Industry Association, aged between 5 and 10 years, underwent a pre-race veterinary examination to confirm their good health, with no signs of lameness, metabolic disorders, or fatigue, and after the race the horses that finished in the rankings were tested for prohibited substances. The racecourse consisted of grass terrain for the first 20 kilometers and sandy terrain for the final 6 kilometers. The ranking was determined based on the total time taken to complete the 26-kilometer race without stopping, and the results were recorded simultaneously.
Twelve adult male horses that completed the race and finished in the top six (excellent group) and bottom six (ordinary group), respectively, were selected as experimental animals from 207 participating horses, and blood was collected from the jugular vein of the horses the day before the race and after the race (when the heart rate recovered to 64 beats/min and below) (17), with two tubes (sodium heparin and vacutainer) of 5 mL each at a time. All blood samples were prepped immediately after collection and plasma was extracted by centrifugation through sodium heparin centrifuge tubes at 3500 r/min for 15 min and then stored in liquid nitrogen for lipid metabolite extraction (18). Another 5 mL of empty blood samples were allowed to stand for 10 min and then centrifuged at 3500 r/min for 15 min to extract serum, which was stored in a − 20°C refrigerator for biochemical analysis (19).
2.2 Measurement of biochemical indicators
Total protein (TP), albumin (ALB), total cholesterol (TC), urea nitrogen (BUN), uric acid (UA), creatinine (CREA), and lactic acid (LAC) concentrations were determined using a spectrophotometer and an enzyme marker, as well as the activities of alanine aminotransferase (ALT), alanine oxaloacetyltransferase (AST), creatine kinase (CK) and lactate dehydrogenase (LDH) activities. The manufacturers and parameters of the instruments are listed in Table 1.
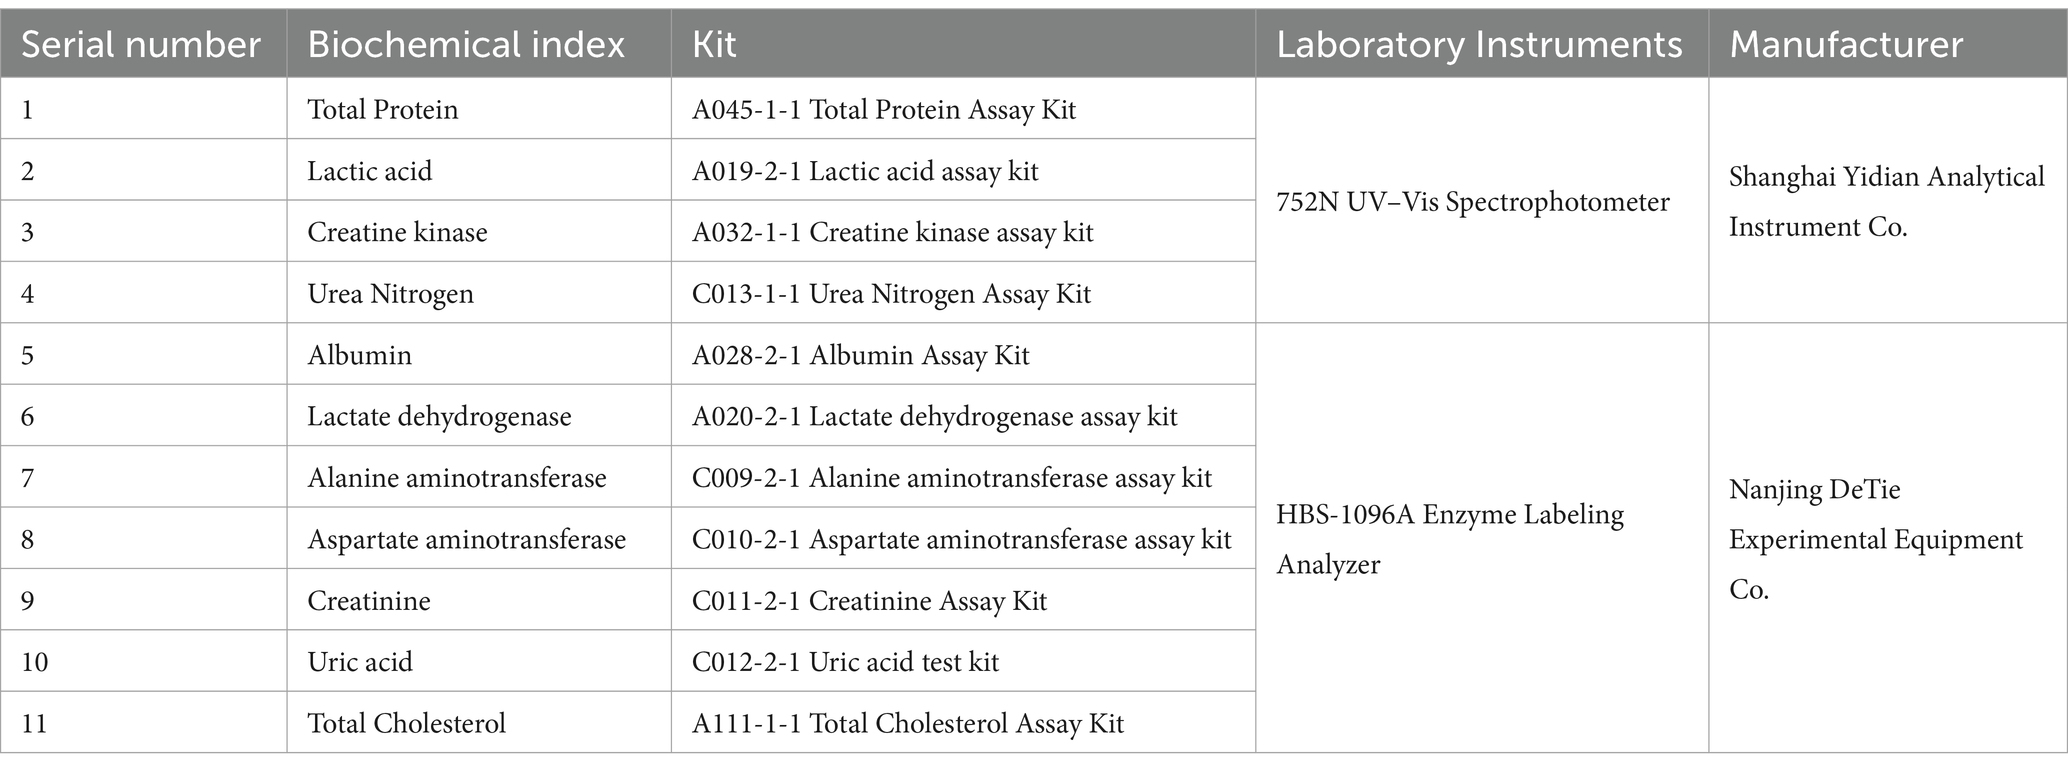
Table 1. Biochemical indexes determination kits and test instruments.
2.3 Biochemical data analysis
The biochemical data obtained were organized using Microsoft Excel, and the data were statistically tested based on SPSS 25.0 software, and the results of the biochemical tests before and after the race and the horses’ performance in the excellent and ordinary groups were subjected to the Independent-Samples T Test (IST), and the statistical results were expressed as the mean ± standard error (Mean ± SE), with p < 0.01 being highly significant and p < 0.05 being significant (19).
2.4 Metabolite extraction
100 μL of liquid sample was added to a glass centrifuge tube with a PTFE-lined cap, 0.75 mL of pre-cooled methanol was added, and vortexed and shaken. Add 2.5 mL of pre-cooled methyl tert-butyl ether and incubate on a shaker at room temperature for 1 h. Add 0.625 mL of mass spectrometry-grade water and mix well to stratify the organic phase, and incubate at room temperature for 10 min before centrifuging for 10 min at 1,000 r using a Thermo ST16R cryogenic centrifuge. Collect the upper organic phase (MTBE) and add 1 mL of mixed solvent (methyl tert-butyl ether/methanol/water) (10:10:10) to the lower (water and methanol) layer. The upper organic phase was collected by adding 1 mL of mixed solvent [methyl tert-butyl ether/methanol/water (10:3:2.5, v/v/v)] to the lower layer (water and methanol) and extracted again. The two collected organic phases were concentrated by nitrogen blowing using a Reacti-Therm nitrogen blower.
Resolutions were performed with 100 μL of isopropanol. The samples were analyzed by LC–MS/MS system using Q ExactiveTM HF mass spectrometer, Thermo VanquishTM UHPLC chromatograph by liquid-mass spectrometry (LC–MS) technique (20). An equal amount of supernatant was taken from each processed sample and mixed as QC sample. The lipid metabolomics sequencing was performed by Beijing Novogene Bioinformatics Technology Co., Ltd.
2.5 Metabolite data processing and statistical analysis
The raw downlink data (raw) files were imported into Compound Discoverer 3.1 library search software for simple screening of retention time, mass-to-charge ratio and other parameters, and then peaks were aligned according to retention time deviation of 0.2 min and mass deviation of 5 ppm for different samples, followed by peak extraction according to the settings of mass deviation of 5 ppm, signal intensity deviation of 30%, and signal-to-noise ratio of 3, Minimum signal intensity 100,000, summed ions and other information for peak extraction, as well as quantification of peak area, and then integration of the target ions, followed by molecular formula prediction by molecular ion peaks and fragmentation ions and comparison with the Lipidmaps and Lipidblast databases, removal of background ions by blank samples, and normalization of the quantitative results to lipid data The results were characterized and quantified (21).
The data were transformed using the software metaX and then subjected to Partial Least Squares Discrimination Analysis (PLS-DA) to obtain the VIP value for each metabolite. Statistical significance (p-value) of each metabolite between the two groups was calculated based on the t-test, and the Fold Change (FC value) of the metabolite difference between the two groups was calculated. The Variable Importance for the Projection (VIP) obtained from the PLS-DA model was used to measure the strength of the influence of the expression pattern of each metabolite on the categorical discrimination of the samples in each group and the explanatory ability to mine biologically significant differential lipid metabolites, and the criteria for the screening were VIP > 1, p < 0.05 and FC > 1.2 or FC < 0.5, respectively. 1.2 or FC < 0.833. Pathways of differential lipid metabolites were identified using KEGG database analysis.
2.6 Correlation analysis
The obtained biochemical data and differential lipid compounds were subjected to correlation analysis by the correlation analysis tool of the Maiwei Cloud Platform,1 which calculates the correlation between different substances based on the quantitative data of the substances of interest, and then draws a correlation heat map to visualize the magnitude of the correlation between the substances (22).
3 Results
3.1 Analysis of differences in race results
The results of the analysis of differences in race performance of different endurance performance Yili horses (Table 2) showed that the time taken by the excellent group was significantly lower than that of the ordinary group (p < 0.05).
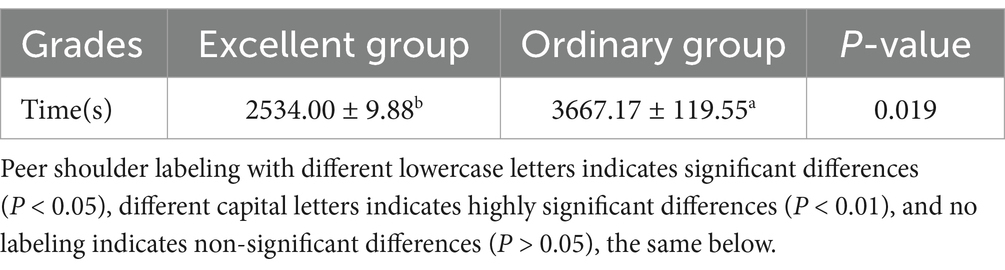
Table 2. Results for Yili horses with different stamina.
3.2 Blood biochemistry analysis
3.2.1 Analysis of the differences in pre-game biochemical indexes between the excellent group and the ordinary group
The analysis of the differences in blood biochemical indexes before the 26 km endurance race between the excellent group and the ordinary group (Table 3) showed that the TP, LAC, LDH, ALT and CREA contents in the ordinary group were higher than those in the excellent group but the difference was not significant, and the TC and CK contents in the excellent group were higher than those in the ordinary group but the difference was not significant. The levels of ALB and UA were significantly higher in the average group than in the excellent group before the race, and the levels of ALT were significantly higher in the excellent group than in the average group.

Table 3. Differential analysis of pre-race blood biochemical indexes between the excellent group and the ordinary group of 26 km endurance race.
3.2.2 Analysis of the differences in biochemical indexes between the excellent group and the ordinary group after the race
After 26 km endurance exercise, ALB in blood was significantly higher in the excellent group than in the normal group. Also TP, LAC, ALT, CREA, uric acid and TC showed higher levels in the excellent group, but the difference was not significant. The values of LDH, CK and AST were higher in the ordinary group than in the excellent group, but there was no statistical difference (Table 4).
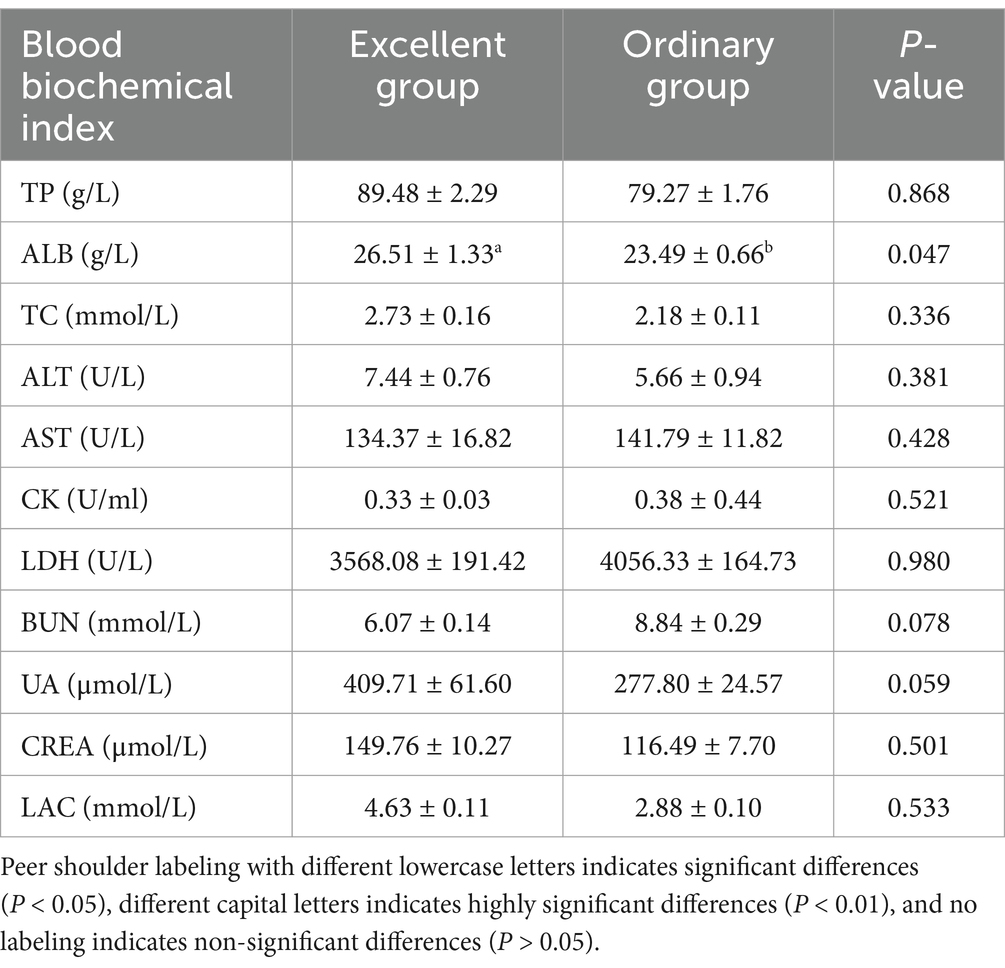
Table 4. Differential analysis of post-event blood biochemical indices of the 26 km endurance race between the excellent group and the normal group.
3.3 Lipid metabolomics analysis
3.3.1 Quality control of data
The higher the QC sample correlation (R2 closer to 1) indicates the better stability of the detection process and the higher quality of the data. The QC sample correlation is shown in Figure 1, and the R2 values of this study are all higher than 0.99, which indicates better experimental stability.
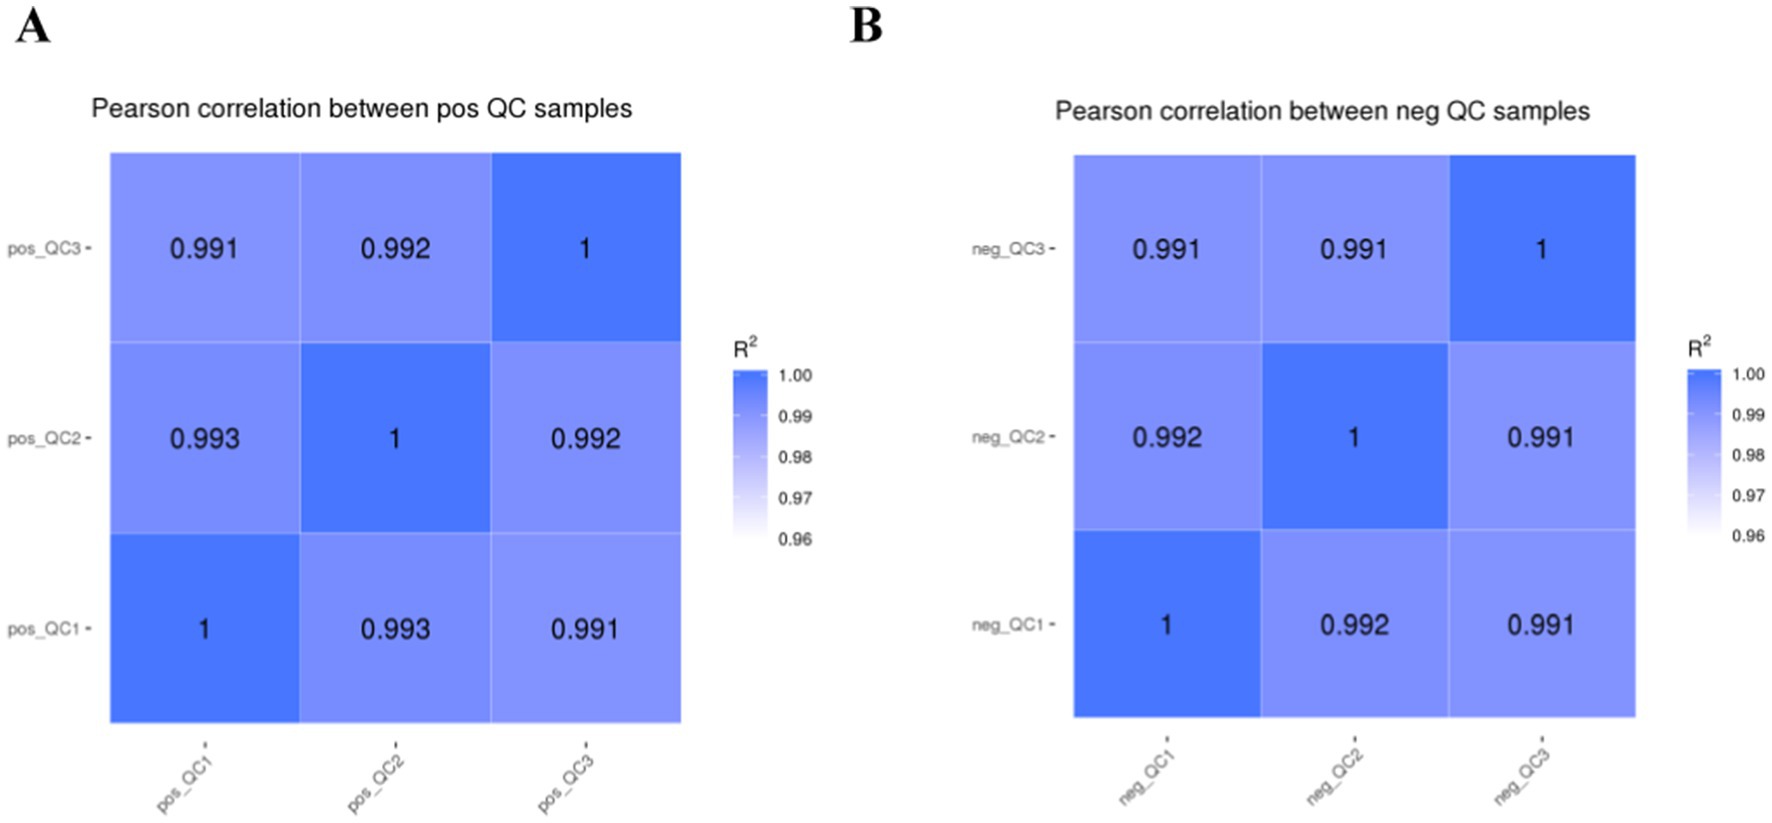
Figure 1. Correlation analysis of QC samples.
3.3.2 Plasma metabolite analysis
When comparing Yili horses with different endurance performances, the pre-race Excellent Group is named as Group A, the pre-race Ordinary Group is named as Group B before the race, the post-race Excellent Group is named as Group C, and the post-race Ordinary Group is named as Group D (the same below), and the PLS-DA model was established for each comparative group (Figure 2), and the model evaluation parameters (R2, Q2) were obtained after seven cycles of interactive validation (7-fold cross-validation), and the model evaluation parameters (R2, Q2) were obtained if R2 and Q2 are closer to 1, which indicates that the model is more stable and reliable. In this study, the R2 values of the excellent group and the ordinary group were greater than 0.95 in both pre-race and post-race, indicating that the model was more stable.

Figure 2. PLS-DA score chart. (A,C) are the PLS-DA score charts comparing the pre-game and post-game scores of the excellent and normal groups in the positive mode. (B,D) are the PLS-DA score charts comparing the pre-game and post-game scores of the excellent and normal groups in the negative mode.
In order to judge the quality of the model, we sorted the model to verify whether the model was “overfitted”. When the R2 data is greater than the Q2 data and the intercept of the Q2 regression line with the Y-axis is less than 0, it indicates that the model is not “overfitted”. In this study, R2 > Q2 and the intercept between the Q2 regression line and the Y-axis is less than 0, which indicates that the model is not overfitted, and can describe the samples better, which can be used as a prerequisite for finding biomarker clusters (Figure 3).
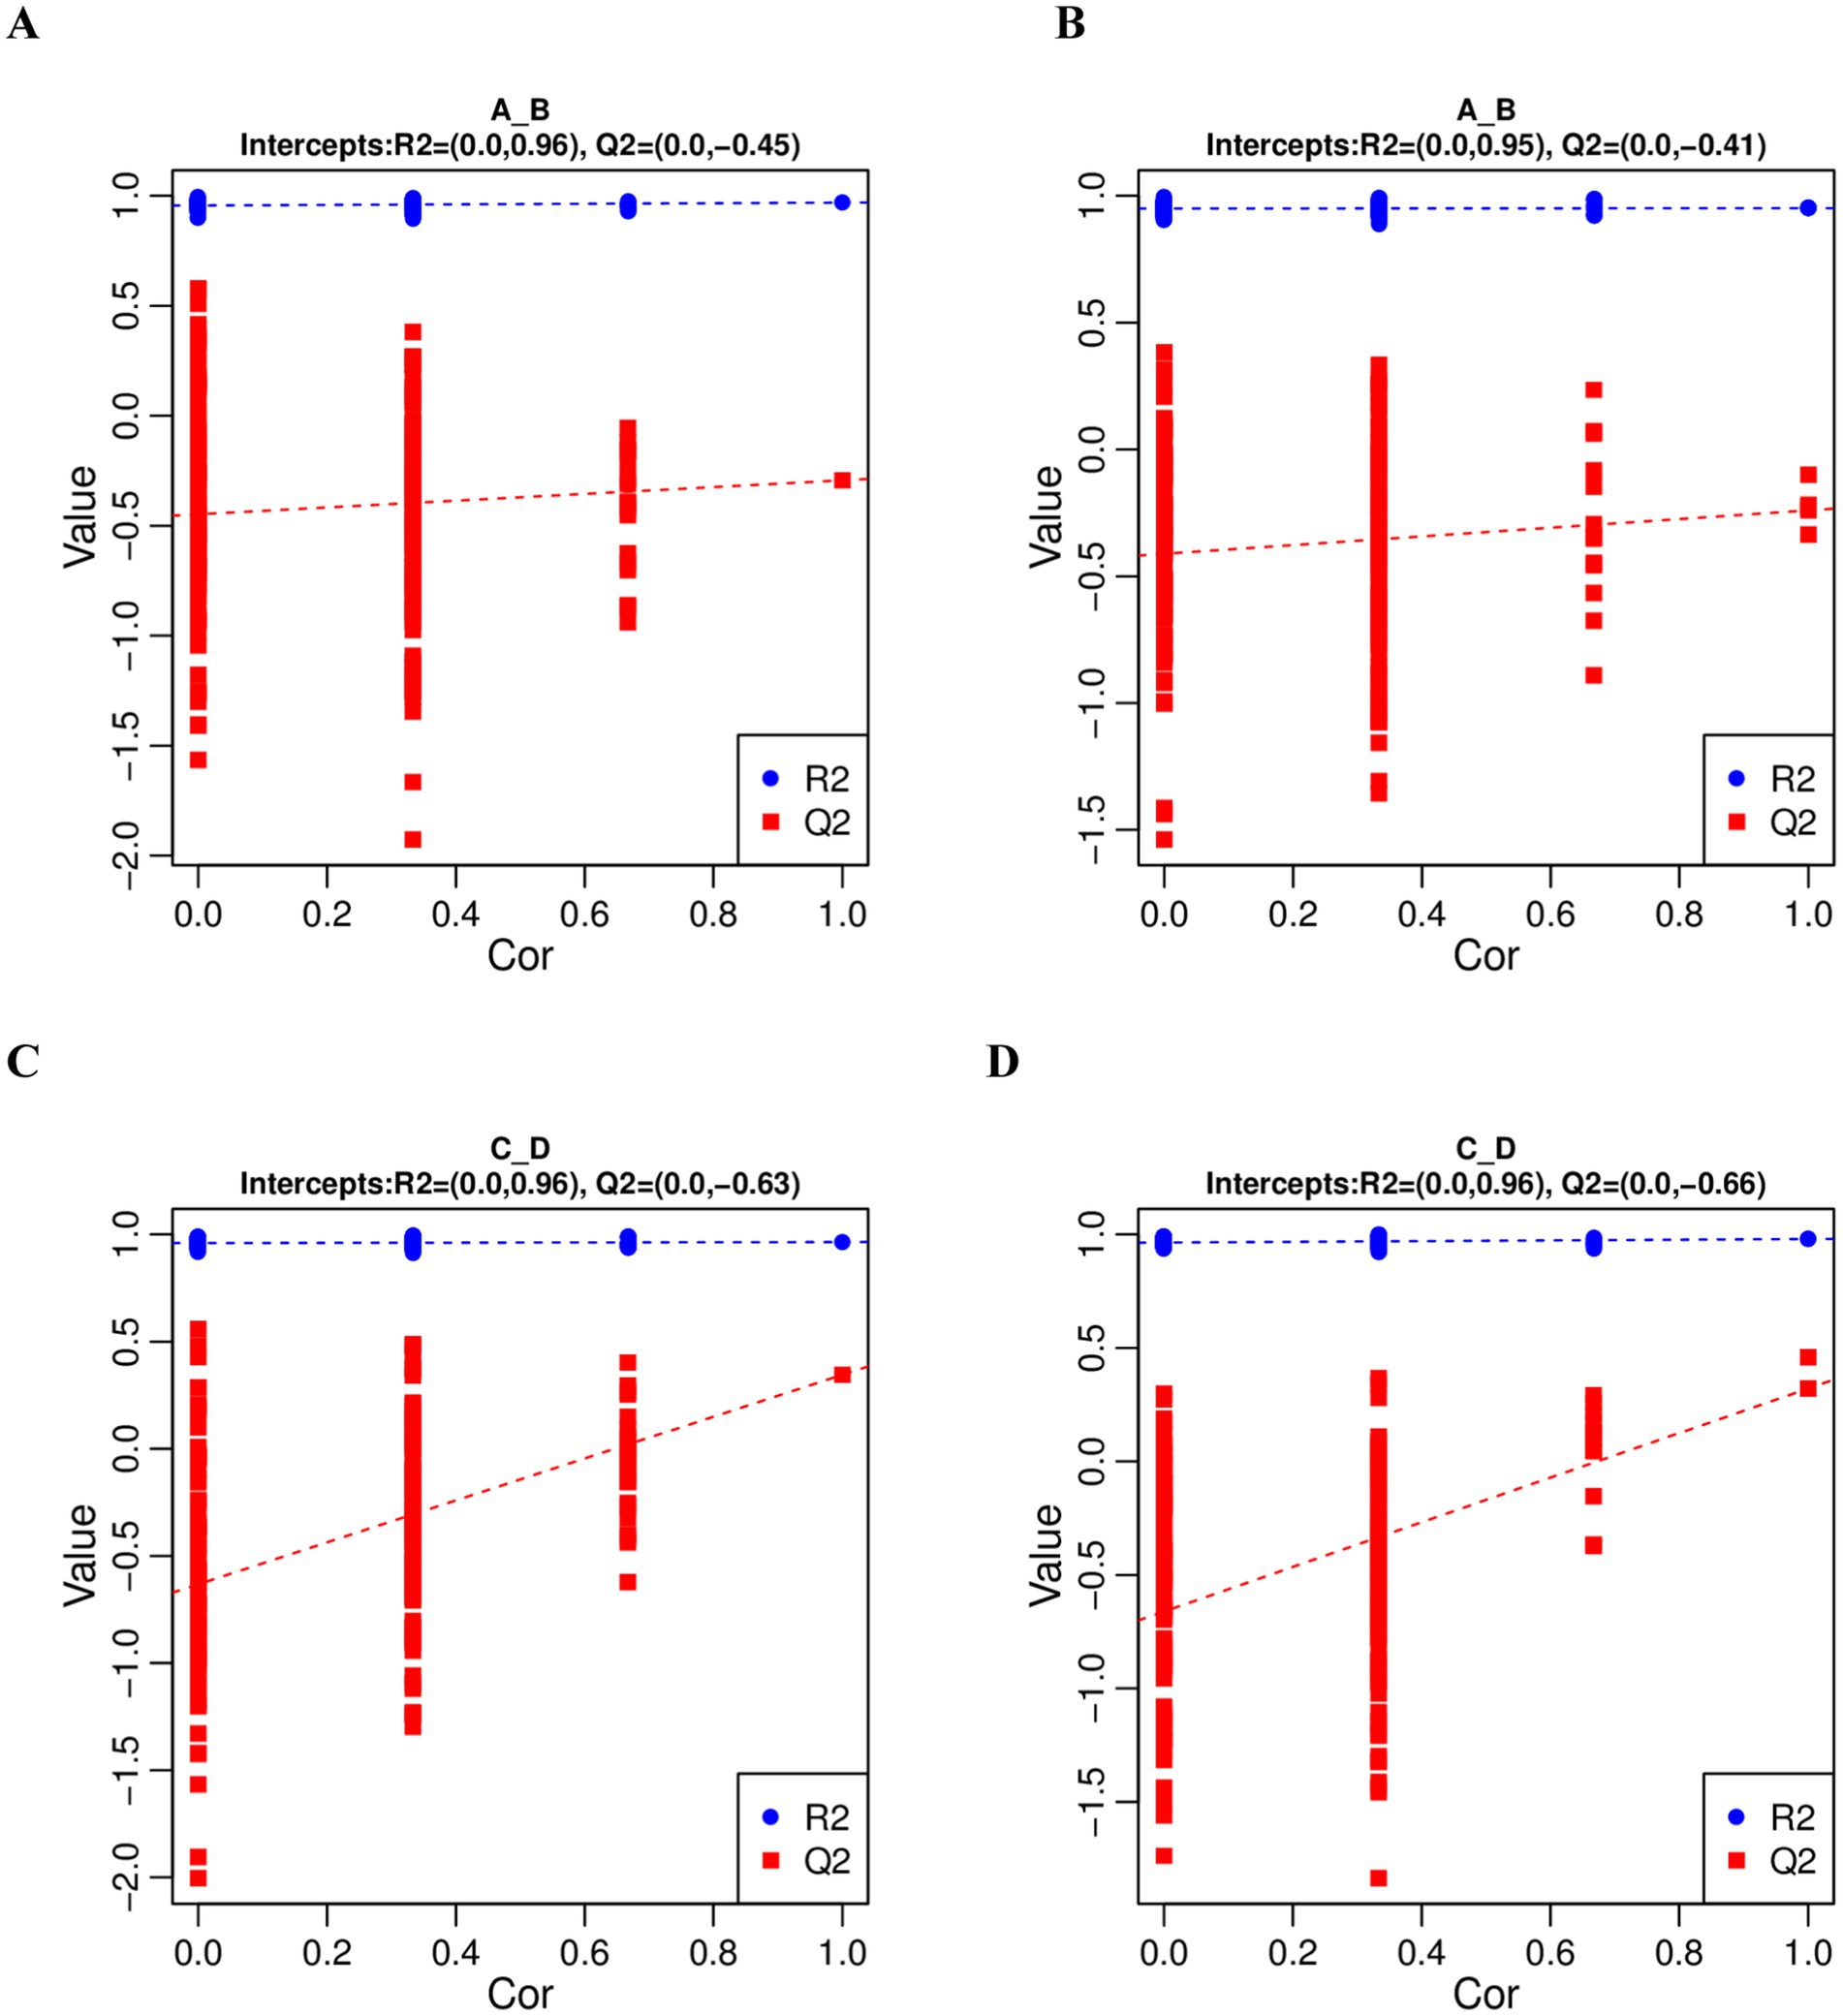
Figure 3. PLS-DA sequential validation map. (A,C) represents the PLS-DA sorting validation charts comparing the pre-game and post-game of the excellent and normal groups in the positive mode. (B,D) represents the PLS-DA sorting validation charts comparing the pre-game and post-game of the excellent and normal groups in the negative mode.
Metabolites with VIP > 1, FC > 1.2 or FC < 0.833 with p < 0.05 in PLS-DA model were selected as differential lipid metabolites. Volcano plots were used to show the overall distribution of differential lipid metabolites for each subgroup, with red dots indicating significantly up-regulated metabolites, green dots indicating significantly down-regulated metabolites, and grey representing metabolites with no difference (Figure 4).
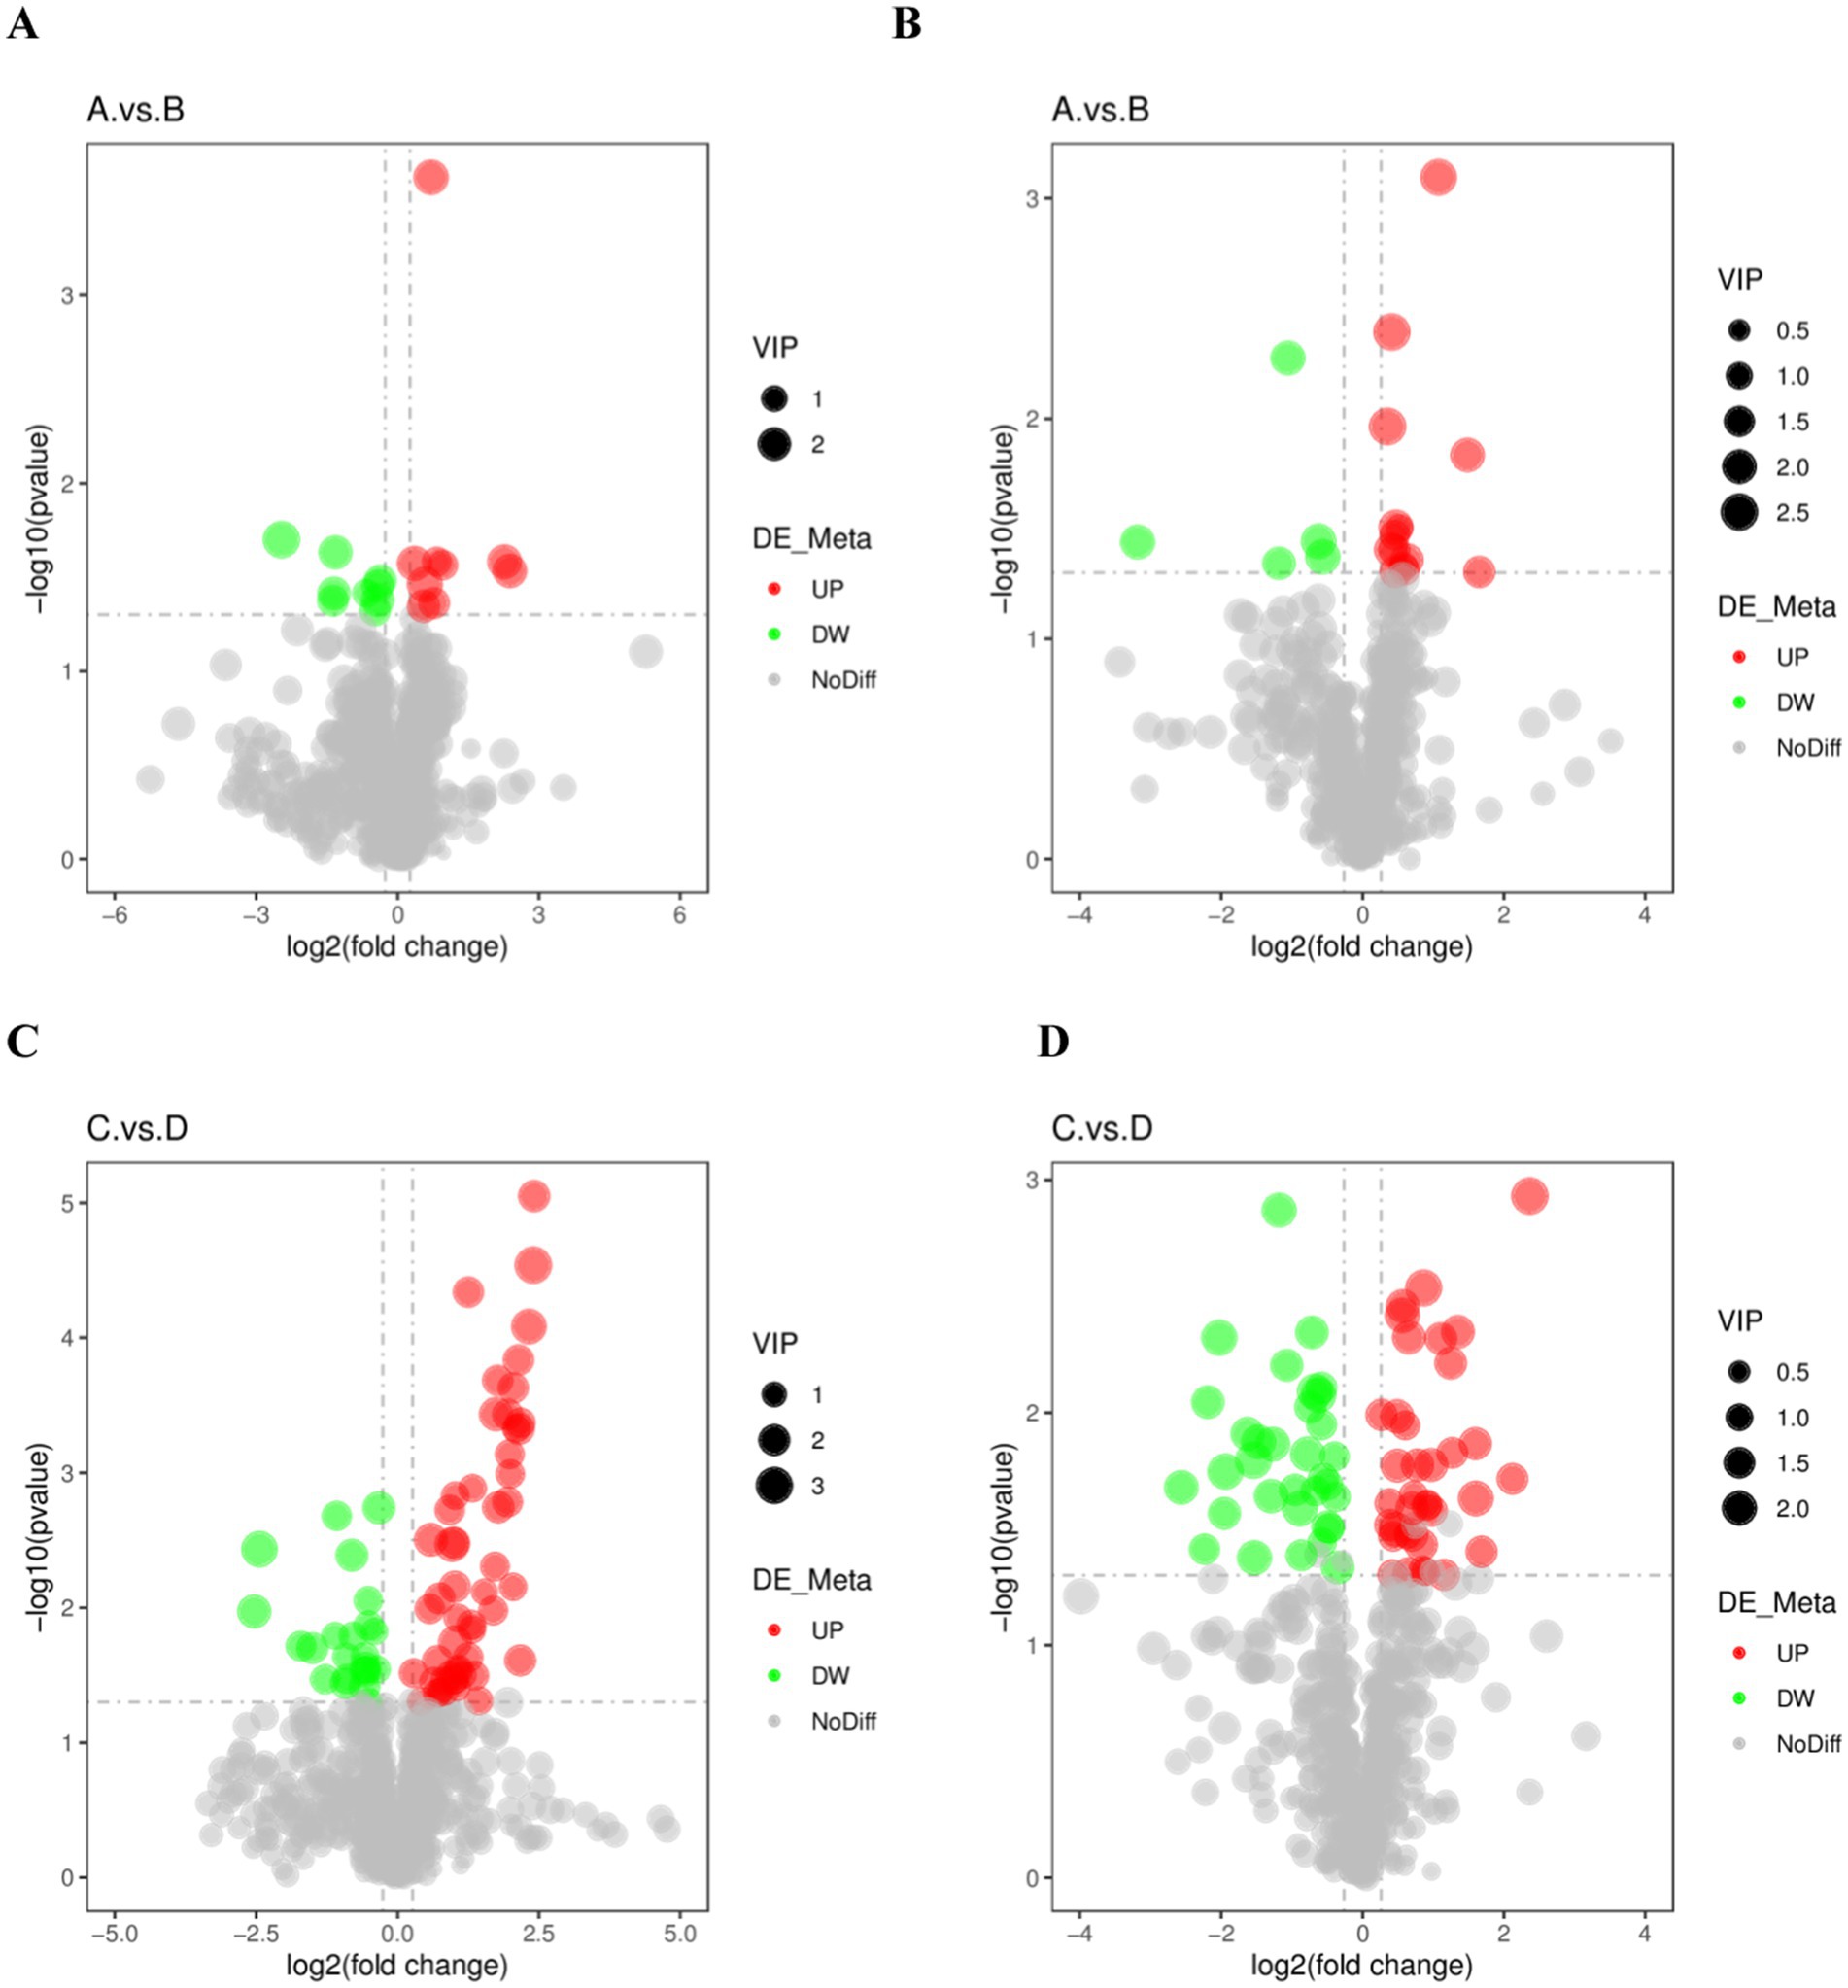
Figure 4. Differential metabolic volcano plot for the excellent group vs. ordinary group. (A,C) are the volcano charts in positive mode comparing the pre-game and post-game of the excellent and normal groups. (B,D) are the volcano charts in negative mode comparing the pre-game and post-game of the excellent and normal groups.
A total of 16 different lipid metabolites were screened in the positive and negative modes before and after the 26 km endurance race of adult Yili horses (Figure 5), including 7 glycerophospholipids (GP), 4 sphingolipids (SP), 2 glycerol esters (GL), 2 fatty acids (FA) and 1 glycolipid (SL). A total of 1,537 differential lipid metabolites were screened before and after the pre-game and post-game in the excellent vs. ordinary group, of which 915 differential metabolites were screened in the positive ion mode and 622 differential metabolites were screened in the negative ion mode.

Figure 5. Differential lipid metabolite classification map. (A,C) denotes the difference metabolite classification plots in the positive mode for the pre-game and post-game comparisons between the excellent and average groups. (B,D) denotes the difference metabolite classification plots in the negative mode for the pre-game and post-game comparisons between the excellent and average groups.
Matchstick plots derived from the differential lipid metabolites identified in each comparative group combination provide a clearer representation of the upregulation and downregulation of differential metabolites, as well as substances with significant fold changes. Figure 6 displays the top 20 most upregulated and downregulated differential metabolites.
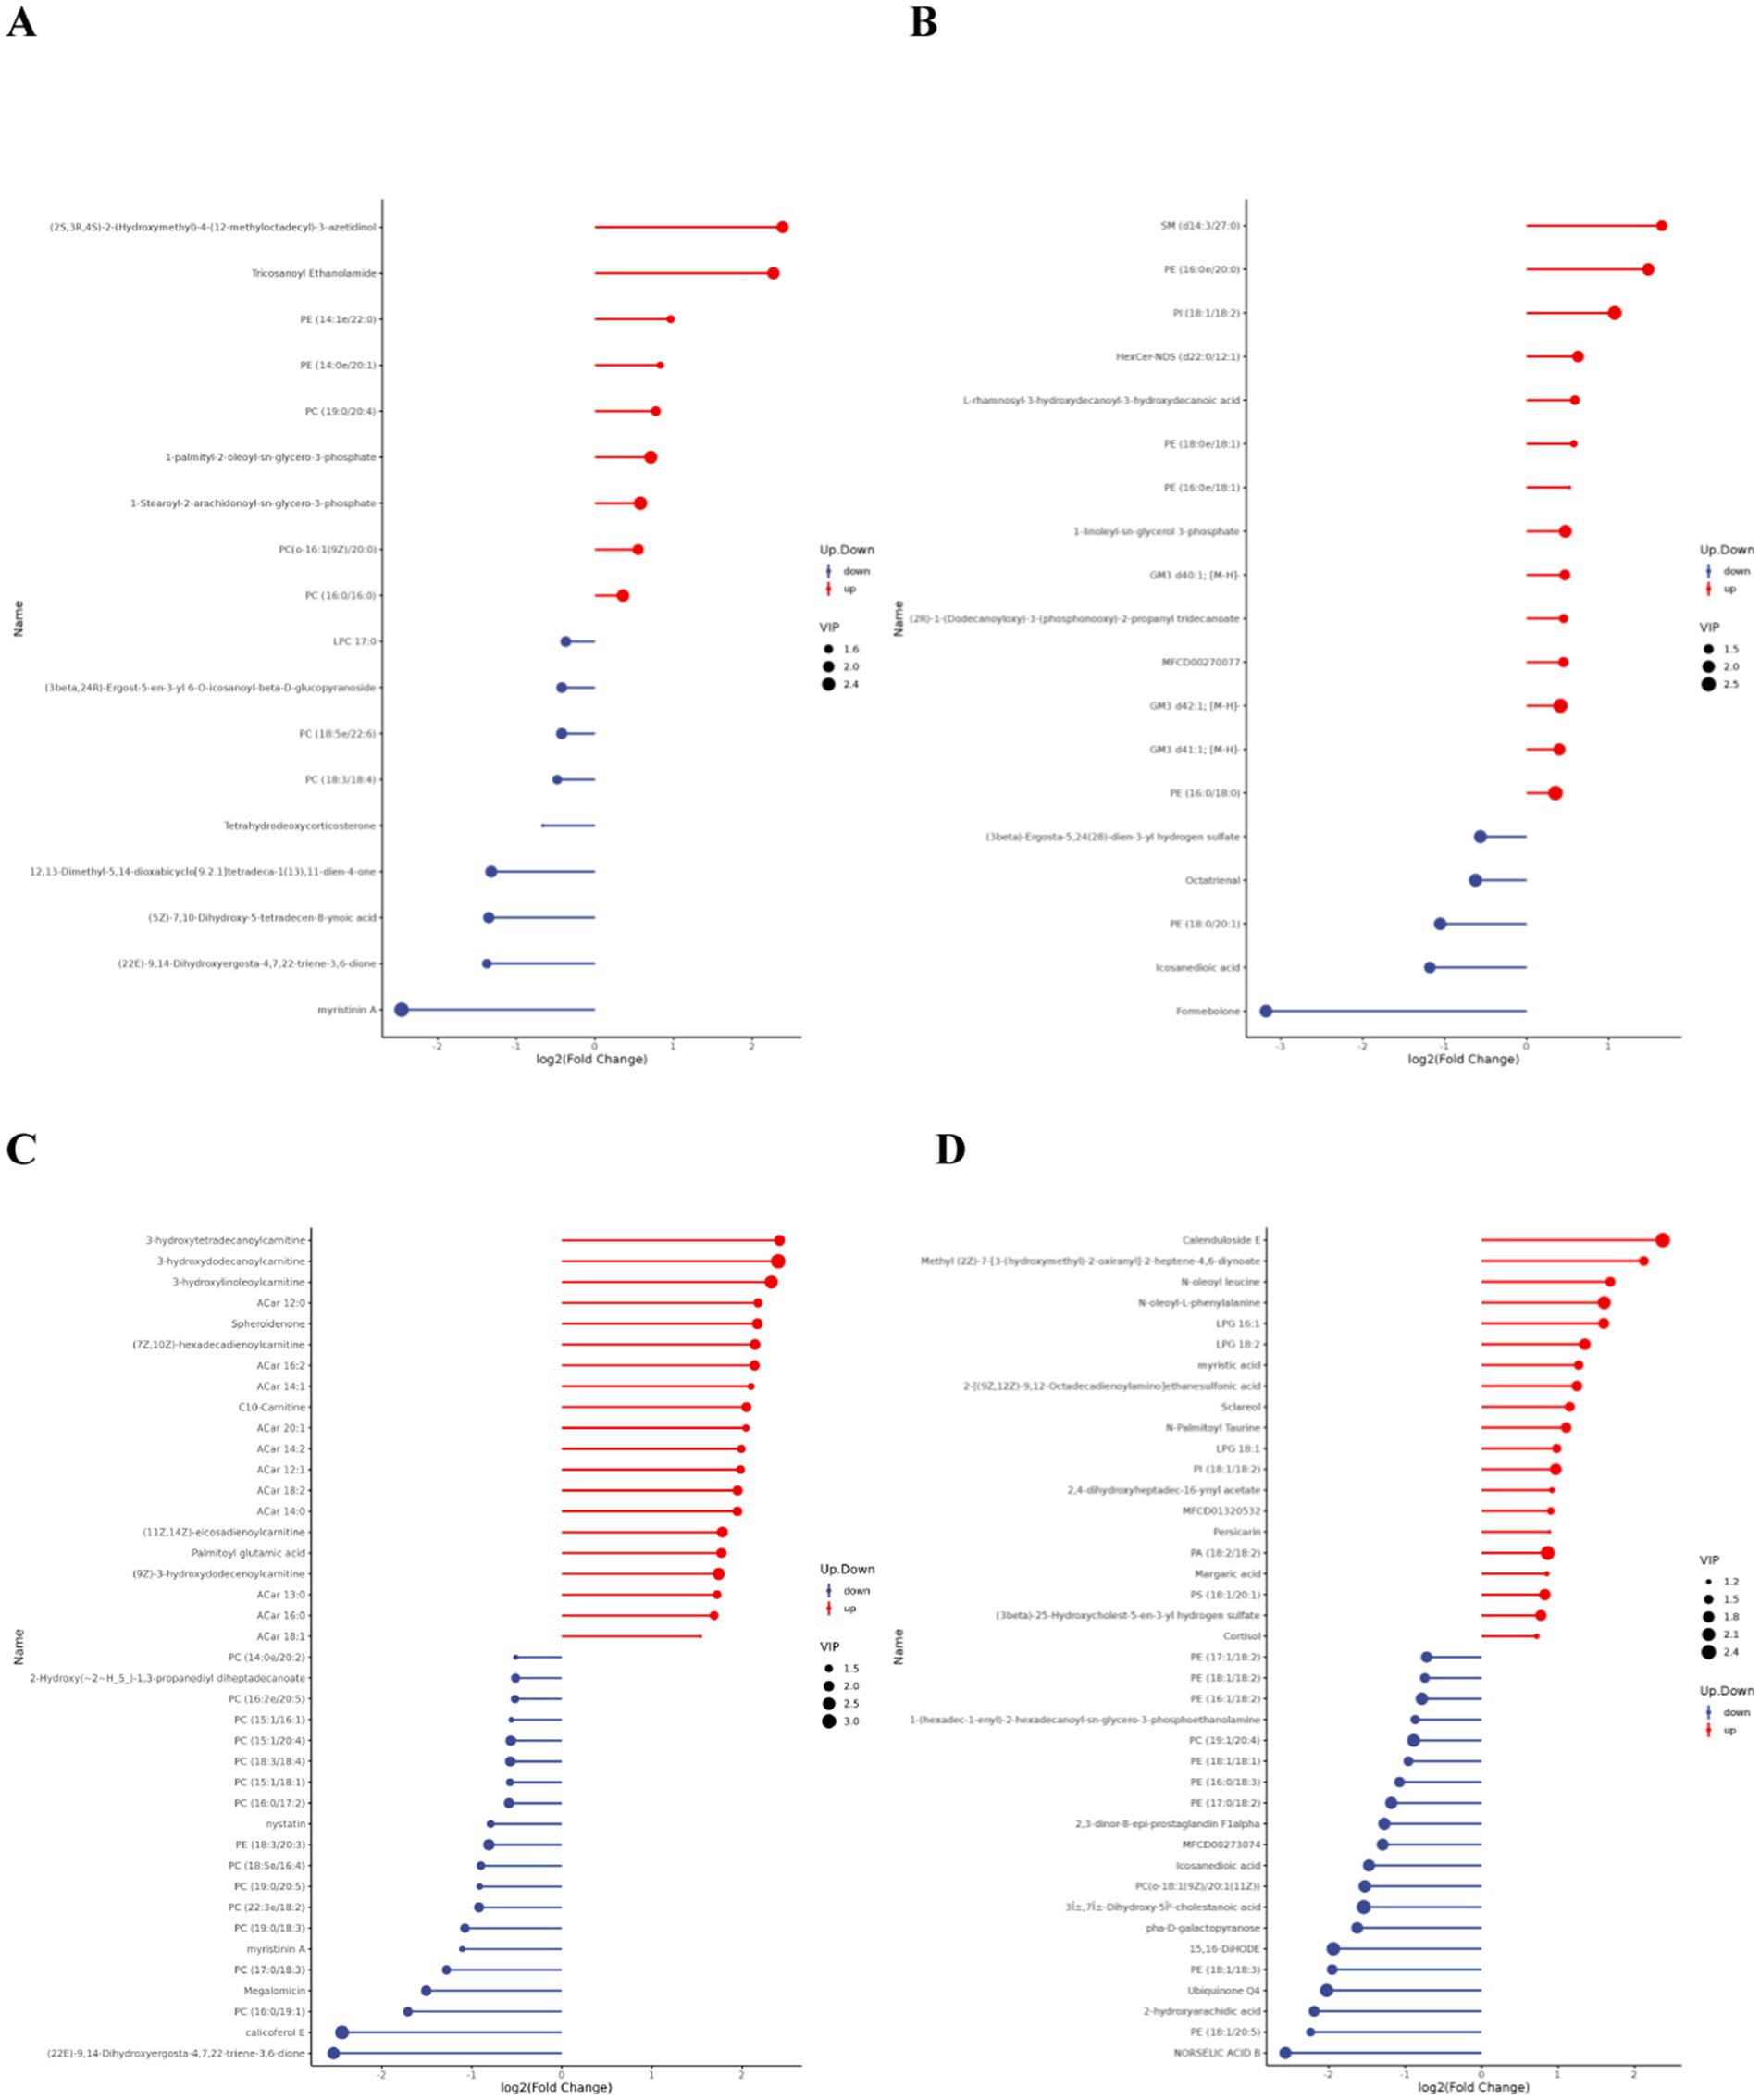
Figure 6. Matchstick diagram of differential lipid metabolites. (A,C) are the difference metabolite changes in the pre- and post-competition comparisons between the excellent and normal groups in the positive mode. (B,D) are the difference metabolite changes in the pre- and post-competition comparisons between the excellent and normal groups in the negative mode.
A total of 18 significantly different lipid metabolites were screened in the pre-game comparison between the excellent group and the normal group in the positive ion mode, of which 9 were up-regulated and 9 were down-regulated (Table 5), and a total of 19 significantly different metabolites were screened in the negative ion mode, of which 14 were up-regulated and 5 were down-regulated (Table 6).
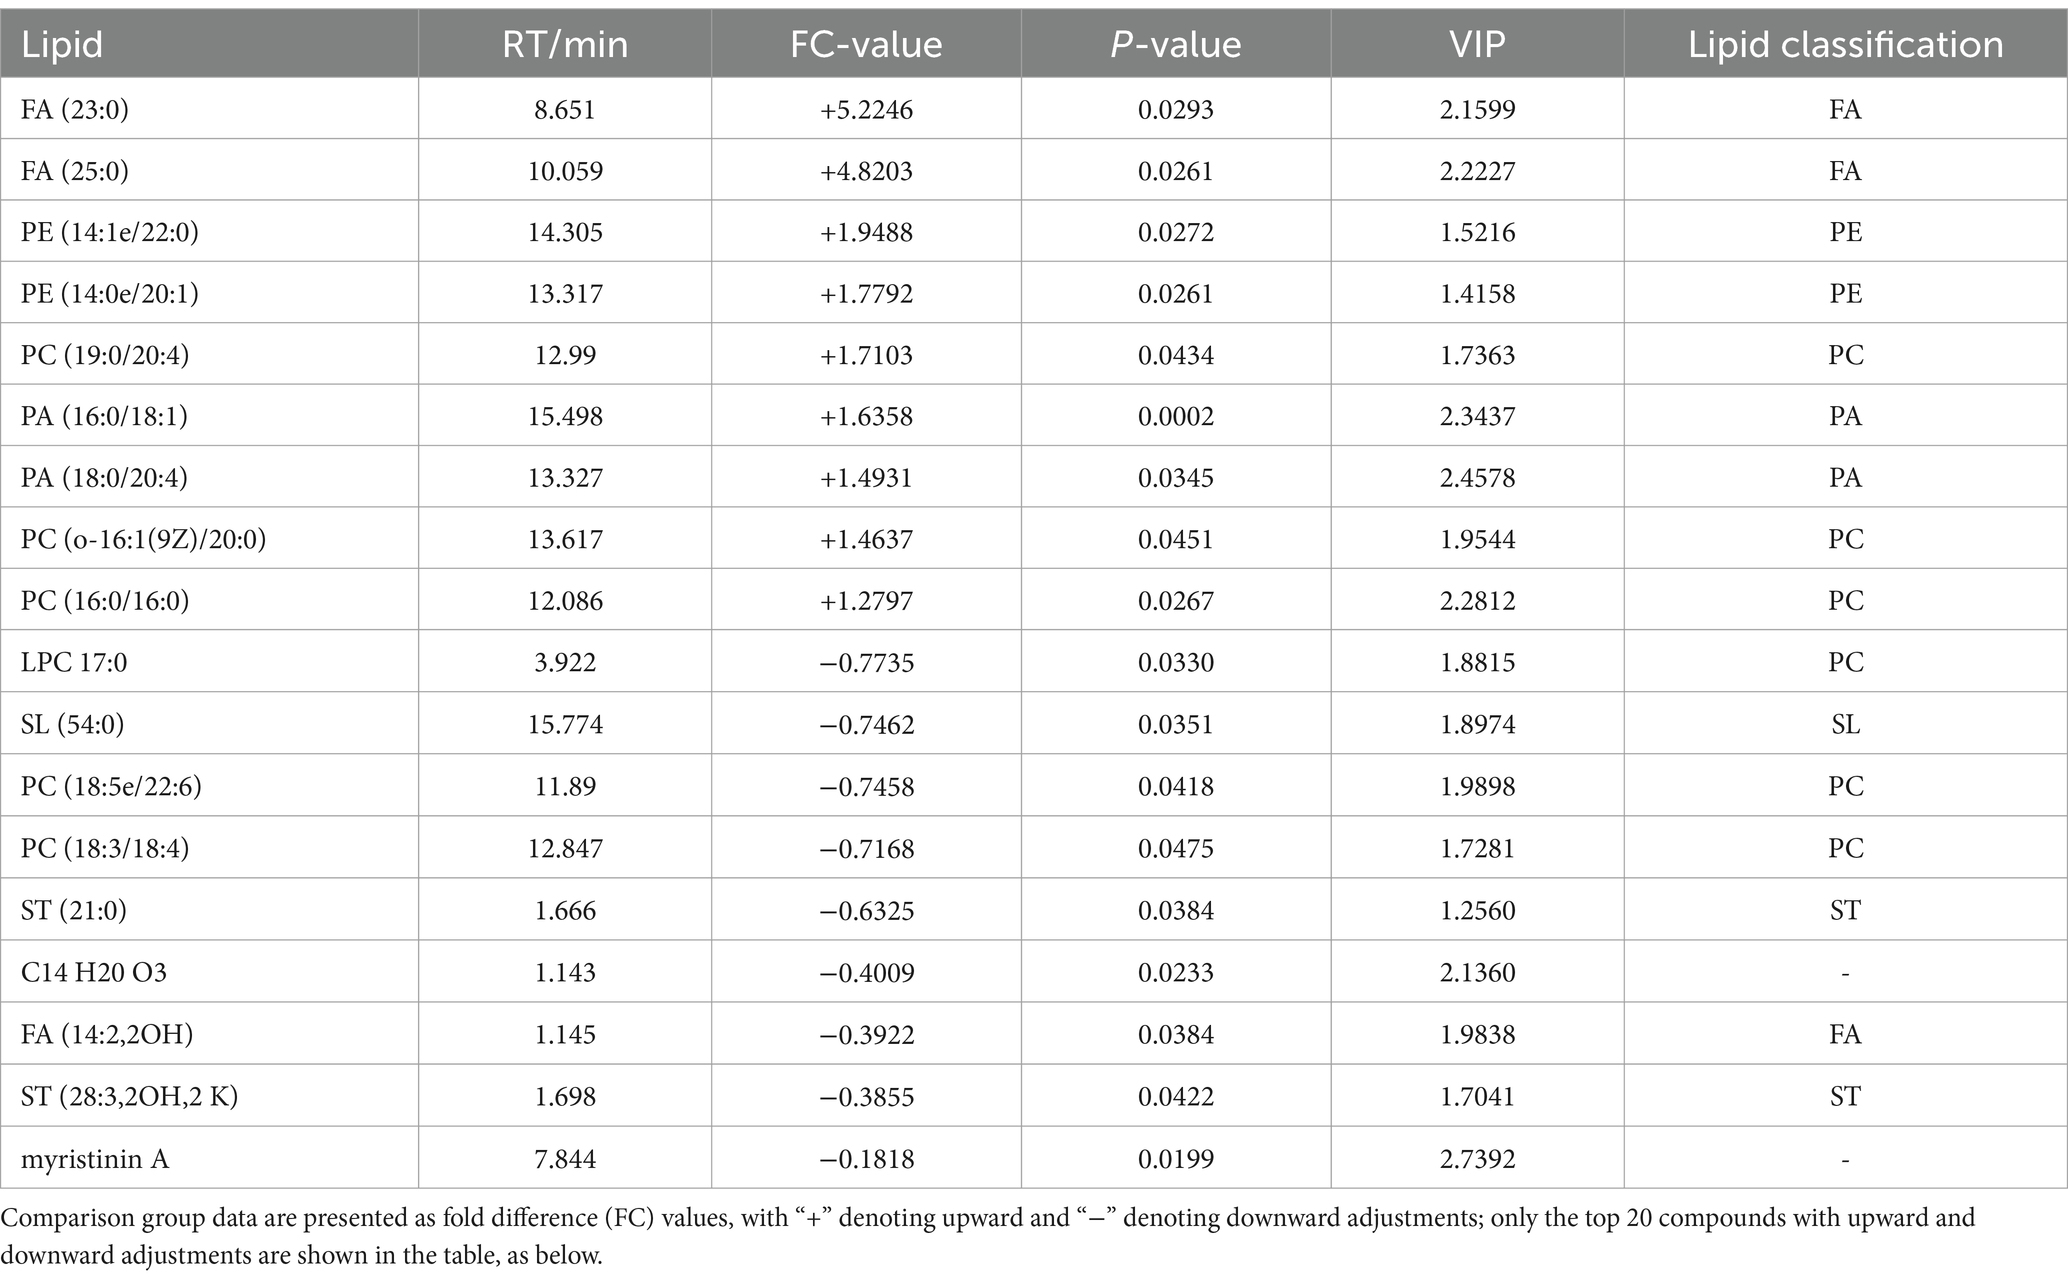
Table 5. Pre-competition differential lipid metabolites (in positive ion mode) in the excellent and average groups.
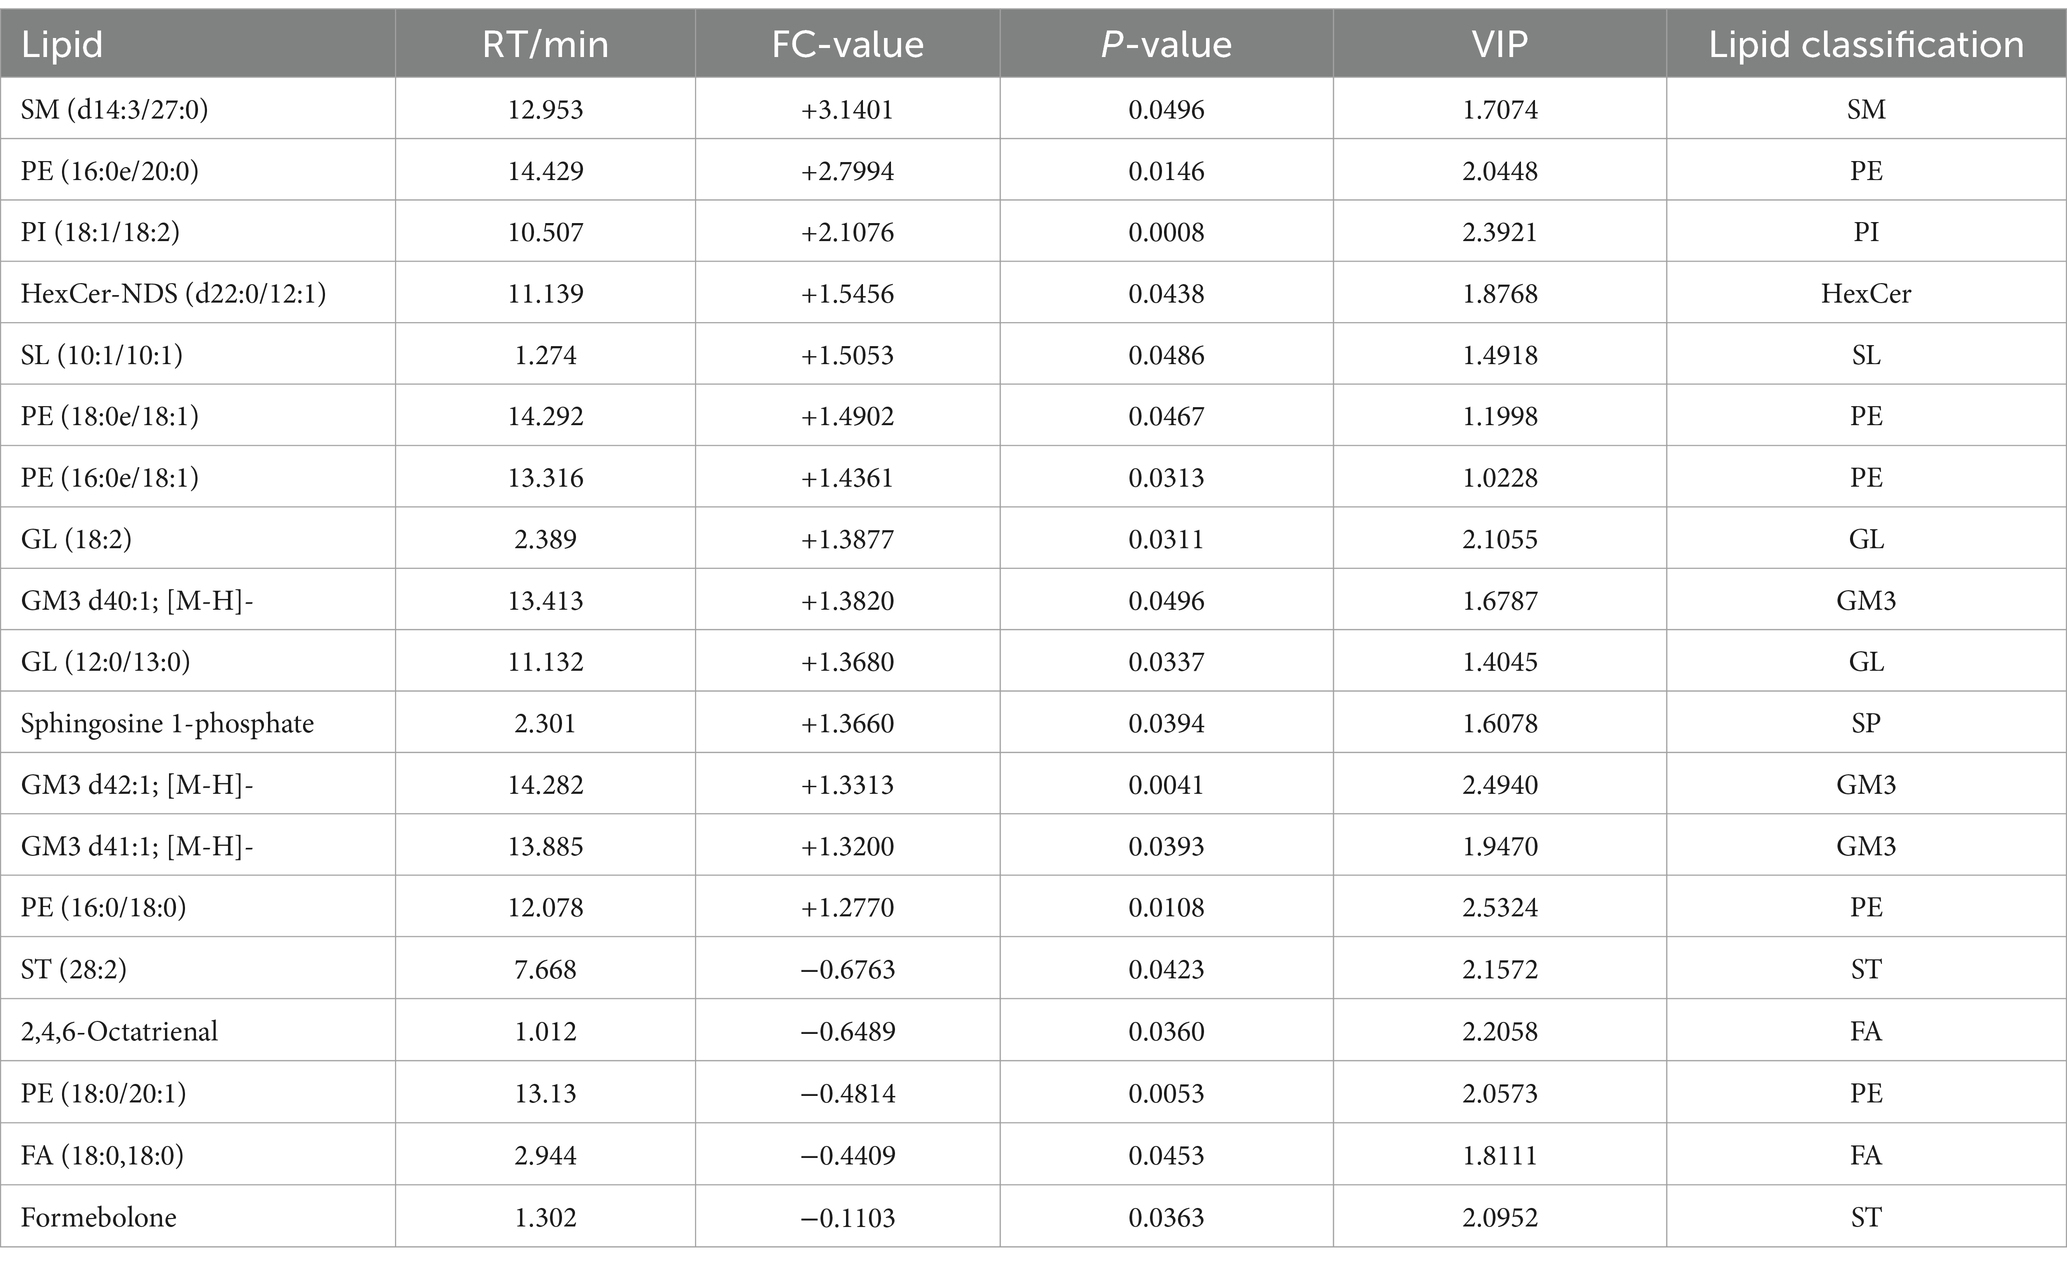
Table 6. Pre-competition differential lipid metabolites (in negative ion mode) in the excellent and average groups.
A total of 75 significantly different lipid metabolites were screened in the post-competition comparison between the excellent group and the normal group in the positive ion mode, of which 52 were up-regulated and 23 were down-regulated (Table 7), and a total of 69 significantly different metabolites were screened in the negative ion mode, of which 36 were up-regulated and 33 were down-regulated (Table 8).
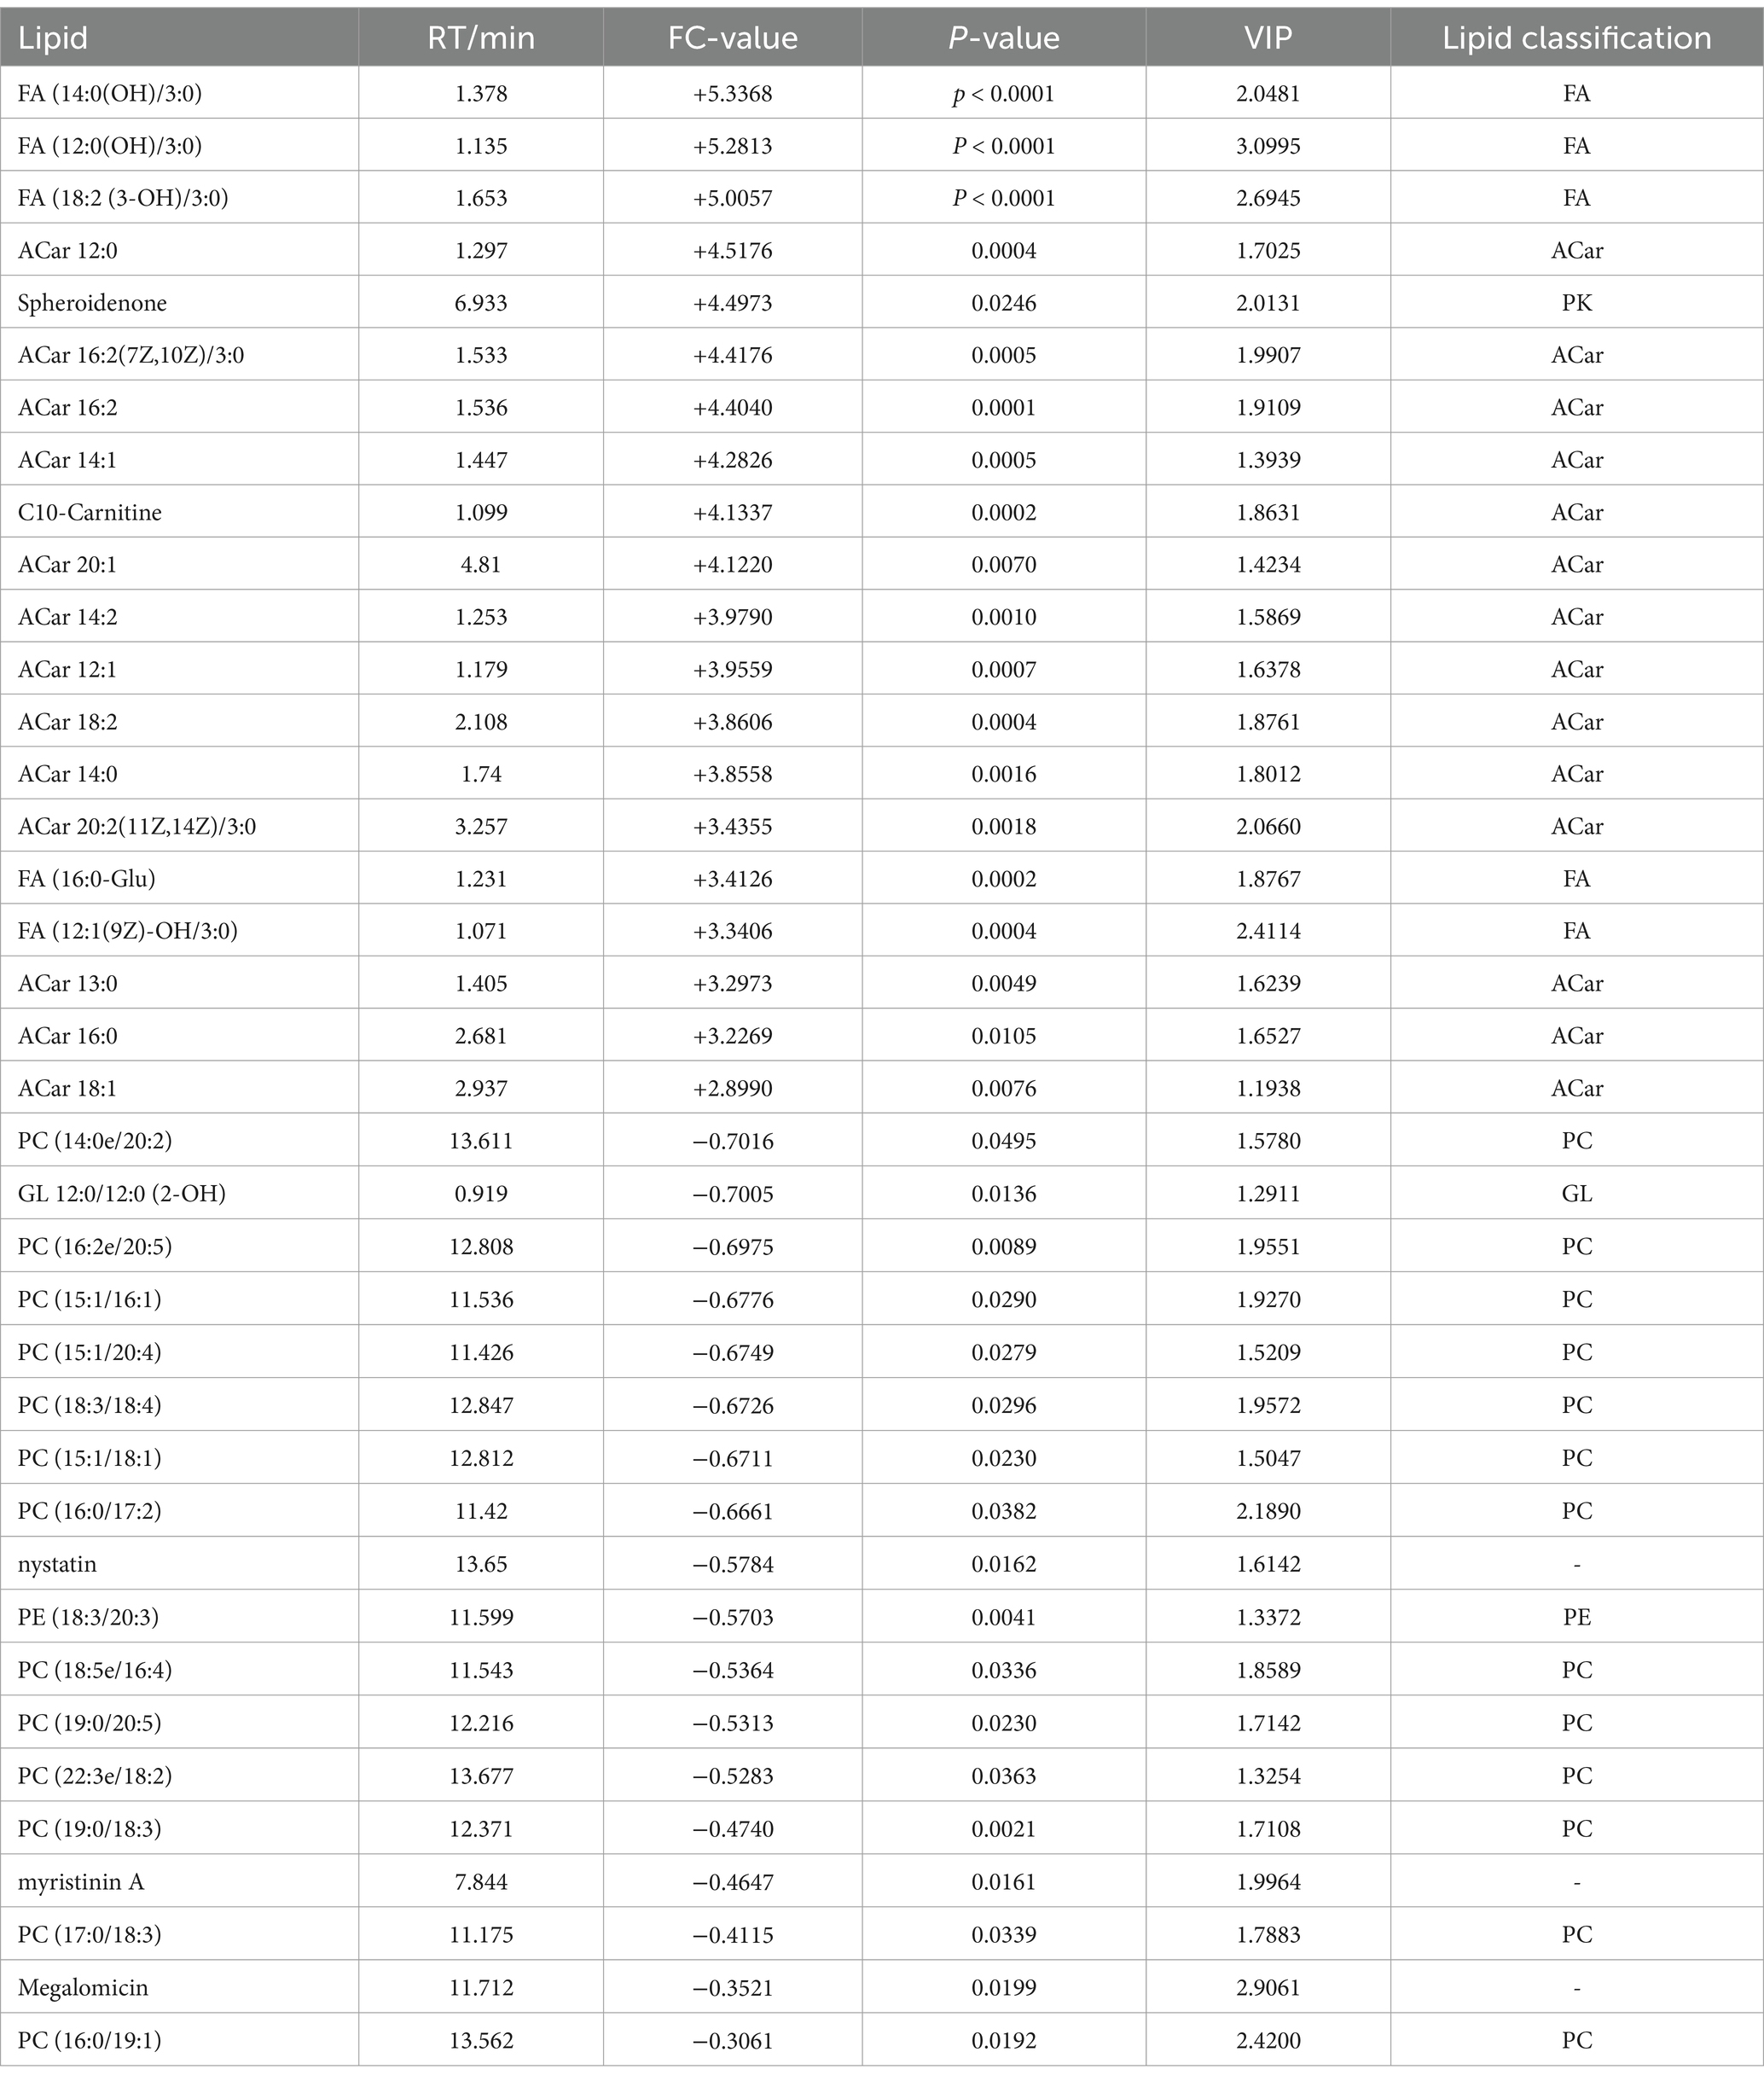
Table 7. Differential lipid metabolites (in positive ion mode) in the immediate post-competition period in the excellent and average groups.
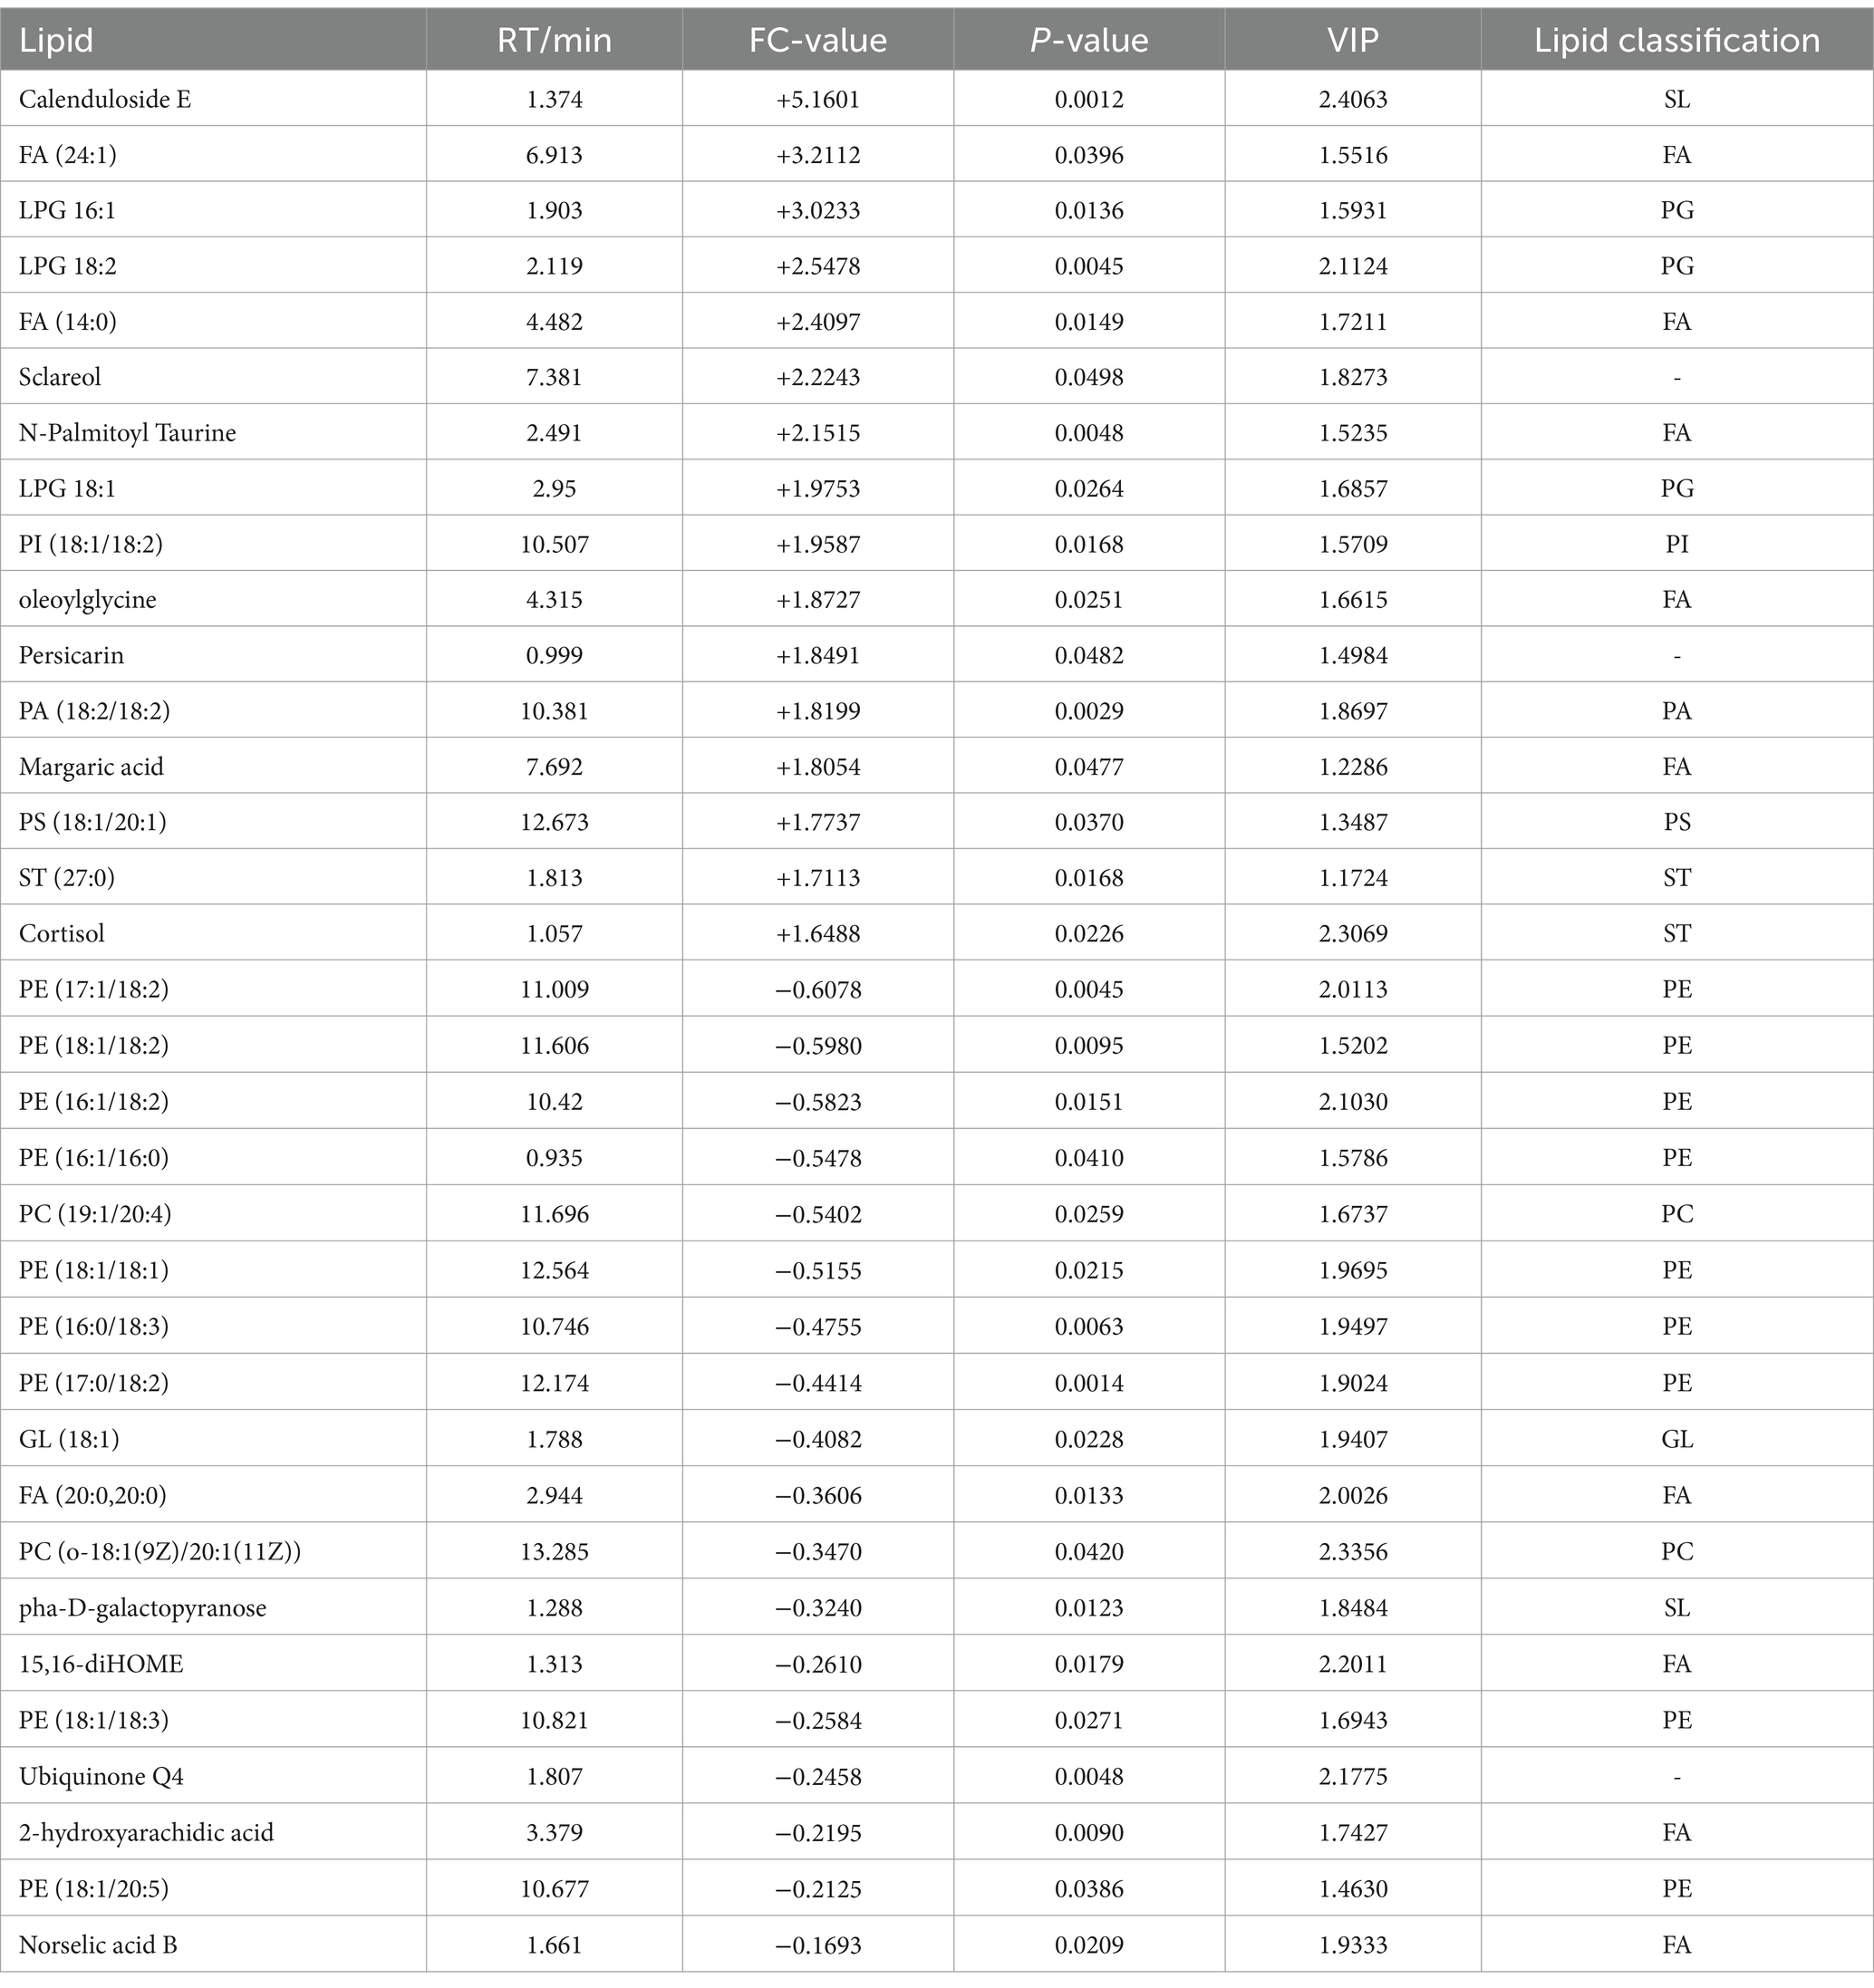
Table 8. Differential post-competition lipid metabolites (in negative ion mode) between the excellent and average groups.
Hierarchical clustering analysis of differential lipid metabolites was performed to derive the differences in metabolic expression patterns between and within two groups for the same comparative pair, vertically for samples and horizontally for compounds, with shorter cluster branches representing higher similarity. As shown in Figure 7, the samples in each group can be well clustered together, and the metabolites with similar variations are clustered in the same cluster, indicating that the hierarchical clustering of metabolites with relative quantitative values between the groups is distinctly differentiated, and that the screening of the different metabolites has a certain degree of reliability.
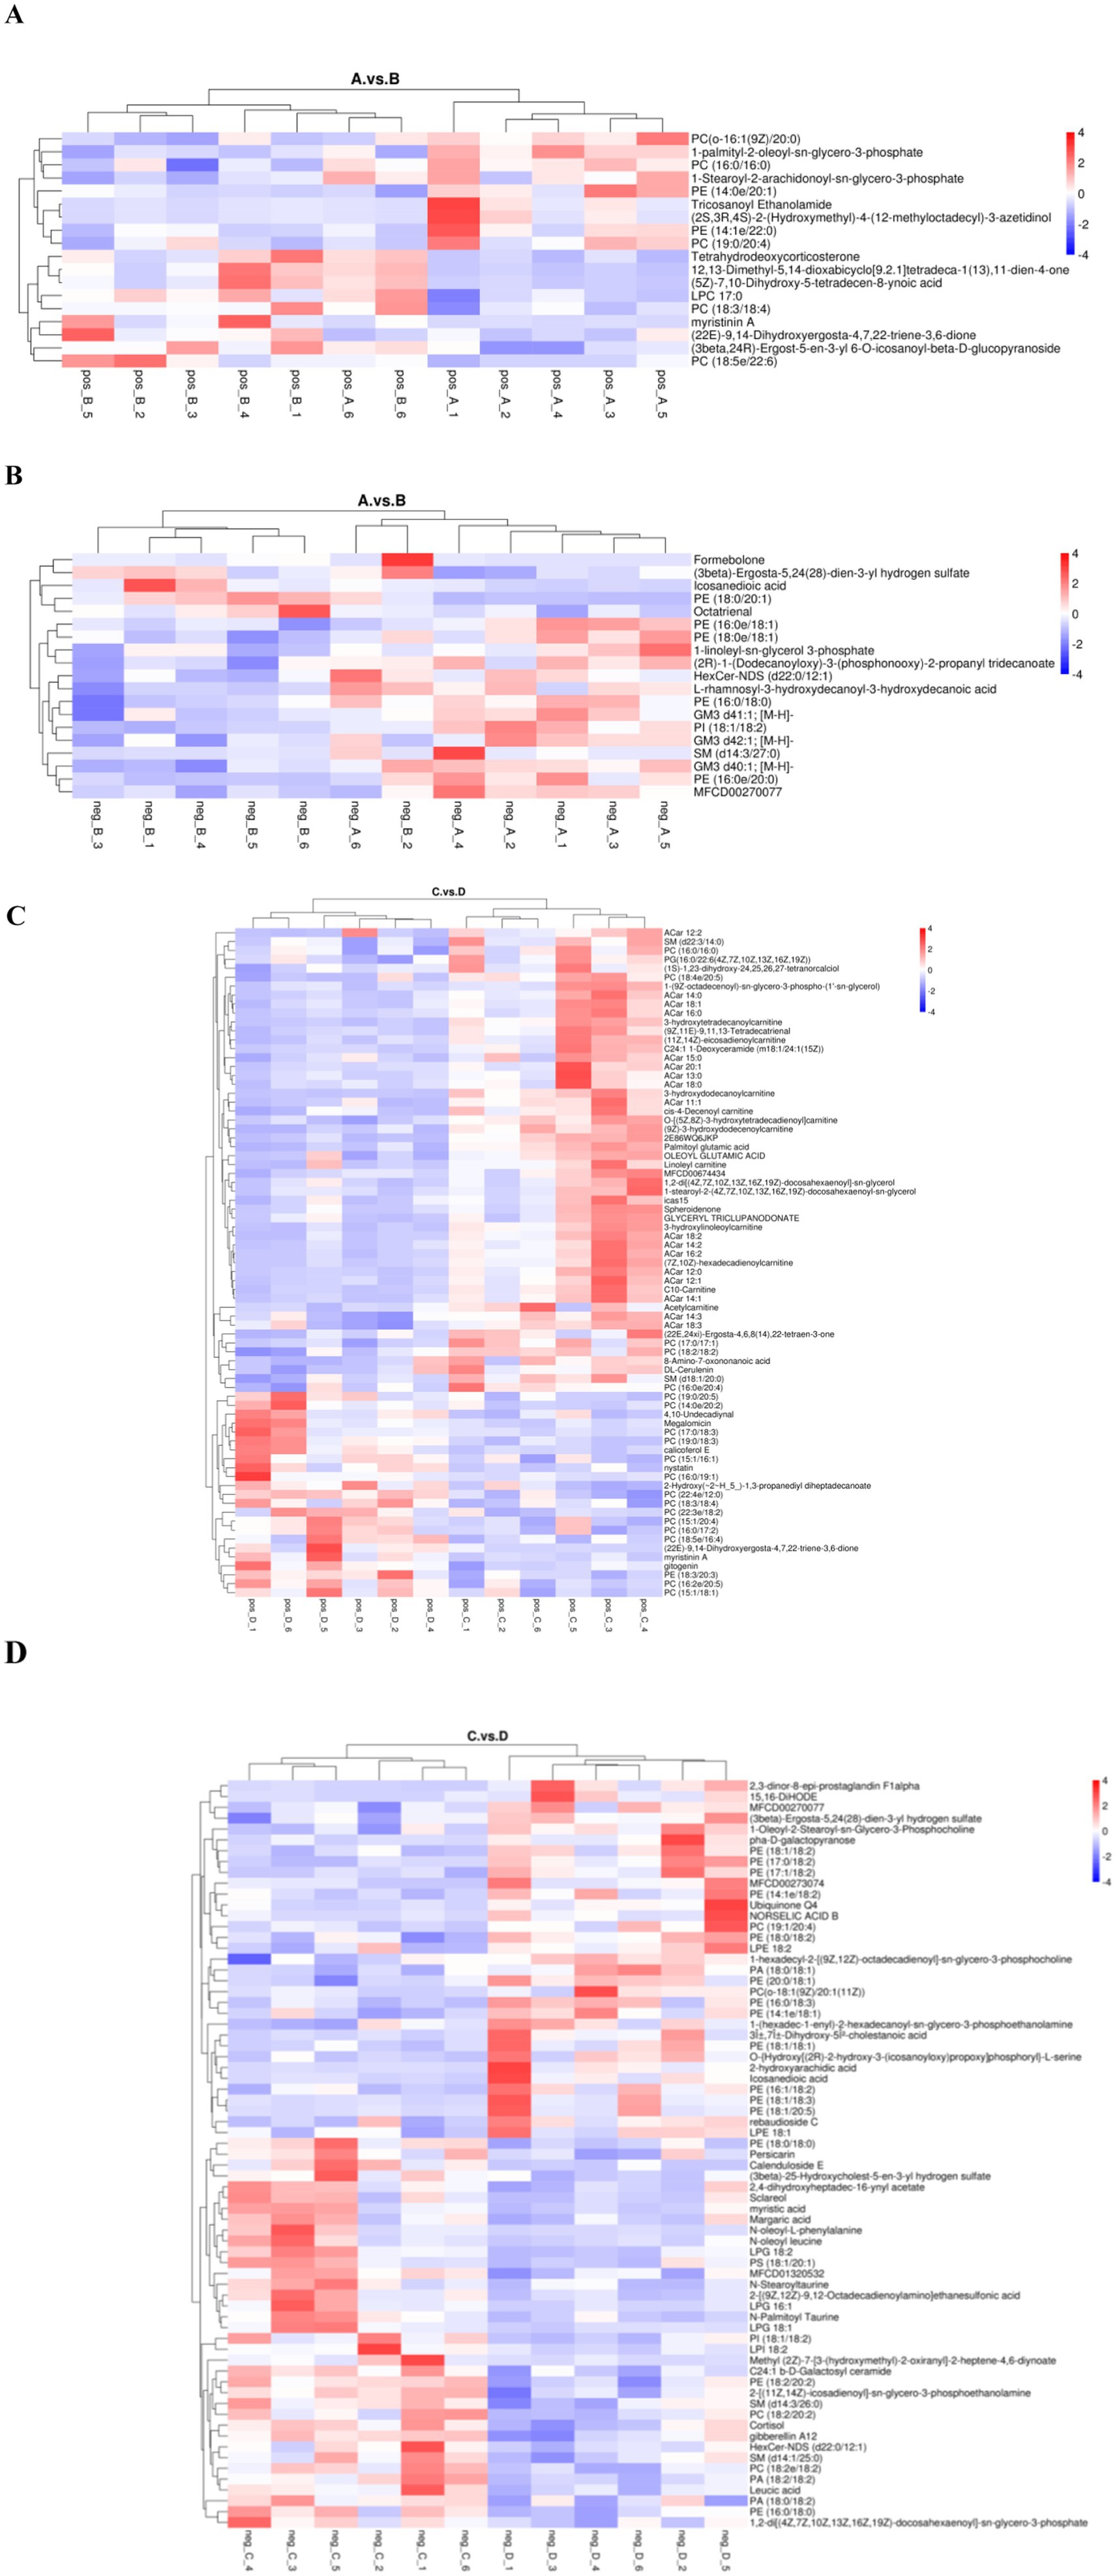
Figure 7. Cluster analysis plot of differential lipid metabolites. (A,C) are pre- and post-game cluster analyses of the excellent and average groups in the positive mode. (B,D) are pre- and post-game cluster analyses of the excellent and average groups in the negative mode.
With the help of hypergeometric test, the p-value of pathway enrichment was obtained, where p-value ≤ 0.05 was used as the threshold, and KEGG pathways meeting this condition were defined as KEGG pathways significantly enriched in differential metabolites and plotted in a bubble diagram (Figure 8). KEGG pathway enrichment analysis can identify the main biological functions exercised by differential metabolites, and a total of seven exercise-related pathways were screened in this study. Differential metabolites were mainly enriched in the post-competition period, and the above metabolites were significantly enriched in the biotin metabolic pathway in the positive ion mode, and in six pathways, namely, steroid hormone biosynthesis, neuroactive ligand-receptor interactions, fatty acid biosynthesis, cortisol synthesis and secretion, bile secretion, and aldosterone-regulated sodium reabsorption, in the negative ion mode.

Figure 8. Bubble diagram of KEGG enrichment analysis. (A) is the bubble plot of immediate post-game KEGG enrichment analysis for the excellent and average groups in the positive mode; (B) is the bubble plot of immediate post-game KEGG enrichment analysis for the excellent and average groups in the negative mode.
3.3.3 Correlation analysis of blood biochemical indices with differential lipid metabolites
The biochemical indices and differential lipid metabolites of the horses in the excellent group vs. the ordinary group before and after the race were correlated, and the correlation between the groups was analysed by calculating pearson correlation coefficients between the biochemical indices and the differential lipid metabolites. The significance level p < 0.05 was chosen as the threshold for significant correlation. When the linear relationship between the two groups is strengthened, the positive correlation tends to be 1 and the negative correlation tends to be −1. Red indicates positive correlation and green indicates negative correlation, and the darker the colour, the closer the correlation is to 1. It can be seen in Figure 9 that the correlation between biochemical indices and differentiated lipid metabolites was relatively weak in the pre-race period, but the correlation was very significantly strengthened and most of them were positively correlated in the post-race period.
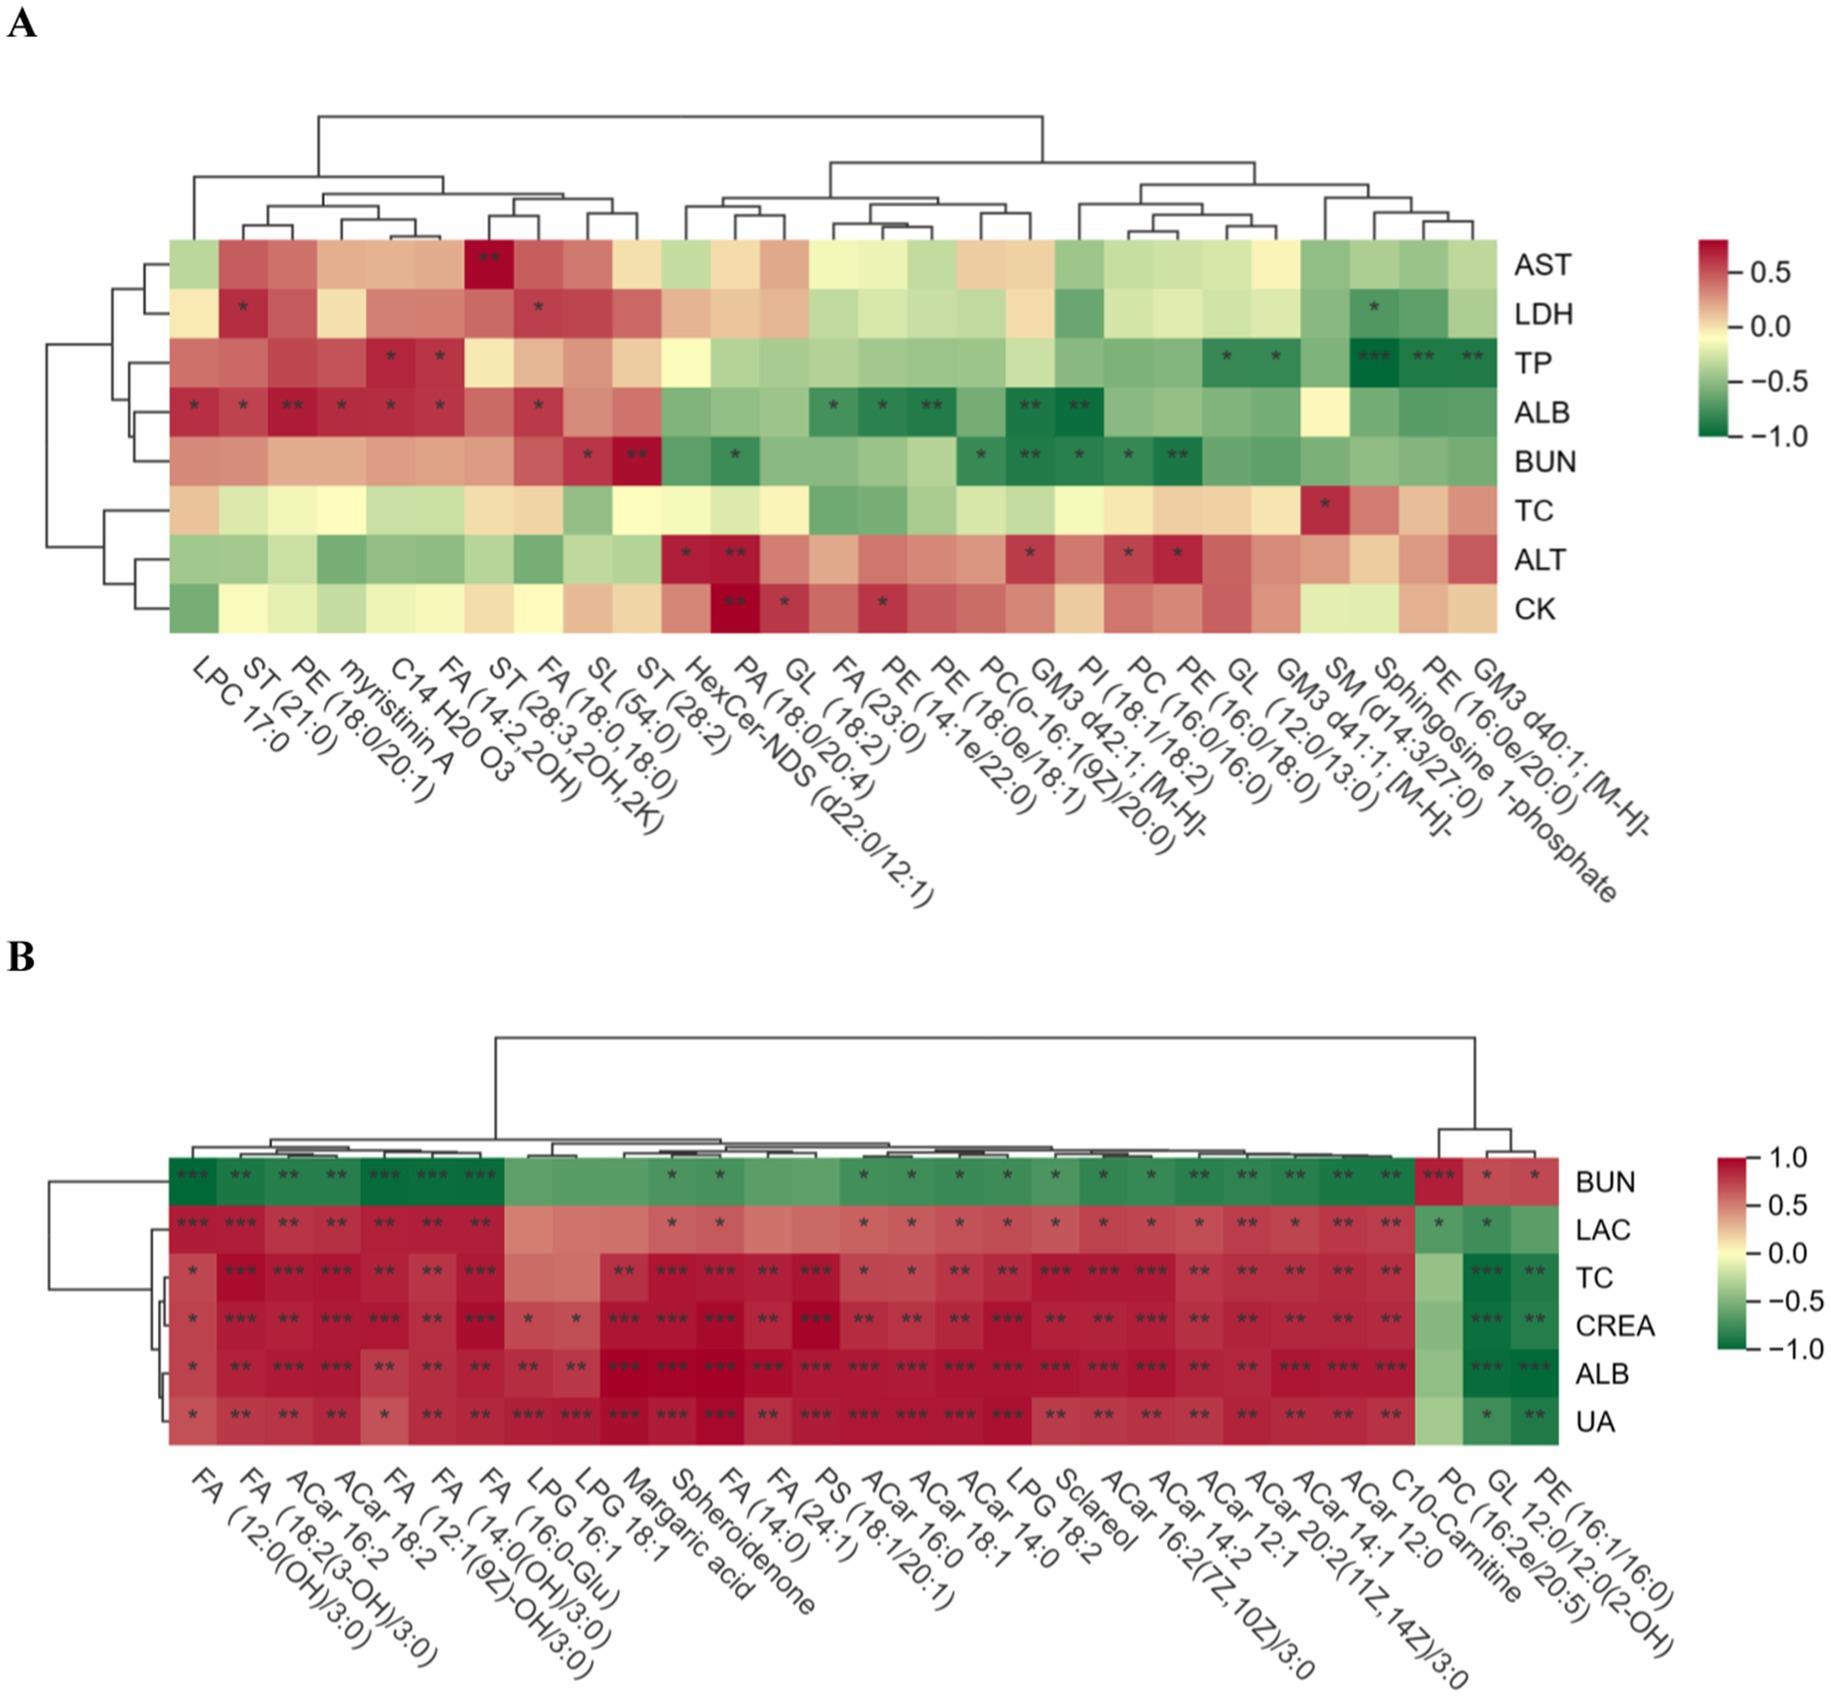
Figure 9. Correlation plot of biochemical indicators and differential lipid compounds. (A) is the pre-competition correlation graph between the excellent and average groups, and (B) is the post-competition correlation graph between the excellent and average groups. (A) “*” in the box in the graph indicates significant, and “**” and “***” indicate highly significant.
4 Discussion
4.1 Differential lipid metabolite analysis of glycerophospholipid (GP) species
GP are major components of biological membranes (23). Phosphatidic acid (PA) is the simplest cytosolic glycerophospholipid and is not abundant in eukaryotic cells (24), which is consistent with the results of the present study in which only nine PAs were found. In blood biochemistry, ALT was significantly higher in the excellent group before the race than in the ordinary group, and it also remained high in the immediate aftermath of the race. There is a relevant literature that shows that ALT is mainly concentrated in the hepatocytes, heart and skeletal muscle. The level of ALT is one of the markers that responds to athletic fatigue, and the significant elevation of ALT is associated with prolonged exercise (25). Normally, lipid metabolism will be activated during and after endurance exercise to provide the energy to cope with the metabolic and physiological related changes in the body produced by prolonged exercise (26), PA is one of the main lipids involved in energy supply, and the content of PA (18:2/18:2) in the excellent group was extremely significantly higher than that of the ordinary group after exercise, which proved that the excellent group possessed a better recovery ability than the ordinary group, and could obtain a greater supply of energy from PA, as well as recovering more quickly after a race to restore the integrity of the cell membrane and the Functionality. In the correlation analysis of pre-competition blood biochemistry and differential lipid metabolites, pre-competition PA (18:0/20:4) showed a significant positive correlation with ALT and CK, and these phenomena may indicate that, compared with the ordinary group, the excellent group, due to long-term systematic training, has skeletal muscle fibres that are more tolerant to high-intensity exercise, which reduces exercise-induced micro-muscle injuries, whereas the muscles of the ordinary group have poorer adaptation and are more prone to excessive release of exercise intensity from ALT, which is also explained by the increase in CK in horses in the excellent group compared to the ordinary group after endurance exercise (27). The values of LDH, CK and AST in the ordinary group before and after exercise were higher than those in the excellent group, but there was no statistical difference, the reason may be that for endurance horses, high-intensity aerobic exercise increases the blood biochemical parameters related to LDH, CK and AST in order to maintain the balance of blood supply to the myocardium (28), and that the values of LDH, CK and AST can be used to diagnose the degree of muscle damage (29), since the horses in the average group have lower physical functioning than the horses in the excellent group, the values of LDH, CK and AST are relatively higher.
Other classes of glycerophospholipids are glycerophospholipids formed by esterification of a phosphate group with several alcohols (choline, ethanolamine, serine, inositol or glycerol): phosphatidylcholine (PC), phosphatidylethanolamine (PE), phosphatidylserine (PS), phosphatidylinositol (PI) and phosphatidylglycerol (PG) (30). In a study by Anna et al. (31), it was found that the levels of lipid metabolites such as PC and PE were significantly reduced in marathon runners after an endurance event, and in the present study, the differential metabolites after the race were found to be significantly lower than the levels of 13 PCs and 6 PEs in the excellent group, and highly significant in the levels of 2 PCs and 4 PEs in the ordinary group. Both before and after the tournament it was found that PCs (18:3/18:4) were significantly downgraded in the excellent group compared to the ordinary group, which may be attributed to the fact that phosphatidylcholine, which contains unsaturated fatty acid chains, is more readily hydrolysed by phospholipase A2 (PLA2) to generate free fatty acids and lysophospholipids at rest (32), which in endurance exercise accelerates fatty acid synthesis used to participate in the subsequent fatty acid oxidation for energy supply. As the main structural components of erythrocyte membranes, fatty acids affect the fluidity and toughness of cell membranes (33, 34). The excellent group had better body quality, more fluid cell membranes, and relatively faster rates of PC synthesis and decomposition compared with the ordinary group, so that the content of PCs (18:3/18:4) was up-regulated in the post-event period compared with that in the pre-event period. Correlation analyses in the excellent and normal groups after the race also found that one of the differential lipid metabolites, PE (16:1/16:0), was significantly negatively correlated with ALB, which proved that there was a link between the increase in ALB levels and the decrease in lipid metabolites, such as PE, after endurance exercise, and it was hypothesised that the decrease in the levels of PC and PE in the excellent group after the race was probably due to the fact that horses in the excellent group were more rapid in the rate of lipolysis, and the ability to use fatty acid oxidation to produce energy was higher than that of the excellent group, so that PC levels were upwardly adjusted to that before the race. The ability to use fatty acid oxidation to produce energy is higher than that of the average group. It is noteworthy that studies for PC (18:3/18:4) have only been reported in potato and hepatocellular carcinoma cells (35–37), and few have been reported in horses. As potential biomarkers of endurance performance in Yili horses that we identified, the mean pre-race PC (18:3/18:4) concentration in the excellent group in the present study was 19964513.22 nmol/mL, and the mean post-race concentration was 19607265.4 nmol/mL; the mean pre-race concentration in the ordinary group was 27850938.95 nmol/mL, and the mean post-race concentration was 29152678.27 nmol/mL.
ALB was significantly higher in the ordinary group than in the excellent group before the endurance event, but was significantly higher in the excellent group than in the ordinary group after the event, and the reason for this result may be the difference in the physical quality of the horses. The main energy-supplying substance for prolonged endurance exercise is fat, and due to the poor water solubility of fatty acids, they are mainly transported in the blood with albumin as the carrier, and the body mobilises fatty acids in large quantities during exercise, resulting in an increase of albumin in the plasma (38). In lipid metabolomics, the level of PI (18:1/18:2) was significantly higher in the excellent group before and after the race than in the ordinary group race, but the FC value was 0.1323 higher before and after the race. PI is a precursor of second messenger molecules and can be hydrolysed to produce the second messenger molecules diacylglycerol (DAG), inositol-1,4,5-trisphosphate and arachidonic acid, which are bioactive molecules precursors (39), so both the excellent and the normal groups provide energy to the body by hydrolysis of PI to produce DAG and other substances during the race, but the excellent group has a greater ability to hydrolyse PI compared to the normal group. PI (18:1/18:2) was also used as a candidate biomarker, which has also been reported only in chicken studies (40), and our results showed that the mean pre-race and post-race concentrations of PI (18:1/18:2) in the excellent group were 64300201.46 nmol/mL, and 65856564.96 nmol/mL, respectively; and the mean pre-race and post-race concentrations of PC in the ordinary group were 30509304.84 nmol/mL, 33623235.9 nmol/mL. Meanwhile, through the correlation analysis of pre-race biochemistry and lipidomics, PI (18:1/18:2) was significantly negatively correlated with ALB, indicating that the increase of ALB after the race was accompanied by the decrease of PI level, and the difference of ALB between the excellent group and the ordinary group showed that the body fat of the excellent group provided more fatty acids than that of the ordinary group, which required more albumin as a carrier for transport.
4.2 Differential analysis of lipid metabolites of fatty acid (FA) species
It has been shown that FA play a crucial role in the athlete’s organism, and aerobic exercise increases FA mobilisation in adipose tissue and lipid transport between organs and tissues, improves insulin sensitivity and mitochondrial optimisation, and promotes FA oxidation as an energy substrate (33, 34). FA synthesis is regulated by the enzyme acetyl-coenzyme A carboxylase (ACC), and oxidation of FA produces acetyl-coenzyme A NADH, and FADH2, which are oxidatively phosphorylated to produce ATP (41). In this study, six FAs, including FA (20:0,20:0) and FA (14:0), were highly significant higher than those of the general group and four FAs were significantly higher than those of the general group after the race in the excellent group, which may indicate that the fatty acid mobilisation as well as lipid transport capacity of the horses in the excellent group was significantly higher than that of the ordinary group, and that the oxidation of fatty acids was fully utilised to produce energy for the organism’s energy supply in endurance exercise. CREA is a product of muscle metabolism, and is closely related to the CREA is a product of muscle metabolism, which is closely related to the total amount of muscle in the body (42, 43). In the correlation analysis of biochemical indexes and differential lipid compounds after the race, six differential lipid metabolites, including FA (18:2(3-OH)/3:0), FA (12:1(9z)-OH/3:0), FA (16:0-Glu), and FA (14:0), were positively correlated with CREA, which suggests that the horses are more capable of mobilising fatty acids during endurance exercise than the ordinary group. Lipids stored in the myocytes of horses during endurance exercise are also involved in oxidative energy supply (44), while horses in the excellent group have more muscle mass and relatively higher creatinine production rate and fatty acid oxidative capacity than those in the ordinary group. Meanwhile, the present study found that the level of 15,16-diHOME decreased significantly after the race. 15,16-diHOME is a lipofactor which contributes to the enhancement of FA oxidation for early recovery of skeletal muscle (45), and its regulatory mechanism remains to be further investigated.
Acylcarnitines (ACar) are FAs bound to carnitine, an amino acid derivative that allows FAs transported to mitochondria to be oxidised and contributes to cellular energy conversion. It has been demonstrated that acute endurance exercise causes an increase in acylcarnitines (21), which is consistent with the results of the present study where no statistically significant differences in acylcarnitine content were detected in the pre-race comparison, while a highly significant increase in 14 ACar, including ACar 16:2, ACar 14:1, and C10-Carnitine, was observed in the post-race. The highly significant difference in ACar levels between the two groups of horses after endurance events is likely to be related to the accelerated glycogen depletion and increased reliance on lipolysis for ATP production during endurance events (12). Increased lipolysis leads to higher FA concentrations and subsequently to higher ACar concentrations in the mitochondria, and horses in the ordinary group had lower fat mobilisation and oxidised lipids due to the longer duration of the race and faster glycogen depletion leading to highly significant differences in ACar levels with the excellent group. After high intensity exercise, the increase in ALB content contributes to the retention of fluid in the circulating fluid to maintain homeostasis (46), while ALB was highly significantly and positively correlated with 10 ACar including ACar16:2, ACar18:2, and ACar16:0 after the race, and these findings further suggest the need to pay attention to the oxidative capacity of equine athletes with respect to lipid oxidation for the purpose of better performance in endurance races.
4.3 Differential analysis of lipid metabolites of sphingolipid (SP) species
Alterations in SP metabolism and its metabolites lead to mitochondrial dysfunction, autophagy damage, β-amyloid dysregulation, and disruption of neuronal homeostasis, which further leads to an increase in reactive oxygen species (ROS) production (47). Sphingomyelin (SM) is the most abundant SP in cells and is ubiquitously distributed in mammalian tissues; SM is an essential element of the plasma membrane and its level is critical for cellular function. In the present study, a statistically significant difference in SM (d14:3/27:0) was detected between the two groups of horses before the endurance event, but no statistically significant difference in SM was detected after the event, which may be attributed to the fact that high-intensity endurance exercise depletes most of the SM used to participate in cellular repair. SM can be converted to ceramide (Cer) by neutral sphingomyelinase (NSM) and acidic sphingomyelinase (ASM). Cer is the simplest SM, a second messenger for lipids, and a precursor of several complex sphingolipids that regulate cell growth and apoptosis (48). No significant difference in Cer was detected between pre-race and post-race in the two comparisons, which may indicate that there is no significant difference in Cer consumption between horses of different exercise levels in a 26 km endurance race.
Gangliosides (GM) are sphingolipid-containing salivary acids that are polymorphic in structure and function and are widely distributed in the human body (49). Three differentially significant GM3 were detected in the excellent group compared to the ordinary group before the race, and not detected after the race, the reason may be that acute endurance exercise caused GM to regulate the body’s immune function resulting in a decrease in GM levels, and the differentially differentiated lipid compounds GM3d42:1 were also found in the correlation analysis of biochemical indexes and plasma differentially differentiated lipid compounds before the race; the significant negative correlation between [M-H]- and ALB, and it is also it can be further suggested that horses in the excellent group possessed better organismal immune regulation compared to horses in the ordinary group, which may have an effect on the performance in endurance races.
4.4 Analysis of lipid metabolism signalling pathways
Both long-distance and short-distance competitions cause the horse to develop a stress response during exercise, and cortisol, a hormone closely related to stress, plays a crucial role in exercise (50). Elevated levels of cortisol produce a range of physiological effects that help the body to adapt to prolonged stimulation, but at the same time excess cortisol disrupts the balance between anabolic and catabolic hormones and increases fatigue in exercising horses (51). The reason why the different metabolites in the synthesis and secretion of cortisol signalling pathway were enriched in the excellent group and the ordinary group after the race may be that horses with different sport performance, under prolonged and high-intensity exercise, all need to adapt to the stimulation of the organism by endurance racing through the secretion of cortisol, but it is possible that the ordinary group is not as good as the excellent group at regulating the stimulation of the organism, and so compared with the excellent group, the ordinary group needs to synthesise more cortisol to adapt to the to the stimulation caused by the endurance race.
Following exercise tolerance, differential lipid metabolites are enriched in the pathway, aldosterone, which regulates the reabsorption of Na+. Aldosterone is a steroid hormone that regulates renal reabsorption of Na+ and therefore plays an important role in the maintenance of water-salt balance (52). Prolonged exercise expels a large amount of sweat resulting in dehydration of the body, which increases fatigue (53) and in severe cases results in the inability of the horse to run the full distance. In this endurance race, the average time to complete the race in the ordinary group was higher than that of the excellent group by 1,133 s, indicating that the ordinary group relied more on aldosterone regulation than the excellent group to maintain the water-salt balance of the body during the race.
Fatty acid biosynthesis is a pathway for the production of fatty acids and involves a variety of enzymes (54). In the analysis of fatty acid metabolites in the present study, it was found that the dependence of horses on fatty acid oxidation as an energy substrate for organismal function increased considerably during long-distance exercise, obtaining energy through the fatty acid biosynthesis pathway.
Alonso et al. (55) on bile acid metabolism mentioned that exercise has a large effect on bile acid metabolism. In the present study, the significant enrichment of differential lipid metabolites in the metabolic pathway of bile secretion may be explained by the fact that endurance exercise led to a decrease in the serum concentration of total bile acids, which in turn caused bile secretion.
5 Conclusion
In this study, we focused on the differences in lipid metabolic profiles and biochemical compositions of blood before and after endurance races in Yili horses with different exercise performance through the application of lipid metabolomics and biochemical indicators. A total of 1,537 differential lipid metabolites were screened out, which were relatively concentrated in glycerophospholipids, fatty acids and sphingolipids. These differential lipid metabolites were mainly enriched in metabolic and signalling pathways such as fatty acid biosynthesis, cortisol synthesis and secretion, bile secretion, aldosterone regulation of sodium reabsorption, biotin metabolism, steroid hormone biosynthesis, and neuroactive ligand-receptor interactions. Meanwhile, PC (18:3/18:4) and PI (18:1/18:2) were screened as potential biomarkers to identify the endurance exercise performance of Yili horses, but their specific regulatory mechanisms need to be further investigated. These findings could contribute to the improvement of equine endurance performance and endurance breed selection.
Data availability statement
The original contributions presented in the study are included in the article/supplementary material, further inquiries can be directed to the corresponding author.
Ethics statement
The animal studies were approved by Animal Welfare and Ethics Committee of Xinjiang Agricultural University/Xinjiang Agricultural University. The studies were conducted in accordance with the local legislation and institutional requirements. Written informed consent was obtained from the owners for the participation of their animals in this study.
Author contributions
XC: Data curation, Validation, Writing – original draft, Software, Investigation, Writing – review & editing. ZZ: Software, Writing – review & editing, Writing – original draft, Data curation, Validation. XY: Writing – review & editing, Funding acquisition, Methodology, Supervision. JM: Software, Funding acquisition, Resources, Writing – review & editing, Project administration. WR: Validation, Visualization, Funding acquisition, Conceptualization, Writing – review & editing. YZ: Formal analysis, Resources, Methodology, Project administration, Writing – review & editing, Funding acquisition, Conceptualization, Supervision.
Funding
The author(s) declare that financial support was received for the research and/or publication of this article. Major Science and Technology Special Project of Xinjiang Uygur Autonomous Region (2022A02013-1); Central Guided Local Science and Technology Development Funds Project (ZYYD2025JD02); Xinjiang Uygur Autonomous Region Natural Science Foundation for Young Scientists (2024D01B40); Key Laboratory of Horse Breeding and Exercise Physiology of Xinjiang, Project (XJMFY202401).
Acknowledgments
Extend sincere gratitude to the Xinjiang Horse Industry Association for their invaluable support in facilitating this sampling process and for providing essential horse passport information.
Conflict of interest
The authors declare that the research was conducted in the absence of any commercial or financial relationships that could be construed as a potential conflict of interest.
Generative AI statement
The author(s) declare that no Gen AI was used in the creation of this manuscript.
Publisher’s note
All claims expressed in this article are solely those of the authors and do not necessarily represent those of their affiliated organizations, or those of the publisher, the editors and the reviewers. Any product that may be evaluated in this article, or claim that may be made by its manufacturer, is not guaranteed or endorsed by the publisher.
Footnotes
References
1. Zhou, Q, Ghorasaini, M, Cornelis, FMF, Assi, R, de Roover, A, Giera, M, et al. Lipidomics unravels lipid changes in osteoarthritis articular cartilage. Ann Rheum Dis. (2025). doi: 10.1016/j.ard.2025.01.009
2. San-Millán, I, Stefanoni, D, Martinez, JL, Hansen Kirk, C, D’Alessandro, A, and Nemkov, T. Metabolomics of endurance capacity in world tour professional cyclists. Front Physiol. (2020) 11:578–94. doi: 10.3389/fphys.2020.00578
3. Wang, F, Wanyu, W, He, X, Qian, P, Chang, J, Lu, Z, et al. Effects of moderate intensity exercise on liver metabolism in mice based on multi-omics analysis. Sci Rep. (2024) 14:31072–84. doi: 10.1038/s41598-024-82150-y
4. Xiang, K, Qin, Z, Zhang, H, and Liu, X. Energy metabolism in exercise-induced physiologic cardiac hypertrophy. Front Pharmacol. (2020) 11:1135–48. doi: 10.3389/fphar.2020.01133
5. Pakula, PD, Halama, A, AlDous, EK, Johnson, SJ, Filho, SA, Suhre, K, et al. Characterization of exercise-induced hemolysis in endurance horses. Front Vet Sci. (2023) 10:1115776–84. doi: 10.3389/fvets.2023.1115776
6. Bonhomme, MM, Patarin, F, Kruse, CJ, François, AC, Renaud, B, Couroucé, A, et al. Untargeted metabolomics profiling reveals exercise intensity-dependent alterations in thoroughbred Racehorses' plasma after routine conditioning sessions. ACS Omega. (2023) 8:48557–71. doi: 10.1021/acsomega.3c08583
7. Klein, DJ, KH, MK, Mirek, ET, and Anthony, TG. Metabolomic response of equine skeletal muscle to acute fatiguing exercise and training. Front Physiol. (2020) 11:110–24. doi: 10.3389/fphys.2020.00110
8. Mouskeftara, T, Kalopitas, G, Liapikos, T, Arvanitakis, K, Theocharidou, E, Germanidis, G, et al. Lipidomic analysis of liver and adipose tissue in a high-fat diet-induced non-alcoholic fatty liver disease mice model reveals alterations in lipid metabolism by weight loss and aerobic exercise. Molecules. (2024) 29:1494–511. doi: 10.3390/molecules29071494
9. Anna, L, Cindy, N, Gael, C, Jacques, C, and Marianne, F. A targeted UHPLC-MS/MS method to monitor lipidomic changes during a physical effort: optimization and application to blood microsamples from athletes. J Pharm Biomed Anal. (2023) 229:115373–86. doi: 10.1016/j.jpba.2023.115373
10. Yang, Q, Cai, Y, Wang, Z, Guo, S, Qiu, S, and Zhang, A. Understanding the physiological mechanisms and therapeutic targets of diseases: Lipidomics strategies. Life Sci. (2025) 363:123411–24. doi: 10.1016/j.lfs.2025.123411
11. Warren, JL, Hunter, GR, Gower, BA, Bamman, MM, Windham, ST, Moellering, DR, et al. Exercise effects on mitochondrial function and lipid metabolism during energy balance. Med Sci Sports Exerc. (2020) 52:827–34. doi: 10.1249/mss.0000000000002190
12. Schader, JF, Haid, M, Cecil, A, Schoenfeld, J, Halle, M, Pfeufer, A, et al. Metabolite shifts induced by Marathon race competition differ between athletes based on level of fitness and performance: a substudy of the Enzy-mag IC study. Meta. (2020) 10:87–100. doi: 10.3390/metabo10030087
13. Contrepois, K, Wu, S, Moneghetti, KJ, Hornburg, D, Ahadi, S, Tsai, MS, et al. Molecular choreography of acute exercise. Cell. (2020) 181:1112–1130.e16. doi: 10.1016/j.cell.2020.04.043
14. Nolazco Sassot, L, Villarino, NF, Dasgupta, N, Morrison, JJ, Bayly, WM, Gang, D, et al. The lipidome of thoroughbred racehorses before and after supramaximal exercise. Equine Vet J. (2019) 51:696–700. doi: 10.1111/evj.13064
15. Wang, C, Zeng, Y, Wang, J, Wang, T, Li, X, Shen, Z, et al. Estimation of genetic parameters of body conformation and racing performance traits in Yili horses. J Equine Vet Sci. (2025) 146:105378–87. doi: 10.1016/j.jevs.2025.105378
16. Wang, T, Zeng, Y, Ma, C, Meng, J, Wang, J, Ren, W, et al. Plasma non-targeted metabolomics analysis of Yili horses raced on tracks with different surface hardness. J Equine Vet Sci. (2022) 121:104197–205. doi: 10.1016/j.jevs.2022.104197
17. Lindner, A, Esser, M, López, R, and Boffi, F. Relationship between resting and recovery heart rate in horses. Animals. (2020) 10:120–7. doi: 10.3390/ani10010120
18. Perera, TRW, Bromfield, EG, Gibb, Z, Nixon, B, Sheridan, AR, Rupasinghe, T, et al. Plasma Lipidomics reveals lipid signatures of early pregnancy in mares. Int J Mol Sci. (2024) 25:11073–89. doi: 10.3390/ijms252011073
19. Maśko, M, Domino, M, Jasiński, T, and Witkowska-Piłaszewicz, O. The physical activity-dependent hematological and biochemical changes in school horses in comparison to blood profiles in endurance and race horses. Animals. (2021) 11:1128–40. doi: 10.3390/ani11041128
20. Belhaj, MR, Lawler, NG, and Hoffman, NJ. Metabolomics and Lipidomics: expanding the molecular landscape of exercise biology. Meta. (2021) 11:151–84. doi: 10.3390/metabo11030151
21. Rao, G, Sui, J, and Zhang, J. Metabolomics reveals significant variations in metabolites and correlations regarding the maturation of walnuts (Juglans regia L.). Biology Open. (2016) 5:829–36. doi: 10.1242/bio.017863
22. Tohge, T. From fruit omics to fruiting omics: systematic studies of tomato fruiting by metabolic networks. Mol Plant. (2020) 13:1114–6. doi: 10.1016/j.molp.2020.07.012
23. Mukhopadhyay, TK, and Trauner, D. Concise synthesis of Glycerophospholipids. J Org Chem. (2023) 88:11253–7. doi: 10.1021/acs.joc.2c02096
24. Zhou, H, Huo, Y, Yang, N, and Wei, T. Phosphatidic acid: from biophysical properties to diverse functions. FEBS J. (2023) 291:1870–85. doi: 10.1111/febs.16809
25. Song, Y, Shi, X, Gao, Z, Li, R, Tian, J, Cao, X, et al. Acupoint catgut embedding improves lipid metabolism in exercise-induced fatigue rats via the PPAR signaling pathway. Animals. (2023) 13:558–75. doi: 10.3390/ani13040558
26. Schranner, D, Kastenmüller, G, Schönfelder, M, Römisch-Margl, W, and Wackerhage, H. Metabolite concentration changes in humans after a bout of exercise: a systematic review of exercise metabolomics studies. Sports Med Open. (2020) 6:11–27. doi: 10.1186/s40798-020-0238-4
27. Cichoń-Woźniak, J, Ostapiuk-Karolczuk, J, Cieślicka, M, Dziewiecka, H, Basta, P, Maciejewski, D, et al. Effect of 2 weeks rest-pause on oxidative stress and inflammation in female basketball players. Sci Rep. (2024) 14:14578–86. doi: 10.1038/s41598-024-65309-5
28. Okon, IA, Beshel, JA, Owu, DU, Orie, NN, Jim, AE, and Edet, LI. Moderate aerobic exercise improves haematological indices without altering cardio-metabolic enzyme activities in sedentary healthy young adults. BMC Sports Sci Med Rehabil. (2025) 17:32–40. doi: 10.1186/s13102-025-01080-y
29. Giers, J, Bartel, A, Kirsch, K, Müller, SF, Horstmann, S, and Gehlen, H. Blood-based markers for skeletal and cardiac muscle function in eventing horses before and after cross-country rides and how they are influenced by plasma volume shift. Animals. (2023) 13:3110–3128. doi: 10.3390/ani13193110
30. Valentine, WJ, Tomomi, HY, Shota, Y, and Hideo, S. Biosynthetic enzymes of membrane Glycerophospholipid diversity as therapeutic targets for drug development. Druggable Lipid Signaling Pathways. (2020) 1274:5–27. doi: 10.1007/978-3-030-50621-6_2
31. Halama, A, Oliveira, JM, Filho, SA, Qasim, M, Achkar, IW, Johnson, S, et al. Metabolic predictors of equine performance in endurance racing. Meta. (2021) 11:82–99. doi: 10.3390/metabo11020082
32. Kita, Y, Shindou, H, and Shimizu, T. Cytosolic phospholipase a 2 and lysophospholipid acyltransferases. Biochimica et Biophysica Acta (BBA)-Molecular and Cell Biology of Lipids. (2019) 1864:838–45. doi: 10.1016/j.bbalip.2018.08.006
33. Alves-Vas, FJ, Toro-Román, V, Sánchez, IB, Pérez, FJG, Maynar-Mariño, M, and Vicho, GB. Erythrocyte phospholipid fatty acid profile in high-level endurance runners. Appl Sci. (2024) 14:3965–74. doi: 10.3390/app14103965
34. Alves Vas, FJ, Grijota Pérez, FJ, Toro-Román, V, Sánchez, IB, Maynar Mariño, M, and Barrientos Vicho, G. Changes in the fatty acid profile in erythrocytes in high-level endurance runners during a sports season. Nutrients. (2024) 16:1895–907. doi: 10.3390/nu16121895
35. Zabrouskov, V, and Knowles, NR. Changes in lipid molecular species and sterols of microsomal membranes during aging of potato (Solanum tuberosum L.) seed-tubers. Lipids. (2002) 37:309–15. doi: 10.1007/s11745-002-0896-0
36. Danielle, D, Kayla, C, Shiva, S, Heather, B, and Michel, A. Differential incorporation of alpha-linolenic acid into phospholipid classes in H4IIE cells. Curr Dev Nutr. (2021) 5:491–1. doi: 10.1093/cdn/nzab041_006
37. Defries, D, Curtis, K, Petkau, JC, Shariati-Ievari, S, Blewett, H, and Aliani, M. Patterns of alpha-linolenic acid incorporation into phospholipids in H4IIE cells. J Nutr Biochem. (2022) 106:109014–4. doi: 10.1016/j.jnutbio.2022.109014
38. Maunder, E, Rothschild, JA, Fritzen, AM, Jordy, AB, Kiens, B, Brick, MJ, et al. Skeletal muscle proteins involved in fatty acid transport influence fatty acid oxidation rates observed during exercise. Pflugers Archiv Europ J Physiol. (2023) 475:1061–72. doi: 10.1007/s00424-023-02843-7
39. Barneda, D, Janardan, V, Niewczas, I, Collins, DM, Cosulich, S, Clark, J, et al. Acyl chain selection couples the consumption and synthesis of phosphoinositides. EMBO J. (2022) 41:e110038–55. doi: 10.15252/embj.2021110038
40. Tian, J, Wu, Y, Zhao, W, Zhang, G, Zhang, H, Xue, L, et al. Transcriptomic and metabolomic-based revelation of the effect of fresh corn extract on meat quality of Jingyuan chicken. Poult Sci. (2025) 104:104814–25. doi: 10.1016/j.psj.2025.104814
41. Chandel, NS. Lipid Metabolism. Cold Spring Harb Perspect Biol. (2021) 13:a040576–95. doi: 10.1101/cshperspect.a040576
42. Ballew, SH, Zhou, L, Surapaneni, A, Grams, ME, Windham, BG, Selvin, E, et al. A novel creatinine muscle index based on creatinine filtration: associations with frailty and mortality. J Am Soc Nephrol. (2023) 34:495–504. doi: 10.1681/asn.0000000000000037
43. Yamamoto, N, Tojo, K, Mihara, T, Maeda, R, Sugiura, Y, and Goto, T. Creatinine production rate is an integrative indicator to monitor muscle status in critically ill patients. Crit Care. (2025) 29:23–39. doi: 10.1186/s13054-024-05222-5
44. Mezincescu, AM, Rudd, A, Cheyne, L, Horgan, G, Philip, S, Cameron, D, et al. Comparison of intramyocellular lipid metabolism in patients with diabetes and male athletes. Nat Commun. (2024) 15:3690–703. doi: 10.1038/s41467-024-47843-y
45. Lundsgaard, AM, Fritzen, AM, and Kiens, B. The importance of fatty acids as nutrients during post-exercise recovery. Nutrients. (2020) 12:280–93. doi: 10.3390/nu12020280
46. Lu, J, Zhang, LM, Liu, JJ, Liu, YT, Lin, XY, Wang, XQ, et al. High-intensity interval training alleviates exhaustive exercise-induced HSP70-assisted selective autophagy in skeletal muscle. J Physiol Sci. (2023) 73:32–44. doi: 10.1186/s12576-023-00884-2
47. Pratap, GK, and Priyadarshini, CG. Crocetin inhibits Aβ aggregation in vitro and reduces ROS production and Aβ mediate cellular toxicity in neuronal SHSY5Y cells. Alzheimers Dement. (2025) 20:e087283–3. doi: 10.1002/alz.087283
48. Xiang, H, Jin, S, Tan, F, Xu, Y, Lu, Y, and Wu, T. Physiological functions and therapeutic applications of neutral sphingomyelinase and acid sphingomyelinase. Biomed Pharmacother. (2021) 139:111610–22. doi: 10.1016/j.biopha.2021.111610
49. Weissig, V, Joshi, MD, and Migrino, RQ. Cytoprotective effects of liposomal ganglioside GM1. J Liposome Res. (2025):1–6. doi: 10.1080/08982104.2025.2451776
50. Witkowska-Piłaszewicz, O, Grzędzicka, J, Seń, J, Czopowicz, M, Żmigrodzka, M, Winnicka, A, et al. Stress response after race and endurance training sessions and competitions in Arabian horses. Prev Vet Med. (2021) 188:105265–9. doi: 10.1016/j.prevetmed.2021.105265
51. Grzędzicka, J, Dąbrowska, I, Malin, K, and Witkowska-Piłaszewicz, O. Exercise-related changes in the anabolic index (testosterone to cortisol ratio) and serum amyloid a concentration in endurance and racehorses at different fitness levels. Front Vet Sci. (2023) 10:1148990–9003. doi: 10.3389/fvets.2023.1148990
52. Tsilosani, A, Gao, C, and Zhang, W. Aldosterone-regulated sodium transport and blood pressure. Front Physiol. (2022) 13:770375–91. doi: 10.3389/fphys.2022.770375
53. Pellicer-Caller, R, Vaquero-Cristóbal, R, González-Gálvez, N, Abenza-Cano, L, Horcajo, J, and de la Vega-Marcos, R. Influence of exogenous factors related to nutritional and hydration strategies and environmental conditions on fatigue in endurance sports: a systematic review with Meta-analysis. Nutrients. (2023) 15:2700–29. doi: 10.3390/nu15122700
54. Revol-Cavalier, J, Quaranta, A, Newman, JW, Brash, AR, Hamberg, M, and Wheelock, CE. The Octadecanoids: synthesis and bioactivity of 18-carbon oxygenated fatty acids in mammals, Bacteria, and Fungi. Chem Rev. (2024) 125:1–90. doi: 10.1021/acs.chemrev.3c00520
Keywords: Yili horse, lipid metabolomics, blood biochemistry, endurance racing, regulatory mechanisms
Citation: Chang X, Zhang Z, Yao X, Meng J, Ren W and Zeng Y (2025) Lipidomics and biochemical profiling of adult Yili horses in a 26 km endurance race: exploring metabolic adaptations. Front. Vet. Sci. 12:1597739. doi: 10.3389/fvets.2025.1597739
Edited by:
Wei Mao, Inner Mongolia Agricultural University, ChinaReviewed by:
Ruifeng Gao, Inner Mongolia Agricultural University, ChinaYongli Song, Inner Mongolia University, China
Copyright © 2025 Chang, Zhang, Yao, Meng, Ren and Zeng. This is an open-access article distributed under the terms of the Creative Commons Attribution License (CC BY). The use, distribution or reproduction in other forums is permitted, provided the original author(s) and the copyright owner(s) are credited and that the original publication in this journal is cited, in accordance with accepted academic practice. No use, distribution or reproduction is permitted which does not comply with these terms.
*Correspondence: Yaqi Zeng, eGphdXplbmd5YXFpQDE2My5jb20=
†These authors have contributed equally to this work and share first authorship