 Vishal Shah1*
 Anand Shah2
- 1College of the Sciences and Mathematics, West Chester University, West Chester, PA, United States
- 2Chadds Ford Elementary School, Chadds Ford, PA, United States
In an era when education is supposed to be a means for good jobs and linked to extrinsic values such as fame and money, students are losing interest in school education. The goal of this research is to see if there is any correlation between the students' views of school worthiness and schoolwork, and demographic variables. Our hypothesis is that several key demographics involving diversity, income, and education will affect how students view school and its importance. Results show that there is no correlation between the demographic variables we analyzed and the student perception of school worthiness.
Introduction
iGen is the generation of citizens born in the era of the Internet. iGen'rs are born in the technology age with large amounts of information available at their fingertips and through touch screens (Twenge, 2017). This generation is introduced to information through a digital path, unlike prior generations that relied on printed materials. Students from this generation expect that in a fully immersive learning environment in the classroom they should be able to seamlessly connect academic experiences to personal experiences (Oblinger et al., 2005). They prefer learning that allows them to be fully engaged and to be part of the learning process themselves. Digital resources allows iGen'rs to learn through experiential learning and their expectation in a classroom setting is one that allows collaboration and discussions to occur freely using digital learning tools (Oblinger et al., 2005). Unfortunately, the learning environment in many schools does not take this into consideration. This has led to an increasing disconnection between student expectations and learning environment within the classrooms, contributing to students losing interest in education (Shernoff et al., 2014; Twenge, 2017). An increased focus on assessment outcomes has resulted in teachers teaching for tests and encouraging memorization of facts, which only compounds the problem (Ness et al., 2016). In addition, society instills in students that education should lead to good jobs. As a result, many students have goals focusing on career, money, fame, etc. (Twenge et al., 2012). If the education system does not help connect the curiosity of students to their career goals with technological advances, students will feel that school and education are not worthwhile.
Demographic variables have been shown in research to have a strong correlation with student success (VanderStel, 2014). Okapala (2002) showed that the socioeconomic status of students is an important predictor of achievement. Students from low socioeconomic backgrounds struggled to achieve in class. Research indicates that students from low socioeconomic households and communities develop academic skills at a slower pace than students from higher socioeconomic groups (Morgan et al., 2009). The school systems in low socioeconomic communities are often under resourced, negatively affecting students' academic progress and outcomes (Aikens and Barbarin, 2008). Hodgkinson and Goldberg (2000) found that one can predict 45% of the national assessment scores independent of our knowledge of their race, indicating socioeconomic status is twice as predictive of academic achievement than race. Parent's level of education also has a critical influence on achievement of students in the classroom. It has been found that students achieve better scores when their parents have a post-high school education (Okapala, 2002). Dubow et al. (2009) provided statistical evidence of the importance of parental education on student success and how parent education affects late adolescent achievement and achievement-related aspirations. Race as a variable has also shown to play an important role in student success. A large body of literature exists documenting race as a significant factor in predicting the test scores amongst students (Fryer and Levitt, 2004; Clotfelter and Ladd, 2009; Penney, 2017; Reeves and Halikias, 2017). Studies have shown that students from African-American and Latino backgrounds receive significantly lower test scores than Caucasian students (Flores, 2007; Reeves and Halikias, 2017). However, not all minorities suffer from test score deficiencies relative to white students. In fact, being of Asian descent is correlated with higher test scores than whites (Krueger, 1999; Weili and Lehrer, 2010). Researchers have found numerous reasons behind the impact of race on student success. These includes lack of investment in child education, differences in family social structure, persistent cultural effects, and race-based differences in expectations (Wiggan, 2007; VanderStel, 2014).
Despite the plethora of literature on finding the correlation between demographic variables and student success, no data exists relating the relationship between any of the demographic variables and student perception of school worthiness, particularly for the students belonging to iGen. School worthiness is defined as the importance of school in the lives of students in preparing them academically. The goal of this research project is to evaluate the students' perception of school worthiness across middle and high school grades and investigate if there is any correlation between demographic variables and student perception of school. We test the hypothesis that if the students are enrolled in school from counties with low median household incomes, low level of parent education, and a higher percentage of racial diversity, then their positive perception of school worthiness will be lower.
Methodology
Retrospective published data was used in this study. The Pennsylvania Youth Survey (PAYS) data files for the years 2013 and 2015 were downloaded for each of the participating counties from the Pennsylvania Commission on Crime and Delinquency website (www.pccd.pa.gov). From the reports, survey results for 2011, 2013 and 2015 were obtained. Data is not available for surveys prior to 2011. The PAYS survey has two questions that are directly linked to student perception of school worthiness. The questions are (i) How important do you think the things you are learning in school are going to be for your later life? and (ii) How often do you feel that the school work you are assigned is meaningful and important? Data was recorded for 6, 8, 10, and 12th grade. The mean values of 2011, 2013, and 2015 were used for analysis at each grade level. Census data for each county were obtained from the United States Census Bureau (https://www.census.gov/quickfacts/). For each county, the PAYS data was arranged by grades in the Excel® file followed by the census data. Pearson correlation analysis was performed using the data analysis tools available in Excel®. The raw data file is provided in the supporting table (Table S1).
Results and Discussion
The Pennsylvania Youth Survey (PAYS) is an anonymous, voluntary and confidential student survey administered in odd-numbered years to youth in 6, 8, 10, and 12th grades in participating schools throughout the state. The self-reporting survey includes questions related to attitudes, knowledge, behaviors, and experiences. PAYS is administered to both public and private schools across the state. Executive summary reports from the state suggests that in 2011, 16,899 valid responses were analyzed for the report (Pennsylvania Youth Survey Report, 2011). In 2013 and 2015, the numbers were over 200,000 each time (Pennsylvania Youth Survey Report, 2013, 2015). In the current study, we use the mean of the 3 years for analysis and thus the data is based on the valid survey responses of over 430,00 students evenly distributed across the state. For all 3 years, there were nearly an equal number of males and females who took the survey. The two questions in the survey that reflect the student's perception of school worthiness are: feel school is important for their later life, and feel assigned schoolwork is meaningful and important.
As shown in Table 1, in 6th grade, an average of 35% of students feel that school is not important for their later life (~1:3 students). The number increases steadily across the grades, and by 12th grade an average of 63% of students feel that school is not important for their later life (~3:5 students). Similarly, 49% of students in 6th grade feel that assigned schoolwork is not meaningful and important (~1:2 students). As the grades increases, the number of students feeling the schoolwork is meaningful and important decreases. By 12th grade, 78% of students feel that assigned schoolwork is not meaningful and important (~3:4 students). Looking at the maximum values in Table 1, one can see that even in the county with maximum values, <3 out of 5 students in 12th grade feel that school is important and only 1/3rd of students in 12th grade feel the assigned schoolwork is meaningful and important. In contrast, there are counties where approximately 7 out of every 8 students in 12th grade feel that assigned school work is not important.
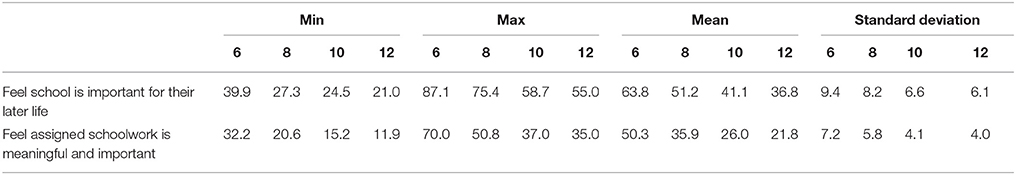
Table 1. Table showing the minimum, maximum, and mean values with standard deviation, for each of the questions in the PAYS survey and each grade for the state of Pennsylvania as a whole.
Table 2 provides the Pearson correlation matrix between the census variables selected for analysis as independent variables and the two PAYS survey questions at individual grade levels. There are seven racial diversity related variables in the census data. These variables account for the percentage of the population from different racial backgrounds including African American, Asian, Hispanic, and mixed races (Table 2). The percentage of foreign born persons is a variable reflecting a combination of racial and cultural diversity (Table 2). Each of these eight census data variables linked to diversity show no correlation against the two PAYS questions studied, with p-values ranging from −0.29 and 0.25. Similarly, no correlation was observed between the students' attitude toward school and assigned schoolwork with the two census data variables related to level of education (percentage of population who are high school graduates or higher and percentage of population having a bachelor's degree or higher). As seen in Table 2, results also show no correlation between the students' attitude toward school and the three variables related to income (median household income, per capita income, and percentage of population in poverty). However, when the two questions are analyzed against each other, results indicate that there is a very strong correlation. The correlation coefficients suggest a strong positive correlation between how students feel about school and its importance for their later life and their perception of assigned schoolwork being meaningful and important (r > 0.8).
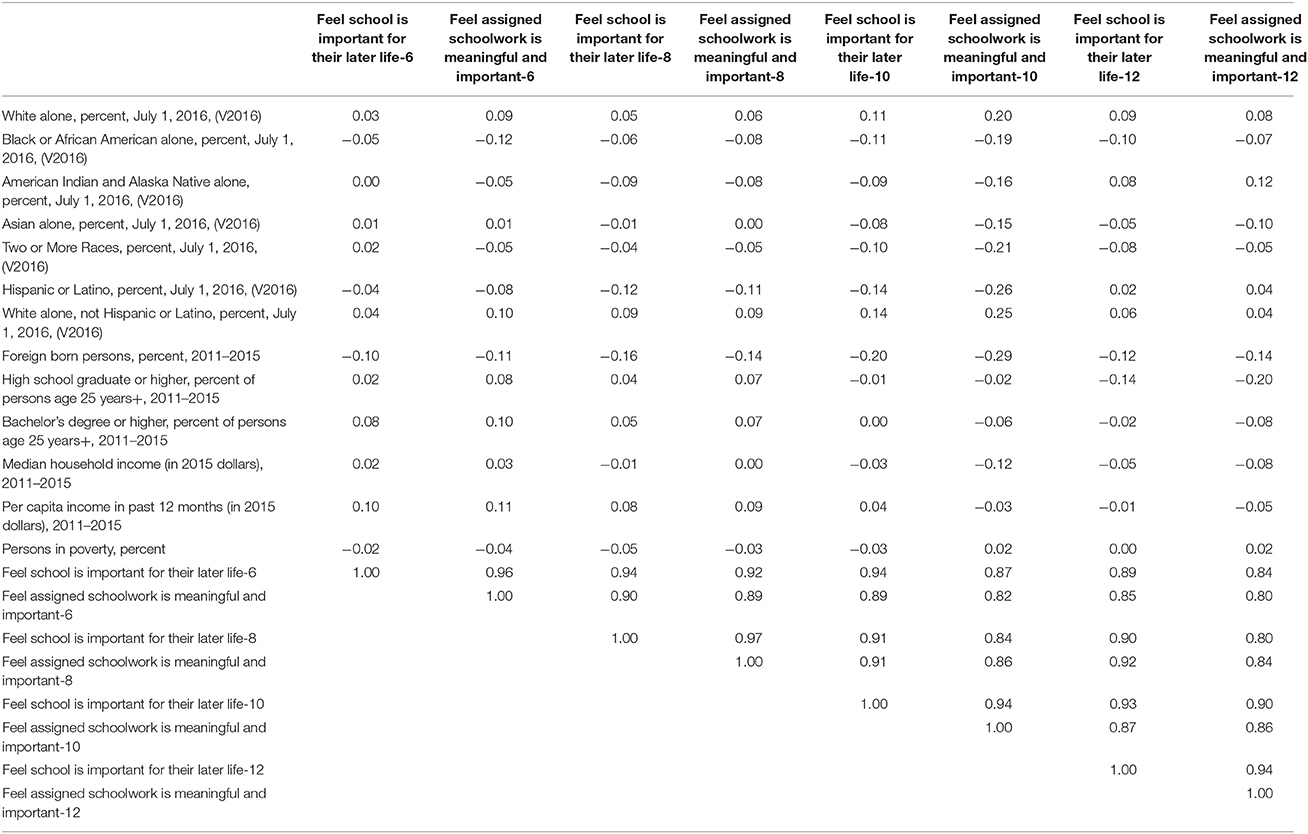
Table 2. Correlation matrix showing correlation coefficient between the questions selected in PAYS survey and demographic variables.
Results from the study indicate that our stated hypothesis was false. Analysis of the data from the state of Pennsylvania suggests that diversity within the community, socioeconomic level, or education level are not associated with student perception of school worthiness. Students from all backgrounds can have a negative perception of school worthiness and the perception is prevalent across middle and high school grades.
Further studies need to be conducted to confirm if the conclusion holds true across the country. Similarly, validation studies correlating student perception of school worthiness and their individual demographic variables need to be performed to further verify our conclusion. The current study utilizes census data as indicators of student demographic variables.
Nevertheless, the data indicates that it is imperative upon policy makers, school administration, and teachers to investigate how to change the prevalent negative perception about school worthiness amongst students. Results are a clarion call from the students that the current system is not meaningful or important to them. There seems to be a large disconnection between their expectations of learning and our deliverables. Students' expectations range from an interactive educational environment in the classroom where ideas and discussion happen between the students and interaction between students and teachers. While the reasons for such disconnection could vary amongst different groups of students, one of the common reasons amongst iGen is the use of technology in the schools (Levin and Arafeh, 2002; Twenge, 2017). In a survey conducted by the Pew Internet & American Life Project, students reported that there is a substantial disconnection between how they use the technology and internet for the school and how they use it during the school day and under the teacher's direction (Levin and Arafeh, 2002). Rau et al. (2008) showed that when instructors use technology for communication with students, student learning motivation, pressure, and performance were improved. Similarly, Lan et al. (2007) illustrated the use of mobile technology increasing reading motivation and collaboration amongst elementary school students. While these are only few examples, it is evident that incorporation of technology into the classroom increases student satisfaction and performance.
In an era when success and failure of schools and teachers are determined in large part by assessment scores, the freedom to adopt changes at a macro level that would yield sustainable positive change in student perception may be limited. Nevertheless, school administrators and policy makers must analyze resource allocation, flexible scheduling, criteria for academic success, and dependency between student learning outcomes and teaching effectiveness.
The most realistic chance for changing the negative perception amongst students lies in the hands of classroom teachers. Those who have taught in schools for generations can attest that baby boomers learned in a formal and structured environment. Students from Gen-X studied through group work in an interactive learning process. Millennials studied using multisensory approaches and within collaborative environments. Teaching iGen would require us to realize that apart from increasing the use of meaningful technology in the classroom to engage the students, we need to start focusing on teaching skills rather than content. Content is easily accessible to the students at all times. Devoting instruction time on teaching students soft and hard skills required for success in the future would be more beneficial to these students (Alcock et al., 2017). Such instruction may motivate the students and make them aware of their own actions and choices. Teachers need to integrate opportunities for iGen students to demonstrate their knowledge in methods beyond traditional forms such as quizzes and tests. Teachers also need to be more mindful of the homework they are assigning to the students. Studies have shown that if teachers manage to not repeat the homework type, not overburden the students with too much work, show a sense of respect to all the students' backgrounds, and establish a homework system, students will indeed learn to appreciate homework, school, and education (Paulu and Darby, 1998; Galloway et al., 2013).
It is not clear from this study if the transition to middle school is a variable in low school worthiness for 6th grade students, or if they have started losing interest in education from elementary school. More research needs to be conducted to identify the grade level in which students start to lose interest in education. Regardless, this study suggests that the attempts to motivate the students and ignite the yearning for education should be concentrated at elementary and middle school level.
In conclusion, the study suggests that students from 6th grade and above have a negative perception of school worthiness and such a perception is ubiquitous across the student population. There is no relationship between demographic factors and the negative student perception. It would require a philosophical and pedagogical change in the manner in which we teach the students in the school environment. Only then will we witness classrooms full of motivated students sparked with a desire to learn and make a difference.
Author Contributions
VS and AS were responsible for design of experiment, data collection, analysis, and manuscript preparation.
Conflict of Interest Statement
The authors declare that the research was conducted in the absence of any commercial or financial relationships that could be construed as a potential conflict of interest.
Supplementary Material
The Supplementary Material for this article can be found online at: https://www.frontiersin.org/articles/10.3389/feduc.2018.00045/full#supplementary-material
References
Aikens, N. L., and Barbarin, O. (2008). Socioeconomic differences in reading trajectories. the contribution of family, neighborhood, and school contexts. J. Educ. Psychol. 100, 235–251. doi: 10.1037/0022-0663.100.2.235
Alcock, M., Fisher, M., and Zmuda, A. (2017). The Quest for Learning. How to Maximize Student Engagement. Bloomington, IN: Solution Tree Press.
Clotfelter, C. T., and Ladd, H. F. (2009). The academic achievement gap in grades 3 to 8. Rev. Econ. Stat. 91, 398–419. doi: 10.1162/rest.91.2.398
Dubow, E. F., Boxer, P., and Huesmann, L. R. (2009). Long-term effects of parents' education on children's educational and occupational success: mediation by family interactions, child aggression, and teenage aspirations. Merrill Palmer, Q. 55, 224–249. doi: 10.1353/mpq.0.0030
Flores, A. (2007). Examining disparities in mathematics education: achievement gap or opportunity gap? High Sch. J. 91, 29–42. doi: 10.1353/hsj.2007.0022
Fryer, R. G., and Levitt, S. D. (2004). Understanding the black-white test score gap in the first two years of school. Rev. Econ. Stat. 12, 447–464. doi: 10.1162/003465304323031049
Galloway, M., Conner, J., and Pope, D. (2013). Nonacademic effects of homework in privileged, high-performing high schools. J. Exp. Educ. 81, 490–510. doi: 10.1080/00220973.2012.745469
Hodgkinson, H., and Goldberg, M. F. (2000). An interview with Harold Hodkinson: demographics: ignore them at your peril. Phi. Delta Kappan 82, 304–306. doi: 10.1177/003172170008200413
Krueger, A. B. (1999). Experimental estimates of education production functions. Q. J. Econ. 114, 497–532. doi: 10.1162/003355399556052
Lan, Y. J., Sung, Y. T., and Chang, K. E. (2007). A mobile-device-supported peer-assisted learning system for collaborative early EFL reading. Lang. Learn. Technol. 11, 130–151. doi: 10.125/44121
Levin, D., and Arafeh, S. (2002). The Digital Disconnect: The Widening Gap Between Internet-Savvy Students and Their Schools. Washington, DC: Pew Internet and American Life Project.
Morgan, P. L., Farkas, G., Hillemeier, M. M., and Maczuga, S. (2009). Risk factors for learning-related behavior problems at 24 months of age: population-based estimates. J. Abnorm. Child Psychol. 37, 401–413. doi: 10.1007/s10802-008-9279-8
Ness, D., Farenga, S. J., Shah, V., and Garofalo, S. G. (2016). Repositioning science reform efforts: four practical recommendations from the field. Improv. Schools 19, 258–266. doi: 10.1177/1365480216650312
Oblinger, D., Oblinger, J. L., and Lippincott, J. K. (2005). Educating the Net Generation. Boulder, CO: EDUCAUSE.
Okapala, C. O. (2002). Educational resources, student demographics and achievement scores. J. Educ. Financ. 27, 885–908. Available online at: http://www.jstor.org/stable/40704151
Paulu, N., and Darby, L. B. (1998). Helping Your Students with Homework: A Guide for Teachers. US Government Printing Office, Superintendent of Documents (Washington, DC: Mail Stop: SSOP), 20402–9328.
Penney, J. (2017). Racial interaction effects and student achievement. Educ. Finance Policy 12, 447–467. doi: 10.1162/edfp_a_00202
Pennsylvania Youth Survey Report (2011). Conducted by Pennsylvania Commission on Crime and Delinquency. The Pennsylvania State University.
Pennsylvania Youth Survey Report (2013). Conducted by: Bach Harrison, L.L.C. The Pennsylvania State University.
Pennsylvania Youth Survey Report (2015). Conducted by: Bach Harrison, L.L.C. The Pennsylvania State University.
Rau, P. L. P., Gao, Q., and Wu, L. M. (2008). Using mobile communication technology in high school education: motivation, pressure, and learning performance. Comput. Educ. 50, 1–22. doi: 10.1016/j.compedu.2006.03.008
Reeves, R., and Halikias, D. (2017). Race gaps in SAT Scores Highlight Inequality and Hinder Upward Mobility. Brookings Institution.
Shernoff, D. J., Csikszentmihalyi, M., Schnider, B., and Shernoff, E. S. (2014). “Student engagement in high school classrooms from the perspective of flow theory,” in Applications of Flow in Human Development and Education (Springer), 475–494.
Twenge, J. M., Campbell, W. K., and Freeman, E. C. (2012). Generational differences in young adults' life goals, concern for others, and civic orientation, 1966–2009. J. Pers. Soc. Psychol. 102, 1045–1062. doi: 10.1037/a0027408
VanderStel, A. (2014). The Impact of Demographics In Education. Honors Projects. Grand Valley State University.
Weili, D., and Lehrer, S. F. (2010). Estimating treatment effects from contaminated multiperiod education experiments: the dynamics impacts of class size reductions. Rev. Econ. Stat. 92, 31–42. doi: 10.1162/rest.2009.11453
Keywords: student perception, school worthiness, demographic variables, schoolwork, iGen, PAYS survey, student success
Citation: Shah V and Shah A (2018) Relationship Between Student Perception of School Worthiness and Demographic Factors. Front. Educ. 3:45. doi: 10.3389/feduc.2018.00045
Received: 28 January 2018; Accepted: 29 May 2018;
Published: 12 June 2018.
Edited by:
Marybeth Gasman, University of Pennsylvania, United StatesReviewed by:
Jackie M. Blount, The Ohio State University, United StatesChristopher B. Newman, University of San Diego, United States
Copyright © 2018 Shah and Shah. This is an open-access article distributed under the terms of the Creative Commons Attribution License (CC BY). The use, distribution or reproduction in other forums is permitted, provided the original author(s) and the copyright owner are credited and that the original publication in this journal is cited, in accordance with accepted academic practice. No use, distribution or reproduction is permitted which does not comply with these terms.
*Correspondence: Vishal Shah, dnNoYWhAd2N1cGEuZWR1