 Sonja Breuer
 Thomas Scherndl
 Tuulia M. Ortner
- Department of Psychological Assessment, Institute of Psychology, University of Salzburg, Salzburg, Austria
Reasoning is regarded to be an essential facet of fundamental cognitive abilities. As examinee characteristics may affect performance in Reasoning tests, concern about maintaining fairness is expressed. The purpose of the current study was to examine effects of response format on psychometric properties and fairness of a matrices test according to examinee's sex, risk propensity, and test anxiety. A total of 433 German-speaking pupils (aged 14–20) were randomly assigned to either a multiple choice or a free response version of the same 25-item test. Data analysis yielded Rasch-homogeneous 23-item versions, with higher reliability, but lower criterion validity for the free response test. No interactions between response format and sex, test anxiety, or risk propensity were revealed, but a significant main effect of sex: men out-performed women in reasoning irrespective of response format. Results are discussed with reference to attributes of the test situation and sample characteristics.
Introduction
The question regarding the most appropriate response format to gain valid information concerning test takers' characteristics is currently becoming a “hot topic” within the assessment of personality in the job context with reference to the newly emerged forced choice format (see Usami et al., 2016; Lin and Brown, 2017; O'Neill et al., 2017; Brown and Maydeu-Olivares, 2018; Wetzel and Greiff, 2018). However, studies addressing response formats within the domain of the assessment of knowledge, skills, and abilities with stem-equivalent items are rare. One reason for this may lay in the fact that innovative and promising developments of response formats are scarce. As regards the constructed response format, often also called free response (FR), its standard application is obviously easier to implement into a test design when responses can be verbalized (e.g., Sebrechts et al., 1991; Edwards and Arthur, 2007). When presenting item material based on complex and abstract figures, new ways of FR formats are required. Within the current study, we compared a new FR version with a multiple choice (MC) version for the assessment of figural reasoning (Piskernik, 2013) with reference to their psychometric properties.
Reasoning has been considered to be a crucial aspect of fundamental thinking abilities or general intelligence (Carroll, 1993). Valid, reliable and fair measurement of reasoning should provide information about a test taker's general intelligence level, which revealed as a strong predictive value not only for academic and professional success, but also for success in life and health (Carroll, 1993; Mittring and Rost, 2008; Danner et al., 2016; Schmidt et al., 2016). However, the robustness of test scores with reference to method bias has been questioned by past research, as, for example, by studies comparing an adaptive and a fixed item version of the same matrices test (Ortner and Caspers, 2011; Ortner et al., 2014) or by a study investigating achievement differences between students with and without reading difficulties in varying response formats (Collins et al., 2018). Identifying tests' psychometric features and test takers' personal and environmental characteristics that may contribute to the emergence of test bias is hence a highly relevant task for psychological research.
As regards test design, most published matrices tests are based on MC format (e.g., Raven et al., 1998; Hossiep et al., 1999; Formann, 2002; Booth and Horn, 2004). Previous research demonstrated significant group differences in various MC tests in scores partially based on systematically differing personality characteristics beyond the assessed target construct. This was found, for example, for men and women (Irwing and Lynn, 2005), for people who are more or less likely to take risks (Rowley, 1974; Alnabhan, 2002; Rubio et al., 2010) and for more or less test anxious persons (Benjamin et al., 1981; Crocker and Schmitt, 1987). Taking into consideration that achievement tests aim to assess individuals' maximum performance, systematic decrement in performance due to construct-irrelevant sources of score variance related to group membership may diminish validity of a test in certain groups, and may jeopardize test fairness (Zieky, 2016).
Comparisons of test scores between persons are valid when these scores indicate equal psychological meanings between individuals (Van de Vijver and Poortinga, 1997). On the other hand, test bias describes systematic error that differentially impairs the validity of test scores in identified groups of persons (Reynolds, 2000). Test fairness has been described as one of the fundamental psychometric standards for designing, developing and administering psychological tests (Dorans and Cook, 2016). With reference to test design, the Standards for Educational and Psychological Testing of the AERA, APA, and NCME have stated that “fairness is a fundamental validity issue and requires attention throughout all stages of test development and use” (p. 49; AERA, 2014). According to Helms' Individual-Differences (HID) model (2006), test fairness was defined as identification and removal of systematic variance in test results which is irrelevant for the construct and can be attributed to these psychological characteristics.
Ever since the MC format was developed, its pros and cons over the FR format have been discussed and studied empirically (e.g., Kastner and Stangl, 2011; Bonner, 2013; Hudson and Treagust, 2013; Schult and Lindner, 2018; Schult and Sparfeldt, 2018; Liou and Bulut, 2020). Economy and efficiency for administrators of tests emerged as advantages of the MC format (McCoubrie, 2004), with test takers indicating preferences for the MC format as this was rated as easier. Nevertheless, there are also test administrators and subjects who prefer the FR format (McCoubrie, 2004; Powell, 2012; Mingo et al., 2018). They argue that higher level cognitive processes are required in order to answer FR questions compared to MC tests, where retrieving learned facts and other sources besides learning success or high cognitive performance can contribute to a high score, as, for example, test wiseness (Rowley, 1974; Birenbaum and Tatsuoka, 1987; Martinez, 1999; McCoubrie, 2004; Heyborne et al., 2011; Powell, 2012).
However, several studies (as reviewed by Rodriguez, 2003; Simkin and Kuechler, 2005; Bonner, 2013) empirically compared various MC modes (e.g., true/false, assignment tasks, MC with varying numbers of options, single correct answer, multiple correct answers, with the option “none of the above is true,” with the option “I don't know the answer”) as well as different FR modes (e.g., clozes, sentence completion, short answer, essay) within several domains (e.g., mathematics, reading comprehension, vocabulary). Various study designs like within- and between-subjects designs as well as stem-equivalent and non-stem-equivalent items were employed in these studies. Even though test scores gained for both response formats revealed mostly high correlation coefficients when related to each other (e.g., 0.92 with stem-equivalent items, 0.85 with non-stem-equivalent items; Rodriguez, 2003), some variability on account of response format has not yet been empirically explained (Rodriguez, 2003; Simkin and Kuechler, 2005; Bonner, 2013; Woodcock et al., 2019).
The present study aimed to contribute (1) to the question of differential effects of response format not only regarding psychometric properties of tests, but also (2) concerning test fairness in terms of differential effects of response format according to test takers' personality characteristics. Especially two aspects of personality revealed as relevant with reference to response format in the literature: Risk propensity (e.g., Rubio et al., 2010) and test anxiety (e.g., Crocker and Schmitt, 1987). Risk propensity has been defined as willingness to show behavior that involves an unknown probability of danger and negative consequences, but also the possibility of winnings or benefits (Leigh, 1999). Risk propensity is represented by a continuum with a certain amount of risky behavior being adaptive but becoming maladaptive at extreme levels (Dahne et al., 2013). In order to assess risk propensity, self-report questionnaires represent the most frequently employed approach (e.g., Johnson et al., 2004). In addition, objective tests (see Lejuez et al., 2002; Ortner and Proyer, 2015; Kyllonen and Kell, 2018) assess test takers' behavior in standardized miniature situations and quantify risky behavior in terms of behavior samples.
Numerous studies have shown a higher tendency for test takers possessing higher levels of risk propensity to guess in MC tests when they were unsure about items, while people with low risk propensity preferred to skip those questions (Alnabhan, 2002; Rubio et al., 2010; Baldiga, 2013). As the probability of guessing correctly in a MC test with eight response options is 12.5%, or even more if some distractors can be excluded, high risk-taking individuals have a significantly higher likelihood of achieving more points in MC tests than low risk-taking subjects (Rowley, 1974; Alnabhan, 2002; Rubio et al., 2010; Stenlund et al., 2018). Research showed that even when test takers were required to answer all items in a test based on MC format, persons with higher scores in the willingness to risk a penalty in a test situation outperformed those with lower risk scores (Rowley, 1974). Studies furthermore revealed men to score higher in MC tests while women showed higher omission rates of items (Ben-Shakhar and Sinai, 1991). This was explained by gender differences in guessing tendencies. Risk propensity may play a role in test taking when tactics can be relevant, such as guessing instead of omitting. As guessing is less or not possible in the FR format, possessing a higher level of risk propensity could be less advantageous. As a consequence, we expected test takers with high risk propensity to outperform test takers with low risk propensity at MC format while there are no differences between the two groups at FR format.
The second personality characteristic that we addressed with reference to response format was test anxiety. Test anxiety, defined as the tendency to extreme fear of being rated negatively in upcoming tests (Zeidner, 1998), has been acknowledged as a major disruptive factor for academic careers: severe test anxious pupils and students often failed in tests and achieved lower mean grades than less test anxious ones (Hembree, 1988; Zeidner, 1998; Von der Embse et al., 2013; Stenlund et al., 2018). Several studies reported sex differences in test anxiety (e.g., Putwain and Daly, 2014; Núñez-Peña et al., 2016; Lowe, 2019) and it has been identified as a source of bias for underperformance in standardized testing (as reviewed by Zeidner, 1998; McDonald, 2001). Taking different response formats into account, it seems easier for test takers to identify a solution by selecting it compared to constructing it. With reference to anxiety in a test situation, test takers could be more relaxed by knowing that they could identify the correct solution in a MC test also by chance, which is not possible in a FR test. We therefore presumed that test anxiety could represent a relevant characteristic when investigating these two response formats for the first time with reference to reasoning ability. However, surprisingly few studies examined if test anxious people are more disadvantaged by one of the response formats. Two studies revealed that test takers who reported higher scores in test anxiety performed relatively better at MC sections than at FR items. It was hypothesized that test-related worries have a distracting impact and make it easier to recognize a correct answer than constructing it (Benjamin et al., 1981; Crocker and Schmitt, 1987). As MC tests were often considered to be less frightening than FR tests by pupils and students (Birenbaum and Feldman, 1998; Zeidner, 1998), test anxiety could be especially detrimental in FR studies. Therefore, we expected high test anxious persons to perform at an inferior level compared with low test anxious people in the FR format while fewer differences should arise in the MC format.
Both mentioned aspects of personality–risk propensity and, as referred to above, test anxiety–are known to interact with sex (e.g., Zeidner, 1990; Byrnes et al., 1999; Farooqi et al., 2012; Bulgan, 2018), which has also been mentioned with reference to response format. Two meta-analyses of sex differences in the widely applied progressive matrices test (Raven et al., 1998) with 57 included studies (Lynn and Irwing, 2004), respectively 22 included studies (Irwing and Lynn, 2005) showed men generally outperforming women (d = 0.33 resp. d = 0.31): This sex difference was replicated in different European countries (e.g., Lynn et al., 2004; Mackintosh and Bennett, 2005), South America (e.g., Rosseti et al., 2009), Asia and South Africa (e.g., Lynn, 2002; Lynn and Tse-Chan, 2003; Abdel-Khalek and Lynn, 2006). Nevertheless, some studies did not report significant differences between men and women in progressive matrices (e.g., Rushton and Cvorovic, 2009; Savage-McGlynn, 2012; Flores-Mendoza et al., 2013). Whereas, all of these results on sex differences were derived from matrices tests based on MC response format, only few studies have employed matrices tests based on FR format so far. They reported small sex differences in favor of men (e.g., Becker et al., 2014) or no significant differences between men and women (e.g., Piskernik, 2013). To examine the potential role of response format for the emergence of sex differences, matrices tests must be presented in an item-equivalent MC and FR version. Within the present study, we realized this design for the first time.
Regarding research on specific cognitive abilities or factual knowledge, data showed that men often outperformed women in the MC version, while both sexes performed approximately the same in the FR version, or women performed even better: these interaction effects were demonstrated, for example, in mathematics and languages (Bolger and Kellaghan, 1990; Reardon et al., 2018), history (Bridgeman and Lewis, 1994) as well as in natural sciences (DeMars, 1998; Stanger-Hall, 2012). In contrast, Bonner (2013) reported no interaction between sex and response format in crystallized intelligence. Consequently, these results may suggest that previously reported sex differences in the domain of matrices tests may also be related to effects of the MC response format.
The present study was designed to provide new insights into the role of response format in matrices tests with reference to sex differences, related to aspects of personality—risk propensity and test anxiety—and psychometric properties. In line with these research aims, the first objective of the current study was to investigate possible effects of response format on the matrices test's Rasch model fit, difficulty, reliability by means of internal consistency, as well as influences on the test's criterion validity. The second objective of this work was to examine possible effects of response format on the results of matrices tests according to an examinee's sex, risk propensity and test anxiety.
Materials and Methods
Sample
A sample of 433 German-speaking pupils (65.60% female, 34.40% male) between the ages of 14 and 20 (M = 16.62, SD = 1.24) participated voluntarily. Pupils from different Austrian secondary schools were invited to take part either in the context of psychology tuition or in their free time. An information letter about the experiment was given to all participants and written informed consent was obtained from the parents of under 16-years-olds as well as from all the pupils themselves.
Materials
FRM
The computerized Free Response Matrices test (FRM; Piskernik, 2013) consisted of 25 items representing an incomplete 3 × 3 matrix with figures. Each figure was made up of 5 × 5 squares either colored black or white (see an item example in Figure 1). The items were constructed according to rules, as for example, the rule addition, where the matrix components of the first and second figure had to be summed up in the third figure of every row or column, and the rule intersection, where only matrix components that were present in the first as well as in the second figure, might be present in the third figure of every row or column. These underlying rules had to be found and applied correctly to complete the matrix with the missing pattern. Test takers were instructed to create the missing figure by clicking on the squares (or coloring the squares with a marker in the paper-pencil version). The items were scored dichotomously (correct = 1, incorrect = 0). The author reported an internal consistency of Guttman's λ2 = 0.88, a correlation coefficient of r = 0.81 with Raven's Advanced Progressive Matrices and Rasch model fit for the original FRM version (Piskernik, 2013). An internal consistency of α = 0.73 was shown in this study.

Figure 1. Sample FRM item (Piskernik, 2013). The missing figure was constructed by clicking on the squares to turn them from white to black in the computerized version or coloring the squares with a marker in the paper-pencil version.
FRM With MC Format
In order to investigate the influence of response format, we created a MC version of the FRM with stem-equivalent items. Following Preckel (2003), a rule taxonomy for distractor generation was created and seven distractors for each of the 25 FRM items were constructed and ordered randomly. Reliability was α = 0.57 in the current study. Figure 2 shows a sample item in the MC version.
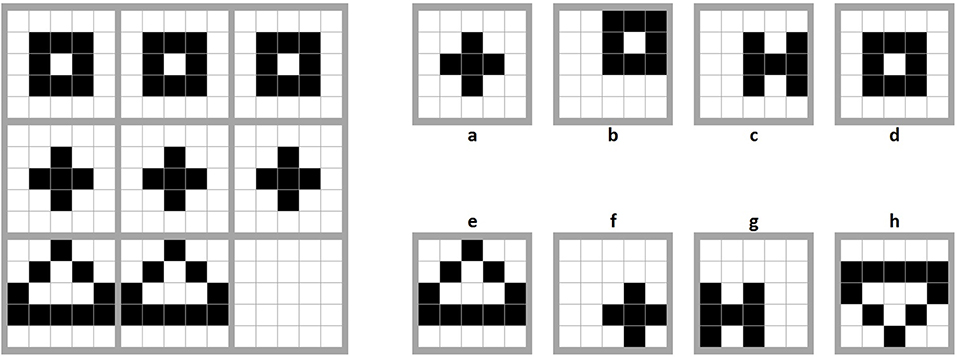
Figure 2. Sample FRM item with MC format. The correct answer was option e.
Research by Mittring and Rost (2008) revealed that the correct solution of some matrices items (e.g., the APM; Raven et al., 1998) can be determined by simple counting of matrix components and analysis of sets, subsets or intersections, without looking at the item stem. A distractor analysis revealed that only 8% (n = 2) of the newly constructed MC items could potentially be solved by counting distractor components (in comparison to around 50% of the APM; Mittring and Rost, 2008). One or more distractors could potentially be excluded by applying the counting strategy in 56% (n = 14) of the new FRM MC items, and for 36% (n = 9) of the items no exclusion of distractors was possible without looking at the item stem.
DOSPERT-ES
To measure subjective risk propensity, the subset ethics of the Domain-Specific Risk-Taking Scale in its German version (DOSPERT-G, Johnson et al., 2004) was adapted for pupils and students. The test takers were supposed to rate how likely they would follow a risky activity or behavior on a Likert scale from 1 (very unlikely) to 5 (very likely). As Item 2 “… not declare a significant amount of income in the tax return” seemed inappropriate for pupils, it was replaced by the new item “… use a neighbor's unsecured Wi-Fi without permission.” To make the scale even more appropriate for the research objective of current study, the additional item “… guess in a test, even if I don't know the answer” was inserted. Overall, the new subset “ethics for pupils” (DOSPERT-ES) consisted of 9 items. Scores represent the scale mean from 1 to 5. An internal consistency of α = 0.73 was shown in current study. Correlations between the original version of DOSPERT and self-reported frequencies of risky behavior (e.g., financial, ethical and social risk-taking) demonstrated construct validity (Weber et al., 2002).
BART
In the computerized test sessions we employed the Balloon Analogue Risk Task (BART; Lejuez et al., 2002) to assess objective risk propensity. Within this behavior based approach, test takers were instructed to virtually inflate 15 balloons on the screen with mouse clicks as far as possible without exploding. They saw a small red balloon accompanied by a balloon pump button labeled Pump up the balloon, a reset button labeled Collect $$$, potential earnings, balloon number, number of pumps and total winnings. Each click on the pump inflated the balloon 1° (about 0.125 in. [about 0.32 cm]) in all directions. With each pump, 0.5 points were accumulated in a temporary bank. The probability that a balloon could explode was fixed at 1/128 for the first pump. If the balloon did not explode after the first pump, the probability for explosion was 1/127 on the second pump, 1/126 on the third pump, and so on, until the 128th pump at which point the probability of an explosion was 1/1 (i.e., 100%). When a balloon was pumped to its individual explosion point, it disappeared and all points in the temporary bank were lost. At any point during each balloon trial, participants could stop pumping the balloon by clicking the Collect $$$ button. This click transferred all the points from the temporary bank to the permanent bank. Instructions were given based on Lejuez et al. (2002, pp. 78–79), with no precise information about the probability of explosion given. Participants were told the following: “It is your choice to determine how much to pump up the balloon, but be aware that at some point the balloon will explode.” The corrected average number of pumps (0–128), which is the average of clicks per unexploded balloon, served as a score for risk propensity. To incite the subjects, a small gift was given to the six participants with the most points. A reliability coefficient of α = 0.87 was reported (Ronay and Kim, 2006). With reference to criterion validity, BART scores were positively associated with self-reported risk-related behaviors, such as smoking (r = 0.36), gambling (r = 0.44), drug and alcohol consumption (both r = 0.28) as well as risky sexual behaviors (r = 0.25; Lejuez et al., 2002).
TAI-G
A short form of the Test Anxiety Inventory–German version (TAI-G; Hodapp, 1991), a questionnaire consisting of 15 items (Wacker et al., 2008) was employed to assess four dimensions of test anxiety: worry (five items), excitement (four items), lack of confidence (three items), and interference (three items). The mean total score (1–4) was applied to test the hypotheses. In this study, an internal consistency of α = 0.87 was shown. The TAI-G has been shown to assess more trait-related stable individual differences than situational effects (Keith et al., 2003).
Further Measures
Demographic data including age, sex, and type of secondary school were provided by the subjects. Additionally, school grades in mathematics from 1 (highest grade) to 5 (lowest grade) of the last four school reports were surveyed on a voluntary basis to calculate the test's criterion validity. Math grades were chosen as they showed the highest correlations with matrices in previous research (e.g., Heller et al., 1998; Pind et al., 2003). In total, 297 pupils declared their grades. A reliability coefficient of α = 0.90 was calculated in the current study.
Procedure
We employed an experiment with between-subjects design. Pupils were randomly assigned to either the FR (n = 203; 46.90%) or the MC (n = 230; 53.10%) version. Furthermore, 53.30% worked on all tests and questionnaires in a computerized mode, 46.70% in a paper-pencil mode (except the BART, it was omitted in the paper-pencil condition). Data collection took place in quiet rooms at school or at the laboratory of the Department of Psychology. Each test taker worked about 50 min on all test and questionnaire items. Participants received a code and were given the opportunity to indicate if they wanted to receive anonymous feedback on their results.
Statistical Analyses
In a first step, we estimated the dichotomous Rasch model fit of the two response format modes separately in R by using the package TAM (Robitzsch et al., 2018). We further calculated person ability parameters (θ) and extracted descriptive statistics for our data and correlations between all relevant variables using SPSS 21.
In the next step, a 2 × 2 ANOVA with response format (FR vs. MC) and sex as fixed factors was employed in SPSS 21 with PROCESS macro (Hayes, 2013) to assess the question of a sex × response format interaction on test scores. In order to address the flaw of Null Hypothesis Significance Testing that only evidence against the null hypothesis can be gathered and not in favor of it, we also followed the Bayesian approach as an alternative to frequentist statistics (see Wagenmakers et al., 2018). Using JASP 0.8 with the default scaling factor of 0.5 of the Cauchy distribution, we computed the Bayes factor which describes the ratio of one hypothesis' likelihood to the likelihood of another. For an additional evaluation of interactions between personality characteristics and response format, moderated regression analyses with subjective and objective risk propensity as well as test anxiety as predictors and response format as moderator were computed.
Furthermore, we employed item response theory (IRT) analyses using performance median, sex, and age median as split criteria and extracted IRT item difficulty estimates in R with the package TAM (Robitzsch et al., 2018) in order to reveal possible effects of response format on the Rasch model fit and the difficulties of the two modes. One claim of the Rasch model fit is the independency of item parameters from the particular sample of persons tested, which can be examined by checking whether item difficulties are dissimilar in specific groups (e.g., women vs. men, high or low ability groups). We used the R package difR (Magis et al., 2010) for testing of differential item functioning (DIF). In detail, we employed the four DIF detection methods “TID” (Transformed Item Difficulties), “MH” (Mantel-Haenszel), “Std” (standardization) as well as “Logistic” (logistic regression), and applied “majority voting” for deciding whether DIF was present or not (i.e., if three or more of the four tests suggested significant DIF on the p < 0.01, we concluded that DIF was present in the respective item). Finally, analyses of internal consistency in terms of Cronbach's alpha were applied in SPSS 21 to compare reliability between both response formats, and criterion validity of the two test modes was estimated with Spearman correlation coefficients between FRM test scores and mathematics grades.
Results
Effects of Personality on Performance With Reference to Response Format
Descriptive statistics for our data are listed in Table 1. The ANOVA with response format and sex as fixed factors revealed a significant main effect for sex in both response formats [F(1, 429) = 17.07, p < 0.01, η2 = 0.03] with males (M = 0.27, SD = 1.04) outperforming females (M = −0.14, SD = 1.10). No significant main effect for response format [F(1, 429) = 0.18, p = 0.67, η2 < 0.01] or interaction between sex and response format was revealed [F(1, 429) = 1.62, p = 0.20, η2 < 0.01]. When we analyzed this model in a Bayesian fashion, Bayes factors suggested that the model considering only the main effect for sex (B10 = 94.11) was 29.32 times more likely than the model considering both main effects and the interaction between sex and response format (B10 = 3.21) and 9.35 times more likely than the model comprising only the main effects sex and response format.
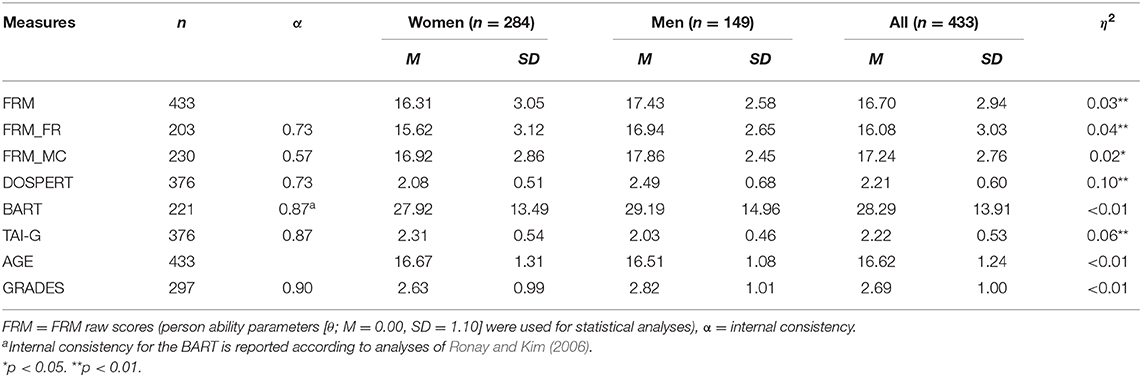
Table 1. Descriptive statistics, reliability and mean differences between women and men.
No significant interactions were shown between response format and subjective risk propensity in moderation analyses [ΔR2 < 0.01 when including the interaction term, F(1, 372) = 0.06, p = 0.81], between response format and objective risk propensity [ΔR2 < 0.01, F(1, 217) = 0.19, p = 0.67], and between response format and test anxiety [ΔR2 = 0.01, F(1, 372) = 0.42, p = 0.52].
Effects of Response Format on Psychometric Properties
In our Rasch model fit analysis, we dropped Item 7 from further analyses as all pupils had solved that item in the FR version and we removed item 19 due to significant outfit (t = 3.64, p < 0.01) as well as infit (t = 2.13, p = 0.03) in the FR scale. Significant outfit and infit of items in IRT analyses suggested a deviation from the assumed unidimensionality. The remaining 23-item model revealed satisfactory fit in the FR as well as in the MC data. Additionally, the models displayed good to sufficient Expected-A-Posteriori (EAP) reliability in both samples (FR: 0.73, MC: 0.57). EAP reliability coefficients in IRT analyses were based on a Bayesian-adjusted posterior ability distribution and informed about the amount of reduced measurement uncertainties in the person ability parameters. When testing for DIF, all items showed good outfit (FR: all t < 1.52, p > 0.13; MC: all t < 1.39, p > 0.17) and infit (FR: all t < 1.64, p > 0.10; MC: all t < 1.14, p > 0.26) with performance median as split criterion. Employing age median and sex as split criteria revealed no DIF in both response formats, which means that the items did not function in different ways for the respective groups of test takers in either response format.
Analyses of IRT-based item difficulties of the FR (M = −1.14, SD = 2.59) and the MC (M = −1.29, SD = 1.75) version illustrated similar difficulties overall [t(38.63) = 0.23, p = 0.82, η2 < 0.01], with only some items differing slightly between the two modes (see also Figure 3). Analysis of internal consistency revealed higher coefficients (see Table 1) for the FR version of the 23-item scale (α = 0.73) as compared to the MC version (α = 0.57). In contrast, θ gained by the MC version (r = −0.40, p < 0.01, η2 = 0.16) showed a significantly higher Spearman correlation coefficient (p < 0.01, q = 0.29) with average mathematics grades of the last four school reports compared to θ gained by the FR version (r = −0.13, p = 0.14, η2 = 0.02). Negative correlation coefficients represent positive correlations in this case as school grades in Austria are coded contrary to θ.
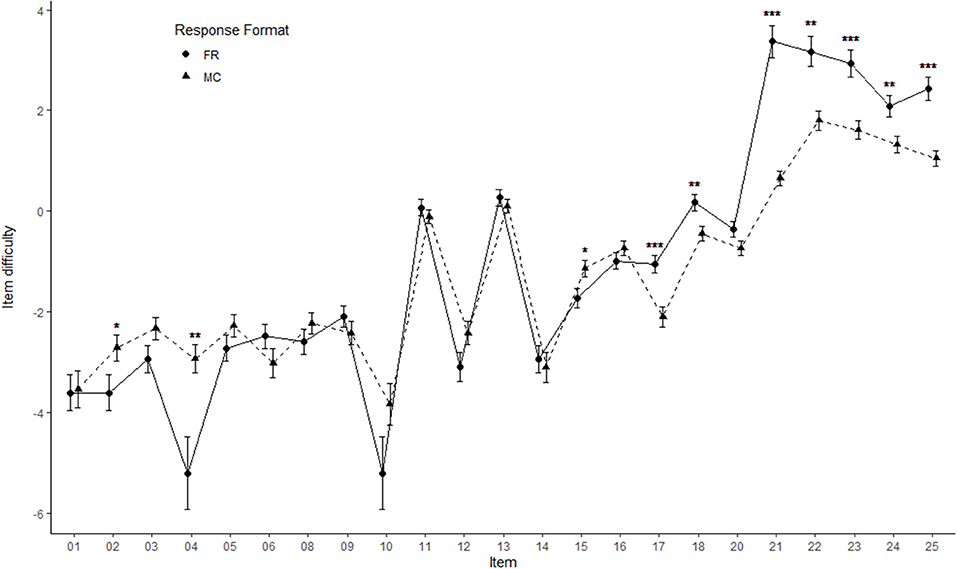
Figure 3. Comparison of item difficulties between FR and MC format. Error bars represent 95% confidence intervals. *p < 0.05. **p < 0.01. ***p < 0.001.
Further Results
Exploratory analysis revealed a large significant main effect of response format [F(1, 198) = 34.39, p < 0.001, η2 < 0.15; B10 = 2,727,000.00] on the number of skipped items in a 2 × 2 ANOVA with response format and sex as fixed factors, with more omitted items in the FR version (M = 1.78, SD = 1.92) than in the MC version (M = 0.43, SD = 1.07). No significant main effect of sex [F(1, 198) = 0.25, p = 0.619, η2 < 0.01; B10 = 0.16] or interaction between sex and response format was found [F(1, 198) = 0.53, p = 0.469, η2 < 0.01; B10 = 133,386.95].
Significant correlations between FRM time and performance (r = 0.41, p < 0.001), test anxiety (r = −0.20, p = 0.002), and subjective risk propensity (r = 0.20, p = 0.003) indicated that time spent on solving the FRM items was positively related to θ, lower test anxiety and higher subjective risk propensity. Males (M = 18.78 min, SD = 6.76) spent significantly more time [F(1, 229) = 6.67, p = 0.010, η2 = 0.03; B10 = 3.42] on the FRM than females (M = 16.20 min, SD = 7.05).
Discussion
The present study was the first to systematically investigate psychometric properties and fairness of two stem-equivalent response formats of a matrices test with reference to personality characteristics. Therefore, we constructed a MC version of a FR matrices test which proved to be less prone to counting strategies than former reasoning tests. Overall, different psychometric indicators revealed a heterogeneous picture: whereas two items of the FR scale violated model fit with reference to the dichotomous model of Rasch and were removed, no items had to be dropped for the MC scale. The present data revealed the MC version as being significantly superior with reference to criterion validity, employing school grades in mathematics as external criterion as suggested by previous research (e.g., Heller et al., 1998; Pind et al., 2003). In contrast, the FR matrices items revealed higher internal consistency and EAP reliability indicators than the MC items. This result is in line with a recent report by Schult and Sparfeldt (2018) with reference to international student assessment tests. The possibility to employ strategies based on test wiseness in these kinds of items (e.g., elimination of distractors, guessing) may serve as an explanation for the somewhat lower reliability coefficients revealed for the MC items. Especially with reference to more difficult MC items, evoking more clueing strategies in certain test takers, random error and therefore reduced reliability may result. Even though item parameters of the two versions reached comparable difficulty values, some of the easier items in the FR version turned out to be more difficult in the MC version, whereas several of the most difficult items revealed as relatively easier in the MC mode, maybe caused by guessing.
As men often outperformed women in MC versions of performance tests while test takers of both sexes performed approximately equal in FR versions according to recent studies (e.g., DeMars, 1998; Stanger-Hall, 2012; Reardon et al., 2018), we hypothesized an interaction between sex and response format. According to our data, male pupils outperformed female pupils in both response formats, whereas sex and response format did not interact significantly. Previous demonstrations of interaction effects between sex and response format were based on tests measuring similar contents with non-stem equivalent items (e.g., Bridgeman and Lewis, 1994; Stanger-Hall, 2012), leading to the assumption that item and test design features, other than response format, may have induced the detected interaction effects.
Sex differences in general intelligence have been a controversial issue in psychological research for many years (see Arendasy and Sommer, 2012) with numerous demonstrations of men outperforming women in matrices tests (e.g., Lynn and Irwing, 2004; Mackintosh and Bennett, 2005; Rosseti et al., 2009) and only a few findings of equal performances (e.g., Savage-McGlynn, 2012; Flores-Mendoza et al., 2013). As no DIF for sex was revealed in both response formats of the current study, our data aligned with previous findings of sex differences in favor of men, irrespective of response format. This result could either support Lynn's (1994) hypothesis that men actually develop higher average intelligence than women from the age of about 15, or further item features, aside from response format, could lead to test bias. As proposed by Colom et al. (2004), the visuo-spatial format of matrices tests could be accountable for higher male performance, since men tend to achieve superior scores in spatial abilities as compared to women. Moreover, salience of item elements, i.e., the perceptual complexity of geometrical shapes (Arendasy and Sommer, 2012), as well as “stereotype threat” in terms of women automatically tending to confirm the negative stereotype that they commonly perform at an inferior level to men in certain standardized tests (Miller and Halpern, 2014), are potential factors leading to sex differences in general intelligence.
Regarding effects of personality variables on cognitive test results, neither effects of test anxiety nor of risk propensity revealed significant differences, even though interactions between these characteristics and response format have been suggested by earlier research (e.g., Rowley, 1974; Benjamin et al., 1981; Crocker and Schmitt, 1987; Alnabhan, 2002; Rubio et al., 2010). As previous studies revealed effects of subjects' test anxiety and risk propensity on test scores particularly within high-stakes assessments (Segool et al., 2013; Knekta, 2017; Stenlund et al., 2018), aspects of the test situation (low-stakes) could have contributed to this finding. Given the small personal relevance of the test outcome for the pupils in the current study, test anxiety and risk propensity may not have influenced the subjects substantially in this test situation. Furthermore, some of the effects reported in other studies could have been influenced by test takers' ages. Within this study, the median age of subjects was between 16 and 17 years and therefore below the age of most test takers in previous studies.
Further results revealed a significantly higher amount of omitted items in the FR version, indicating that considerably more guessing occurred in the MC mode, consistent with previous research (e.g., Bonner, 2013), possibly resulting in less valid data. The longer pupils worked on the FRM items, the higher their performance turned out to be. Interestingly, males spent significantly more time on solving the test than females. On the one hand, these results could indicate that test takers with higher ability needed more time to complete the test; on the other hand pupils with higher scores—i.e., male pupils—could have achieved higher performance by persistently trying instead of giving up at an early stage. Test takers who declared higher risk propensity—i.e., male pupils—took more time to solve the items as well, leading to the assumption that risk-taking pupils spent more time on trying to guess the correct option than risk-averse ones, as suggested by recent studies (Alnabhan, 2002; Rubio et al., 2010; Baldiga, 2013). Pupils who indicated lower test anxiety—i.e., male pupils—also spent longer time on the items, suggesting that highly test anxious subjects aimed to work their way through the test rapidly.
Psychometric advantages of the FR format could be argued due to the fact that the FR items were originally selected out of an item pool according to their properties. However, data suggest an advantage of MC items with reference to the important aspect of criterion validity. Future studies may address effects of response format on psychometric properties and fairness of matrices tests by including further relevant constructs. It seems, for example, possible, that the FR version requires more working memory capacity in order to remember the item creation rules or creativity.
Data Availability Statement
The dataset for this study can be found in the Open Science Framework (https://osf.io/5ru9q/).
Ethics Statement
This study was carried out in accordance with the recommendations of the statutes of the University of Salzburg (part XI), Ethic Committee of the Paris Lodron University of Salzburg. All subjects gave written informed consent in accordance with the Declaration of Helsinki.
Author Contributions
SB and TO conceptualized the research. SB co-developed the MC version, organized and conducted the data collection. TS and SB performed the statistical analyses. SB wrote the first draft of the manuscript. TO supervised the research, provided the theoretical input for the Introduction and Discussion sections, and revised the earlier versions of the manuscript. All authors contributed to manuscript revision, read, and approved the submitted version.
Conflict of Interest
The authors declare that the research was conducted in the absence of any commercial or financial relationships that could be construed as a potential conflict of interest.
Acknowledgments
We thank Bernhard Piskernik for his advice concerning the conceptualization of this research and Manuela Wagner for co-developing the MC version. We thank the Schuhfried GmbH for providing software and items of the FRM test. Furthermore, we thank Freya Gruber and Verena Eberle for their help during the data collection. Finally, we thank all teachers and pupils who agreed to take part in the research.
References
Abdel-Khalek, A. M., and Lynn, R. (2006). Sex differences on the standard progressive matrices and in educational attainment in Kuwait. Pers. Individ. Differ. 40, 175–182. doi: 10.1016/j.paid.2005.06.020
AERA, APA, and NCME. (2014). Standards for Educational and Psychological Testing. Washington, DC: American Educational Research Association.
Alnabhan, M. (2002). An empirical investigation of the effects of three methods of handling guessing and risk taking on the psychometric indices of a test. Soc. Behav. Pers. 30, 645–652. doi: 10.2224/sbp.2002.30.7.645
Arendasy, M. E., and Sommer, M. (2012). Gender differences in figural matrices: the moderating role of item design features. Intelligence 40, 584–597. doi: 10.1016/j.intell.2012.08.003
Baldiga, K. (2013). Gender differences in willingness to guess. Manage. Sci. 60, 434–448. doi: 10.1287/mnsc.2013.1776
Becker, N., Preckel, F., Karbach, J., Raffel, N., and Spinath, F. M. (2014). Die Matrizenkonstruktionsaufgabe: Validierung eines distraktorfreien aufgabenformats zur vorgabe figuraler matrizen: the construction task: validation of a distractor-free item format for the presentation of figural matrices. Diagnostica 61, 22–33. doi: 10.1026/0012-1924/a000111
Benjamin, M., McKeachie, W. J., Lin, Y.-g., and Holinger, D. P. (1981). Test anxiety: deficits in information processing. J. Educ. Psychol. 73, 816–824. doi: 10.1037/0022-0663.73.6.816
Ben-Shakhar, G., and Sinai, Y. (1991). Gender d66ifferences in multiple-choice tests: the role of differential guessing tendencies. J. Educ. Meas. 28, 23–35. doi: 10.1111/j.1745-3984.1991.tb00341.x
Birenbaum, M., and Feldman, R. A. (1998). Relationships between learning patterns and attitudes towards two assessment formats. Educ. Res. 40, 90–98. doi: 10.1080/0013188980400109
Birenbaum, M., and Tatsuoka, K. K. (1987). Open-ended versus multiple-choice response formats–it does make a difference for diagnostic purposes. Appl. Psychol. Meas. 11, 385–395. doi: 10.1177/014662168701100404
Bolger, N., and Kellaghan, T. (1990). Method of measurement and gender differences in scholastic achievement. J. Educ. Meas. 27, 165–174. doi: 10.1111/j.1745-3984.1990.tb00740.x
Bonner, S. M. (2013). Mathematics strategy use in solving test items in varied formats. J. Exp. Educ. 81, 409–428. doi: 10.1080/00220973.2012.727886
Booth, J. F., and Horn, R. (2004). Figure Reasoning Test (FRT): Manual für FRT und FRT-J. Frankfurt am Main: Swets Test Services.
Bridgeman, B., and Lewis, C. (1994). The relationship of essay and multiple-choice scores with grades in college courses. J. Educ. Meas. 31, 37–50. doi: 10.1111/j.1745-3984.1994.tb00433.x
Brown, A., and Maydeu-Olivares, A. (2018). “Modeling forced-choice reponse formats,” in The Wiley Handbook of Psychometric Testing, eds P. Irwing, T. Booth, and D. Hughes (London: John Wiley & Sons).
Bulgan, G. (2018). Children's perceptions of tests: a content analysis. Eur. J. Educ. Res. 7, 159–167. doi: 10.12973/eu-jer.7.2.159
Byrnes, J. P., Miller, D. C., and Schafer, W. D. (1999). Gender differences in risk taking: a meta-analysis. Psychol. Bull. 125, 367–383. doi: 10.1037/0033-2909.125.3.367
Carroll, J. B. (1993). Human Cognitive Abilities: A Survey of Factor-Analytic Studies. New York, NY: Cambridge University Press. doi: 10.1017/CBO9780511571312
Collins, A. A., Lindström, E. R., and Compton, D. L. (2018). Comparing students with and without reading difficulties on reading comprehension assessments: a meta-analysis. J. Learn. Disabil. 51, 108–123. doi: 10.1177/0022219417704636
Colom, R., Escorial, S., and Rebollo, I. (2004). Sex differences on the progressive matrices are influenced by sex differences on spatial ability. Pers. Individ. Dif. 37, 1289–1293. doi: 10.1016/j.paid.2003.12.014
Crocker, L., and Schmitt, A. (1987). Improving multiple-choice test performance for examinees with different levels of test anxiety. J. Exp. Educ. 55, 201–205. doi: 10.1080/00220973.1987.10806454
Dahne, J., Richards, J. M., Ernst, M., MacPherson, L., and Lejuez, C. W. (2013). “Assessment of risk taking in addiction research,” in The Wiley-Blackwell Handbook of Addiction Psychopharmacology, eds J. MacKillop and H. de Wit (Chichester: Wiley-Blackwell), 209–231.
Danner, D., Blasius, J., Breyer, B., Eifler, S., Menold, N., Paulhus, D. L., et al. (2016). Current challenges, new developments, and future directions in scale construction. Eur. J. Psychol. Assess. 32, 175–180. doi: 10.1027/1015-5759/a000375
DeMars, C. E. (1998). Gender differences in mathematics and science on a high school proficiency exam: the role of response format. Appl. Meas. Educ. 11, 279–299. doi: 10.1207/s15324818ame1103_4
Dorans, N. J., and Cook, L. L. (2016). Fairness in Educational Assessment and Measurement. New York, NY: Routledge.
Edwards, B. D., and Arthur, W. (2007). An examination of factors contributing to a reduction in subgroup differences on a constructed-response paper-and-pencil test of scholastic achievement. J. Appl. Psychol. 92, 794–801. doi: 10.1037/0021-9010.92.3.794
Farooqi, Y. N., Ghani, R., and Spielberger, C. D. (2012). Gender differences in test anxiety and academic performance of medical students. Int. J. Psychol. Behav. Sci. 2, 38–43. doi: 10.5923/j.ijpbs.20120202.06
Flores-Mendoza, C. E., Widaman, K. F., Rindermann, H., Primi, R., Mansur-Alves, M., and Pena, C. C. (2013). Cognitive sex differences in reasoning tasks: evidence from brazilian samples of educational settings. Intelligence 41, 70–84. doi: 10.1016/j.intell.2012.11.002
Hayes, A. F. (2013). Introduction to Mediation, Moderation, and Conditional Process Analysis: A Regression-Based Approach. New York, NY: Guilford Press.
Heller, K. A., Kratzmeier, H., and Lengfelder, A. (1998). Matrizen-Test-Manual. Ein Handbuch zu den Standard Progressive Matrices von J. C. Raven. Göttingen: Beltz-Testgesellschaft.
Helms, J. E. (2006). Fairness is not validity or cultural bias in racial-group assessment: a quantitative perspective. Am. Psychol. 61, 845–859. doi: 10.1037/0003-066X.61.8.845
Hembree, R. (1988). Correlates, causes, effects, and treatment of test anxiety. Rev. Educ. Res. 58, 47–77. doi: 10.3102/00346543058001047
Heyborne, W. H., Clarke, J. A., and Perrett, J. J. (2011). A Comparison of two forms of assessment in an introductory biology laboratory course. J. Coll. Sci. Teach. 40, 28–31.
Hodapp, V. (1991). Das prüfungsängstlichkeitsinventar tai-g: eine erweiterte und modifizierte version mit vier komponenten. Z. Pädag. Psychol. 5, 121–130.
Hossiep, R., Turck, D., and Hasella, M. (1999). BOMAT-Advanced–Bochumer Matrizentest. Handanweisung. Göttingen: Hogrefe.
Hudson, R. D., and Treagust, D. F. (2013). Which form of assessment provides the best information about student performance in chemistry examinations? Res. Sci. Technol. Educ. 31, 49–65. doi: 10.1080/02635143.2013.764516
Irwing, P., and Lynn, R. (2005). Sex differences in means and variability on the progressive matrices in university students: a meta-analysis. Br. J. Psychol. 96, 505–524. doi: 10.1348/000712605X53542
Johnson, J. G., Wilke, A., and Weber, E. U. (2004). A domain-specific scale measuring risk perceptions, expected benefits, and perceived-risk attitude in German-speaking populations. Pol. Psychol. Bull. 35, 153–172.
Kastner, M., and Stangl, B. (2011). Multiple choice and constructed response tests: do test format and scoring matter? Proc. Soc. Behav. Sci. 12, 263–273. doi: 10.1016/j.sbspro.2011.02.035
Keith, N., Hodapp, V., Schermelleh-Engel, K., and Moosbrugger, H. (2003). Cross-sectional and longitudinal confirmatory factor models for the german test anxiety inventory: a construct validation. Anxiety Stress Coping 16, 251–270. doi: 10.1080/1061580031000095416
Knekta, E. (2017). Are all pupils equally motivated to do their best on all tests? differences in reported test-taking motivation within and between tests with different stakes. Scand. J. Educ. Res. 61, 95–111. doi: 10.1080/00313831.2015.1119723
Kyllonen, P. C., and Kell, H. (2018). Ability tests measure personality, personality tests measure ability: disentangling construct and method in evaluating the relationship between personality and ability. J. Intell. 6:E32. doi: 10.3390/jintelligence6030032
Leigh, B. C. (1999). Peril, chance, adventure: concepts of risk, alcohol use and risky behavior in young adults. Addiction 94, 371–383. doi: 10.1046/j.1360-0443.1999.9433717.x
Lejuez, C. W., Read, J. P., Kahler, C. W., Richards, J. B., Ramsey, S. E., Stuart, G. L., et al. (2002). Evaluation of a behavioral measure of risk taking: the Balloon Analogue Risk Task (BART). J. Exp. Psychol. Appl. 8, 75–84. doi: 10.1037/1076-898X.8.2.75
Lin, Y., and Brown, A. (2017). Influence of context on item parameters in forced-choice personality assessments. Educ. Psychol. Meas. 77, 389–414. doi: 10.1177/0013164416646162
Liou, P. -Y., and Bulut, O. (2020). The effects of item format and cognitive domain on students' science performance in TIMSS 2011. Res. Sci. Educ. 50, 99–121. doi: 10.1007/s11165-017-9682-7
Lowe, P. A. (2019). Exploring cross-cultural and gender differences in test anxiety among U.S. and Canadian college students. J. Psychoeduc. Assess. 37, 112–118. doi: 10.1177/0734282917724904
Lynn, R. (1994). Sex differences in intelligence and brain size: a paradox resolved. Pers. Individ. Dif. 17, 257–271. doi: 10.1016/0191-8869(94)90030-2
Lynn, R. (2002). Sex differences on the progressive matrices among 15–16 year olds: some data from South Africa. Pers. Individ. Dif. 33, 669–673. doi: 10.1016/S0191-8869(01)00184-2
Lynn, R., Allik, J., Pullmann, H., and Laidra, K. (2004). Sex differences on the progressive matrices among adolescents: some data from Estonia. Pers. Individ. Dif. 36, 1249–1255. doi: 10.1016/S0191-8869(02)00240-4
Lynn, R., and Irwing, P. (2004). Sex differences on the progressive matrices: a meta-analysis. Intelligence 32, 481–498. doi: 10.1016/j.intell.2004.06.008
Lynn, R., and Tse-Chan, P. W. (2003). Sex differences on the progressive matrices: some data from Hong Kong. J. Biosoc. Sci. 35, 145–150. doi: 10.1017/S0021932003001457
Mackintosh, N. J., and Bennett, E. S. (2005). What do raven's matrices measure? An analysis in terms of sex differences. Intelligence 33, 663–674. doi: 10.1016/j.intell.2005.03.004
Magis, D., Beland, S., Tuerlinckx, F., and De Boeck, P. (2010). A general framework and an R package for the detection of dichotomous differential item functioning. Behav. Res. Methods 42, 847–862. doi: 10.3758/BRM.42.3.847
Martinez, M. E. (1999). Cognition and the question of test item format. Educ. Psychol. 34, 207–218. doi: 10.1207/s15326985ep3404_2
McCoubrie, P. (2004). Improving the fairness of multiple-choice questions: a literature review. Med. Teach. 26, 709–712. doi: 10.1080/01421590400013495
McDonald, A. S. (2001). The prevalence and effects of test anxiety in school children. Educ. Psychol. 21, 89–101. doi: 10.1080/01443410020019867
Miller, D. I., and Halpern, D. F. (2014). The new science of cognitive sex differences. Trends Cogn. Sci. 18, 37–45. doi: 10.1016/j.tics.2013.10.011
Mingo, M. A., Chang, H.-H., and Williams, R. L. (2018). Undergraduate students' preferences for constructed versus multiple-choice assessment of learning. Innovat. High. Educ. 43, 143–152. doi: 10.1007/s10755-017-9414-y
Mittring, G., and Rost, D. H. (2008). Die verflixten Distraktoren. Ueber den Nutzen einer theoretischen Distraktorenanalyse bei Matrizentests (fuer besser Begabte und Hochbegabte). The nasty distractors. The utility of a notional distractor analysis of items of matrices tests for the highly gifted. Diagnostica 54, 193–201. doi: 10.1026/0012-1924.54.4.193
Núñez-Peña, M. I., Suárez-Pellicioni, M., and Bono, R. (2016). Gender differences in test anxiety and their impact on higher education students' academic achievement. Proc. Soc. Behav. Sci. 228, 154–160. doi: 10.1016/j.sbspro.2016.07.023
O'Neill, T. A., Lewis, R. J., Law, S. J., Larson, N., Hancock, S., Radan, J., et al. (2017). Forced-choice pre-employment personality assessment: construct validity and resistance to faking. Pers. Individ. Dif. 115, 120–127. doi: 10.1016/j.paid.2016.03.075
Ortner, T. M., and Caspers, J. (2011). Consequences of test anxiety on adaptive versus fixed item testing. Eur. J. Psychol. Assess. 27, 157–163. doi: 10.1027/1015-5759/a000062
Ortner, T. M., and Proyer, R. T. (2015). “Objective personality tests,” in Behavior-Based Assessment in Psychology: Going Beyond Self-Report in the Personality, Affective, Motivation, and Social Domains, eds T. M. Ortner and F. J. R. van de Vijver (Göttingen: Hogrefe), 133–152.
Ortner, T. M., Weißkopf, E., and Koch, T. (2014). I will probably fail–higher ability students' motivational experiences during adaptive achievement testing. Eur. J. Psychol. Assess. 30, 48–56. doi: 10.1027/1015-5759/a000168
Pind, J., Gunnarsdóttir, E. K., and Jóhannesson, H. S. (2003). Raven's standard progressive matrices: new school age norms and a study of the test's validity. Pers. Individ. Dif. 34, 375–386. doi: 10.1016/S0191-8869(02)00058-2
Powell, S. R. (2012). High-stakes testing for students with mathematics difficulty: response format effects in mathematics problem solving. Learn. Disabil. Q. 35, 3–9. doi: 10.1177/0731948711428773
Preckel, F. (2003). Diagnostik Intellektueller Hochbegabung. Testentwicklung zur Erfassung der fluiden Intelligenz. Göttingen: Hogrefe.
Putwain, D., and Daly, A. L. (2014). Test anxiety prevalence and gender differences in a sample of English secondary school students. Educ. Stud. 40, 554–570. doi: 10.1080/03055698.2014.953914
Raven, J., Raven, J. C., and Court, J. H. (1998). Manual for Raven's Progressive Matrices and Vocabulary Scales. Oxford: Oxford Psychologists Press.
Reardon, S. F., Kalogrides, D., Fahle, E. M., Podolsky, A., and Zárate, R. C. (2018). The relationship between test item format and gender achievement gaps on math and ela tests in fourth and eighth grades. Educ. Res. 47, 284–294. doi: 10.3102/0013189X18762105
Reynolds, C. R. (2000). Why is psychometric research on bias in mental testing so often ignored? Psychol. Public Policy Law 6, 144–150. doi: 10.1037/1076-8971.6.1.144
Robitzsch, A., Kiefer, T., and Wu, M. (2018). TAM: Test Analysis Modules. R package version 2.12–18. Available online at: https://CRAN.R-project.org/package=TAM
Rodriguez, M. C. (2003). Construct equivalence of multiple-choice and constructed-response items: a random effects synthesis of correlations. J. Educ. Meas. 40, 163–184. doi: 10.1111/j.1745-3984.2003.tb01102.x
Ronay, R., and Kim, D.-Y. (2006). Gender differences in explicit and implicit risk attitudes: a socially facilitated phenomenon. Br. J. Soc. Psychol. 45, 397–419. doi: 10.1348/014466605X66420
Rosseti, M. O., Rabelo, I. S. A., Leme, I. F. A., Pacanaro, S. V., and Güntert, I. B. (2009). Validity evidence of raven's advanced progressive matrices in university students. Psico-USF 14, 177–184. doi: 10.1590/S1413-82712009000200006
Rowley, G. L. (1974). Which examinees are most favoured by the use of multiple choice tests? J. Educ. Meas. 11, 15–23. doi: 10.1111/j.1745-3984.1974.tb00966.x
Rubio, V. J., Hernández, J. M., Zaldívar, F., Márquez, O., and Santacreu, J. (2010). Can we predict risk-taking behavior?: two behavioral tests for predicting guessing tendencies in a multiple-choice test. Eur. J. Psychol. Assess. 26, 87–94. doi: 10.1027/1015-5759/a000013
Rushton, J., and Cvorovic, J. (2009). Data on the raven's standard progressive matrices from four serbian samples. Pers. Individ. Dif. 46, 483–486. doi: 10.1016/j.paid.2008.11.020
Savage-McGlynn, E. (2012). Sex differences in intelligence in younger and older participants of the raven's standard progressive matrices plus. Pers. Individ. Dif. 53, 137–141. doi: 10.1016/j.paid.2011.06.013
Schmidt, R. L., Oh, I.-S., and Shaffer, J. A. (2016). The Validity and Utility of Selection Methods in Personnel Psychology: Practical and Theoretical Implications of 100 Years of Research Findings. Fox School of Business Research Paper. Iowa, IA: University of Iowa.
Schult, J., and Lindner, M. A. (2018). Judgment accuracy of german elementary school teachers: a matter of response formats? Zeitschrift für Pädagogische Psychologie 32, 75–87. doi: 10.1024/1010-0652/a000216
Schult, J., and Sparfeldt, J. R. (2018). Reliability and validity of PIRLS and TIMSS: does the response format matter? Eur. J. Psychol. Assess. 34, 258–269. doi: 10.1027/1015-5759/a000338
Sebrechts, M. M., Bennett, R. E., and Rock, D. A. (1991). agreement between expert-system and human raters' scores on complex constructed-response quantitative items. J. Appl. Psychol. 76, 856–862. doi: 10.1037/0021-9010.76.6.856
Segool, N., Carlson, J. S., Goforth, A. N., Von der Embse, N., and Barterian, J. (2013). Heightened test anxiety among young children: elementary school students' anxious responses to high-stakes testing. Psychol. Sch. 50, 489–499. doi: 10.1002/pits.21689
Simkin, M. G., and Kuechler, W. L. (2005). Multiple-choice tests and student understanding: what is the connection? Decis. Sci. J. Innov. Educ. 3, 73–98. doi: 10.1111/j.1540-4609.2005.00053.x
Stanger-Hall, K. F. (2012). Multiple-choice exams: an obstacle for higher-level thinking in introductory science classes. CBE Life Sci. Edu. 11, 294–306. doi: 10.1187/cbe.11-11-0100
Stenlund, T., Lyrén, P.-E., and Eklöf, H. (2018). The successful test taker: exploring test-taking behavior profiles through cluster analysis. Eur. J. Psychol. Educ. 2018, 403–417. doi: 10.1007/s10212-017-0332-2
Usami, S., Sakamoto, A., Naito, J., and Abe, Y. (2016). Developing pairwise preference-based personality test and experimental investigation of its resistance to faking effect by item response model. Int. J. Test. 16, 288–309. doi: 10.1080/15305058.2016.1145123
Van de Vijver, F. J. R., and Poortinga, Y. H. (1997). Towards an integrated analysis of bias in cross-cultural assessment. Eur. J. Psychol. Assess. 13, 29–37. doi: 10.1027/1015-5759.13.1.29
Von der Embse, N., Barterian, J., and Segool, N. (2013). Test anxiety interventions for children and adolescents: a systematic review of treatment studies from 2000–2010. Psychol. Sch. 50, 57–71. doi: 10.1002/pits.21660
Wacker, A., Jaunzeme, J., and Jaksztat, S. (2008). Eine Kurzform des Prüfungsängstlichkeitsinventars TAI-G. Z. Pädag. Psychol. 22, 73–81. doi: 10.1024/1010-0652.22.1.73
Wagenmakers, E.-J., Marsman, M., Jamil, T., Ly, A., Verhagen, J., Love, J., et al. (2018). Bayesian inference for psychology. Part I: theoretical advantages and practical ramifications. Psychon. Bull. Rev. 25, 35–57. doi: 10.3758/s13423-017-1343-3
Weber, E. U., Blais, A.-R., and Betz, N. E. (2002). A domain-specific risk-attitude scale: measuring risk perceptions and risk behaviors. J. Behav. Decis. Mak. 15, 263–290. doi: 10.1002/bdm.414
Wetzel, E., and Greiff, S. (2018). The world beyond rating scales: why we should think more carefully about the response format in questionnaires. Eur. J. Psychol. Assess. 34, 1–5. doi: 10.1027/1015-5759/a000469
Woodcock, S., Howard, S. J., and Ehrich, J. (2019). A within-subject experiment of item format effects on early primary students' language, reading, and numeracy assessment results. Sch. Psychol. 35, 80–87. doi: 10.1037/spq0000340
Zeidner, M. (1990). Does test anxiety bias scholastic aptitude test performance by gender and sociocultural group? J. Pers. Assess. 55, 145–160. doi: 10.1080/00223891.1990.9674054
Keywords: reasoning, response format, multiple choice, free response, fairness
Citation: Breuer S, Scherndl T and Ortner TM (2020) Effects of Response Format on Psychometric Properties and Fairness of a Matrices Test: Multiple Choice vs. Free Response. Front. Educ. 5:15. doi: 10.3389/feduc.2020.00015
Received: 02 September 2019; Accepted: 03 February 2020;
Published: 20 February 2020.
Edited by:
Mustafa Asil, University of Otago, New ZealandReviewed by:
Okan Bulut, University of Alberta, CanadaHaci Bayram Yilmaz, Ondokuz Mayıs University, Turkey
Copyright © 2020 Breuer, Scherndl and Ortner. This is an open-access article distributed under the terms of the Creative Commons Attribution License (CC BY). The use, distribution or reproduction in other forums is permitted, provided the original author(s) and the copyright owner(s) are credited and that the original publication in this journal is cited, in accordance with accepted academic practice. No use, distribution or reproduction is permitted which does not comply with these terms.
*Correspondence: Sonja Breuer, c29uamEuYnJldWVyQHNiZy5hYy5hdA==