 Shishir P. S. Chundawat
 Nirmal Uppugundla2
 Venkatesh Balan
 Bruce E. Dale
- 1Department of Chemical and Biochemical Engineering, Rutgers-State University of New Jersey, Piscataway, NJ, USA
- 2Department of Chemical Engineering and Materials Science, Michigan State University, East Lansing, MI, USA
- 3Center for Statistical Training and Consulting (CSTAT), Michigan State University, East Lansing, MI, USA
Most cellulolytic enzyme blends, either procured from a commercial vendor or isolated from a single cellulolytic microbial secretome, do not efficiently hydrolyze ammonia-pretreated (e.g., ammonia fiber expansion, AFEX) lignocellulosic agricultural crop residues like corn stover to fermentable sugars. Typically reported commercial enzyme loading (30–100 mg protein/g glucan) necessary to achieve >90% total hydrolysis yield (to monosaccharides) for AFEX-treated biomass, within a short saccharification time frame (24–48 h), is economically unviable. Unlike acid-based pretreatments, AFEX retains most of the hemicelluloses in the biomass and therefore requires a more complex suite of enzymes for efficient hydrolysis of cellulose and hemicellulose at industrially relevant high solids loadings. One strategy to reduce enzyme dosage while improving cocktail effectiveness for AFEX-treated biomass has been to use individually purified enzymes to determine optimal enzyme combinations to maximize hydrolysis yields. However, this approach is limited by the selection of heterologous enzymes available or the labor required for isolating low-abundance enzymes directly from the microbial secretomes. Here, we show that directly blending crude cellulolytic and hemicellulolytic enzymes-rich microbial secretomes can maximize specific activity on AFEX-treated biomass without having to isolate individual enzymes. Fourteen commercially available cellulolytic and hemicellulolytic enzymes were procured from leading enzyme companies (Novozymes®, Genencor®, and Biocatalysts®) and were mixed together to generate several hundred unique cocktail combinations. The mixtures were assayed for activity on AFEX-treated corn stover (AFEX-CS) using a previously established high-throughput methodology. The optimal enzyme blend combinations identified from these screening assays were enriched in various low-abundance hemicellulases and accessory enzymes typically absent in most commercial cellulases cocktails. Our simple approach of blending crude commercially available enzyme cocktails allowed a drastic fourfold reduction in total enzyme requirements (from 30 to 7.5 mg enzyme/g glucan loading) to achieve near-theoretical cellulose and hemicellulose saccharification yields for AFEX-CS.
Introduction
Depleting crude oil reserves climate change due to large-scale fossil fuels combustion, energy security-related concerns, and increasing rural economic development have attracted interests toward utilization of renewable lignocellulosic feedstocks for production of fuels and chemicals (Chundawat et al., 2011a; Chu and Majumdar, 2012). One of the major bottlenecks for the cellulosic ethanol industry is the relatively high cost of enzymes necessary to hydrolyze plant polysaccharides into fermentable sugars. The cornstarch-based ethanol process requires around $0.02–0.05/gal ethanol enzyme costs, whereas most cellulosic ethanol processes requires 15–30 mg/g glucan enzyme dosage which is equivalent to roughly $0.30–0.60/gal ethanol cost contribution from enzymes alone (James and Lee, 1997; Lau et al., 2012; Davis et al., 2015). Therefore, reduction in total enzyme loading for pretreated lignocellulosic biomass saccharification can aid in the commercialization of next-generation cellulosic biofuel refineries.
Commercially available enzymes (e.g., from Novozymes) are typically evaluated for their hydrolytic efficiency on model substrates like Avicel (crystalline cellulose), xylan extracts (oat spelled, birch wood), p-nitrophenol-based glycosides, and other model substrates (Bhat and Hazlewood, 2001). However, several studies have shown that model cellulosic and hemicellulosic substrates do not provide a reliable indication of their true hydrolytic potential on pretreated lignocellulosic biomass relevant to cellulosic refineries (Kabel et al., 2006; Berlin et al., 2007; Chundawat et al., 2011d). Non-specific protein-binding variations in physicochemical properties of pretreated cell walls and synergistic interactions between enzymes are typically the cause of these substrate-specific enzyme activity-based differences. For pretreated biomass with a complex cell wall ultrastructure, selecting appropriate enzyme cocktails is critical to maximize overall yield of fermentable sugars. Considering that most alkaline pretreatments and low-severity acidic pretreatments leave behind a large fraction of unhydrolyzed hemicelluloses (Mosier et al., 2005; Chundawat et al., 2011a), it is more appropriate to directly screen and optimize enzyme mixtures on pretreated lignocellulosic substrates using high-throughput assays (Gao et al., 2010a).
Optimization of multienzyme systems using a suitable design of experiments is critical to enhance biomass saccharification into monomeric sugars. Interestingly, mixtures of enzymes that give the highest saccharification rate do not always correlate with enzyme mixtures that give the highest degree of synergy (Boisset et al., 2001). In addition, it has been shown that most cellulase inducers used for commercial-scale production can promote synthesis of equivalent amounts of the three major cellulases (e.g., CBH I, CBH II, and EG I) in Trichoderma reesei (Saloheimo et al., 1998). This is due to the highly coordinated regulation and expression of certain cellulase genes that is a function of carbon and inducer source. This phenomenon is similarly complex for hemicellulases expression and varies significantly based on the substrate used for induction (Bhat and Hazlewood, 2001). Most commercial enzymes (CEs), typically produced using native/engineered T. reesei or Aspergillus niger, do not have the optimal protein ratios or the types of enzyme activities necessary to efficiently hydrolyze pretreated lignocellulosic biomass. This is partly due to the fact that there has been no evolutionary pressure on fungi (like T. reesei) to grow on pretreated lignocellulosics to maximize biomass digestibility. One approach that is extensively used in the literature to improve enzyme cocktails is to purify individual enzymes from naturally occurring cellulolytic microbial secretomes and then optimize their combinations to maximize conversion for specific pretreated biomass (Banerjee et al., 2010b; Gao et al., 2010a, 2011b). However, it is extremely challenging to purify every individual protein with sufficiently high purity and obtain low-abundance enzymes for rapidly adjusting enzyme cocktails for varying feedstock composition in a commercially relevant cellulosic biorefinery setting.
Therefore, directly optimizing crude enzyme cocktails from diverse microbial secretomes to maximize total sugar hydrolysis yields, as a function of varying ratios of individual secretomes, is one practical approach to consider. Ultimately, this approach can also help identify critical low-abundance enzymes and optimal individual enzyme ratios to produce an ideal enzyme cocktail from an engineered microbial system (Thomas et al., 1995; Yamada et al., 2010). The optimum enzyme ratios can also help determine the necessary enzyme components and rationally design heterologous expression systems for consolidated biological processing (Lynd et al., 2002; Yamada et al., 2010). However, multienzyme mixture optimization can get cumbersome without the use of suitable statistical tools, such as factorial- and mixture-based statistical experimental designs (Scheffé, 1963; Kim et al., 1998). Here, we optimize crude cellulolytic and hemicellulolytic enzyme-rich microbial secretomes from various leading enzyme companies (Novozymes®, Genencor®, and Biocatalysts®) using a high-throughput screening approach to maximize saccharification of ammonia fiber expansion (AFEX)-pretreated corn stover (CS). Our “shotgun” high-throughput screening approach of blending crude commercially available enzyme cocktails into hundreds of unique blends and their detailed compositional/activity characterization allowed us to drastically reduce the total enzyme loading necessary to achieve near-theoretical cellulose and hemicellulose saccharification yields for AFEX-treated corn stover (AFEX-CS) compared to all of the original secretomes.
Materials and Methods
Substrates
Kramer CS was provided by the National Renewable Energy Laboratory (NREL; Golden, CO, USA). The biomass had been pre-milled and passed through a 10-mm screen at NREL. AFEX pretreatment for CS (AFEX-CS) was carried out at 130 ± 10°C, 60% moisture loading, 1:1 NH3 to biomass loading (w/w) for 15 min total residence time (Chundawat et al., 2010). The pretreated substrate particle size was reduced using a centrifugal mill with an 80-µm sieve attachment (Chundawat et al., 2008). The glucan, xylan, and arabinan composition of AFEX-CS, determined using standard NREL biomass compositional analysis method (Sluiter et al., 2010), was 33.5 ± 1.1, 23.4 ± 0.3, and 3.5 ± 0.2%, respectively.
Enzymes
The following standard CE preparations were provided by Genencor-Danisco Inc. (Genencor Division, Rochester, NY, USA): Spezyme CP (CE 1), Multifect Xylanase (CE 3), Multifect Pectinase (CE 4), and Accellerase 1000 (CE 6). Depol 670L (CE 5) was provided by Biocatalysts Inc. (Cardiff, UK). Novozyme 188 (CE 2) was procured from Sigma-Aldrich (St Louis, MO, USA). The following eight research-grade enzymes (RE) preparations were a kind gift from Novozyme (Davis, CA, USA): NS22002 (RE 1), NS50010 (RE 2), NS50012 (RE 3), NS50013 (RE 4), NS50014 (RE 5), NS50029 (RE 6), NS50030 (RE 7), and NS50053 (RE 8). Protein concentrations were determined using the Kjeldahl nitrogen analysis method (in triplicates by Dairy One Cooperative Inc., Ithaca, NY, USA). The non-protein equivalents (e.g., urea and ammonium salts estimated by AOAC Method 941.04) was subtracted from the Kjeldahl total crude protein equivalents (estimated by AOAC Method 2001.11) to determine true protein content (6.25×% Nitrogen) and are originally reported elsewhere (Chundawat et al., 2011d).
Biomass Hydrolysis Assay
Detailed protocols for microplate-based enzymatic hydrolysis and monosaccharide analysis (i.e., glucose, xylose) are provided elsewhere (Chundawat et al., 2008, 2011b; Gao et al., 2010a). Briefly, the hydrolysis experiments were performed in 2.2-ml deep-well microplates at 0.2% (w/w) total glucan loading along with 50 mM citrate buffer (pH 5.0) in a total volume of 500 µl per well. The microplates were maintained at 50°C in a shaking incubator at 200 rpm for defined time periods. All experiments were carried out in quadruplicate and average values and SDs are reported here.
Statistical Analysis
Minitab (Version 15.0, Minitab Inc., State College, PA, USA) and SPSS (IBM SPSS Statistics, Chicago, IL, USA) based statistical software were used to create suitable experimental designs and analyze the data, respectively. Our regression analysis suggested that quadratic and quaternary interaction terms based model regressions did not accurately predict the variance (low R2 and high σ values) in the data as compared to special cubic interaction terms based regression models. The σ (sigma or S) and R2 values were also closely analyzed for comparing models; all σ-values suggested that the first SD of residuals was relatively small (<5%). The σ-values for xylan conversion were slightly higher than those for glucan conversion. High R2 and R2 (adjusted) values (>80%) indicate that the models account for majority of the variation in the dataset and were not a result of over fitting. High R2 (predicted) (>80%) values indicate that the models had significant predictive capabilities.
Results and Discussion
CEs Give Poor Hydrolytic Activity on AFEX-Pretreated CS
All 14 procured enzymes cocktails from commercial vendors were tested for their respective activity on AFEX-CS at 4 different protein loadings (60, 30, 15, and 7.5 mg/g glucan) at two time points (6 and 24 h; Figure 1). The enzyme source, protein concentration determination, and relative specific activity on various model substrates are provided in Supplementary Material (see Appendix SA-I-4, SA-I-5, and SA-I-6 in Supplementary Material). Enzyme activity assays for all 14 CE on several model substrates (Avicel, carboxymethylcellulose, oat spelled xylan, p-nitrophenyl xyloside, p-nitrophenyl arabinoside, p-nitrophenyl acetate, and p-nitrophenyl glycoside) has been already reported elsewhere (Chundawat et al., 2011d) and reproduced here for the sake of comparison.
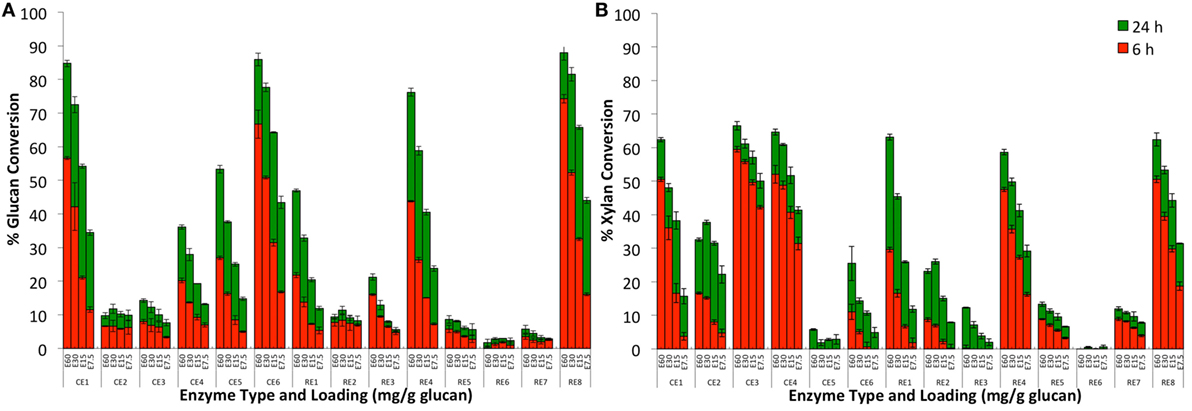
Figure 1. Glucan-to-glucose (A) and xylan-to-xylose (B) percent conversion for AFEX-treated corn stover after 6 (red) and 24 (green) hours of hydrolysis using individual commercial (CE1–CE6) and research (RE1–RE8) grade enzymes. Four total protein loadings were employed in each case, namely, 60 (E60), 30 (E30), 15 (E15), and 7.5 (E7.5) mg total protein per g glucan.
The individual enzyme blends mixtures gave widely varying activities on AFEX-CS (i.e., glucose and xylose yields) that seemed to correlate with the absence of certain glycosyl hydrolase families identified in a recent proteomics study (Chundawat et al., 2011d). Based on the results of this proteomics study, the composition for all original blends or mixtures prepared using these blends can be crudely estimated (see Supplementary Material for details on individual glycosyl hydrolase or GH family abundance). Six of the original fourteen enzyme blends (CE 1, CE 5, CE 6, RE 1, RE 4, and RE 8) gave greater than 50% glucan conversion within the first 24 h for the highest protein loading tested (60 mg/g glucan). Protein composition data revealed that these enzyme blends had greater than 25% cellobiohydrolase enzyme content (total protein basis), thus justifying the high cellulase activity seen on AFEX-CS. Other enzyme blends that gave lower glucan conversion were either deficient in exo/endocellulases or β-glucosidases. RE 2, which is abundant in β-glucosidases but deficient in exo-cellulases, gave close to 5–10% glucan conversion suggesting that several gluco-oligomers released from the cell wall after AFEX pretreatment are relatively easily digested to glucose by β-glucosidases. Recent analysis of oligomers released from the cell wall after AFEX pretreatment have revealed the presence of a range of low- to high-molecular weight oligosaccharides with degree of polymerization ranging from 2 to 20 (Chundawat et al., 2010; Vismeh et al., 2013).
All enzyme blends except CE 5 and CE 6 which gave high glucan conversions were also found to result in greater than 50% xylan conversion within 24 h for the highest protein loading employed. Protein composition data revealed that the high xylose yielding enzyme blends (CE 1, CE 3, CE 4, RE 1, RE 4, and RE 8) were abundant in endo- and exo-xylanases (e.g., β-xylosidase). In addition, CE 3 and CE 4 were also found to give high xylose yields even at lower protein loadings unlike the cellulase-abundant blends. CE 3 was abundant in endoxylanases, while CE 4 was abundant in other accessory enzymes (e.g., α-arabinofuranosidases) as well. CE 5 and RE 6 gave the lowest xylose yields as these blends were deficient in both endoxylanases and β-xylosidases. Some cellulase blends (like CE 6) gave lower xylose yields possibly due to deficiency in accessory enzymes (e.g., α-arabinofuranosidases, α-glucuronidase) necessary for efficient hemicellulose deconstruction. Interestingly, α-arabinofuranosidases (GH 54 in particular) and α-glucuronidase were the only two major accessory enzymes that were deficient or absent in CE 6 versus CE 1. This observation could explain the differences in xylose yields seen for both enzyme blends and has been verified using purified enzyme-based assays on AFEX-CS (Gao et al., 2011b). CE 2 is a common CE blend that is used extensively to supplement cellulase cocktails for cellobiase activity. However, CE 2 is also abundant in amylases and other non-cellulolytic proteins (which are greater than 70% in total protein abundance) with minor amounts of β-glucosidase. Based on these results, it seems that it would be more beneficial to use CE 4 to supplement accessory enzymes (inclusive of β-glucosidase along with several other accessory glycosyl hydrolases) for pretreated biomass rather than using CE 2.
Pearson correlation coefficients (r) were determined for each CE type and the slopes of glucan/xylan conversions across varying protein loadings (slope was determined as net % conversion per milligram total protein loaded; data not shown). This analysis was carried out to determine if there were any low-abundance enzyme components within each blend that were critical to hydrolysis yields. There are a number of significant correlations, including those between RE 1 and xylan slope (r = 0.425, p < 0.05), between RE 8 and glucan slope (r = 0.424, p < 0.05), and CE 1 and both xylan (r = 0.549, p < 0.05) and glucan slopes (r = 0.390, p < 0.05). Pearson correlations were also tested between groups of different enzyme families based on predicted proteomics composition and the slopes of glucan/xylan conversions across varying protein loadings. The enzyme compositions within each CE/RE mixture were grouped as follows (see Appendix SA-I in Supplementary Material for details on enzyme/protein family name acronyms): (a) total cellobiohydrolases (CBH), (b) total endoglucanases (EG), (c) total β-glucosidases (BG), (d) total CBH + EG, (e) total CBH + EG + BG, (f) total endoxylanases (EX), (g) total EX and β-xylosidase (BX), (h) total EX + BX + EG, (i) total arabinofuranosidases (ABF), (j) total ABF + BX, and (k) total ABF + EX + BX and α-glucuronidases (αGLUC). There are a number of significant correlations including those between total CBH and both glucan (r = 0.914, p < 0.01) and xylan (r = 0.551, p < 0.01) slopes, between total EG and both glucan (r = 0.888, p < 0.01) and xylan (r = 0.485, p < 0.01) slopes, between total CBH + EG and both glucan (r = 0.926, p < 0.05) and xylan (r = 0.545, p < 0.05) slopes, and between total CBH + EG + BG and both glucan (r = 0.919, p < 0.05) and xylan (r = 0.578, p < 0.05) slopes. These results validate previous findings that glucan/xylan yields are highly correlated and enzymes that facilitate glucan hydrolysis (CBH, EG, and BG) also facilitate increased digestibility of xylans by hemicellulases or multifunctional glycosyl hydrolases like EG I (Gao et al., 2010a; Chundawat et al., 2011b).
In addition, we found that the glucan-to-glucose conversion was strongly correlated (R2 = 0.92) to the total CBH + EG + BG content (Figure 2). However, the correlation between xylan-to-xylose conversion and total ABF + EX + BX + αGLUC content was relatively weaker (R2 = 0.11). This suggests that increased relative loading of core cellulases (CBH, EG, and BG) gives concomitant increase in glucan-to-glucose conversion. On the contrary, increased supplementation of major hemicellulases (EX, ABF, BX, or αGLUC) alone does not necessarily increase xylan-to-xylose conversion. This is likely due to missing synergistic, complementary families of accessory enzymes that are necessary to completely hydrolyze hemicellulose. Therefore, to achieve higher specific activity on alkaline pretreated biomass like AFEX-CS, it is necessary to complement the core cellulase cocktail with additional hemicellulases/accessory enzymes. A similar strategy using purified synergistic glycosyl hydrolases has resulted in maximizing AFEX-CS digestibility in recent years by our group (Gao et al., 2010a,b, 2011b) and others (Banerjee et al., 2010a,b). Based on the proteomics compositional analysis data and activities of the individual enzyme blends on AFEX-CS, six-core cellulases (CE 1, CE 5, CE 6, RE 1, RE 4, and RE 8) were selected for further studies.
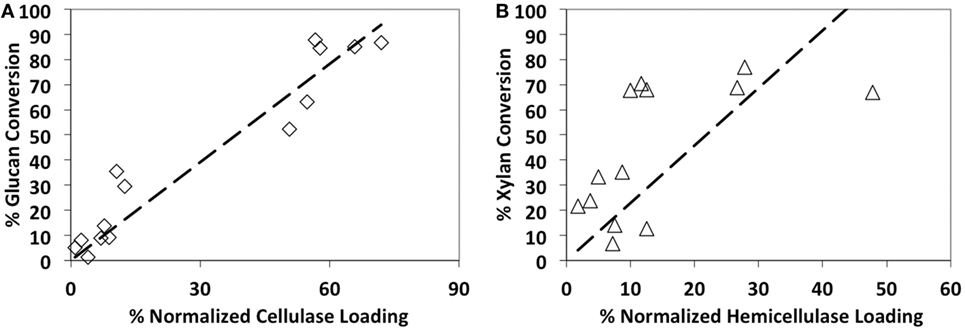
Figure 2. Glucan-to-glucose (A) and xylan-to-xylose (B) percent conversions correlation to total available cellulases and hemicellulases loading, respectively. AFEX-treated corn stover was hydrolyzed using 14 commercial cocktails (60 mg/g glucan loading) for 24 h hydrolysis. Cellulase composition includes cellobiohydrolases, endocellulases, and β-glucosidase, whereas hemicellulase composition includes endoxylanases, arabinofuranosidases, α-glucuronidase, and β-xylosidases.
Determining the Best Commercial Cellulase Blend for Accessory Enzyme Supplementation
From the previous results and proteomics study, it was clear that none of the individual commercial blends had all the enzymes necessary for simultaneously maximizing both glucan and xylan conversions (Chundawat et al., 2011d). The selected core cellulases (CE 1, CE 5, CE 6, RE 1, RE 4, and RE 8) contain significant amounts of exo- and endocellulases but were found to lack several crucial accessory enzymes that are necessary to completely digest both glucan/xylan. To address this issue and identify a single best cellulase blend for further screening efforts, we compared the relative activity of all six core cellulases supplemented with equal amounts of the seven predominantly accessory enzyme blends (CE 2, CE 3, CE 4, RE 3, RE 5, RE 6, and RE 7) in an equi-mass ratio.
Our previous proteomics study has shown that the hemicellulases and accessory enzymes in our collection represent nearly all major families of glycosyl hydrolases necessary for hydrolysis of lignocellulose to monomeric sugars (Chundawat et al., 2011d). Therefore, addition of all accessory enzymes in excess would allow us to make a reasonably fair comparison of relative efficacy of each core cellulase cocktails that otherwise contain highly variable but limited amounts of hemicellulolytic enzymes. The total enzyme loading was fixed at 30 mg/g glucan loading with the % core cellulase loading relative to the total accessory enzyme loaded varied from 0 to 100% (0, 25, 50, 75, and 100% core cellulase). The results from these assays are shown in Figure 3. CE 6 and RE 8 stood out as the best performing single cellulase blends with respect to glucan conversion. However, with respect to xylan conversion, RE 8 was the best performing core cellulase blend. Addition of only the accessory enzymes (no cellulase blends added) gave low glucan (25%) but high xylan (80%) conversion. Supplementing 25% of the total protein loading with the accessory enzymes resulted in all six-core cellulases giving much higher glucan and xylan conversions. RE 4 benefited the most upon supplementation of the accessory enzyme blend. However, RE 8 that was found to be the best performing cellulase blend (based on both glucan and xylan conversions), when supplemented with various ratios of accessory enzymes (6 and 24 h). Our previous work has shown that xylo-oligosaccharides are extracted and deposited on outer cell wall surfaces after AFEX pretreatment, which makes this polysaccharide fraction more readily accessible by hemicellulases (Chundawat et al., 2011c). However, insoluble glucan polymers like cellulose are still embedded within the cell wall that limits its accessibility to enzymes. This can partly explain the slower rate of glucan hydrolysis relative to xylan hydrolysis (6 versus 24 h). Similar differences in relative rate of hydrolysis of cellulose versus hemicellulose have also been reported using purified, single-component enzymes acting on AFEX-treated CS in the past as well (Gao et al., 2010a, 2011b).
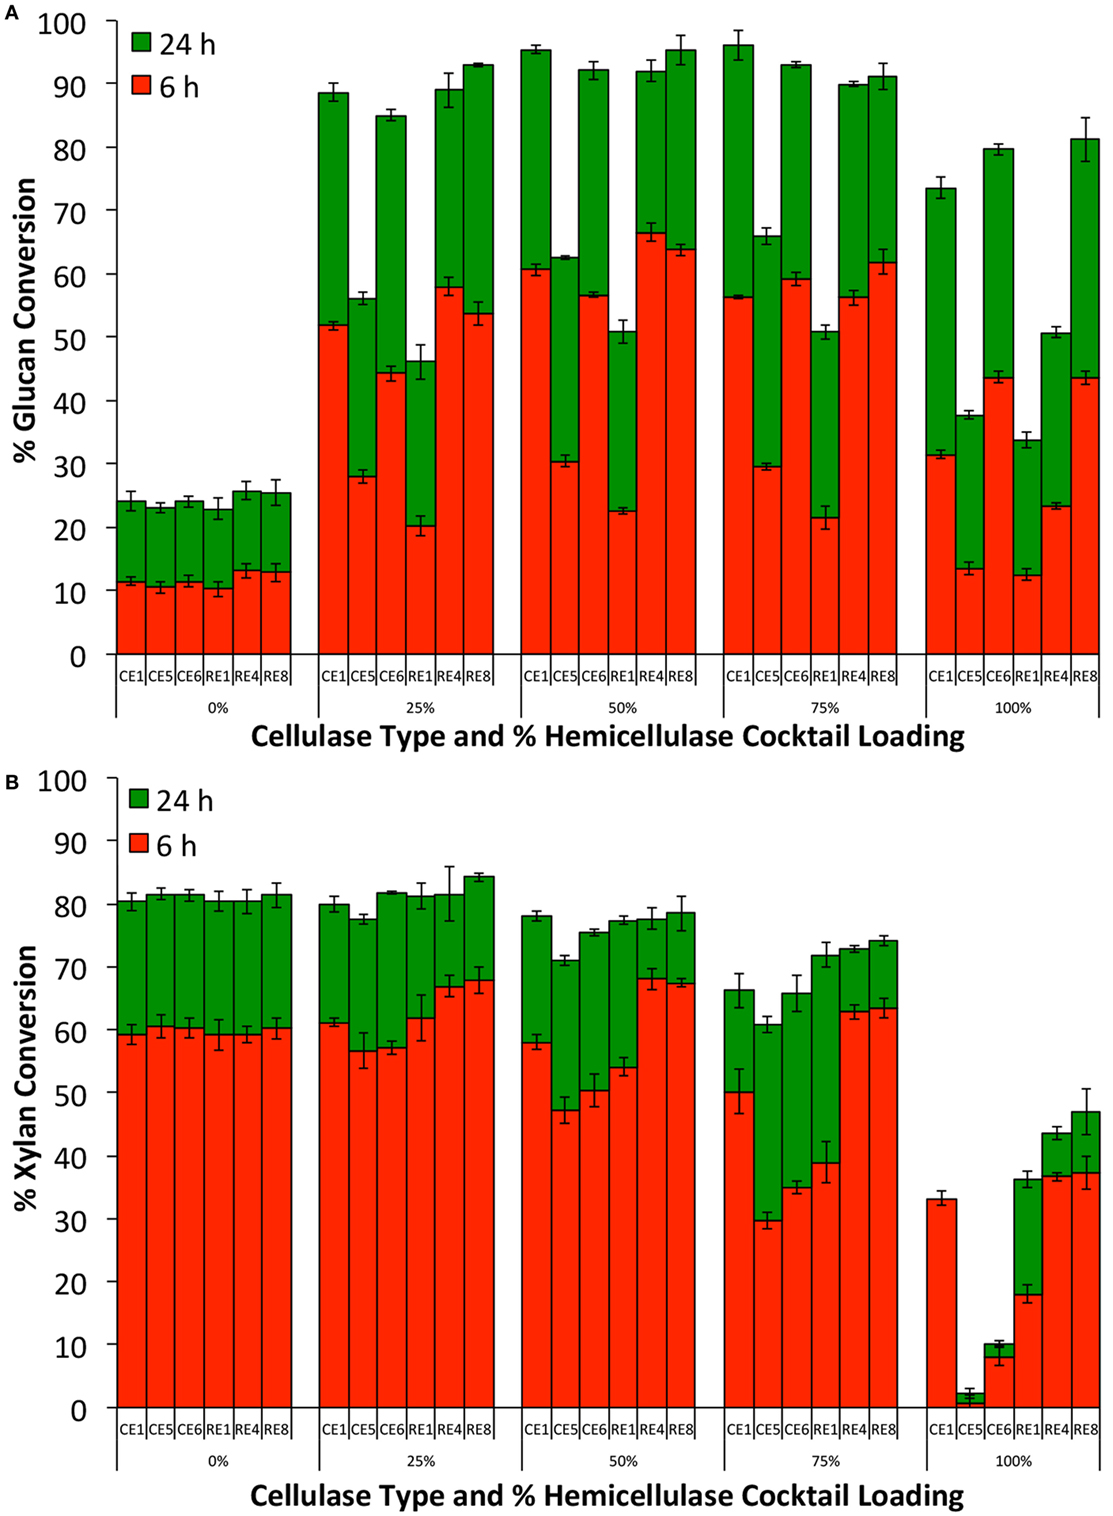
Figure 3. Glucan-to-glucose (A) and xylan-to-xylose (B) percent conversions for ammonia fiber expansion treated corn stover after 6 and 24 h hydrolysis to determine best cellulase core cocktail. Six-core cellulase cocktails (CE 1, CE 5, CE 6, RE 1, RE 4, and RE 8) were tested in varying ratios (0–100% of total cellulase loading) with an accessory enzyme cocktail (equi-mass loading of CE 2, CE 3, CE 4, RE 3, RE 5, RE 6, and RE 7). Total protein loading was 30 mg/g glucan in all cases.
Hemicellulases and Accessory Enzymes Combinatorial Screening
Based on the previous results, RE 8 was identified for further screening studies. The core cellulase mixture RE 8 was supplemented with varying combinations of a minimal set of the accessory enzymes to determine which combination gave the highest glucan and xylan conversions (see Appendix SA-I-1 in Supplementary Material). Seven accessory enzymes were added in unary, binary, ternary, quaternary, quinary, senary, and septenary combinations (equi-mass loadings at 15 mg/g glucan).
The 128 enzyme mixture groups were rank ordered by glucan and xylan conversion and the top 20% performing mixtures for both sets were closely examined. Of the total number of mixtures that gave the highest glucan conversion, 100% had RE 7, 76% had CE 2, and 71% had CE 4. The next highest was RE 3, which was present in only 52% of all top-performing mixtures, followed by CE 3, RE 5, and RE 6, which were in 48, 38, and 33% of the best mixtures, respectively. Of the samples with the highest xylan conversion, 100% had CE 4 and 94% had RE 7. The next highest was CE 2, which was present in only 56% of samples, followed by CE 3, RE 6, RE 3, and RE 5, which were in 44, 38, 31, and 31% of the samples, respectively. Through this analysis, CE 4 and RE 7 were seen to be the dominant accessory enzymes present in mixtures that gave the highest glucan and xylan conversions.
From the combinatorial screening experiments, CE 4, RE 7, and CE 3 gave the highest activity in combination with RE 8. The optimum mixture composition for these four enzymes to maximize glucan, xylan, or glucan + xylan conversion was determined using a design of experiments approach for three different protein loadings (see Appendix SA-I-2 and SA-I-3 in Supplementary Material). Interestingly, the optimal mixture composition that maximized both glucan and xylan conversion was strongly dependent on the total protein loading employed. At lower total protein loadings (7.5 versus 30 mg/g glucan), a greater fraction of RE 8 (core cellulase) cocktail was required. These results validate recent findings that have also suggested that the relative ratio of cellulases is more important at lower total protein loadings (Gao et al., 2010a).
Comparing Optimal Enzyme Mixtures versus Non-optimal CE Blends
The optimal enzyme combinations of RE 8, CE 4, RE 7, and CE 3 identified earlier were tested against non-optimal, original individual enzymes (Figures 4–6). The hydrolysis was performed for three enzyme loadings (7.5, 15, and 30 mg/g glucan loading). We found that irrespective of the enzyme loading employed, the optimal enzyme blends always gave 10–25% higher (absolute conversion basis) glucan or xylan conversions to monosaccharides compared to the original, individual blends. An interesting point to note was that the difference in glucan conversion for the optimal versus non-optimal blends increased at lower total protein loadings. This result is consistent with studies indicating that residual lignin within pretreated biomass can bind cellulases non-productively (Gao et al., 2011a, 2014; Rahikainen et al., 2011). Therefore, with an increased fraction of non-productively bound enzymes at lower protein loadings, the need for optimal enzyme mixtures becomes even more apparent. Optimizing CE blends on AFEX-CS resulted in up to fourfold or greater reduction in total protein loading necessary to achieve equivalent glucan-to-glucose and xylan-to-xylose yields. Similarly, analysis of the glucan hydrolysis reaction half times (Table 1) suggested that there was up to threefold improvement in specific activity for the optimal versus non-optimal enzyme mixtures.
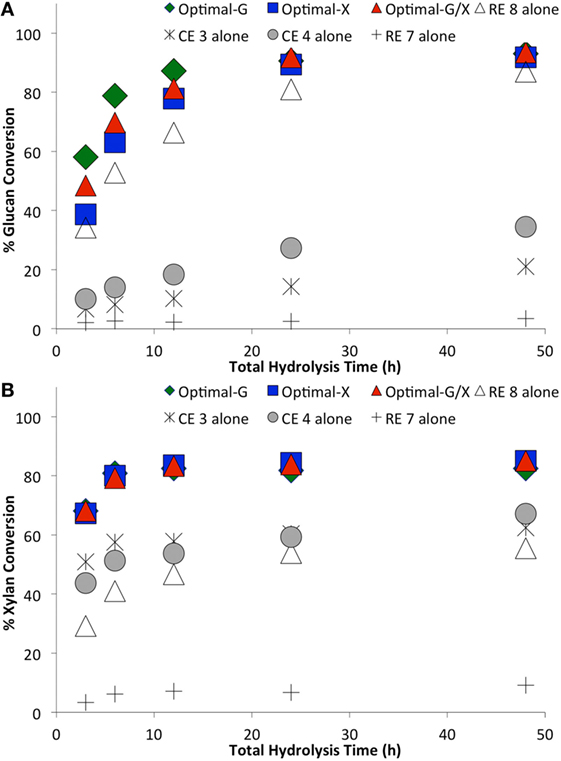
Figure 4. Comparing optimal versus non-optimal commercial enzyme (CE) combinations on glucan-to-glucose (A) and xylan-to-xylose (B) percent conversions for ammonia fiber expansion-treated corn stover as a function of hydrolysis time. Total protein loading was 30 mg/g glucan. Optimal G, optimal X, and optimal G/X represent enzyme combinations that gave the highest glucose, xylose, and total sugar (glucose + xylose) yields, respectively. Mean values are reported here, while SDs in all cases was less than 2% and is not shown here for sake of clarity.
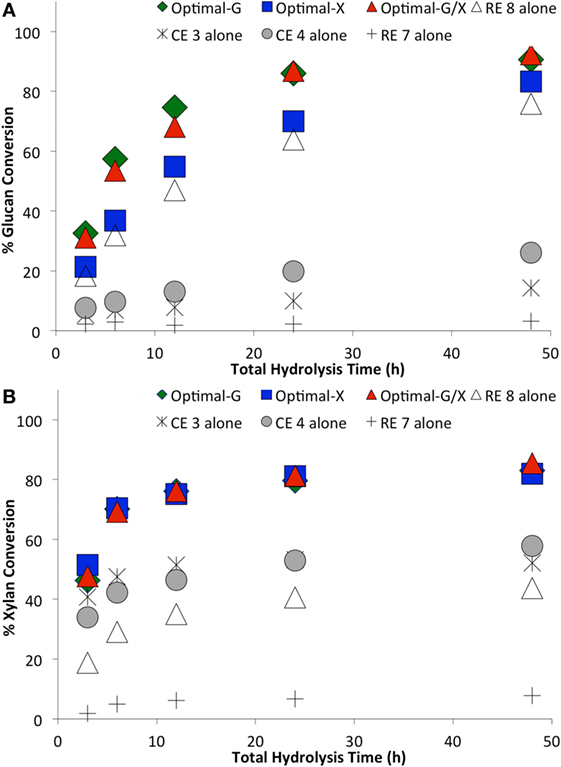
Figure 5. Comparing optimal versus non-optimal commercial enzyme (CE) combinations on glucan-to-glucose (A) and xylan-to-xylose (B) percent conversions for ammonia fiber expansion-treated corn stover as a function of hydrolysis time. Total protein loading was 15 mg/g glucan. Optimal G, optimal X, and optimal G/X represent enzyme combinations that gave the highest glucose, xylose, and total sugar (glucose + xylose) yields, respectively. Mean values are reported here, while SDs in all cases was less than 2% and is not shown here for sake of clarity.
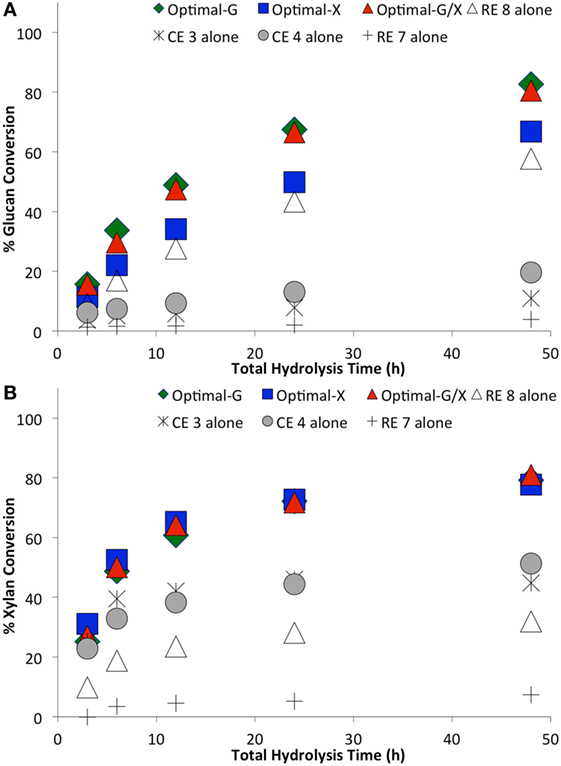
Figure 6. Comparing optimal versus non-optimal commercial enzyme (CE) combinations on glucan-to-glucose (A) and xylan-to-xylose (B) percent conversions for ammonia fiber expansion-treated corn stover as a function of hydrolysis time. Total protein loading was 7.5 mg/g glucan. Optimal G, optimal X, and optimal G/X represent enzyme combinations that gave the highest glucose, xylose, and total sugar (glucose + xylose) yields, respectively. Mean values are reported here, while SDs in all cases was less than 2% and is not shown here for sake of clarity.
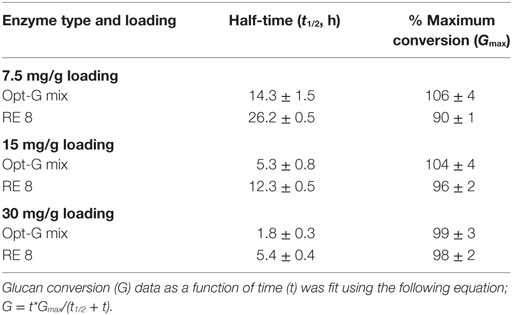
Table 1. Analysis of half times (t1/2) required to achieve 50% of maximum possible glucan conversion (Gmax) for optimal and non-optimal enzyme mixtures, shown in Figures 4–6.
Enzyme Compositions of Top-Performing Mixtures versus Leading CEs
Proteomics analysis has been carried out previously to estimate the absolute abundance of key cellulolytic, hemicellulolytic, and accessory enzymes present in each of the 14 CE cocktails (Chundawat et al., 2011d). Protein abundance within each cocktail was determined based on the total observed peptide spectral counts (see Appendix SA-I-6 in Supplementary Material). Carbohydrate-active enzymes (CAZy) have been classified into various CAZy families based on sequence and structural similarity (Henrissat et al., 1991). Catalytic domains for glycosyl hydrolases (GH) from the same family have similar three-dimensional fold and substrate specificity. Despite some limitations associated with this proteomics-based compositional analysis approach (e.g., poor correlation between GH family and specific activity, presence of multifunctional enzymes), the protein composition of each CE blend based on various GH families can be used to determine the minimal set of enzymes necessary for efficient hydrolysis of pretreated biomass in a semi-quantitative manner. In order to further characterize the relationship between enzyme composition and hydrolytic performance, we designed a series of high-throughput assays using more than 750 unique enzyme combinations of the original 14 enzyme set (see Appendix SA-II in Supplementary Material for details). The diverse enzyme mixtures set were based on a simplex-centroid experimental design approach (Scheffé, 1963). In addition to creating a diverse collection of unique enzyme mixtures, this approach also allows calculation of a multidimensional polynomial-based mixture regression equation, with each regression term representing the relative effect of single enzymes, binary enzyme synergies (the product of the concentration of two enzyme cocktails and a regression coefficient), ternary enzyme synergies, and so forth. Depending on the order of the regression equation, the magnitude of the regression coefficient indicates the relative importance of any particular enzyme cocktail or enzyme synergies (see Eq. 1 below).
where Y is the response variable (e.g., % glucan-to-glucose conversion); q is the number of enzymes; xi is the proportion of the ith enzyme in the mixture; and βij…m is the coefficient of synergy for m enzymes. The magnitude of each βij…m indicates the strength of a particular enzyme or synergistic interaction.
Three simplex-centroid experiments were designed (Appendix SA-II-1, SA-II-6 and SA-II-9 in Supplementary Material), as reported elsewhere (Chundawat and Dale, 2009), and described here briefly: (1) 8 CE-RE Experiment: adding 8 mg total protein/g glucan of eight accessory enzymes—CE2, CE3, CE4, RE1, RE3, RE5, RE6, and RE7—to 8.5 mg of CE6/g glucan of AFEX-CS; (2) 10 CE-RE Experiment: adding 16.5 mg protein/g glucan of ten enzymes—CE1, CE3, CE4, CE5, CE6, RE1, RE2, RE4, RE7, and RE8; and (3) 5 CE-RE Experiment: adding 16.5 mg protein/g glucan of one major cellulase (either one of CE1, CE6, or RE4), CE4, CE5, RE1, and RE7. The assays were conducted for 24 h and end products were analyzed to estimate glucan/xylan conversions to their respective monosaccharides. The total sugar yield spanned from 20 to 540 g/kg biomass, while nearly all individual CE blends gave between 330 and 380 g/kg biomass (Figure 7). Third-degree mixed stepwise (α-to-enter/α-to-leave: 0.15) regressions were performed on the results (% glucan conversion, % xylan conversion, total glucose and xylose released as gram sugar per kilogram dry weight biomass) of each experimental dataset to generate models (see Appendix SA-II-2, SA-II-6 in Supplementary Material) predicting response as function of enzyme mixture composition, with the stepwise regression algorithm preserving statistically significant interaction effects (Box et al., 1978).
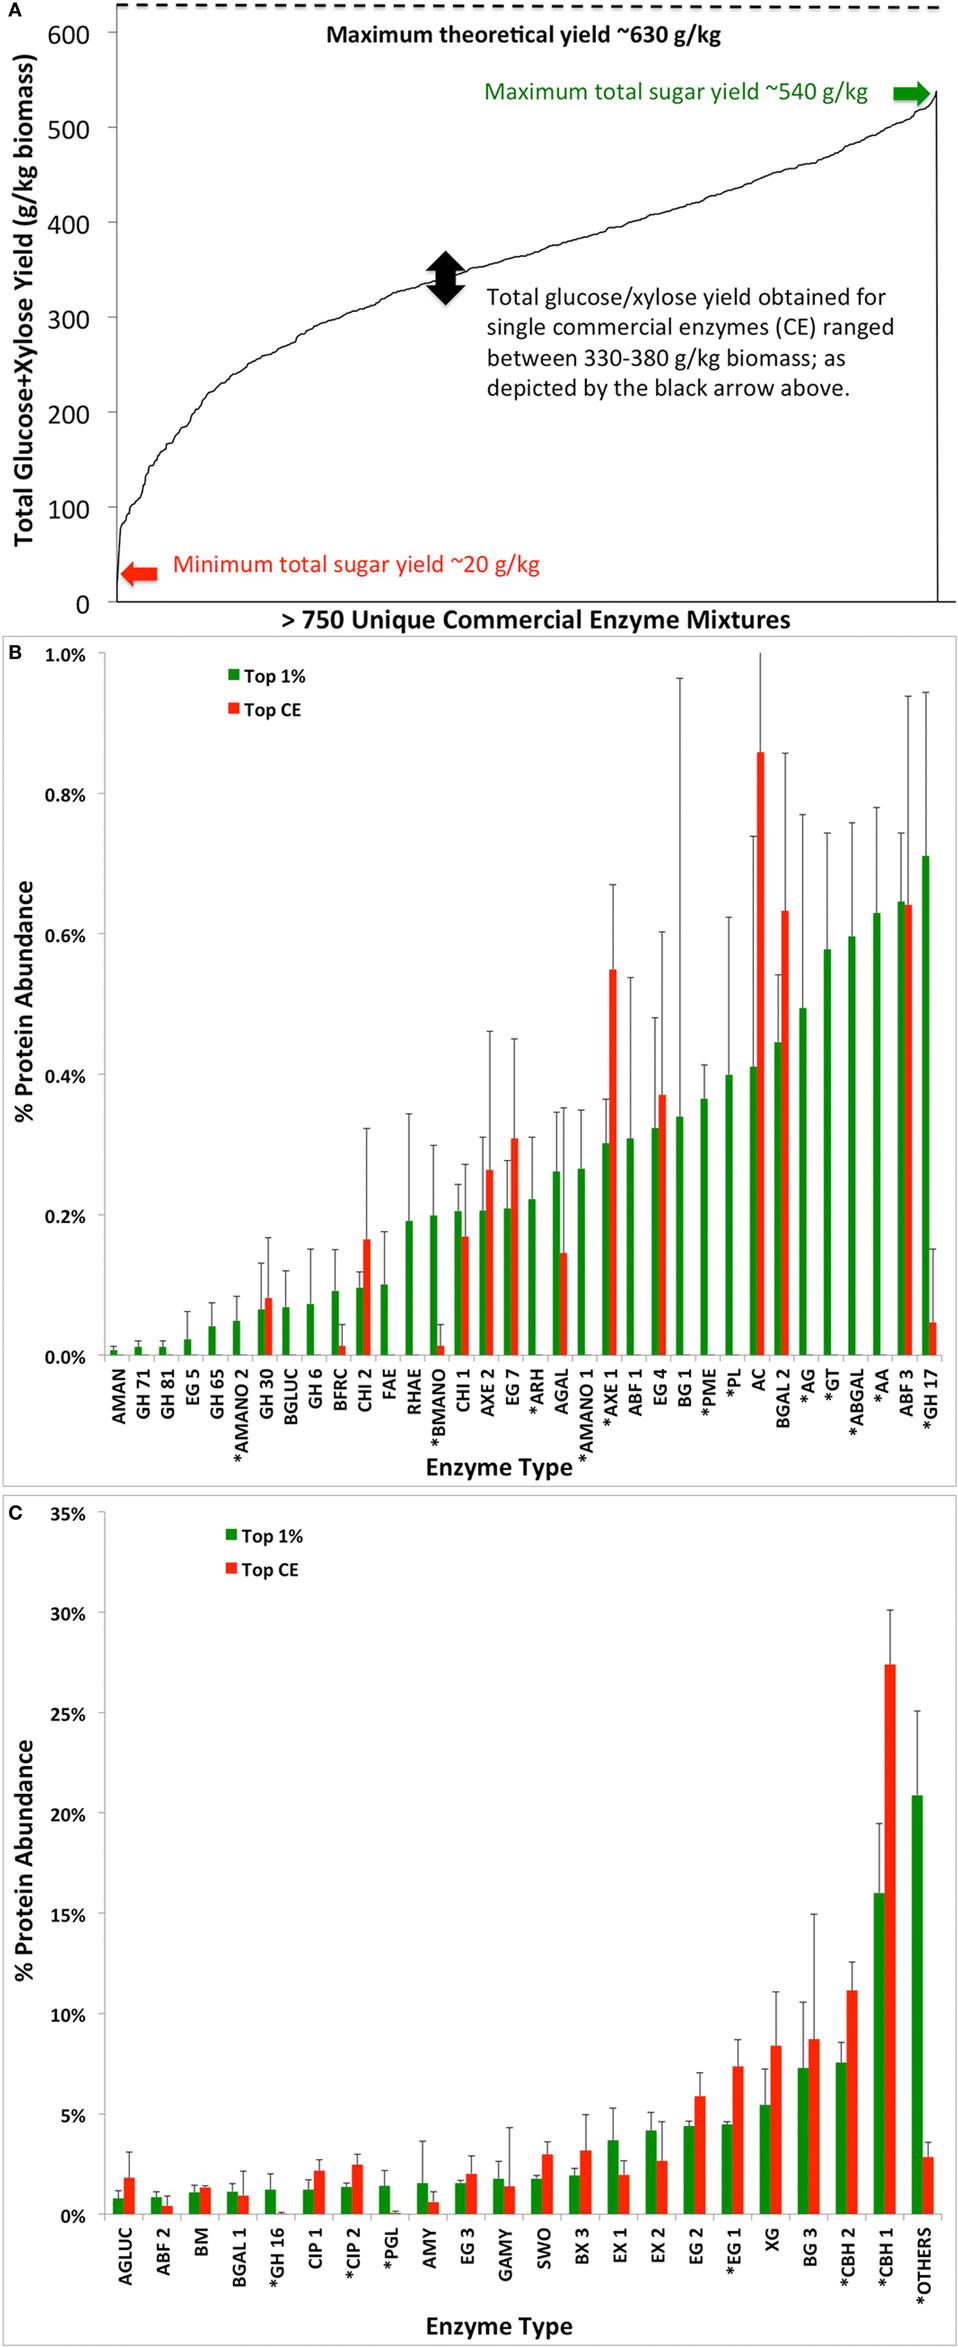
Figure 7. Total glucose and xylose yield (grams per kilogram of dry biomass) achieved as a function of various commercial enzyme (CE) combinations tested (A). Average protein compositions of top 1% hits (giving maximum total glucose and xylose) from screening in (A) were compared versus the average protein composition of the leading CE blends CE1, CE6, and RE8 previously identified in the study (B,C). Asterisks denote the significant difference in protein composition with p-value of 0.01 or lower between datasets.
The validity of the regression models obtained from stepwise special cubic regressions of all mixture experiments was confirmed by analyzing residual histograms, normal distribution curves of residuals, residuals versus fits, and residuals versus order plots (data not shown). In summary, the estimated regression coefficients suggested the relative importance of individual enzyme cocktails or their synergistic mixtures to enhancing glucan and/or xylan conversion to monomeric sugars. These results further validated selection of the RE8, CE3, CE4, and RE7 for detailed optimization carried out previously in this study.
CE3, CE4, and RE7 are abundant in endo/exo-xylanases, arabinofuranosidases (GH 43, 51, 54, and 62) and α-glucuronidases that are either missing or are present in very low abundance in RE8. However, to obtain a more quantitative estimate of the relative abundance of the best performing enzyme mixtures (from the set of >750 mixtures tested) versus the original single cellulolytic blends (namely, CE1, CE6, and RE8) the protein composition of each enzyme mixture cocktail tested was determined using the known composition of the original 14 enzymes (based on the 56 individual components listed Appendix SA-I in Supplementary Material). All cellulolytic, hemicellulolytic, other accessory and pectin degrading enzymes were included in this list. All non-hydrolytic proteins (e.g., proteases) were clubbed together in the “OTHERS” category. The total number of tested mixtures (755 unique combinations) of the 14 original enzymes (total protein loading in all cases = 16.5 mg enzyme/g glucan), resulted in a 755 × 56 large matrix input parameter dataset.
Bivariate correlations were carried out for each of the 56 input variables with respect to the three responses (% glucan/xylan conversion, total sugar yield) to determine Pearson correlation coefficients (Appendix SA-II-7 in Supplementary Material) and their test of significance (p < 0.05). One of the major concerns with bivariate correlations between response and input variables is the assumption of linear dependence. However, the correlation between hydrolytic performance and amount of enzyme loaded is most likely to be non-linear, further confounded by the synergistic action of enzymes. Nevertheless, the bivariate Pearson correlation coefficients bring several interesting facts to light. First, there seems to be a very significant “opportunity cost” associated with individual enzymes that maximize glucan versus xylan conversion. That is, individual enzymes that maximize only xylan conversion have a negative Pearson coefficient (upon increasing the amount added) as compared to enzymes that maximize both glucan and xylan conversion.
Therefore, it would be also useful to examine the Pearson coefficients for total sugar yields that would be maximized by enhancing both glucan and xylan conversions. Individual enzymes/proteins that give a linear relationship with respect to total sugar yield, based on a positive and significant (p < 0.01) Pearson coefficient, include acetyl xylan esterases (AXE 1 and AXE 2), glucuronoyl esterase (CIP 2), swollenin (SWO), β-glucosidase (BG 3), β-xylosidase (BX 3), endoglucanase (EG 1, EG 2, EG 3, and EG 7), β-mannanase (BM), β-galactosidase (BGAL 2), cellobiohydrolase (CBH 2), amylase (AMY), endo-chitinase (CHI 1), and polygalacturonases (PGL). However, due to significant multicollinearity between certain protein components in the original 14 enzymes (Appendix SA-II-8 in Supplementary Material), the truly significant and necessary enzymes are partly confounded in this analysis.
Nevertheless, it was informative to plot the average protein composition of the top-performing single commercial cellulase cocktails (CE1, CE6, and RE8) versus the top 1% performing enzyme mixtures identified from within the 755 mixtures (based on total sugar yields). Figure 7 shows that the enzyme families with a significant difference (based on two-tailed Student’s t-test, p < 0.01) in composition between the two data sets were acetyl xylan esterases (AXE 1), glucuronoyl esterase (CIP 2), endoglucanase (EG 1), cellobiohydrolases (CBH 1 and CBH 2), pectinases (ARH, PME, PL, AG, ABGAL, AA, PGL), mannosidases (AMANO 1–2 and BMANO), and GH family 16/17. These results highlight the relative importance of hemicellulases and possibly other accessory enzymes that are enriched in the top 1% of the mixtures compared to the original single CE blend that gave improved activity on AFEX-CS.
Limitations of Current Approach
Two of the primary limitations of optimizing crude enzyme blends using microplate-based assays are as follows: (1) substrate particle size issue: in order to pipette biomass slurries into the microplate, the biomass has to be milled into a fine powder (<100 μm) that is not necessarily representative of the substrate that would be used in a commercial biorefinery. We have found that finely milled biomass qualitatively requires a similar enzyme cocktail to maximize glucan-to-glucose and xylan-to-xylose conversions compared to unground material (Figure 8). Nevertheless, there were minor differences found in the relative performance of the various enzyme mixtures (Table 2) tested on finely milled versus unground biomass. These differences were more prominent on xylan versus glucan hydrolysis. (2) Multicollinearity issue: though the regression models used here do not have direct biological significance, the model interaction terms are indicative of the relative degree of synergy between 2 and more enzyme cocktails or purified enzyme components. For simple individual enzyme mixtures (composed of 3–10 components) such models can more clearly provide a quantitative degree of synergy factor between individual enzyme components as also shown by our group and others (Banerjee et al., 2010a; Gao et al., 2010a). One of the major issues encountered, when attempting to delineate the relative contribution of individual enzyme families on hydrolysis yields for more complex enzyme cocktails (>50 components) explored in this study, was the high multicollinearity between relative enzyme abundance. Multicollinearity is a statistical phenomenon in which two or more variables in a multidimensional model have similar effects. This will influence the extrapolation of the results obtained from the model (as also discussed in the previous section). Multicollinearity is indicated by high variance inflation factor (VIF) values (see Appendix SA-II-2, SA-II-6 in Supplementary Material). VIF values greater than 5 were observed for a number of the coefficients in the 10 enzyme and 8 enzyme experiments, indicating the presence of high degree of multi-collinearity. Multicollinearity in the model may have been due to the fact that several commercial and research enzymes target similar substrates, but with differing effectiveness. To improve the predictive abilities of the model, another set of experiments was designed by using a more diverse set of the five most effective enzymes determined from the previous two experiments. The enzymes were selected to minimize the overlaps in their substrate specificity. This issue can be addressed by studying high specificity, purified enzymes to allow development of more precise models, and potentially more active enzyme blends hitherto not being able to take advantage of multifunctional enzymes, which are relevant to reducing the amount and type of enzymes needed to deconstruct lignocellulosic biomass.
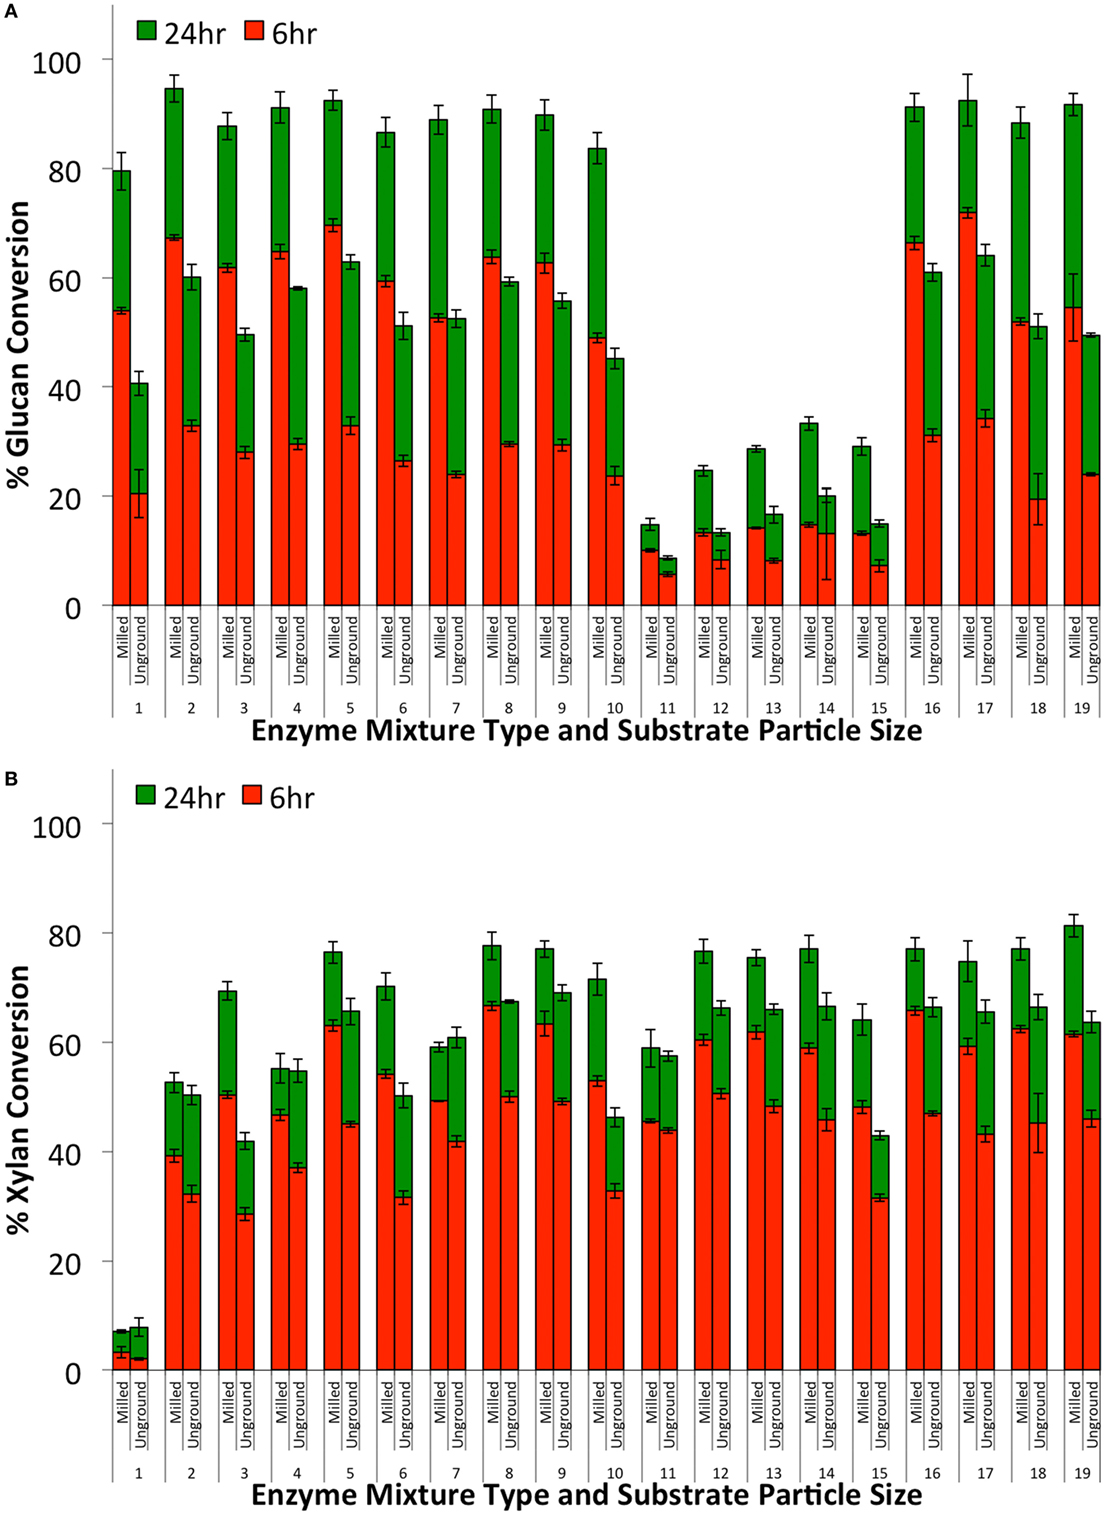
Figure 8. Glucan-to-glucose (A) and xylan-to-xylose (B) percent conversions for ammonia fiber expansion-treated corn stover after 6 (red) and 24 (green) hours of hydrolysis as a function of substrate particle size (milled or unground) and enzyme mixture type. All enzyme mixtures compositions are reported in Table 1. Total protein loading was fixed at 30 mg/g glucan loading.
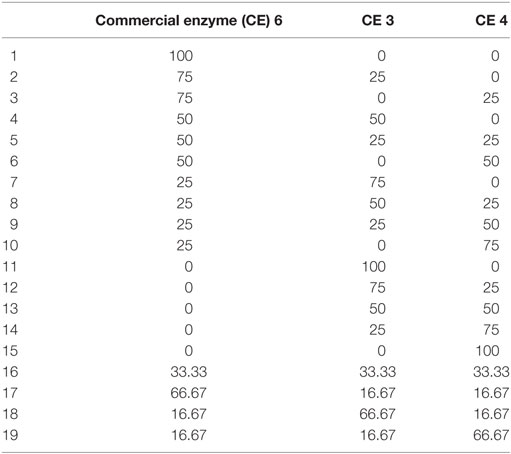
Table 2. Composition of enzyme mixtures (milligram basis) tested to study effect of particle size on yields.
Conclusion
A comprehensive “shotgun” high-throughput screening approach was carried out to substantially reduce enzyme usage and increase specific activity of CE blends on ammonia-pretreated CS (i.e., AFEX-CS). We found that most of the commercial cellulolytic blends currently available have poor activity on AFEX-CS because they lack critical hemicellulases and accessory enzyme activities. Combinatorial screening of various accessory enzymes with core cellulase blends resulted in maximizing both glucan-to-glucose (>90%) and xylan-to-xylose (>85%) conversion. In addition, mixing complementary enzyme blends reduced total protein loading requirements for AFCS saccharification by more than fourfold (from 30 to 7.5 mg/g of glucan). Enzymes that were likely responsible for giving higher sugar conversion could be identified using prior proteomics-based compositional analysis results. Further development of better commercial-grade enzyme blends for alkali treated biomass (or low severity acid-treated biomass) are needed to reduce the cost of biomass saccharification and biofuel production.
Author Contributions
SC and NU designed and conducted all experiments; PC and SC carried out statistical analysis; SC, DG, VB, and BD analyzed data; SC wrote the manuscript; all the authors reviewed and edited the manuscript.
Conflict of Interest Statement
The authors declare that the research was conducted in the absence of any commercial or financial relationships that could be construed as a potential conflict of interest.
Acknowledgments
Genencor-Danisco (now acquired by Du Pont), Novozymes, and Biocatalysts provided the enzymes blends used in this study. The high-throughput assay data generated using more than 750 unique enzyme combinations (see Appendix SA-II in Supplementary Material) are from the authors original doctoral thesis (Chundawat and Dale, 2009). We would like to also thank Mr. Aditya Rajagopalan (visiting summer research scholar from Choate Rosemary Hall in Connecticut) for providing assistance with conducting experimental assays and data analysis reported in SA-II that were partly also reported by him as a finalist at the 2009 Intel Science Talent Search competition.
Funding
This work was funded by the US DOE Great Lakes Bioenergy Research Center (DOE BER Office of Science DE-FC02-07ER64494). SC acknowledges partial support from the US National Science Foundation CBET awards (1604421) and Rutgers School of Engineering (Startup Funding). BD acknowledges partial support from Michigan State University AgBioResearch office and also the USDA National Institute of Food and Agriculture.
Supplementary Material
The Supplementary Material for this article can be found online at http://journal.frontiersin.org/article/10.3389/fenrg.2017.00009/full#supplementary-material.
References
Banerjee, G., Car, S., Scott-Craig, J., Borrusch, M., and Walton, J. (2010a). Rapid optimization of enzyme mixtures for deconstruction of diverse pretreatment/biomass feedstock combinations. Biotechnol. Biofuels 3, 22. doi: 10.1186/1754-6834-3-22
Banerjee, G., Car, S., Scott-Craig, J. S., Borrusch, M. S., Aslam, N., and Walton, J. D. (2010b). Synthetic enzyme mixtures for biomass deconstruction: production and optimization of a core set. Biotechnol. Bioeng. 106, 707–720. doi:10.1002/bit.22741
Berlin, A., Maximenko, V., Gilkes, N., and Saddler, J. (2007). Optimization of enzyme complexes for lignocellulose hydrolysis. Biotechnol. Bioeng. 97, 287–296. doi:10.1002/bit.21238
Bhat, M. K., and Hazlewood, G. P. (2001). “Enzymology and other characteristics of cellulases and xylanases,” in Enzymes in Farm Animal Nutrition, eds M. R. Bedford and G. G. Partridge (Oxon, UK: CABI Publishing), 11–60.
Boisset, C., Pétrequin, C., Chanzy, H., Henrissat, B., and Schülein, M. (2001). Optimized mixtures of recombinant Humicola insolens cellulases for the biodegradation of crystalline cellulose. Biotechnol. Bioeng. 72, 339–345. doi:10.1002/1097-0290(20010205)72:3<339::AID-BIT11>3.0.CO;2-#
Box, G. E. P., Hunter, W. G., and Hunter, J. S. (1978). Statistics for Experimenters. New York: Wiley.
Chu, S., and Majumdar, A. (2012). Opportunities and challenges for a sustainable energy future. Nature 488, 294–303. doi:10.1038/nature11475
Chundawat, S. P. S., Balan, V., and Dale, B. E. (2008). High-throughput microplate technique for enzymatic hydrolysis of lignocellulosic biomass. Biotechnol. Bioeng. 99, 1281–1294. doi:10.1002/bit.21805
Chundawat, S. P. S., Beckham, G. T., Himmel, M., and Dale, B. E. (2011a). Deconstruction of lignocellulosic biomass to fuels and chemicals. Annu. Rev. Chem. Biomol. Eng. 2, 121–145. doi:10.1146/annurev-chembioeng-061010-114205
Chundawat, S. P. S., Bellesia, G., Uppugundla, N., Sousa, L., Gao, D., Cheh, A., et al. (2011b). Restructuring the crystalline cellulose hydrogen bond network enhances its depolymerization rate. J. Am. Chem. Soc. 133, 11163–11174. doi:10.1021/ja2011115
Chundawat, S. P. S., Donohoe, B. S., Sousa, L., Elder, T., Agarwal, U. P., Lu, F., et al. (2011c). Multi-scale visualization and characterization of plant cell wall deconstruction during thermochemical pretreatment. Energy Environ. Sci. 4, 973–984. doi:10.1039/c0ee00574f
Chundawat, S. P. S., Lipton, M. S., Purvine, S. O., Uppugundla, N., Gao, D., Balan, V., et al. (2011d). Proteomics based compositional analysis of complex cellulase-hemicellulase mixtures. J. Proteome Res. 10, 4365–4372. doi:10.1021/pr101234z
Chundawat, S. P. S., and Dale, B. E. (2009). Ultrastructural and Physicochemical Modifications within Ammonia Treated Lignocellulosic Cell Walls and Their Influence on Enzymatic Digestibility. Chem. Eng. Mater. Sci. [Ph.D. Dissertation]. East Lansing, MI: Michigan State University.
Chundawat, S. P. S., Vismeh, R., Sharma, L., Humpula, J., Sousa, L., Chambliss, C. K., et al. (2010). Multifaceted characterization of cell wall decomposition products formed during ammonia fiber expansion (AFEX) and dilute-acid based pretreatments. Bioresour. Technol. 101, 8429–8438. doi:10.1016/j.biortech.2010.06.027
Davis, R., Tao, L., Tan, E. C. D., Biddy, M. J., Beckham, G. T., Scarlata, C., et al. (2015). Process design and economics for the conversion of lignocellulosic biomass to hydrocarbons: dilute-acid and enzymatic deconstruction of biomass to sugars and biological conversion of sugars to hydrocarbons. Natl. Renew. Energy Lab. 147, 1–128. doi:10.2172/1107470
Gao, D., Chundawat, S. P. S., Krishnan, C., Balan, V., and Dale, B. E. (2010a). Mixture optimization of six core glycosyl hydrolases for maximizing saccharification of ammonia fiber expansion (AFEX) pretreated corn stover. Bioresour. Technol. 101, 2770–2781. doi:10.1016/j.biortech.2009.10.056
Gao, D., Chundawat, S. P. S., Liu, T., Hermanson, S., Gowda, K., Brumm, P., et al. (2010b). Strategy for identification of novel fungal and bacterial glycosyl hydrolase hybrid mixtures that can efficiently saccharify pretreated lignocellulosic biomass. BioEnergy Res. 3, 67–81. doi:10.1007/s12155-009-9066-6
Gao, D., Chundawat, S. P. S., Uppugundla, N., Balan, V., and Dale, B. E. (2011a). Binding characteristics of Trichoderma reesei cellulases on untreated, ammonia fiber expansion and dilute-acid pretreated lignocellulosic biomass. Biotechnol. Bioeng. 108, 1788–1800. doi:10.1002/bit.23140
Gao, D., Uppugundla, N., Chundawat, S., Yu, X., Hermanson, S., Gowda, K., et al. (2011b). Hemicellulases and auxiliary enzymes for improved conversion of lignocellulosic biomass to monosaccharides. Biotechnol. Biofuels 4, 5. doi:10.1186/1754-6834-4-5
Gao, D., Haarmeyer, C., Balan, V., Whitehead, T. A., Dale, B. E., and Chundawat, S. P. (2014). Lignin triggers irreversible cellulase loss during pretreated lignocellulosic biomass saccharification. Biotechnol. Biofuels 7, 175. doi:10.1186/s13068-014-0175-x
Henrissat, B., Teeri, T. T., and Warren, R. A. J. (1991). A scheme for designating enzymes that hydrolyze the polysaccharides in the cell walls of plants. FEBS Lett. 425, 352–354. doi:10.1016/S0014-5793(98)00265-8
James, J. A., and Lee, B. H. (1997). Glucoamylases: microbial sources, industrial applications and molecular biology? A review. J. Food Biochem. 21, 1–52. doi:10.1111/j.1745-4514.1997.tb00223.x
Kabel, M. A., van der Maarel, M. J. E. C., Klip, G., Voragen, A. G. J., and Schols, H. A. (2006). Standard assays do not predict the efficiency of commercial cellulase preparations towards plant materials. Biotechnol. Bioeng. 93, 56–63. doi:10.1002/bit.20685
Kim, E., Irwin, D. C., Walker, L. P., and Wilson, D. B. (1998). Factorial optimization of a six-cellulase mixture. Biotechnol. Bioeng. 58, 494–501. doi:10.1002/(SICI)1097-0290(19980605)58:5<494::AID-BIT5>3.0.CO;2-8
Lau, M. W., Bals, B., Chundawat, S. P. S., Jin, M., Gunawan, C., Balan, V., et al. (2012). An integrated paradigm for cellulosic biorefineries: utilization of lignocellulosic biomass as self-sufficient feedstocks for fuel, food precursors and saccharolytic enzyme production. Energy Environ. Sci. 5, 7100–7110. doi:10.1039/C2EE03596K
Lynd, L. R., Weimer, P. J., van Zyl, W. H., and Pretorius, I. S. (2002). Microbial cellulose utilization: fundamentals and biotechnology. Microbiol. Mol. Biol. Rev. 66, 506–577. doi:10.1128/MMBR.66.4.739.2002
Mosier, N. S., Wyman, C. E., Dale, B. E., Elander, R. T., Lee, Y. Y., Holtzapple, M. T., et al. (2005). Features of promising technologies for pretreatment of lignocellulosic biomass. Bioresour. Technol. 96, 673–686. doi:10.1016/j.biortech.2004.06.025
Rahikainen, J., Mikander, S., Marjamaa, K., Tamminen, T., Lappas, A., Viikari, L., et al. (2011). Inhibition of enzymatic hydrolysis by residual lignins from softwood – study of enzyme binding and inactivation on lignin-rich surface. Biotechol. Bioeng. 108, 2823–2834. doi:10.1002/bit.23242
Saloheimo, A., Ilmen, M., Aro, N., Margolles-Clark, E., and Penttila, M. (1998). “Regulatory mechanisms involved in the expression of extracellular hydrolytic enzymes from Trichoderma,” in Carbohydrases from Trichoderma reesei and Other Microorganisms – Structure, Biochemistry, Genetics and Applications: Proceedings of Tricel 1997 Meeting, eds M. Claeyssens, W. Nerinckx, and K. Piens (Cambridge, UK: The Royal Society of Chemistry), 267–273.
Scheffé, H. (1963). The simplex-centroid design for experiments with mixtures. J. R. Stat. Soc. Ser. B 25, 235–263.
Sluiter, J. B., Ruiz, R. O., Scarlata, C. J., Sluiter, A. D., and Templeton, D. W. (2010). Compositional analysis of lignocellulosic feedstocks. 1. Review and description of methods. J. Agric. Food Chem. 58, 9043–9053. doi:10.1021/jf1008023
Thomas, S. R., Laymon, R. A., Chou, Y. C., Tucker, M. P., Vinzant, T. B., William, S. A., et al. (1995). Initial Approaches to Artificial Cellulase Systems for Conversion of Biomass to Ethanol, eds. J. N. Saddler and M. H. Penner. Washington, DC: American Chemical Society.
Vismeh, R., Humpula, J. F., Chundawat, S. P. S., Balan, V., Dale, B. E., and Jones, A. D. (2013). Profiling of soluble neutral oligosaccharides from treated biomass using solid phase extraction and LC-TOF MS. Carbohydr. Polym. 94, 791–799. doi:10.1016/j.carbpol.2013.02.005
Keywords: cellulase, hemicellulase, enzymatic hydrolysis, ammonia fiber expansion pretreatment, proteomics, cellulosic ethanol, enzyme mixture optimization, high-throughput assays
Citation: Chundawat SPS, Uppugundla N, Gao D, Curran PG, Balan V and Dale BE (2017) Shotgun Approach to Increasing Enzymatic Saccharification Yields of Ammonia Fiber Expansion Pretreated Cellulosic Biomass. Front. Energy Res. 5:9. doi: 10.3389/fenrg.2017.00009
Received: 09 February 2017; Accepted: 19 April 2017;
Published: 10 May 2017
Edited by:
Arindam Kuila, Banasthali University, IndiaReviewed by:
Bing-Zhi Li, Tianjin University, ChinaYunqiao Pu, Georgia Institute of Technology, USA
Sheikh Adil Edrisi, Banaras Hindu University, India
Copyright: © 2017 Chundawat, Uppugundla, Gao, Curran, Balan and Dale. This is an open-access article distributed under the terms of the Creative Commons Attribution License (CC BY). The use, distribution or reproduction in other forums is permitted, provided the original author(s) or licensor are credited and that the original publication in this journal is cited, in accordance with accepted academic practice. No use, distribution or reproduction is permitted which does not comply with these terms.
*Correspondence: Shishir P. S. Chundawat, c2hpc2hpci5jaHVuZGF3YXRAcnV0Z2Vycy5lZHU=
†Present address: Paul G. Curran, Department of Psychology, Grand Valley State University, Allendale, MI, USA