 Rebecca G. Ong
 Somnath Shinde
 Leonardo da Costa Sousa4
- 1Department of Chemical Engineering, Michigan Technological University, Houghton, MI, United States
- 2DOE Great Lakes Bioenergy Research Center, Michigan Technological University, Houghton, MI, United States
- 3Department of Chemical and Biomolecular Engineering, University of Tennessee, Knoxville, TN, United States
- 4Department of Chemical Engineering, Michigan State University, East Lansing, MI, United States
- 5Department of Agronomy, University of Wisconsin-Madison, Madison, WI, United States
- 6DOE Great Lakes Bioenergy Research Center, University of Wisconsin-Madison, Madison, WI, United States
Proper timing of switchgrass harvest for bioenergy is important to maximize yield and optimize end use conversion. Proposed windows range from peak biomass to the following spring after overwintering in the field. There are various pros and cons associated with harvest timing: earlier harvests maximize yield but can remove nutrients from the field that may require replacement, while later harvests have reduced biomass yields due to weathering but maximize nutrient resorption in belowground tissues. Switchgrass composition changes during the harvest period, with losses of potential fermentation nutrients (amino acids and minerals), and sources of pretreatment-derived inhibitors (soluble sugars), which could affect downstream conversion by microorganisms. For this work we investigated whether switchgrass harvest could be timed to maximize beneficial impacts on fermentation. Switchgrass samples were harvested from five replicate field plots in Wisconsin, roughly every 2–3 weeks from peak biomass (Aug. 20) until after the killing frost (Nov. 7). Cell wall composition showed little consistent variation with harvest date while bulk biomass analysis showed a relative increase in cell wall content (lignin and structural sugars) and loss of extractives (minerals, protein, soluble sugars, and others). Following high or low severity AFEX pretreatment and high solids enzymatic hydrolysis (6% glucan loading), two field replicates were fermented using Saccharomyces cerevisiae 424A, a strain engineered to utilize xylose in addition to glucose. For both pretreatment severities, S. cerevisiae 424A grown in hydrolysates from the three earlier harvests utilized only a small fraction of available xylose, while almost complete utilization occurred within 96 hr for the last three harvest dates. Detailed analysis of the hydrolysate low molecular weight aromatics did not indicate any compounds potentially responsible for the inhibition, with most of the observed variation in their concentration due to pretreatment severity. Amino acid composition also did not appear to be limiting. Current indications point to a plant-generated compound that degrades during senescence, which future work will attempt to identify. Ultimately this work demonstrates that, although an attractive option to maximize yield, harvesting switchgrass before it begins senescing could have a negative effect on downstream conversion processes.
Introduction
Biofuels made from lignocellulosic biomass are a potential environmentally friendly, carbon neutral replacement for petroleum fuels (Robertson et al., 2017). As lignocellulosic biofuels are derived from the compounds in plant cell walls, they can be produced from a wide variety of feedstocks. It is estimated that the U.S. alone has the potential to generate as much as 1.5 billion tons of lignocellulosic biomass, a number that includes forestry residues; herbaceous crop residues, such as wheat straw and corn stover; and dedicated perennial energy crops, such as energy grasses and coppiced woody materials (Langholtz et al., 2016). All of these potential lignocellulosic crops have defined harvest timings, and for crop residues the timing of residue collection is linked to grain harvest, which makes it fairly inflexible. In contrast, harvest of energy grasses, such as switchgrass, can happen any time throughout the growing season or after. For a single harvest during the growing season, switchgrass harvest timings have been proposed anywhere from the point of peak aboveground biomass yield up to the following spring after overwintering in the field (Adler et al., 2006; Lindsey et al., 2013). This flexibility in harvest could be beneficial for farmers, allowing them to time their harvest according to the weather and accommodate other, more time-sensitive field work.
During the biological processing of lignocellulosic biofuels, choice of harvest timing for perennial feedstocks generally represents a tradeoff between biomass yield and quality (Gorlitsky et al., 2015). Following peak biomass, the plants tend to lose biomass due to three processes: resorption of nutrients to belowground tissues (Yang et al., 2009; Lindsey et al., 2013; Ashworth et al., 2017), weathering of dry and brittle aboveground biomass components (Adler et al., 2006; Anderson et al., 2013), and lodging, resulting in materials that are too low to the ground to harvest effectively (Adler et al., 2006; Anderson et al., 2013). In terms of biomass quality, earlier harvests have typically been reported as more digestible following biological conversion (Bals et al., 2010; Dien et al., 2013), however later harvests tend to have a greater proportion of structural carbohydrates (Adler et al., 2006; Anderson et al., 2013; Lindsey et al., 2013), the substrate for microbial-mediated biofuel production.
Resorption of nutrients is another important parameter that influences the choice of optimal harvest time. As switchgrass senesces, it remobilizes and resorbs translocatable nutrients into belowground tissues for use the following year (Adler et al., 2006; Yang et al., 2009; Lindsey et al., 2013). Earlier harvest timings may remove nutrients from the field before they can be fully resorbed, potentially compromising overwintering success and requiring additional fertilizer the following year, adding cost and negative environmental effects (Cahill et al., 2014). Ideally one could find an economically optimum harvest date that balances the cost of fertilizer replacement with decreased revenue from lower biomass yields later in the harvest window. Two studies have investigated this possibility with mixed results. One found that the date of profit-maximizing harvest is generally after peak biomass, and this is pushed later in the season for lower switchgrass prices (Cahill et al., 2014), however another study found no significant influence of harvest date on economic returns (Gamble et al., 2015).
While removal of nutrients with the harvested biomass is generally viewed negatively from both a crop production and a processing standpoint (Gorlitsky et al., 2015; Serapiglia et al., 2016a), this is not necessarily true for biological conversion pathways. The biological route of lignocellulosic fuel production uses a thermochemical pretreatment to open up the cell wall structure, followed by enzymatic hydrolysis to release cell wall sugars that are converted to fuel by fermentative microorganisms. Certain thermochemical pretreatments, such as ammonia fiber expansion (AFEX) are able to retain minerals and protein through the process (Lau and Dale, 2009; Lau et al., 2012; Ong et al., 2016). This means that the nutrients harvested with the biomass are not necessarily a hindrance to conversion, but can be utilized by the fermentation microorganism, eliminating the need for nutrient supplementation (Lau and Dale, 2009). However, this benefit of nutrients from earlier harvests may be offset by a higher soluble sugar content in the biomass. Recent work has found that pretreatment reaction products of soluble sugars, which are generally at higher levels earlier in the growing season (Adler et al., 2006; Lindsey et al., 2013), contribute to fungal inhibition during fermentation (Ong et al., 2016). It is possible that instead of having a positive impact on fermentation through increased nutrients, harvesting early could negatively impact fermentation through formation of inhibitors. In another study, earlier harvest date (July) of switchgrass had significantly lower xylose utilization by Saccharomyces cerevisiae compared to the later harvest (October) (Bals et al., 2010). The reason for this effect was not determined but potentially attributed to higher biomass extractives content in the early harvest switchgrass. Another study found that a different strain of S. cerevisiae had difficulty fermenting xylose, however this was observed for all switchgrass maturities (pre-boot, anthesis, and post-frost) (Dien et al., 2013).
For this study we wanted to determine whether switchgrass harvest date could be timed to have the most beneficial impacts on fermentation while avoiding production of harmful degradation compounds. As it was possible that later harvest timings could have insufficient nutrients for the fermentation microbes, we evaluated the amino acid composition of the hydrolysate and stillage following fermentation. In order to obtain a more detailed map of harvest date impacts on switchgrass fermentation compared to what has previously been reported, switchgrass grown in Arlington, WI was harvested every 2–3 weeks from peak biomass (Aug. 20) until post-killing frost (Nov. 7), for a total of six harvest dates. Five field replicates were harvested and evaluated for their cell wall composition. Two of the field reps (R2 and R4) were further evaluated for their bulk biomass composition. These were then processed using AFEX pretreatment at two severities to evaluate whether it was possible to alleviate potential fermentation inhibition by adjusting pretreatment conditions. Pretreated samples were subjected to high solids enzymatic hydrolysis (6% glucan loading) followed by ethanolic fermentation using an engineered xylose-utilizing yeast strain, S. cerevisiae 424A.
Materials and Methods
Switchgrass Growth, Harvest, and Processing
Switchgrass was cultivated at the Arlington Research Station (ARL, 43°17′45″ N, 89°22′48″W, 315 masl) in Arlington, Wisconsin. Switchgrass was sourced from plots 112, 206, 303, 412, and 510 in field 115. The soil type at ARL is Plano silt-loam, as previously described (Oates et al., 2016; Ong et al., 2016), and the mean temperature and precipitation were 5.6°C and 782 mm, respectively for the entire year of 2014, and were 15.3°C and 470 mm, respectively for the growing season from 22 May to 13 November 2014. Switchgrass was planted in June 2008, and samples were manually harvested in 2014 from five replicate field plots (R1 – R5), roughly every 2 weeks from peak biomass (20 August 2014) until after the killing frost (7 November 2014). Harvest dates were Aug. 20, Sept. 10 and 24, Oct. 6 and 22, and Nov. 7. Following harvest, all samples were dried in a 60°C oven (~48 h) and milled using a 18-7-301 Schutte-Buffalo hammer mill (Buffalo, NY) equipped with a 5 mm screen. Samples were stored at room temperature in sealed bags until used.
Cell Wall and Bulk Chemical Composition of Untreated Switchgrass
Analyses were performed on extractives free alcohol insoluble residue (AIR), which provides a representation of the biomass cell wall composition. The AIR was isolated and polysaccharides (crystalline cellulose, xylose, arabinose, glucose, galactose, and mannose) were quantified based on an existing protocol (Foster et al., 2010b). Lignin monolignol (syringyl, guaiacyl, and p-hydroxyphenyl) concentrations were also evaluated using an existing protocol (Foster et al., 2010a). Because of the intensive time requirements for later experiments, field replicates R2 and R4 were chosen randomly for all further experiments. Composition analysis of the bulk biomass was performed according to the NREL laboratory analytical procedures for biomass composition analysis (Hames et al., 2008; Sluiter et al., 2008a,b,c, 2012), with some modifications, as described previously (Ong et al., 2016).
Ammonia Fiber Expansion (AFEX) Pretreatment
Ammonia fiber expansion was used to pretreat switchgrass samples from two randomly chosen field replicates (R2 and R4). Pretreatment was conducted at two different severities: low (1.0 g NH3 g−1 dry biomass, 0.5 g H2O g−1 dry biomass, 80°C) and high (1.5 g NH3 g−1 dry biomass, 2.0 g H2O g−1 dry biomass, 130°C). The biomass was hand-mixed with the appropriate mass of water and then loaded into a 3.8 L stainless steel Parr reactor (Parr Instrument Co., Moline IL, USA) that was kept inside a walk-in fume hood. The reactor was sealed and liquid ammonia was added using a previously calibrated LEWA EK1 metering pump (Leonberg, Germany). The reactor temperature was quickly raised to the set point and then held at the set reaction temperature for 30 min residence time. At the end of the reaction, the ammonia was released from the reactor and filtered compressed air was passed over the biomass to facilitate removal of residual ammonia. The biomass was transferred to a custom vented acrylic drying box where it was dried using filtered compressed air until the moisture content was < 12% (total weight basis). Following drying the biomass was stored in sealed bags until use.
Enzymes
Cellic® CTec2 (138 mg protein/mL, batch number VCNI 0001), a complex blend of cellulase, β-glucosidase and hemicellulase, and Cellic® HTec2 (157 mg protein/mL, batch number VHN00001) were generously provided by Novozymes (Franklinton, NC, USA). The protein concentrations of the enzymes were determined by estimating the protein using the Kjeldahl nitrogen analysis method (AOAC Method 2001.11, Dairy One Cooperative Inc., Ithaca, NY, USA). The non-protein nitrogen was subtracted from the total nitrogen content and then the total was multiplied by a conversion factor of 6.25.
High-Solid-Loading Enzymatic Hydrolysis
High solids-loading enzymatic hydrolysis [~20% (w/w); 6% glucan loading] of AFEX pretreated switchgrass was performed to evaluate the effect of harvest timing on sugar release. Enzymatic hydrolysis was performed in 250 mL Erlenmeyer flasks with 100 mL reaction volume and the pH of hydrolysates was adjusted to 4.8 using 12 M HCl and/or 10 M KOH. Enzymes were added at a ratio of 70:30 CTec2:HTec2 on a protein mass basis with a total enzyme loading of 22 mg protein g−1 glucan. To prevent contamination during EH and fermentation, Geneticin antibiotic at 100 mg/L was added prior to enzymatic hydrolysis. The flasks were incubated at 250 rpm and 50°C for 96 h in an orbital shaking incubator (Innova® 44, New Brunswick Scientific, USA). Pretreated switchgrass was added in fed-batch mode at an interval of 2 h to improve mixing. After 96 h, the hydrolysate was separated from the residual solids by centrifugation at 4,000 rpm for 30 min (Eppendorf centrifuge 5810R, NY, USA). Liquid hydrolysate pH was adjusted to 5.50 ± 0.05 using either HCl or KOH as specified above, and then vacuum filtered through a 0.22 μm sterile filtration cup (Millipore Stericup, Massachusetts, USA). The filtered hydrolysate was stored at 4°C in a sterile bottle prior to fermentation. Samples for HPLC analysis were taken and stored at −20°C prior to analysis.
Oligosaccharide Analysis
Oligomeric sugar analysis was conducted on the hydrolysate liquid streams using an autoclave-based microplate acid hydrolysis method at a 1-mL scale. Hydrolysate samples (10x dilution) were mixed with 35 μL of 72% sulfuric acid in 5 mL open top centrifuge tubes capped with TPE mat, placed in a 96 well open-bottom microplate, screw-fitted into a metal plate and autoclaved at 121°C for 1 h. Autoclaved samples were cooled in a refrigerator for 30 min, filtered into a 96 well microplate, and analyzed by HPLC. The concentration of oligomeric sugars was determined by subtracting the monomeric sugar concentration of the non-hydrolyzed samples from the total sugar concentration of the acid hydrolyzed samples. Sugar degradation was accounted for by running the appropriate sugar recovery standards along with the samples during acid hydrolysis.
Microorganism, Seed Culture Preparation, and Hydrolysate Fermentation
S. cerevisiae 424A(LNH-ST), which is a genetically modified yeast strain that ferments xylose (Ho et al., 1999), was provided by Prof. Nancy W. Y. Ho, Purdue University and used for fermentation of hydrolysates. A yeast extract-tryptone medium with 100 g/L glucose, 25 g/L xylose, 10 g/L yeast extract, and 20 g/L tryptone was used as the seed culture medium. Seed culture was prepared in a 250 mL Erlenmeyer flask with 100 mL medium inoculated from a frozen glycerol stock. After inoculation, the seed culture had an initial optical density at 600 nm (OD600) of 0.1. The flask was capped using a rubber stopper with a needle pierced through and was incubated at 30°C and 150 rpm for 18 h. The seed culture OD600 reached ~12 at 18 h and was centrifuged at 4,000 rpm for 5 min. The resulting yeast cell pellets were used for inoculation of hydrolysate fermentation. The initial OD600 for fermentation was 2.0. Hydrolysate fermentation was performed in a 125 mL Erlenmeyer flask with working volume of 30 mL at pH 5.5, 30°C and 150 rpm for 96 h. A 0.5 mL sample was taken at different time points during fermentation, filtered, and stored at −20°C prior to analysis.
HPLC Analysis
Hydrolysate and fermentation samples were diluted 10x before being analyzed by HPLC. Glucose, xylose, and arabinose concentrations were analyzed using a Shimadzu HPLC system equipped with a Bio-Rad Aminex HPX-87H column equipped with automatic sampler, column heater, isocratic pump and refractive index detector (RID). The column was maintained at 50°C and eluted with 5 mM H2SO4 in water at 0.6 mL/ min flowrate. Monomeric sugars were identified and quantified by comparison to authentic standards calibration curve. Fermentation samples were analyzed for ethanol and residual sugars with the above mentioned HPLC system equipped with an Aminex HPX-87H column maintained at 50°C.
Quantification of Imidazoles and Pyrazines in AFEX-Treated Switchgrass
AFEX-pretreated switchgrass was milled through a 2.0-mm screen using a Foss Cyclotec™ mill (Eden Prairie, MN, USA). The milled biomass was extracted with acetone using an Accelerated Solvent Extractor (Dionex™ ASE 200, ThermoFisher Scientific, USA) under the following conditions: 5 min heat, 5 min static, 150% flush volume, 120 s purge, two cycles, 1,500 psi, and 70°C. Standards for the analyzed compounds were prepared in pure acetone in concentrations ranging from 0.00128 to 20 mg/L. Internal standards of 4-methylimidazole-d6 (imidazole authentic standard) and 2-methylpyrazine-d6 (pyrazine authentic standard) were obtained from C/D/N Isotopes (Pointe-Claire, Quebec, Canada) and added to each sample, standard, and blank at a final concentration of 6 mg/L. Samples were directly analyzed via GC–MS, without derivatization, based on the protocol from Chundawat et al. (2010), with the following modifications to the GC temperature program: 40°C (2 min), from 5°C/min to 150°C (1 min hold), 8°C/min to 200°C (2 min hold), 20°C/min to 260°C (3 min hold). Response factors were calculated based on the peak area of the selected ion chromatogram (molecular ion; M+) of each compound relative to the area of the internal standard peak.
Hydrolysate and Fermentation Broth Amino Acid Composition
Prior to amino acid quantification, 50 μL aliquots of samples were spiked with stable isotope labeled internal standards for the 20 common proteinogenic amino acids (Sigma-Aldrich Cell Free Amino Acid Mixture—13C,15N; P/N 767964-1EA) (with the exception of cysteine and methionine, which were not quantified) and processed by solid-phase extraction (Phenomenex Strata-X-C cartridges; P/N 8B-S029-HCH) to remove matrix interferents. SPE-processed samples underwent vacuum centrifugation before resuspension in 1 mL of Mobile Phase A. Samples were then analyzed via LC–MS/MS, based on the protocol from Gu et al. (2007), with the following modifications: mobile phase A was 10 mM instead of 1 mM (to reduce column equilibration time) and an LC gradient of 0.00–1.75 min (98% A); 1.76–8.00 min (linear ramp to 45% A); 8.01–9.00 min (10% A); and 9.01–13.00 min (98% A). Response factors were calculated based on the peak area of the selected multiple reaction monitoring (MRM) chromatograms for each compound relative to the area of the MRM peak for each amino acid's stable isotope labeled internal standard. The data for glutamine was inconsistent for the hydrolysate samples, and so was not included in the reported data set.
Statistical Analyses
Statistics were conducted in R-Studio®, version 1.0.143 (Boston, MA). Confidence intervals and linear regressions (lm function) of xylose consumption vs. process ethanol yield (based on experimental and field replicates), cell wall composition data (based on technical replicates), oligomeric sugar concentrations (based on field and experimental replicates) and hydrolysate phenolic concentration (based on experimental and field replicates) were calculated and graphed using the ggplot2 package (v.2.2.1) (Wickham, 2009). Principal component analysis plots were constructed using the pca function in R-Studio and the ggbiplot package. Amino acid heat maps were constructed using the heatmap.2 function from the gplots package (v.3.0.1) (Warnes et al., 2009) and the colors were scaled using a logarithmic function.
Results
Xylose Utilization Is Inhibited for Early Harvest Dates
Evaluation of fermentation profiles reveal that although all of the glucose was consumed by 24 h for all samples, xylose consumption was significantly impaired for switchgrass samples harvested prior to October (Figure 1 and Figure S1). This was not dependent on pretreatment condition, as both low (Figure 1) and high severity (Figure S1) AFEX conditions showed the same trend. Additionally, samples that were harvested in October or November generally had greater final ethanol concentrations compared to samples harvested prior to October. The process ethanol yield, or the amount of ethanol produced compared to that expected from complete conversion of sugars initially present in the hydrolysate, was linearly correlated with xylose consumption with little difference between pretreatment conditions (Figure 2) or field replicates (Figure S2). The experimental data separates cleanly into two groups: the materials with low xylose consumption and process ethanol yields, which were harvested from August to September, and the materials with high xylose consumption and process ethanol yields, which were harvested from October to November. More detailed evaluation of these results revealed a very large increase in specific xylose consumption between the early and late harvest periods for both AFEX severities (Table 1). Comparison of the metabolic ethanol yield (the ability of a microorganism to efficiently convert consumed sugars to ethanol) to the process ethanol yield showed that the metabolic ethanol yield was fairly similar between early and late harvest periods, in contrast to the process ethanol yield, which was much higher for the later harvest dates.
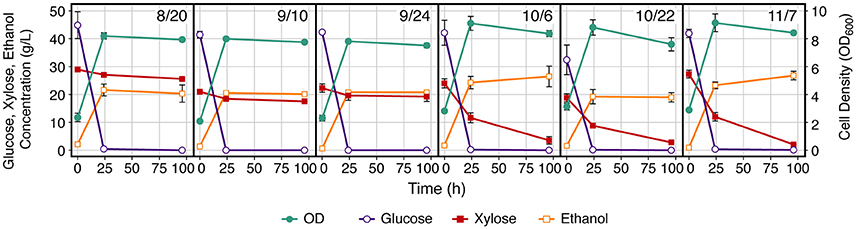
Figure 1. Xylose consumption is impaired during Saccharomyces cerevisiae 424A fermentation of switchgrass harvested prior to October for both low severity AFEX pretreatment. Low severity AFEX was at 1.0 g NH3 g−1 dry biomass, 0.5 g H2O g−1 dry biomass, 80°C, and 30 min residence time. Results are averaged across experimental replicates (n = 2) and field replicates (R2 and R4, n = 2). Error bars represent ± standard deviation of the mean.
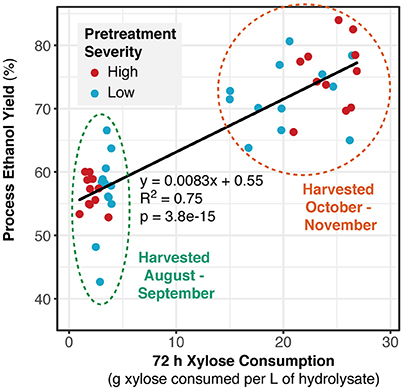
Figure 2. Xylose consumption is correlated to process ethanol yields, which tend to be lower for harvest dates before October and show a similar trend regardless of pretreatment condition. Data points include both field (R2 and R4) and experimental replicates.

Table 1. Summary of Saccharomyces cerevisiae 424A fermentation data.
Cell Well Composition Does Not Vary Consistently With Harvest Date
The cell wall composition, evaluated on the basis of AIR, showed very few consistent trends with respect to harvest date across feedstocks. Of the compounds evaluated, crystalline cellulose and most of the hemicellulosic/pectic sugars (arabinose, glucose, and galactose) did not show any consistent trend across the field replicates nor any statistically significant variation with harvest date (Figure S3). When averaged across all field replicates, both the xylose content and the lignin monomer compositions of the cell wall showed minor statistically significant increasing trends with harvest date, though not all field replicates showed this trend (Figure 3). When looking at the averaged values, the lignin monomer composition may follow more of a parabolic trend, but this is less clear based on the individual field replicates. Of the cell wall components evaluated, only the mannose content showed any strong linear correlation with harvest date across all materials, and this was observed for all five field replicates (Figure 3).
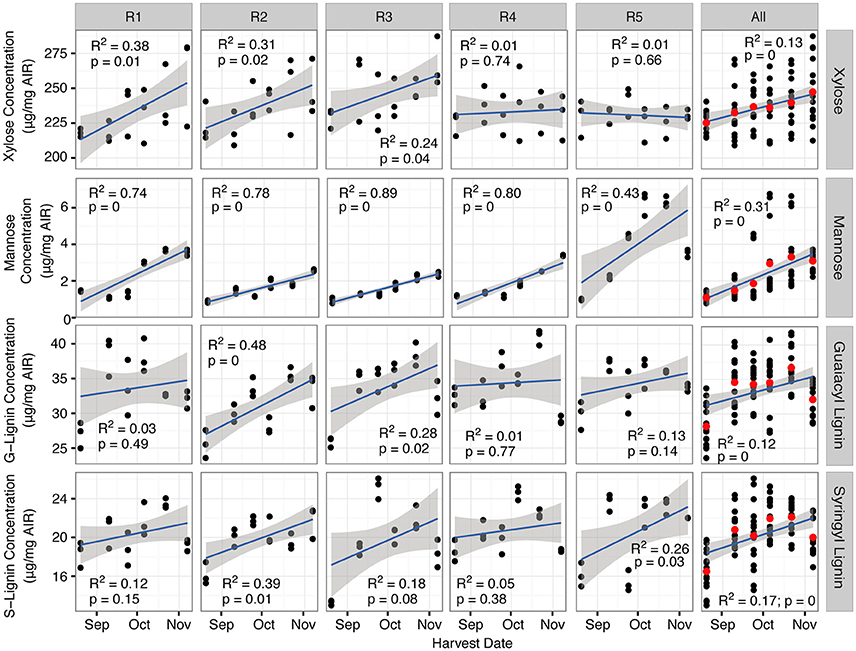
Figure 3. Mannose and xylose vary consistently with harvest date across field replicates, while lignin monomer composition varies weakly, but inconsistently with harvest date. Values are based on the amount in the alcohol insoluble residue (AIR). Data points represent technical replicates (n = 3). The “All” column aggregates the data for all five field replicates, with the red dot representing the average across all field and technical replicates. G, guaiacyl; S, syringyl.
Bulk Biomass Composition Shows Consistent Trends With Respect to Harvest Date
Ash, protein, and extractives (water and ethanol soluble with the exception of water soluble sugars) all decreased with harvest date, and tended to plateau quickly following peak biomass, reaching a fairly consistent concentration by early September (Figure 4). Conversely, the cell wall components correspondingly made up a greater proportion of the plant biomass over time. Both the lignin and the polymeric sugar concentrations continued to increase between peak biomass and post-senescence. The water soluble mono- and disaccharides (sucrose, glucose, and fructose) showed a distinct trend compared to the other components analyzed. These sugars continued to increase following peak biomass, reached a peak in late September, after which they decreased rapidly until post-killing frost. The full biomass composition data, broken down by component and field replicate, is included in the supplementary information (Tables S1, S2).
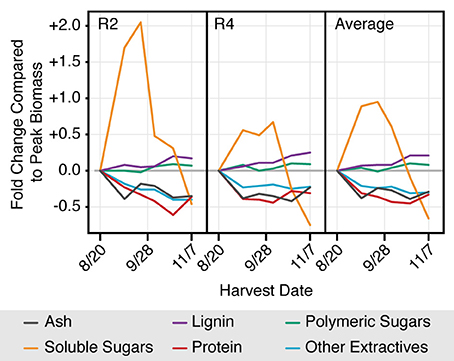
Figure 4. From peak biomass to senescence cell wall content increases as non-structural components decrease, and soluble sugars show a unique and distinctive peak in late September. Values represent the fold change in concentration of each component in the bulk biomass (% of total dry biomass) with respect to peak biomass on August 20. Water soluble sugars includes sucrose, fructose and glucose. Polymeric sugars include both water soluble oligomers and structural carbohydrates. Error bars are not included to reduce confusion in interpreting overall trends. The full data set is presented in Tables S1, S2.
Enzymatic Hydrolysis Yields and Composition Were Predominantly Related to Pretreatment Severity Rather Than Harvest Date
Unlike fermentation, which showed a distinct pattern related to harvest date, the enzymatic hydrolysis conversions did not show this same trend. Although there were differences in hydrolysis conversions between harvest dates, there was no real trend observed in the effect on either monomeric and oligomeric glucose or xylose release from the pretreated biomass (Figures 5A,B). There was some minor difference in sugar release between AFEX pretreatment severities, but this was also not consistent across samples. In general, overall conversions tended to be higher at the higher pretreatment severity.
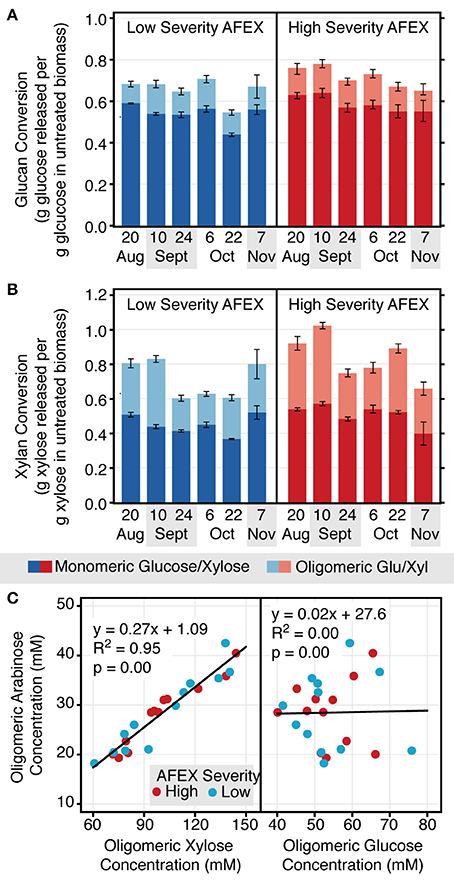
Figure 5. Enzymatic hydrolysis conversions vary inconsistently with switchgrass harvest date, tend to be higher for high severity AFEX pretreatment, and contain a large proportion of oligomers. Enzymatic hydrolysis momomeric and oligomeric glucan (A) and xylan (B) conversion for both low and high severity AFEX pretreatment. Data are averaged across field (n = 2) and experimental (n = 2) replicates. Oligomeric arabinose content is strongly correlated with oligomeric xylose content, but not glucose content (C). Data points are averaged across experimental replicates (n = 2) and are reported for all field replicates (R2 and R4).
A significant proportion of released sugars remained as oligomers following enzymatic hydrolysis. Around 13–22% of released glucose, 28–50% of released xylose, and 57–85% of released arabinose were in oligomeric form in the hydrolysates. The amount of oligomeric arabinose in solution was strongly correlated with the oligomeric xylose concentration, but not the oligomeric glucose concentration (Figure 5C). There were on average 3.6 molecules of oligomeric xylose for every molecule of oligomeric arabinose in solution.
Neither Quantified Inhibitors Nor Amino Acid Depletion Appear to Be Responsible for Inhibition
Of the more than 30 low molecular weight phenolic and nitrogenous compounds quantified in the hydrolysates, none showed a trend correlated with the reduced xylose consumption during fermentation, with a higher concentration for the three early harvest periods and a lower concentration for the three later harvest periods. Low molecular weight imidazoles and pyrazines were produced during the higher severity AFEX pretreatment, but not the low severity (Figure 6A). For the high severity pretreatment, the concentration in the pretreated biomass was only slightly correlated with the water soluble sugar content of the untreated biomass (Figure 6B).
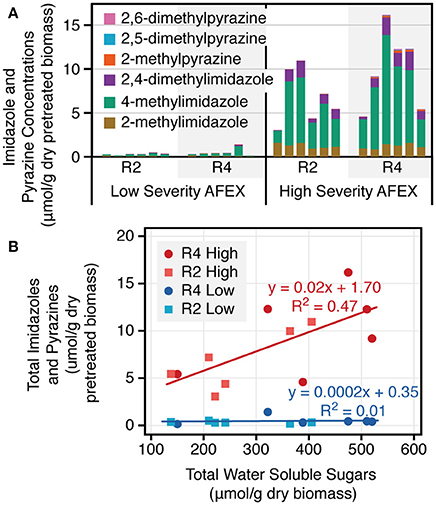
Figure 6. Low molecular weight imidazoles and pyrazines form under the high but not the low temperature AFEX pretreatment (A) and are slightly correlated with soluble sugar content in the untreated biomass (B). The data are shown separately for both field replicates (R2 and R4). The linear regressions are based off of the combined field replicate data. The total water soluble sugars are the amount of water extractable monomeric and polymeric sugars in the untreated biomass.
Of all of the compounds quantified, only two varied linearly with harvest date for both pretreatment severities (p < 0.05), benzamide and feruloyl amide, which both decreased with harvest date (Figure 7). Seven compounds showed statistically significant trends (p < 0.05) with respect to harvest date across field replicates for one of the two pretreatment severities (low severity: 4-hydroxybenzamide, 4-hydroxybenzylalcohol, vanillic acid, ferulic acid, 3-hydroxybenzoic acid, and HMF; high severity: vanillyl alcohol). All of these compounds, except for 4-hydroxybenzamide, showed a decreasing trend with respect to harvest date.
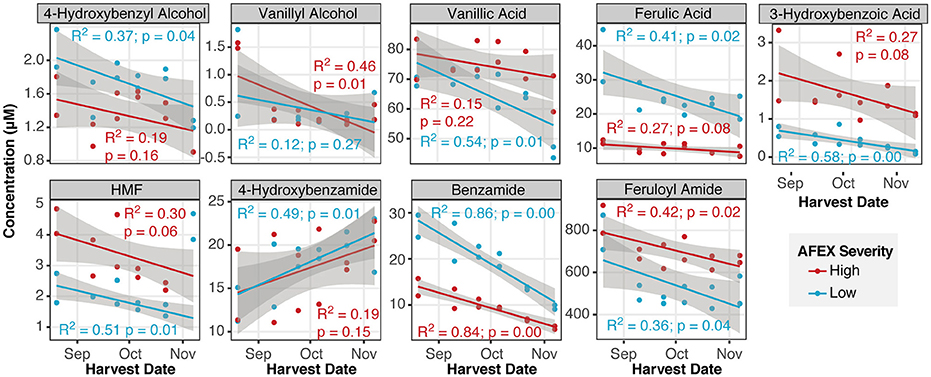
Figure 7. Nine of the fifty-one phenolic and furanic inhibitors varied with harvest date. Separate linear regressions with 95% confidence intervals were plotted for each pretreatment condition across both field replicates (R2 and R4).
More compounds (showed distinct differences in concentrations between pretreatment severities compared to harvest date (Figure S4, Table S3). There were a number of particularly interesting patterns observed related to pretreatment severity. Ferulate and p-coumarate in the hydrolysates were predominantly in the acid form at the lower severity and amide form at the higher severity. The ketones related to H-, G-, and S-lignin (4-hydroxyacetophenone, acetovanillone, and acetosyringone, respectively) were only generated at the high severity pretreatment condition. Syringamide and syringaldehyde were both generated at higher concentrations during the high severity pretreatment. When evaluated using principal component analysis, the majority of the differences between hydrolysates could be attributed to differences in pretreatment severity (48% of variability) (Figure 8). The second largest principal component (17% of variability) differentiated between peak biomass (8/20) and everything else. Additional principal components did not differentiate further by harvest date. The relative contribution of each analyzed compound to PC1 and PC2 is included in a rotation plot in the Supplemental Information (Figure S5).
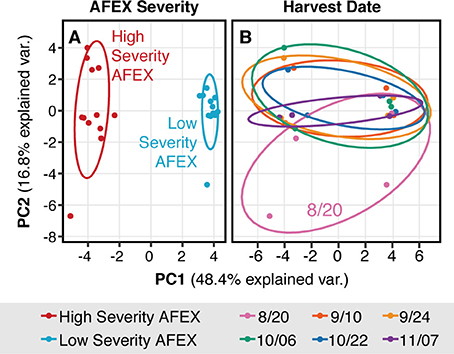
Figure 8. Principal component analysis of hydrolysate inhibitor composition showed that most of the variability was due to pretreatment condition, not harvest date. Both plots are identical except (A) is grouped by pretreatment severity and (B) is grouped by harvest date.
Free amino acids were present in both the hydrolysate and post-fermentation stillage in μM to mM concentrations, depending on the specific amino acid (Figure 9). The amino acids at the lowest concentration in both samples were the nitrogenous aromatic amino acids, histidine and tryptophan. In general, amino acid concentrations in the hydrolysate decreased with harvest date. However, this trend was not observed in the stillage, where the earlier harvest dates tended to have the lowest amino acid concentration. The higher severity AFEX hydrolysates tended to have higher amino acid concentrations in the hydrolysate compared to the low severity.

Figure 9. Heat maps of amino acid composition show that although some amino acids are at low concentrations, none are fully depleted in either the enzymatic hydrolysate (A) or the post-fermentation stillage (B). Heat maps are colored on a logarithmic scale and amino acids are grouped using a dendrogram. Data are averaged across field replicates (R2 and R4).
Discussion
Unlike harvest of corn stover, which is linked to grain harvest, harvest of switchgrass can occur at any time throughout the growing season. However, timing is generally optimized to accommodate the competing interests of maximizing biomass yield and recycling nutrients to belowground tissues. Biomass yield is negatively affected by harvest delays, and as much as one-third of switchgrass can be lost between peak harvest and post-senescence (Gorlitsky et al., 2015; Serapiglia et al., 2016a,b; Ashworth et al., 2017). Most studies recommend late fall or winter harvest dates to avoid significant yield losses while achieving high nutrient resoprtion (Gorlitsky et al., 2015; Serapiglia et al., 2016a,b; Ashworth et al., 2017). However, biomass yields and nutrient resorption are not the only factors that may influence choice of harvest date. Harvest date can influence process ethanol yields, which is important due to the potential influence on the minimum ethanol selling price and biorefinery economics (Vicari et al., 2012). Although previous studies have shown an effect of switchgrass harvest date on ethanol production (Bals et al., 2010; Dien et al., 2013), they evaluated only two or three harvest dates.
In our study we evaluated six harvest dates in the ~2.5 month window between peak biomass and post killing frost and identified a rapid change that occurred in the switchgrass in the 2 week period between the last harvest in September and the first harvest in October. Prior to this period, xylose was poorly consumed, leading to low ethanol yields, however, during later harvests, xylose was almost entirely consumed during yeast fermentations and resulted in correspondingly higher ethanol yields. A previous study found a significantly lower xylose consumption for a July harvest date compared to harvest in October and hypothesized that this may have been due to a higher extractives content (Bals et al., 2010), though this was not confirmed or investigated further. Our analysis of the bulk biomass composition data for each harvest date did not reveal any components, including the total extractives, that varied in the same manner as the observed trend in xylose utilization. However, there was a peak in soluble sugar content (glucose, sucrose and fructose) that occurred in late September at the time of the change in xylose utilization. A fall peak in the soluble sugar content of switchgrass has been observed previously (Lindsey et al., 2013) and represents a source of readily accessible carbohydrates for the plant to use during grain fill (White, 1973). Once seed fill is largely complete, the plant prepares for senescence and rapidly translocates the sugars into the roots and crown for use during initial growth the following season (Sadeghpour et al., 2014; Gorlitsky et al., 2015). This indicates that around the time of the change we observed in xylose utilization efficiency, the switchgrass was in preparation for dormancy.
In terms of the general trends in biomass composition we found similar results as many others have previously reported for switchgrass: cell wall components (structural carbohydrates and lignin) tend to increase with harvest date, while protein, ash, and soluble sugars decline from peak biomass/anthesis to post-killing frost (Adler et al., 2006; Dien et al., 2006; Anderson et al., 2013; Lindsey et al., 2013; Serapiglia et al., 2016b). Based on the cell wall composition data, the apparent increase in cell wall components in the bulk biomass was not due to additional deposition of cell wall material but was instead due to loss of extractives and translocatable elements. The only strongly significant trend was an increase in mannose content with harvest date. Most grasses have very low mannose contents (Scheller and Ulvskov, 2010), however glucomannans are used as a seed storage polysaccharide in C4 grass species (Rodríguez-Gacio et al., 2012). For switchgrass, the entire aboveground biomass, including panicles, are harvested and milled, so it seems likely that the observed increase in mannose is associated with seed fill. This would indicate that the switchgrass continued to contribute to seed fill at least until the killing frost, when our sample collection ended.
Resorption of nutrients into belowground tissues with later harvest dates could result in a nutrient deficit during fermentation, however we found that none of the amino acids were particularly limiting (though this analysis did not evaluate the disulfide bridging enzymes, cysteine and methionine). As the amino acid contents tended to be higher for earlier harvests, and this is the area where the xylose inhibition was observed, amino acid depletion was unlikely the source of the observed effect on xylose consumption. The stillage results showed a lower amino acid concentration earlier in the growing season, however this may be an artifact of processing. Amino acids can be unstable during storage (Van Eijk et al., 1994), and the first three harvest date samples were stored for a longer time than the last three harvest dates. The levels of the two nitrogenous aromatic amino acids, tryptophan (indole) and histidine (imidazole) were extremely low, and it is known that these amino acids can degrade via low temperature Maillard reactions in reducing sugar solutions (Simpson et al., 1976; Baxter, 1995). It is possible that these amino acids react with biomass sugars either during pretreatment or enzymatic hydrolysis to form other compounds. However, even if this is the case, as long as there are other amino acids available, the yeast should be able to generate their own tryptophan and histidine biosynthetically. A previous study observed that the amino acid composition of AFEX-treated corn stover was sufficient to support growth of fermentation organisms without additional supplementation (Lau et al., 2012).
A number of biomass-derived inhibitors have previously been shown to influence fermentation and we evaluated whether the concentration of any of these compounds matched the pattern observed in xylose utilization. Imidazoles and pyrazines are two classes of inhibitory compounds that are produced during Maillard reactions of soluble sugars with ammonia during AFEX pretreatment (Chundawat et al., 2010) and can contribute toward inhibition of yeast fermentation of switchgrass hydrolysates (Ong et al., 2016). Very low levels of imidazoles and pyrazines were detected in the low AFEX severity pretreatment, most likely due to the low temperature used (80°C), which is a major factor in the formation of these compounds (Shibamoto and Bernhard, 1976; Klinger et al., 2013). As inhibition of xylose consumption was observed for both pretreatment severities, it is therefore unlikely that these compounds were the source of the inhibition we observed. Aromatic compounds, particularly the aldehydes, are routinely implicated in inhibition of yeast fermentation (Palmqvist and Hahn-Hägerdal, 2000; Almeida et al., 2011; Sarks et al., 2016; Xue et al., 2018). We quantified over 50 different low molecular weight aromatic compounds, however only nine varied in a statistically significant manner with harvest date and none corresponded to the observed pattern in xylose consumption. In general, there were lower levels of aromatic inhibitors present in the hydrolysates at the end of the harvest period compared to the beginning, but some compounds (feruloyl amide, ferulic acid, 3-hydroxybenzoic acid, and vanillyl alcohol) only had a high content for the earliest harvest date (8/20) with similar concentrations in all later harvests. This led to segregation of the earliest (8/20) harvest date hydrolysate from the others during principal component analysis.
Compared to harvest date, pretreatment conditions had a greater influence on the concentration of most of the aromatic compounds in the hydrolysates. Additionally, a number of interesting trends were observed with respect to pretreatment conditions. Although the low severity pretreatment operated at a higher ammonia:water ratio (2:1 vs. 0.75:1), it generated a greater acid to amide ratio for the hydroxycinnamates (ferulate and p-coumarate) compared to the high severity pretreatment condition. This may indicate that temperature is a key factor dictating conversion of ferulic acid and p-coumaric acid to the amide form, and the relative selectivity of ammonolysis and hydrolysis reactions (Chundawat et al., 2010). The acid form is generally more inhibitory compared to the amide form (Tang et al., 2015) and this could be one contributor toward the lower ethanol yields of the switchgrass pretreated at low severity. Additionally, the formation of ketones was only observed at the higher ammonia pretreatment severity. This could be due to either the high temperature or the greater proportion of water in the reaction that may facilitate formation of more oxygen-rich products.
Based on our results, delaying harvest until switchgrass remobilizes soluble sugars and begins to senesce may be sufficiently long enough to avoid detrimental effects on fermentation, while reducing potential yield losses due to weathering and lodging and allowing for resorption of most translocatable nutrients into belowground tissues. Unfortunately, our results showed no conclusive evidence for the source of inhibition of xylose utilization for the first three switchgrass harvests following peak biomass. This inhibition could not be attributed to soluble sugar degradation products (imidazoles and pyrazines), phenolic inhibitors, or amino acid depletion. What appears most likely is that the inhibition is coming from one or more compounds, perhaps generated for plant defense, that were dismantled or translocated as the switchgrass began to enter dormancy in late September/early October. Future work will attempt to determine the specific compounds that were responsible for the reduction in xylose utilization. Ultimately our results suggest that harvest should be delayed until after the biomass begins to enter dormancy, but it may not be necessary to delay until after a killing frost. Once the switchgrass began to enter dormancy, it had reached a stable concentration of minerals and nitrogen and had passed the peak in soluble sugar content. It may actually be fairly straightforward to monitor switchgrass for this transition either by tracking the color change as the plant dismantles chlorophyll and translocates nitrogen, or by evaluating the change in soluble sucrose concentration over time in the aboveground tissues. Most surprisingly we have found that the optimum harvest date from a processing standpoint coincides with the optimum from an agronomic standpoint, which is counter to what would be expected solely from the composition data. This emphasizes the need to fully process biomass samples from pretreatment through fermentation in order to evaluate their suitability as a biofuel feedstock. As we have previously observed, the standard methods for evaluating biomass composition are not always able to predict or explain variations in fermentation performance for agronomically diverse feedstocks (Ong et al., 2016).
Datasets Are Available on Request
The raw data supporting the conclusions of this manuscript will be made available by the authors, without undue reservation, to any qualified researcher.
Author Contributions
RO and GS conceived the overall project. RO, GS, SS, and LdC designed the experiments. SS conducted enzymatic hydrolysis and fermentation experiments. RO performed computational data analysis. RO and SS drafted the manuscript with edits and comments from GS and LdC.
Funding
This material is based upon work supported by the U.S. Department of Energy, Office of Science, Office of Biological and Environmental Research under Award Number DE-SC0018409, and work funded by the DOE Great Lakes Bioenergy Research Center (DOE BER Office of Science DE-FC02-07ER64494).
Conflict of Interest Statement
The authors declare that the research was conducted in the absence of any commercial or financial relationships that could be construed as a potential conflict of interest.
Acknowledgments
We want to thank the following people for their work in biomass collection and processing: J. Sustachek, A. Miller, Z. Andersen, B. Faust, and J. Tesmer. We also thank the following people for their work in running experiments and generating data: M. Samghabadi for composition analysis, C. Donald Jr. for AFEX pretreatment, S. Smith for MS analyses on imidazole and pyrazine contents and amino acid composition, M. McGee for fermentation product analysis, and A. Higbee for hydrolysate phenolic and furanic compound analysis. We gratefully acknowledge Novozymes, who provided the enzymes used for this work and Dr. Nancy Ho, who provided the yeast strain through a cooperative agreement with MSU.
Supplementary Material
The Supplementary Material for this article can be found online at: https://www.frontiersin.org/articles/10.3389/fenrg.2018.00052/full#supplementary-material
Table S1. Bulk composition of untreated switchgrass (% of total dry biomass) - Field Replicate R2. Values are reported as the mean ± s.d. (n = 3 technical replicates).
Table S2. Bulk composition of untreated switchgrass (% of total dry biomass) - Field Replicate R4. Values are reported as the mean ± s.d. (n = 3 technical replicates).
Table S3. ANOVA p-values for phenolic linear regression models. Values are based on the combined field replicates (R2 and R3) across both high and low severity pretreatment conditions.
Figure S1. Xylose consumption is impaired during Saccharomyces cerevisiae 424A fermentation of switchgrass harvested prior to October for high severity AFEX pretreatments. High severity AFEX was at 1.5 g NH3 g−1 dry biomass, 2.0 g H2O g−1 dry biomass, 130°C and 30 min residence time. Results are averaged across experimental replicates (n = 2) and field replicates (R2 and R4, n = 2). Error bars represent ± standard.
Figure S2. Xylose consumption is correlated to process ethanol yields but is unrelated to switchgrass field replicate. Data points include both low and high severity pretreatment.
Figure S3. Most cell wall carbohydrates show no consistent variation with harvest date across field replicates. Values are based on the amount in the alcohol insoluble residue (AIR). Data points represent technical replicates (n = 3). The “All” column aggregates the data for all five field replicates, with the red dot representing the average across all field and technical replicates. H = p-hydroxyphenyl.
Figure S4. Most phenolic and furanic inhibitors did not vary significantly with harvest date. Separate linear regressions with 95% confidence intervals were plotted for each pretreatment condition across both field replicates (R2 and R4).
Figure S5. PCA rotation plot showing the relative contribution of each hydrolysate compound to the principal components. Colors indicate compound functional group.
Abbreviations
AFEX, ammonia fiber expansion pretreatment; HPLC, high performance liquid chromatograph; OD600, optical density at 600 nm; MRM, multiple reaction monitoring; s.d., standard deviation.
References
Adler, P. R., Sanderson, M. A., Boateng, A. A., Weimer, P. J., and Jung, H.-J. G. (2006). Biomass yield and biofuel quality of switchgrass harvested in fall or spring. Agron. J. 98, 1518–1525. doi: 10.2134/agronj2005.0351
Almeida, J. R. M., Runquist, D., Sànchez Nogué, V., Lidén, G., and Gorwa-Grauslund, M. F. (2011). Stress-related challenges in pentose fermentation to ethanol by the yeast Saccharomyces cerevisiae. Biotechnol. J. 6, 286–299. doi: 10.1002/biot.201000301
Anderson, E. K., Parrish, A. S., Voigt, T. B., Owens, V. N., Hong, C.-H., and Lee, D. K. (2013). Nitrogen fertility and harvest management of switchgrass for sustainable bioenergy feedstock production in Illinois. Ind. Crops Prod. 48, 19–27. doi: 10.1016/j.indcrop.2013.03.029
Ashworth, A. J., Rocateli, A. C., West, C. P., Brye, K. R., and Popp, M. P. (2017). Switchgrass growth and effects on biomass accumulation, moisture content, and nutrient removal. Agron. J. 109, 1359–1367. doi: 10.2134/agronj2017.01.0030
Bals, B., Rogers, C., Jin, M. J., Balan, V., and Dale, B. (2010). Evaluation of ammonia fibre expansion (AFEX) pretreatment for enzymatic hydrolysis of switchgrass harvested in different seasons and locations. Biotechnol. Biofuels 3, 1–11. doi: 10.1186/1754-6834-3-1
Baxter, J. H. (1995). Free amino acid stability in reducing sugar systems. J. Food Sci. 60, 405–408. doi: 10.1111/j.1365-2621.1995.tb05682.x
Cahill, N., Popp, M., West, C., Rocateli, A., Ashworth, A., Farris Sr, R., et al. (2014). Switchgrass harvest time effects on nutrient use and yield: An economic analysis. J. Agric. Appl. Econ. 46, 487–507. doi: 10.1017/S1074070800029060
Chundawat, S. P. S., Vismeh, R., Sharma, L. N., Humpula, J. F., Da Costa Sousa, L., Chambliss, C. K., et al. (2010). Multifaceted characterization of cell wall decomposition products formed during ammonia fiber expansion (AFEX) and dilute acid based pretreatments. Bioresour. Technol. 101, 8429–8438. doi: 10.1016/j.biortech.2010.06.027
Dien, B. S., Jung, H.-J. G., Vogel, K. P., Casler, M. D., Lamb, J. F. S., Iten, L., et al. (2006). Chemical composition and response to dilute-acid pretreatment and enzymatic saccharification of alfalfa, reed canarygrass, and switchgrass. Biomass Bioenergy 30, 880–891. doi: 10.1016/j.biombioe.2006.02.004
Dien, B. S., O'bryan, P. J., Hector, R. E., Iten, L. B., Mitchell, R. B., Qureshi, N., et al. (2013). Conversion of switchgrass to ethanol using dilute ammonium hydroxide pretreatment: influence of ecotype and harvest maturity. Environ. Technol. 34, 1837–1848. doi: 10.1080/09593330.2013.833640
Foster, C. E., Martin, T. M., and Pauly, M. (2010a). Comprehensive compositional analysis of plant cell walls (lignocellulosic biomass) Part I: Lignin. J. Vis. Exp. 37:e1745. doi: 10.3791/1745
Foster, C. E., Martin, T. M., and Pauly, M. (2010b). Comprehensive compositional analysis of plant cell walls (lignocellulosic biomass) Part II: Carbohydrates. J. Vis. Exp. 37:e1837. doi: 10.3791/1837
Gamble, J. D., Jungers, J. M., Wyse, D. L., Johnson, G. A., Lamb, J. A., and Sheaffer, C. C. (2015). Harvest date effects on biomass yield, moisture content, mineral concentration, and mineral export in switchgrass and native polycultures managed for bioenergy. Bioenergy Res. 8, 740–749. doi: 10.1007/s12155-014-9555-0
Gorlitsky, L. E., Sadeghpour, A., Hashemi, M., Etemadi, F., and Herbert, S. J. (2015). Biomass vs. quality tradeoffs for switchgrass in response to fall harvesting period. Ind. Crops Prod. 63, 311–315. doi: 10.1016/j.indcrop.2014.10.012
Gu, L. P., Jones, A. D., and Last, R. L. (2007). LC–MS/MS assay for protein amino acids and metabolically related compounds for large-scale screening of metabolic phenotypes. Anal. Chem. 79, 8067–8075. doi: 10.1021/ac070938b
Hames, B., Scarlata, C., and Sluiter, A. (2008). “Determination of protein content in biomass,” in Laboratory Analytical Procedures (LAPs). (Golden, CO: National Renewable Energy Laboratory).
Ho, N. W. Y., Chen, Z., Brainard, A. P., and Sedlak, M. (1999). “Successful design and development of genetically engineered Saccharomyces yeasts for effective cofermentation of glucose and xylose from cellulosic biomass to fuel ethanol,” in Recent Progress in Bioconversion of Lignocellulosics, eds G. T. Tsao, A. P. Brainard, H. R. Bungay, N. J. Cao, P. Cen, Z. Chen, J. Du, B. Foody, C. S. Gong, P. Hall, N. W. Y. Ho, D. C. Irwin, P. Iyer, T. W. Jeffries, C. M. Ladisch, M. R. Ladisch, Y. Y. Lee, N. S. Mosier, H. M. Mühlemann, M. Sedlak, N. Q. Shi, G. T. Tsao, J. S. Tolan, R. W. Torget, D. B. Wilson, and L. Xia. (Berlin; Heidelberg: Springer Berlin Heidelberg), 163–192.
Klinger, K. M., Liebner, F., Fritz, I., Potthast, A., and Rosenau, T. (2013). Formation and ecotoxicity of N-heterocyclic compounds on ammoxidation of mono- and polysaccharides. J. Agric. Food Chem. 61, 9004–9014. doi: 10.1021/jf4019596
Langholtz, M. H., Stokes, B. J., and Eaton, L. M. (2016). 2016 Billion-ton Report: Advancing Domestic Resources for a Thriving Bioeconomy. (Oak Ridge, TN: Oak Ridge National Laboratory).
Lau, M. W., and Dale, B. E. (2009). Cellulosic ethanol production from AFEX-treated corn stover using Saccharomyces cerevisiae 424A(LNH-ST). Proc. Natl. Acad. Sci. U.S.A. 106, 1368–1373. doi: 10.1073/pnas.0812364106
Lau, M. W., Bals, B. D., Chundawat, S. P. S., Jin, M. J., Gunawan, C., Balan, V., et al. (2012). An integrated paradigm for cellulosic biorefineries: utilization of lignocellulosic biomass as self-sufficient feedstocks for fuel, food precursors and saccharolytic enzyme production. Energy Environ. Sci. 5, 7100–7110. doi: 10.1039/c2ee03596k
Lindsey, K., Johnson, A., Kim, P., Jackson, S., and Labbé, N. (2013). Monitoring switchgrass composition to optimize harvesting periods for bioenergy and value-added products. Biomass Bioenergy 56, 29–37. doi: 10.1016/j.biombioe.2013.04.023
Oates, L. G., Duncan, D. S., Gelfand, I., Millar, N., Robertson, G. P., and Jackson, R. D. (2016). Nitrous oxide emissions during establishment of eight alternative cellulosic bioenergy cropping systems in the North Central United States. Glob. Change Biol. Bioenergy 8, 539–549. doi: 10.1111/gcbb.12268
Ong, R. G., Higbee, A., Bottoms, S., Dickinson, Q., Xie, D., Smith, S. A., et al. (2016). Inhibition of microbial biofuel production in drought-stressed switchgrass hydrolysate. Biotechnol. Biofuels 9:237. doi: 10.1186/s13068-016-0657-0
Palmqvist, E., and Hahn-Hägerdal, B. (2000). Fermentation of lignocellulosic hydrolysates. II: inhibitors and mechanisms of inhibition. Bioresource Technol. 74, 25–33. doi: 10.1016/S0960-8524(99)00161-3
Robertson, G. P., Hamilton, S. K., Barham, B. L., Dale, B. E., Izaurralde, R. C., Jackson, R. D., et al. (2017). Cellulosic biofuel contributions to a sustainable energy future: choices and outcomes. Science 356. doi: 10.1126/science.aal2324
Rodríguez-Gacio, M. D. C., Iglesias-Fernández, R., Carbonero, P., and Matilla, Á. J. (2012). Softening-up mannan-rich cell walls. J. Exp. Bot. 63, 3976–3988. doi: 10.1093/jxb/ers096
Sadeghpour, A., Gorlitsky, L. E., Hashemi, M., Weis, S. A., and Herbert, S. J. (2014). Response of switchgrass yield and quality to harvest season and nitrogen fertilizer. Agron. J. 106, 290–296. doi: 10.2134/agronj2013.0183
Sarks, C., Higbee, A., Piotrowski, J., Xue, S. S., Coon, J. J., Sato, T. K., et al. (2016). Quantifying pretreatment degradation compounds in solution and accumulated by cells during solids and yeast recycling in the Rapid Bioconversion with Integrated recycling Technology process using AFEX™ corn stover. Bioresour. Technol. 205, 24–33. doi: 10.1016/j.biortech.2016.01.008
Scheller, H. V., and Ulvskov, P. (2010). Hemicelluloses. Annu. Rev. Plant Biol. 61, 263–289. doi: 10.1146/annurev-arplant-042809-112315
Serapiglia, M. J., Boateng, A. A., Lee, D. K., and Casler, M. D. (2016a). Switchgrass harvest time management can impact biomass yield and nutrient content. Crop Sci. 56, 1970–1980. doi: 10.2135/cropsci2015.08.0527
Serapiglia, M. J., Dien, B. S., Boateng, A. A., and Casler, M. D. (2016b). Impact of harvest time and switchgrass cultivar on sugar release through enzymatic hydrolysis. Bioenergy Res. 10, 1–11. doi: 10.1007/s12155-016-9803-6
Shibamoto, T., and Bernhard, R. A. (1976). Effect of time, temperature, and reactant ratio on pyrazine formation in model systems. J. Agric. Food Chem. 24, 847–852. doi: 10.1021/jf60206a045
Simpson, R. J., Neuberger, M. R., and Liu, T. Y. (1976). Complete amino acid analysis of proteins from a single hydrolysate. J. Biol. Chem. 251, 1936–1940.
Sluiter, A., Hames, B., Ruiz, R., Scarlata, C., Sluiter, J., and Templeton, D. (2008a). Determination of Ash in Biomass. Laboratory Analytical Procedures (LAPs). National Renewable Energy Laboratory, Golden, CO.
Sluiter, A., Hames, B., Ruiz, R., Scarlata, C., Sluiter, J., and Templeton, D. (2008b). Determination of Sugars, Byproducts, and Degradation Products in Liquid Fraction Process Samples. Laboratory Analytical Procedures (LAPs). National Renewable Energy Laboratory, Golden, CO.
Sluiter, A., Hames, B., Ruiz, R., Scarlata, C., Sluiter, J., Templeton, D., et al. (2012). Determination of Structural Carbohydrates and Lignin in Biomass. Laboratory Analytical Procedures (LAPs). National Renewable Energy Laboratory, Golden, CO.
Sluiter, A., Ruiz, R., Scarlata, C., Sluiter, J., and Templeton, D. (2008c). Determination of Extractives in biomass. Laboratory Analytical Procedures (LAPs). National Renewable Energy Laboratory, Golden, CO.
Tang, X. Y., Da Costa Sousa, L., Jin, M. J., Chundawat, S., Chambliss, C., Lau, M., et al. (2015). Designer synthetic media for studying microbial-catalyzed biofuel production. Biotechnol. Biofuels 8:1. doi: 10.1186/s13068-014-0179-6
Van Eijk, H. M. H., Dejong, C. H. C., Deutz, N. E. P., and Soeters, P. B. (1994). Influence of storage conditions on normal plasma amino-acid concentrations. Clin. Nutr. 13, 374–380. doi: 10.1016/0261-5614(94)90028-0
Vicari, K., Tallam, S., Shatova, T., Joo, K., Scarlata, C., Humbird, D., et al. (2012). Uncertainty in techno-economic estimates of cellulosic ethanol production due to experimental measurement uncertainty. Biotechnol. Biofuels 5:23. doi: 10.1186/1754-6834-5-23
Warnes, G. R., Bolker, B., Bonebakker, L., Gentleman, R., Huber, W., Liaw, A., et al. (2009). gplots: Various R Programming Tools for Plotting Data. R package version 2, 1. Available online at: https://cran.r-project.org/web/packages/gplots/gplots.pdf
White, L. M. (1973). Carbohydrate reserves of grasses: a review. J. Range Manage. 26, 13–18. doi: 10.2307/3896873
Wickham, H. (2009). ggplot2: Elegant Graphics for Data Analysis. New York, NY:Springer. doi: 10.1007/978-0-387-98141-3
Xue, S. S., Jones, A. D., Sousa, L., Piotrowski, J., Jin, M. J., Sarks, C., et al. (2018). Water-soluble phenolic compounds produced from extractive ammonia pretreatment exerted binary inhibitory effects on yeast fermentation using synthetic hydrolysate. PLoS ONE 13:e0194012. doi: 10.1371/journal.pone.0194012
Keywords: biomass composition, fermentation inhibition, harvest timing, lignocellulosic biofuel, switchgrass, xylose utilization
Citation: Ong RG, Shinde S, da Costa Sousa L and Sanford GR (2018) Pre-senescence Harvest of Switchgrass Inhibits Xylose Utilization by Engineered Yeast. Front. Energy Res. 6:52. doi: 10.3389/fenrg.2018.00052
Received: 11 April 2018; Accepted: 30 May 2018;
Published: 19 June 2018.
Edited by:
Allison E. Ray, Idaho National Laboratory, United StatesReviewed by:
Yong Xu, Nanjing Forestry University, ChinaJinxue Jiang, Washington State University, United States
Copyright © 2018 Ong, Shinde, da Costa Sousa and Sanford. This is an open-access article distributed under the terms of the Creative Commons Attribution License (CC BY). The use, distribution or reproduction in other forums is permitted, provided the original author(s) and the copyright owner are credited and that the original publication in this journal is cited, in accordance with accepted academic practice. No use, distribution or reproduction is permitted which does not comply with these terms.
*Correspondence: Rebecca G. Ong, cmdvbmcxQG10dS5lZHU=
†These authors have shared co-authorship for this article.