 Kai Zhao1
 Su Y. Ha
- 1Voiland School of Chemical Engineering and Bioengineering, Washington State University, Pullman, WA, United States
- 2Division of Advanced Materials Engineering, Chonbuk National University, Jeonbuk, South Korea
- 3School of Mechanical and Materials Engineering, Washington State University, Pullman, WA, United States
Inert-substrate-supported tubular solid oxide fuel cells with multi-functional layers were fabricated in this work. The tubular single cells consisted of a porous yttria-stabilized zirconia inert-substrate supporting layer, a Ni anode current collecting layer, a Ni-Ce0.8Sm0.2O1.9 anode electrochemical layer, an yttria-stabilized zirconia/Ce0.8Sm0.2O1.9 bi-layer electrolyte, and a La0.6Sr0.4Co0.2Fe0.8O3−δ cathode. Thickness of the La0.6Sr0.4Co0.2Fe0.8O3−δ cathode layer could be varied from 2.5 to 25.0 μm by controlling the number of dip-coatings in the single cell fabrication process. Electrochemical performance of the tubular single cells was investigated as a function of cathode thickness. Area specific resistance and maximum power density of the single cell were significantly affected by the thickness of the cathode. Increasing the cathode thickness to 15 μm was effective in reducing the sheet resistance of the layer and the area specific resistance of the single cell. Further increasing the cathode thickness induced a higher electrode polarization loss, which originated from insufficient gas diffusion and transport processes. Therefore, the optimum thickness of the La0.6Sr0.4Co0.2Fe0.8O3−δ cathode layer was determined to be 15 μm. At 800°C, the tubular single cell with the optimum cathode thickness displayed the highest observed maximum power density of 559 mWcm−2 under the hydrogen/air operation mode. Additionally, the tubular single cell exhibited good thermal cycling stability between 800 and 25°C for five cycles. These results illustrate the advantages of this system for future applications of the inert-substrate-supported tubular single cells in repeated startup and shut down conditions.
Introduction
Solid oxide fuel cells (SOFCs) are electrochemical devices that convert chemical energy into electricity. As the chemical energy present in fuels is directly converted into electrical energy, SOFCs show a higher energy conversion efficiency than conventional gas turbine engines (Stambouli and Traversa, 2002; Kirubakaran et al., 2009). Compared to widely developed button type SOFCs, tubular type SOFCs exhibit benefits of reduced sealing area and improved mechanical properties. Hence, they can be applied for fast startup and shutdown operating conditions, which is a significant advantage for future commercialization (Singhal, 2012; Orera et al., 2014). In the past several decades, the Ni-yttria-stabilized zirconia (YSZ) anode supported single cell configuration has been regarded as the mainstream for SOFC developments. This is due to the high conductivity of the nickel cermet, good electrocatalytic activity and low electrode polarization (Singhal, 2012; Shri Prakash et al., 2014). However, the thermal expansion coefficient (TEC) of the Ni-YSZ anode (with a Ni content >50 vol.%) is much higher than typical YSZ and doped-ceria electrolyte materials. The mismatch in TEC between bulk Ni-YSZ and the electrolyte layers may induce cracks in the electrolyte and eventual failure of the single cell (Aruna et al., 1998; Sameshima et al., 1999; Hayashi et al., 2005).
To match the TECs between the supporting layer and the electrolyte layer, the thermal and mechanical properties of Ni-YSZ has been investigated with respect to the nickel content in the cermet. Lowing the nickel content was found to be effective in reducing the TEC of Ni-YSZ, and the Ni-YSZ cermet with 15 vol.% of Ni exhibits TEC of 1.04 × 10⁻⁵ K−1, which is comparable with that of YSZ (1.05 × 10⁻⁵ K−1; Aruna et al., 1998; Hayashi et al., 2005). On the other hand, the insufficient nickel loading (15 vol.%) in the anode leads to poor connectivity between the nickel grains. Hence, the anode displays an unsatisfactory electronic conductivity of ~0.103 S cm−1 at 900°C, resulting in evidently high ohmic loss of the single cells and reduction in the maximum power density (Aruna et al., 1998). In order to maintain mechanical compatibility between the supporting layer and the electrolyte in the single cell while ensuring sufficient electronic conductivity in the anode layer, a porous YSZ inert-substrate-supported tubular single cell design was developed (Zhao et al., 2014, 2016) with the following configuration:
• Porous YSZ supporting layer
• Ni-Ce0.8Sm0.2O1.9 (Ni-SDC) anode
• YSZ/SDC bi-layer electrolyte
• La0.6Sr0.4Co0.2Fe0.8O3−δ (LSCF) cathode.
As the YSZ was used as the supporting layer, the TEC of the substrate should match that of the YSZ/SDC bi-layer electrolyte (TEC of YSZ is 10.5 × 10⁻⁶ K−1 and TEC of SDC is 11.8 × 10⁻⁶ K−1 from 200 to 1,000°C; Sameshima et al., 1999; Hayashi et al., 2005). To ensure the high electronic conductivity and electrochemical activity, 50 vol.% of Ni−50 vol.% of SDC anode was applied as a functional layer (10–20 μm) on the outer surface of the porous YSZ substrate. According to previous thermo-mechanical simulation studies, reducing the thickness of the anode layer from the millimeter range to the micrometer range is effective in reducing the stress generated by the thermal expansion mismatch (Yakabe et al., 2004; Sarantaridis and Atkinson, 2007). Thus, a thin anode layer (10–20 μm) applied in the tubular cell was expected to minimize the stress between the various functional layers in the cell. This expectation was validated by previous experimental work on redox cycling performance of the tubular single cells (Zhao et al., 2014).
In previous study, the initial electrochemical performance and redox cycling stability of the tubular single cells were optimized by controlling the microstructure of the anode layer. For example, the fabrication parameters (such as the porosity of the YSZ substrate and the number of dip-coatings for the anode layer) were tailored to achieve the optimum anode microstructure (Zhao et al., 2014). Despite the previous work on performance improvement for the tubular single cells (300–400 mW cm−2 at 800°C), the maximum power density was still lower than conventional button-type Ni-Sm, Gd-doped ceria anode single cells (~900 mW cm−2 at 650°C; Fu et al., 2010). Experimental results revealed that the tubular single cell displayed a significantly larger area specific resistance (~0.90 Ω cm2 at 800°C) under the open-circuit voltage condition than the conventional button-type Ni-SDC anode single cell (0.41 Ω cm2 at 600°C; Fu et al., 2010; Zhao et al., 2014). Considering the Ni-containing anode employed in the cell, the area specific resistance arising from the cathode side would be regarded as an important contributor to the total polarization resistance of our tubular single cell.
The oxygen reduction on the surface of the LSCF cathode involves the following steps: (1) oxygen diffusion to the cathode surface, (2) adsorption and dissociation of oxygen on the cathode surface, (3) electron charge transfer between the cathode surface and adsorbed oxygen, (4) diffusion of oxygen ions in the cathode bulk phase, and (5) oxygen ion charge transfer at the interface between the cathode and the electrolyte (Adler, 2004; Li et al., 2010; Gong et al., 2012). Steps (3)–(5) are mainly determined by the intrinsic electronic-ionic mixed conducting properties of the cathode material, while steps (1) and (2) are highly dependent on the extrinsic microstructure of the cathode. To minimize the cathode polarization, microstructural features, such as porosity, grain size and adhesion between grains in the cathode were optimized by adjusting the pore former contents in the cathode slurry, the particle size of the starting powders, and the sintering temperature of the electrode (Perry Murray et al., 2002; Murata et al., 2005; Gostovic et al., 2007), respectively. However, the effect of cathode thickness on overall electrochemical performance of the inert-substrate-supported tubular single cell has not been satisfactorily addressed. Further research efforts to elucidate the relationship between the cathode thickness and electrochemical activity of the tubular single cell could provide a guideline for improving overall cell performance.
In this work, a porous YSZ inert-substrate-supported tubular single cell was fabricated by an extrusion and slurry dip-coating method. Thickness of the LSCF cathode layer was adjusted by varying the number of dip-coatings from one up to six. The electrochemical performance of the tubular single cell was determined as the function of cathode thickness. The optimum cathode thickness being when the maximum power density of the tubular single cells was obtained. Additionally, the thermal cycling performance of the tubular single cell was investigated to understand its mechanical stability under repetitive startup and shut down operating conditions.
Materials and Methods
Powder Preparation
The NiO-SDC powder containing 61.3 wt.% NiO and 38.7 wt.% SDC was obtained by urea combustion synthesis. Reagent grade Ni(NO3)2·6H2O (High Purity Chemicals), Ce(NO3)3·6H2O (Alfa Aesar), Sm(NO3)3·6H2O (Alfa Aesar) and urea (Alfa Aesar) were used as starting materials. These starting materials were dissolved into deionized water to form a solution. The mole ratio of urea to the total metal cation content was 2.0 according to our previous results (Chen et al., 2008). This solution was stirred for 1 h and heated on a hot plate until auto-ignition and self-sustaining combustion occurred. The obtained ash was subsequently ground for 24 h in ethanol medium using a ball milling process with zirconia balls. Then the powder was calcined at 1,000°C for 2 h in air.
The LSCF cathode powder with the nominal composition of La0.6Sr0.4Co0.2Fe0.8O3−δ was synthesized by a glycine-nitrate combustion. Reagent grade La(NO3)3·6H2O (Kanto Chemical), Sr(NO3)2 (Sigma Aldrich), Co(NO3)3·6H2O (Sigma Aldrich), Fe(NO3)3·9H2O (Kanto Chemical) and glycine (Samchun Chemical) were used as raw materials. These nitrates were weighed, respectively, according to the nominal composition, and dissolved into deionized water to form a solution. The mole ratio of glycine to the total metal cation content was selected as 3.0 according to our previous results (Zhao et al., 2011). This solution was stirred for 1 h and heated on a hot plate until auto-ignition and self-sustaining combustion occurred. The obtained ash was subsequently ground for 24 h in ethanol medium using a ball milling process with zirconia balls. Then the powder was calcined at 700°C for 2 h in air. The details of the powder fabrication procedure have been described elsewhere (Zhao et al., 2013).
Fabrication of the Single Cell
Porous YSZ inert-substrate supports were fabricated by an extrusion process using 25 wt.% poly(methyl-methacrylate) (Sunjin Chemical) pore former mixed with 75 wt.% YSZ powder (Zr0.92Y0.08O2−δ, 99.9%, Tosoh). The inner and outer diameters of the tubes were 3.4 and 6.0 mm, respectively.
The Ni anode current collector layer was deposited onto the outer surface of the YSZ tube by dip-coating using 16 wt.% NiO (99.995%, Alfa Aesar) and 1.8 wt.% poly(methyl-methacrylate) powders dispersed in an organic carrier (I) by ball milling for 24 h. The organic carrier (I) consisted of 0.5 wt.% triethanolamine (>99%, Alfa Aesar), 1.0 wt.% dibutyl phthalate (>99%, Alfa Aesar), 1.0 wt.% polyethylene glycol 300 (>99%, Showa Chemical), 1.5 wt.% polyvinyl butyral (Sigma Aldrich), 48 wt.% 2-butanone (99%, Alfa Aesar), and 48 wt.% ethanol (Hayman Specialty Products). The NiO slurry was dip-coated onto the YSZ surface and dried in air for 24 h. The layer was then calcined at 500°C for 1 h in air. The NiO-SDC anode layer with 60 wt.% NiO and 40 wt.% SDC was deposited over the NiO layer in the same way by dip-coating.
After fabricating the anode layer, the YSZ (Zr0.92Y0.08O2−δ) electrolyte was deposited on the outer surface of the tube by dip-coating using 17 wt.% YSZ powder mixed in organic carrier (II) by ball milling for 24 h. The organic slurry (II) was comprised of 30 wt.% ethanol, 30 wt.% B73210 organic binder (Ferro Electronic Materials), and 40 wt.% α-terpineol (>96%, Sigma Aldrich). The YSZ slurry was dip-coated onto the NiO-SDC anode layer. The SDC layer was fabricated over the YSZ electrolyte layer by the same process. Then, the green tube was co-sintered at 1,400°C for 4 h in air. The inner and outer diameters of the tube were reduced to 2.5 and 4.5 mm, respectively. The detailed fabrication procedure was reported in our previous publication (Zhao et al., 2014).
Finally, 10 wt.% LSCF powder was mixed with 90 wt.% lab-made organic carrier (III) by ball-milling for 24 h to form the cathode slurry. Organic carrier (III) comprised 0.5 wt.% triethanolamine, 1.0 wt.% polyethylene glycol 300, 1.0 wt.% dibutyl phthalate, 3.5 wt.% polyvinyl butyral, 31 wt.% ethanol, and 63 wt.% 2-butanone. The dip-coating process was repeated from one to six times to adjust the thickness of the cathode. After the dip-coating process, the cathode layer was sintered at 950°C for 2 h in air.
Structural Characterization
The porosity of the YSZ substrate was measured by the Archimedes' method and was determined to be ~39% after sintering at 1,400°C for 4 h in air. The microstructure of the tubular single cells was examined by scanning electron microscopy (SEM, JSM-6400, JEOL). Features of the cathode layer such as grain size, porosity and thickness were estimated using Image-Pro Plus 6.0 software (Iwanschitz et al., 2012).
Electrical Resistance
The sheet resistance of the cathode layer was measured by a four-probe method at 800°C in air. The experimental setup for measuring the sheet resistance of the cathode layer is shown in Figure 1A. The sheet resistance (Rs) of the cathode layer was calculated by the following equation (Zhao et al., 2014):
where I is the current applied between line E and line F, and U is the voltage measured between A and B. D is the outer diameter of the tubular single cell and L is the distance between A and B. As the conductivity of SDC (~0.082 S cm−1) is three orders of magnitude lower than that of LSCF (~200 S cm−1) at 800°C in air, the SDC layer shows a minor effect on the measured sheet resistance of the LSCF layer (see the Supplementary Material; Mineshige et al., 2005; Chen M. et al., 2009). Additionally, according to previous research results, the conductivities of YSZ and NiO-YSZ layers were even lower than that of SDC layer in air (Eguchi, 1997). Hence, the YSZ, NiO-YSZ and the porous YSZ substrate layers are expected to have no evident effects on the measured sheet resistance of the LSCF layer. Therefore, the sheet resistance that we measured in this study truly represents the sheet resistance of the LSCF layer.
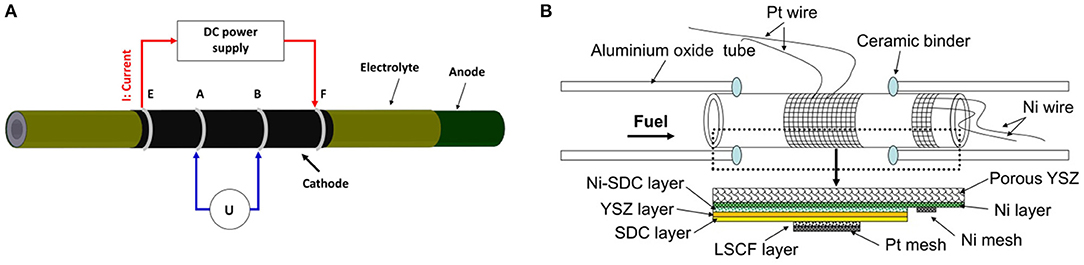
Figure 1. (A) Schematic diagram of sheet resistance measurement setup, and (B) Schematic diagram of tubular single cells.
Cell Performance Measurement
Electrochemical performance of the tubular single cell was investigated by an in-house-designed fuel cell testing system (shown in Figure 1B). The system consists of an electrochemical workstation (SP 150, Biologic SAS), a set of mass flow controllers (FM-30VE, Line Tech), and alumina single cell holders. Platinum wire (wire diameter: 1 mm) and platinum mesh (mesh size: 40 × 40, wire diameter: 0.1 mm) were used as the current collectors for the cathode, while nickel wire and nickel mesh were used as the current collectors for the anode. The tubular single cell was sealed to the alumina single cell holders by an alumina-based ceramic binder (AREMCO Products). Electrochemical cell characterization was performed using dry hydrogen (200 sccm) as fuel and air as the oxidant at 800°C. Electrochemical impedance spectra of the tubular single cells were measured under the open-circuit voltage (OCV) condition in the frequency range of 0.01 Hz −100 kHz, and the amplitude of the sinuous signal was 10 mV in the potentiostatic mode.
Thermal cycling stability of the single cell was tested between 800 and 25°C with hydrogen as fuel and air as oxidant. For each cycle, the single cell was heated to 800°C at 4°C min−1, and performance stability was measured at 800°C for ~ 5 h. Then, the cell was cooled down to 25°C at 4°C min−1. The thermal cycling process was repeated five times in this present study.
Results
Microstructural Characterization
Figure 2 shows cross-sectional SEM images of the inert-substrate supported tubular single cells fabricated by dip-coating. Figure 2A illustrates the full single cell with the porous YSZ substrate, Ni anode current collector, Ni-SDC anode, YSZ/SDC bi-layer electrolyte, and the LSCF cathode. The LSCF layer was dip-coated for four times. Good adhesion appears to have been obtained between the different functional layers in the cells. Figures 2B–D shows typical SEM images of the cathode layer with the increasing thickness as the number of dip-coating steps goes from one to six. The LSCF layer coated once displayed some discontinuous regions, which could be ascribed to insufficient slurry wetting on the dense surface of the SDC electrolyte (Yamaguchi et al., 2007). After depositing a second LSCF layer, no disconnected regions were identified by the SEM analysis. The improved wetting in the additional dip-coatings would be due to the enhanced capillary force generated from the previously deposited porous LSCF layer on the tubular single cells (Yamaguchi et al., 2007; Tikkanen et al., 2011). Generally, the thickness of the cathode was found to increase from 2.5 to 25 μm as the number of dip-coatings varied from one to six.
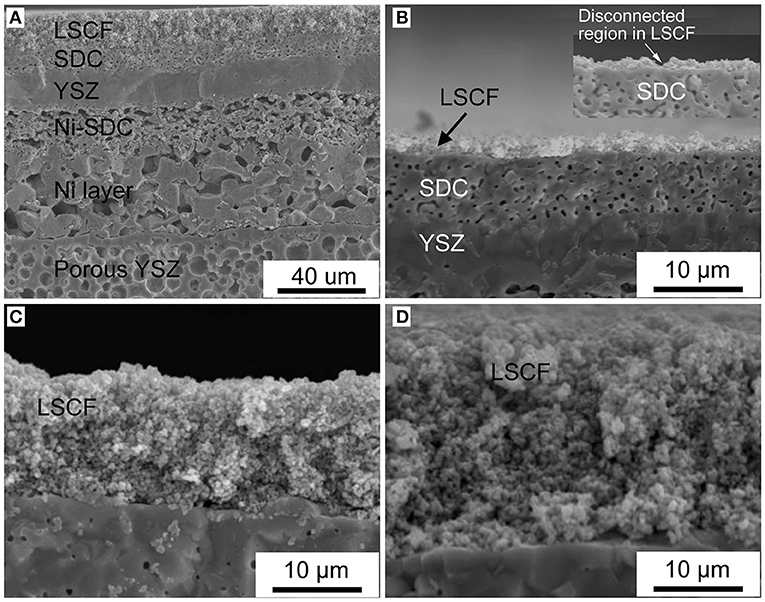
Figure 2. (A) SEM image of the tubular single cell; (B–D) Cathode layers with the dip-coating time going from one, to four and then six, respectively.
Sheet Resistance
Figure 3 shows the sheet resistance of the cathode layer measured by the four-probe method at 800°C in air. The LSCF cathode layer dip-coated once displayed an extraordinarily high sheet resistance of 895 Ω sq−1, and high resistivity of 0.22 Ω cm (shown in Figure S2 in the Supplementary Material), which could be due to the discontinuities in the layer as shown in Figure 2B. When increasing the thickness of the layer by dip-coating twice, the sheet resistance significantly dropped from 895 to 46 Ω sq−1. This drop in the sheet resistance could be ascribed to the uniformity of the overall layer produced by repetitive dip-coating. Further increasing the LSCF thickness by additional dip-coated layers decreased the sheet resistance from 46 to 3 Ω sq−1.
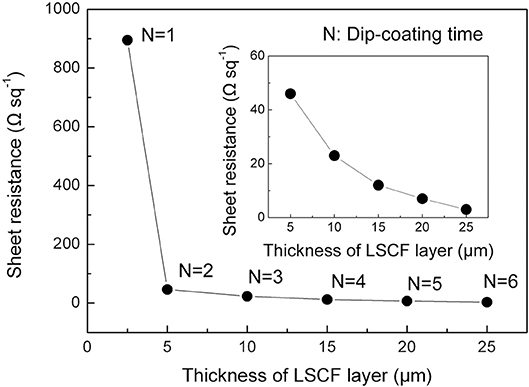
Figure 3. Sheet resistance of the LSCF cathode layer vs. thickness.
Electrochemical Performance
Electrochemical impedance spectra of the tubular single cells were measured at 800°C under the OCV condition. In the electrochemical impedance tests, several electrochemical processes, such as charge transfer, gas adsorption and dissociation, and gas diffusion in porous electrodes, can be overlapped with each other. In order to deconvolute electrochemical processes, the Distribution-Relaxation-Times (DTR) technique was used to analyze the measured impedance data (Ciucci and Chen, 2015; Wan et al., 2015). Figure 4 shows the typical distribution of resistances as a function of the frequency for the tubular single cells with different cathode thicknesses. Generally, two major peaks can be resolved in the frequency range 0.01 Hz −100 kHz. The high frequency peak was located at 4.3–7.4 Hz, while the low frequency peak was at 0.24–0.31 Hz. The results suggested two dominant electrode processes contributing to the overall electrode polarization in the tubular single cells.
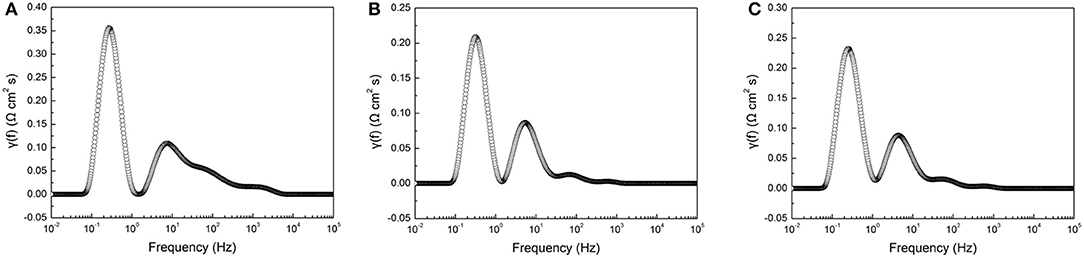
Figure 4. DRT curves obtained from electrochemical impedance spectra of single cells with different cathode layer thicknesses: (A) 5 μm, (B) 15 μm, and (C) 20 μm.
Based on the results obtained from the DRT analysis, the electrochemical impedance spectra of the tubular single cells were fitted by the LRohm(RHQH)(RLQL) equivalent circuit model. Figure 5 shows the corresponding Nyquist plots of the tubular single cells and a schematic diagram of the equivalent circuit model. L represents the inductive impedance response originating from the connecting wires and the measurement device. Rohm is the ohmic resistance of the single cell. The (RHQH)(RLQL) components refer to the electrode processes, where R is the resistance and Q is the constant phase element. The subscript H refers to the high frequency impedance response and L denotes the low frequency response. The equivalent capacitance C and relaxation frequency f corresponding to each electrode process are calculated by the following equations (Gourba et al., 2004; Chen D. et al., 2009):
where n is an exponential parameter, which can be determined from the electrochemical impedance spectra fitting. The values of the chi-squared function (χ) are on the order of 10−4 for all the impedance spectra fittings, indicating reliable fitting results in this work (Küngas et al., 2009). The area specific resistance of the single cell Rp is the sum of RH and RL. The electrochemical parameters obtained from the impedance spectra fittings are summarized in the Supplementary Material (Table S2). We found that the relaxation frequency data obtained from the impedance spectra fittings and DRT analyses (shown in Figure 4) were comparable. The similarity indicated the good reliability in both impedance spectra fittings and DRT analyses.
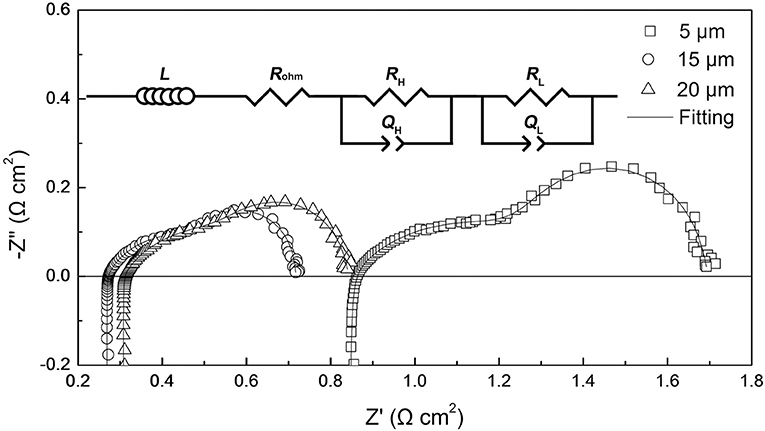
Figure 5. Nyquist plots of the tubular single cells at 800°C under the OCV condition.
Figure 6 shows ohmic and polarization resistances of the tubular single cells with the thickness of the cathode layer varying from 5 to 25 μm. When increasing the thickness of the cathode layer from 5 to 15 μm, the ohmic resistance (Rohm) of the tubular single cell displayed an evident decrease from 0.84 to 0.26 Ω cm2. Additionally, the area specific resistance (Rp) of the single cell presented a similar trend as well. The reduction of Rp values can be ascribed to the enhanced electrochemical process of the oxygen reduction with the thicker cathode up to 15 μm. On the other hand, increasing the thickness of the cathode beyond 15 μm resulted in a minor increment of the Rp value. Thus, the optimum cathode thickness was determined to be 15 μm based on the electrode polarization property.
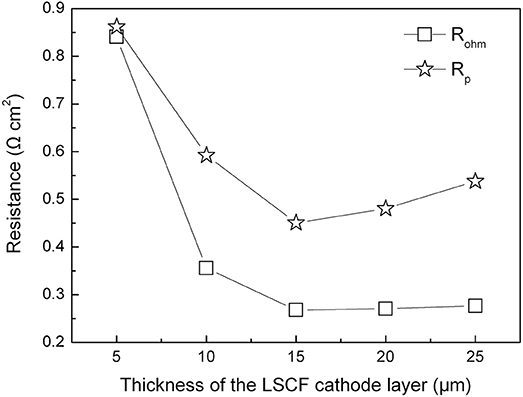
Figure 6. Ohmic and polarization resistances of the tubular single cells with different cathode thicknesses at 800°C.
Figure 7A shows cell voltage and power density curves of the tubular single cells as the function of current density at 800°C in dry hydrogen fuel. The OCV values of the single cells were ~1.04 V, being slightly lower than the theoretically predicted value (>1.10 V; Zha et al., 2001; Su et al., 2013). The lower OCV values could be ascribed to imperfect sealing and the minor short circuit originating from the thin YSZ/SDC bi-layer electrolyte layers in the cell. Figure 7B illustrates the variation of maximum power density of the tubular single cells with different cathode thicknesses. The maximum power density linearly increased from 224 to 559 mW cm−2 as the thickness of the cathode layer increased from 5 to 15 μm. Further increases in the thickness were not beneficial for improving maximum power density. Hence, the optimum thickness of the LSCF cathode layer was found to be 15 μm for the inert-substrate-supported tubular single cell, which agrees with the data obtained from electrochemical impedance data shown in Figures 5, 6.
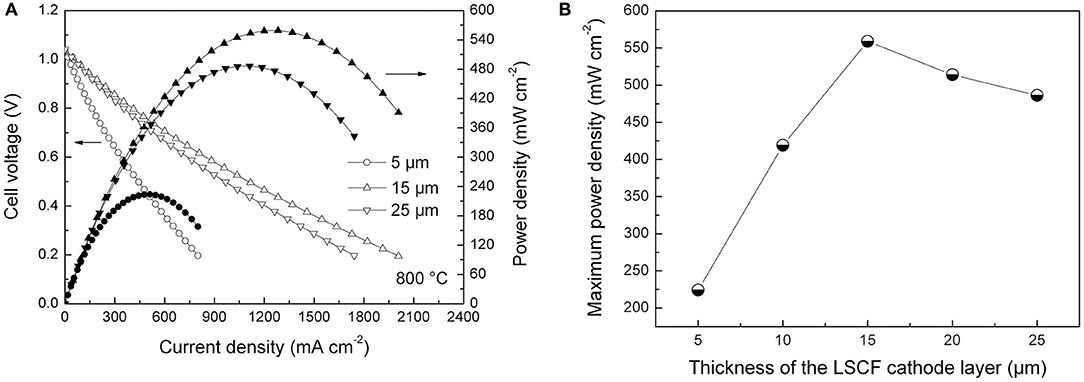
Figure 7. (A) Current-voltage curves of the single cells with different cathode thicknesses, and (B) Maximum power density of the single cells as the function of cathode thickness.
Thermal Cycling Stability
After the initial electrochemical performance investigation, we measured the thermal cycling performance of the tubular single cell between 800 and 25°C. Figure 8 shows the performance stability of the single cell with the optimum cathode thickness of 15 μm at the current density of 600 mA cm−2. The single cell could maintain 95% of its initial electrochemical performance within five thermal cycles, which is much improved compare with the conventional Ni-YSZ anode supported tubular cell (performance degradation is over 10% in two to three thermal cycles; Guan et al., 2011; Howe et al., 2013). The improved thermal cycling performance illustrates excellent mechanical compatibility between the different layers in the cell. The result suggests the advantage of the inert-substrate-supported tubular single cell for repeated startup and shut down power applications.
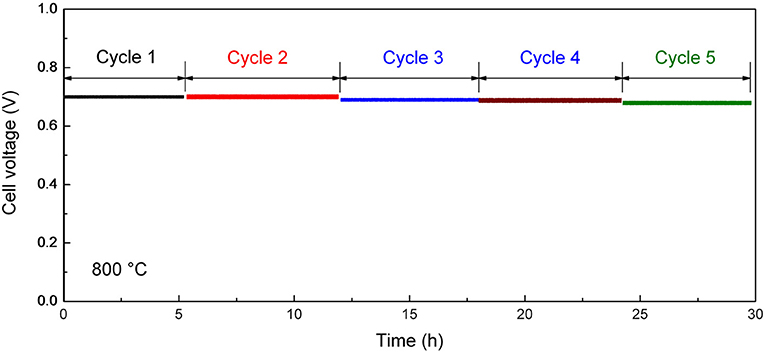
Figure 8. Thermal cycling performance of the tubular single cell at 600 mA cm−2 at 800°C.
Discussion
Microstructural Characterization
To investigate the effects of cathode microstructures on the electrochemical performance of the tubular single cells, we analyzed SEM images of the cathode layer by the image-analysis method (Iwanschitz et al., 2012). Figure 9 shows the average grain size, pore diameter and porosity of the cathode layer estimated by the Image-pro plus software. By changing the cathode thickness through repetitive dip-coating processes, the layer presented similar average grain size (0.9–1.0 μm), pore diameter (550–750 nm), and porosity (30–40%), respectively.
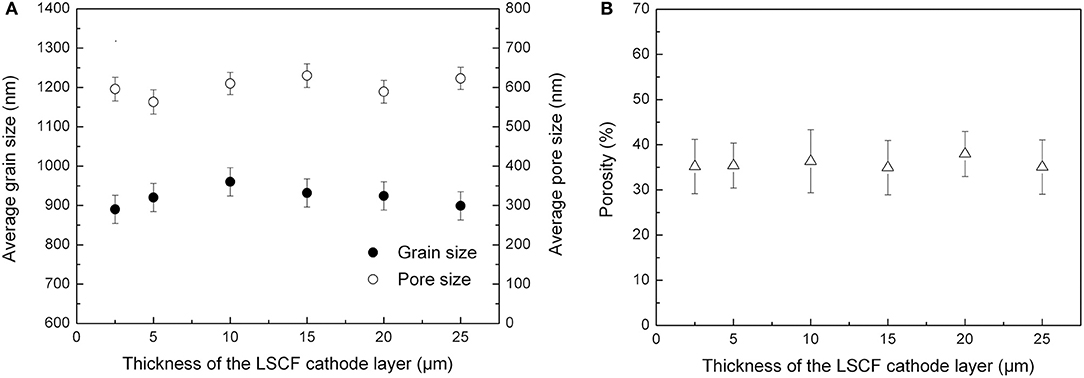
Figure 9. (A) Average grain size and pore diameter in the cathode layer, and (B) Porosity of the cathode.
The LSCF is widely recognized as an electronic-ionic mixed conducting cathode material. Hence, the electrochemical active region for oxygen reduction is extended out from the cathode/electrolyte interface (Adler et al., 1996; Lu et al., 2012). The range of the electrochemically active cathode region can be characterized by the length (lδ) beyond the cathode/electrolyte interface, which can be estimated by the oxygen transport properties of the cathode materials and microstructural features of the layer as described by the following equation (Endler-Schuck et al., 2015):
where ε is the porosity of the electrode, τ is the tortuosity of the electrode, α refers to the internal surface area per unit volume, and Lc is the ratio between the oxygen diffusion coefficient and the surface oxygen exchange coefficient of the LSCF cathode material.
Based on the microstructural parameters determined from SEM image analysis, the three-dimensional porosity (ε3d) of the cathode was calculated from the two-dimensional porosity (ε2d) by the following equation (Hoomans et al., 1996):
The value of the tortuosity τ was calculated according to an empirical equation (Yang et al., 2013):
The internal surface area per unit volume was determined by the following equation:
where the dav refers to the average grain size of the LSCF cathode.
According to the reported oxygen diffusion coefficient (8.06 × 10⁻⁶ cm2 s−1) and surface oxygen exchange coefficient (1.50 × 10⁻⁴ cm s−1) for the LSCF material at 800°C, the electrochemical active region (lδ) for oxygen reduction reaction at the cathode was calculated (Lane and Kilner, 2000). The detailed microstructural parameters are listed in the Supplementary Material (Table S3). According to this investigation, the electrochemically active region was determined to be ~8 μm for the LSCF cathode with the thickness between 10 and 25 μm.
Electrochemical Performance Investigation
Electrochemical impedance spectra of the tubular single cells were fitted by the LRohm(RHQH)(RLQL) equivalent circuit model. The fitting results are shown in Table S2 in the Supplementary Material. The equivalent capacitance and relaxation frequency for high frequency arcs are on the order of 10−1–10−2 F cm−2 and 100–101 Hz, respectively. The electrochemical processes associated with these high frequency arcs (RHQH) can be ascribed to the oxygen exchange process on the electrode surface (Escudero et al., 2007; Leonide et al., 2008). On the other hand, the equivalent capacitance and relaxation frequency for low frequency arcs are on the order of 100 F cm−2 and 10−1 Hz, respectively. The electrochemical process corresponding to these low frequency arcs (RLQL) can be ascribed to the oxygen diffusion process (Escudero et al., 2007; Philippeau et al., 2013).
As the anode and electrolyte structures of the tubular single cells were kept constant in this research, the variations of high and low frequency arcs could be ascribed to the cathode layer. As indicated in Table S2, the area specific resistance from the high frequency arc (RH) decreased by 50% (from 0.52 to 0.25 Ω cm2) when increasing the cathode thickness from 5 to 10 μm. This reduction of RH could be due to the enlarged electrochemical active region of the cathode for the surface oxygen reduction reaction. Further increasing the thickness beyond 10 μm, the RH showed a slightly increasing trend. The results illustrated that the surface oxygen reduction reaction was active within 10 μm from the cathode/electrolyte interface, which is in good agreement with the electrochemical active region (lδ: ~8 μm) determined by the microstructural analysis.
On the other hand, the area specific resistance from the low frequency arc (RL) decreased from 0.34 to 0.17 Ω cm2 by increasing the cathode thickness from 5 to 15 μm. The reduced RL could be due to the increased total surface area of the cathode for the oxygen adsorption process. However, increasing the cathode thickness beyond 15 μm tended to increase RL. For the single cells with the thicker cathode (>15 μm), the adsorbed oxygen has to diffuse through a longer path to the electrochemically active region, which could increase the value of RL (Hildenbrand et al., 2013). Additionally, thicker cathode layers would impede the diffusion of oxygen gas in the porous cathode, thus increasing the RL of the single cells. Considering the variations of RH and RL values as the function of cathode thickness, the optimum thickness was determined to be 15 μm for the LSCF layer. Thus, the single cell with this optimum thickness of the cathode layer showed the highest maximum power density of 559 mW cm−2 at 800°C in this work.
Conclusion
Inert-substrate-supported tubular single cells with multi-functional layers were fabricated by extrusion and slurry dip-coating processes. The microstructure of the LSCF cathode layer was modified by controlling the number of dip-coating steps in the cell fabrication procedure. The grain sizes (899–920 nm), pore diameters (563–623 nm) and porosities (35–38%) of the LSCF cathode were found to remain constant, while the thickness was increased from 2.5 to 25 μm. The electrochemical performance of the tubular single cells was examined with respect to the cathode thickness. Increasing the cathode thickness was found to lower the sheet resistance of the layer and ohmic resistance (Rohm) of the single cell. Generally, increasing the cathode thickness from 2.5 to 15 μm was beneficial for enhancing both the surface oxygen exchange process (RHQH) and oxygen diffusion and adsorption processes (RLQL). Further increasing the cathode thickness (>15 μm) induced higher area specific resistance originating from the slow diffusion process (RLQL). Thus, the optimum thickness of the LSCF cathode layer was determined to be 15 μm for the inert-substrate-supported tubular single cell. At 800°C, the tubular single cell with the optimum cathode thickness showed a high maximum power density of 559 mW cm−2 under the hydrogen/air operation mode. Additionally, the tubular single cell exhibited a good thermal cycling stability during five cycles between 800 and 25°C. The results illustrate advantages for future applications where the repeated startup and shut down condition mode is important.
Author Contributions
KZ carried most of the experimental work on the tubular single cell, and drafted the manuscript. B-HK advised KZ in designing the tubular single cell configuration and helped him test the electrochemical performance. MN discussed the experimental results with KZ and offered comments to improve the research. SH discussed the experimental results with KZ and offered advice in organizing the research manuscript.
Funding
This work was supported financially by the Office of Naval Research (Grant No. N00014-15-1-2416).
Conflict of Interest Statement
The authors declare that the research was conducted in the absence of any commercial or financial relationships that could be construed as a potential conflict of interest.
Supplementary Material
The Supplementary Material for this article can be found online at: https://www.frontiersin.org/articles/10.3389/fenrg.2018.00087/full#supplementary-material
References
Adler, S. B. (2004). Factors governing oxygen reduction in solid oxide fuel cell cathodes. Chem. Rev. 104, 4791–4844. doi: 10.1021/cr020724o
Adler, S. B., Lane, J. A., and Steele, B. C. H. (1996). Electrode kinetics of porous mixed-conducting oxygen electrodes. J. Electrochem. Soc. 143, 3554–3564. doi: 10.1149/1.1837252
Aruna, S. T., Muthuraman, M., and Patil, K. C. (1998). Synthesis and properties of Ni-YSZ cermet: anode material for solid oxide fuel cells. Solid State Ionics 111, 45–51. doi: 10.1016/S0167-2738(98)00187-8
Chen, D., Ran, R., Zhang, K., Wang, J., and Shao, Z. (2009). Intermediate-temperature electrochemical performance of a polycrystalline PrBaCo2O5+δ cathode on samarium-doped ceria electrolyte. J. Power Sources 188, 96–105. doi: 10.1016/j.jpowsour.2008.11.045
Chen, M., Kim, B. H., Xu, Q., Ahn, B. K., Kang, W. J., and Huang, D. P. (2009). Synthesis and electrical properties of Ce0.8Sm0.2O1.9 ceramics for IT-SOFC electrolytes by urea-combustion technique. Ceram. Int. 35, 1335–1343. doi: 10.1016/j.ceramint.2008.06.014
Chen, M., Kim, B. H., Xu, Q., Nam, O. J., and Ko, J. H. (2008). Synthesis and performances of N-SDC cermets for IT-SOFC anode. J. Eur. Ceram. Soc. 28, 2947–2953. doi: 10.1016/j.jeurceramsoc.2008.05.009
Ciucci, F., and Chen, C. (2015). Analysis of electrochemical impedance spectroscopy data using the distribution of relaxation times: a bayesian and hierarchical bayesian approach. Electrochim. Acta 167, 439–454. doi: 10.1016/j.electacta.2015.03.123
Eguchi, K. (1997). Ceramic materials containing rare earth oxides for solid oxide fuel cell. J. Alloys Compd. 250, 486–491. doi: 10.1016/S0925-8388(96)02629-1
Endler-Schuck, C., Joos, J., Niedrig, C., Weber, A., and Ivers-Tiffée, E. (2015). The chemical oxygen surface exchange and bulk diffusion coefficient determined by impedance spectroscopy of porous La0.58Sr0.4Co0.2Fe0.8O3−δ (LSCF) cathodes. Solid State Ionics 269, 67–79. doi: 10.1016/j.ssi.2014.11.018
Escudero, M. J., Aguadero, A., Alonso, J. A., and Daza, L. (2007). A kinetic study of oxygen reduction reaction on La2NiO4 cathodes by means of impedance spectroscopy. J. Electroanal. Chem. 611, 107–116. doi: 10.1016/j.jelechem.2007.08.006
Fu, C., Chan, S. H., Liu, Q., Ge, X., and Pasciak, G. (2010). Fabrication and evaluation of Ni-GDC composite anode prepared by aqueous-based tape casting method for low-temperature solid oxide fuel cell. Int. J. Hydrogen Energy 35, 301–307. doi: 10.1016/j.ijhydene.2009.09.101
Gong, M., Gemmen, R. S., and Liu, X. (2012). Modeling of oxygen reduction mechanism for 3PB and 2PB pathways at solid oxide fuel cell cathode from multi-step charge transfer. J. Power Sources 201, 204–218. doi: 10.1016/j.jpowsour.2011.11.002
Gostovic, D., Smith, J., Kundinger, D., Jones, K., and Wachsman, E. (2007). Three-dimensional reconstruction of porous LSCF cathodes. Electrochem. Solid-State Lett. 10, B214–B217. doi: 10.1149/1.2794672
Gourba, E., Briois, P., Ringuedé, A., Cassir, M., and Billard, A. (2004). Electrical properties of gadolinia-doped ceria thin films deposited by sputtering in view of SOFC application. J. Solid State Electrochem. 8, 633–637. doi: 10.1007/s10008-004-0503-3
Guan, Y., Gong, Y., Li, W., Gelb, J., Zhang, L., Liu, G., et al. (2011). Quantitative analysis of micro structural and conductivity evolution of Ni-YSZ anodes during thermal cycling based on nano-computed tomography. J. Power Sources 196, 10601–10605. doi: 10.1016/j.jpowsour.2011.08.083
Hayashi, H., Saitou, T., Maruyama, N., Inaba, H., Kawamura, K., and Mori, M. (2005). Thermal expansion coefficient of yttria stabilized zirconia for various yttria contents. Solid State Ionics 176, 613–619. doi: 10.1016/j.ssi.2004.08.021
Hildenbrand, N., Nammensma, P., Blank, D. H. A., Bouwmeester, H. J. M., and Boukamp, B. A. (2013). Influence of configuration and microstructure on performance of La2NiO4+δ intermediate-temperature solid oxide fuel cells cathodes. J. Power Sources 238, 442–453. doi: 10.1016/j.jpowsour.2013.03.192
Hoomans, B. P. B., Kuipers, J. A. M., Briels, W. J., and van Swaaij, W. P. M. (1996). Discrete particle simulation of bubble and slug formation in a two-dimensional gas-fluidised bed: a hard-sphere approach. Chem. Eng. Sci. 51, 99–118. doi: 10.1016/0009-2509(95)00271-5
Howe, K. S., Hanifi, A. R., Kendall, K., Zazulak, M., Etsell, T. H., and Sarkar, P. (2013). Performance of microtubular SOFCs with infiltrated electrodes under thermal cycling. Int. J. Hydrogen Energy 38, 1058–1067. doi: 10.1016/j.ijhydene.2012.10.098
Iwanschitz, B., Holzer, L., Mai, A., and Schütze, M. (2012). Nickel agglomeration in solid oxide fuel cells: the influence of temperature. Solid State Ionics 211, 69–73. doi: 10.1016/j.ssi.2012.01.015
Kirubakaran, A., Jain, S., and Nema, R. K. (2009). A review on fuel cell technologies and power electronic interface. Renew. Sust. Energ. Rev. 13, 2430–2440. doi: 10.1016/j.rser.2009.04.004
Küngas, R., Kivi, I., Lust, K., Nurk, G., and Lust, E. (2009). Statistical method to optimize the medium temperature solid oxide fuel cell electrode materials. J. Electroanal. Chem. 629, 94–101. doi: 10.1016/j.jelechem.2009.01.033
Lane, J. A., and Kilner, J. A. (2000). Measuring oxygen diffusion and oxygen surface exchange by conductivity relaxation. Solid State Ionics 136–137, 997–1001. doi: 10.1016/S0167-2738(00)00554-3
Leonide, A., Sonn, V., Weber, A., and Ivers-Tiffée, E. (2008). Evaluation and modeling of the cell resistance in anode-supported solid oxide fuel cells. J. Electrochem. Soc. 155, B36–B41. doi: 10.1149/1.2801372
Li, Y., Gemmen, R., and Liu, X. (2010). Oxygen reduction and transportation mechanisms in solid oxide fuel cell cathodes. J. Power Sources 195, 3345–3358. doi: 10.1016/j.jpowsour.2009.12.062
Lu, Z., Hardy, J., Templeton, J., and Stevenson, J. (2012). Extended reaction zone of La0.6Sr0.4Co0.2Fe0.8O3 cathode for solid oxide fuel cell. J. Power Sources 198, 90–94. doi: 10.1016/j.jpowsour.2011.09.020
Mineshige, A., Izutsu, J., Nakamura, M., Nigaki, K., Abe, J., Kobune, M., et al. (2005). Introduction of A-site deficiency into La0.6Sr0.4Co0.2Fe0.8O3−δ and its effect on structure and conductivity. Solid State Ionics 176, 1145–1149. doi: 10.1016/j.ssi.2004.11.021
Murata, K., Fukui, T., Abe, H., Naito, M., and Nogi, K. (2005). Morphology control of La(Sr)Fe(Co)O3−a cathodes for IT-SOFCs. J. Power Sources 145, 257–261. doi: 10.1016/j.jpowsour.2004.12.063
Orera, V. M., Laguna-Bercero, M. A., and Larrea, A. (2014). Fabrication methods and performance in fuel cell and steam electrolysis operation modes of small tubular solid oxide fuel cells: a review. Front. Energy Res. 2, 1–13. doi: 10.3389/fenrg.2014.00022
Perry Murray, E., Sever, M. J., and Barnett, S. A. (2002). Electrochemical performance of (La,Sr)(Co,Fe)O3-(Ce,Gd)O3 composite cathodes. Solid State Ionics 148, 27–34. doi: 10.1016/S0167-2738(02)00102-9
Philippeau, B., Mauvy, F., Mazataud, C., Fourcade, S., and Grenier, J. C. (2013). Comparative study of electrochemical properties of mixed conducting Ln2NiO4+δ (Ln = La, Pr and Nd) and La0.6Sr0.4Fe0.8Co0.2O3−δ as SOFC cathodes associated to Ce0.9Gd0.1O2−δ, La0.8Sr0.2Ga0.8Mg0.2O3−δ and La9Sr1Si6O26.5 electrolytes. Solid State Ionics 249–250, 17–25. doi: 10.1016/j.ssi.2013.06.009
Sameshima, S., Ichikawa, T., Kawaminami, M., and Hirata, Y. (1999). Thermal and mechanical properties of rare earth-doped ceria ceramics. Mater. Chem. Phys. 61, 31–35. doi: 10.1016/S0254-0584(99)00109-1
Sarantaridis, D., and Atkinson, A. (2007). Redox cycling of Ni-based solid oxide fuel cell anodes: a review. Fuel Cells 7, 246–258. doi: 10.1002/fuce.200600028
Shri Prakash, B., Senthil Kumar, S., and Aruna, S. T. (2014). Properties and development of Ni/YSZ as an anode material in solid oxide fuel cell: a review. Renew. Sust. Energ. Rev. 36, 149–179. doi: 10.1016/j.rser.2014.04.043
Singhal, S. C. (2012). “Solid oxide fuel cells: past, present and future,” in Solid Oxide Fuels Cells: Facts and Figures: Past Present and Future Perspectives for SOFC Technologies. London: Springer London, 1–23.
Stambouli, A. B., and Traversa, E. (2002). Solid oxide fuel cells (SOFCs): a review of an environmentally clean and efficient source of energy. Renew. Sust. Energ. Rev. 6, 433–455. doi: 10.1016/S1364-0321(02)00014-X
Su, C., Wang, W., Ran, R., Shao, Z., Tade, M. O., and Liu, S. (2013). Renewable acetic acid in combination with solid oxide fuel cells for sustainable clean electric power generation. J. Mater. Chem. A 1, 5620–5627. doi: 10.1039/c3ta10538e
Tikkanen, H., Suciu, C., Wærnhus, I., and Hoffmann, A. C. (2011). Dip-coating of 8YSZ nanopowder for SOFC applications. Ceram. Int. 37, 2869–2877. doi: 10.1016/j.ceramint.2011.05.006
Wan, T. H., Saccoccio, M., Chen, C., and Ciucci, F. (2015). Influence of the discretization methods on the distribution of relaxation times deconvolution: implementing radial basis functions with DRTtools. Electrochim. Acta 184, 483–499. doi: 10.1016/j.electacta.2015.09.097
Yakabe, H., Baba, Y., Sakurai, T., and Yoshitaka, Y. (2004). Evaluation of the residual stress for anode-supported SOFCs. J. Power Sources 135, 9–16. doi: 10.1016/j.jpowsour.2003.11.049
Yamaguchi, T., Suzuki, T., Shimizu, S., Fujishiro, Y., and Awano, M. (2007). Examination of wet coating and co-sintering technologies for micro-SOFCs fabrication. J. Memb. Sci. 300, 45–50. doi: 10.1016/j.memsci.2007.05.002
Yang, X. H., Lu, T. J., and Kim, T. (2013). A simplistic model for the tortuosity in two-phase close-celled porous media. J. Phys. D Appl. Phys. 46, 125305–125308. doi: 10.1088/0022-3727/46/12/125305
Zha, S. W., Xia, C. R., and Meng, G. Y. (2001). Calculation of the e.m.f. of solid oxide fuel cells. J. Appl. Electrochem. 31, 93–98. doi: 10.1023/a:1004138703860
Zhao, K., Kim, B. H., Du, Y., Xu, Q., and Ahn, B. G. (2016). Ceria catalyst for inert-substrate-supported tubular solid oxide fuel cells running on methane fuel. J. Power Sources 314, 10–17. doi: 10.1016/j.jpowsour.2016.02.079
Zhao, K., Kim, B. H., Xu, Q., and Ahn, B. G. (2014). Fabrication and characterization of inert-substrate-supported tubular single cells by dip-coating process. J. Power Sources 245, 671–677. doi: 10.1016/j.jpowsour.2013.07.022
Zhao, K., Lee, K. S., Chen, M., Kim, B. H., Xu, Q., and Ahn, B. G. (2013). Electrochemical performance of a copper-impregnated Ni-Ce0.8Sm0.2O1.9 anode running on methane. Int. J. Hydrogen Energy 38, 3750–3756. doi: 10.1016/j.ijhydene.2013.01.036
Keywords: cathode thickness, inert substrate supported tubular cell, sheet resistance, polarization, electrochemical performance, thermal cycling, tubular solid oxide fuel cell
Citation: Zhao K, Kim B-H, Norton MG and Ha SY (2018) Cathode Optimization for an Inert-Substrate-Supported Tubular Solid Oxide Fuel Cell. Front. Energy Res. 6:87. doi: 10.3389/fenrg.2018.00087
Received: 06 June 2018; Accepted: 13 August 2018;
Published: 31 August 2018.
Edited by:
Venkataraman Thangadurai, University of Calgary, CanadaReviewed by:
Stephen Skinner, Imperial College London, United KingdomDomingo Pérez-Coll, Consejo Superior de Investigaciones Científicas (CSIC), Spain
Copyright © 2018 Zhao, Kim, Norton and Ha. This is an open-access article distributed under the terms of the Creative Commons Attribution License (CC BY). The use, distribution or reproduction in other forums is permitted, provided the original author(s) and the copyright owner(s) are credited and that the original publication in this journal is cited, in accordance with accepted academic practice. No use, distribution or reproduction is permitted which does not comply with these terms.
*Correspondence: M. Grant Norton, bWdfbm9ydG9uQHdzdS5lZHU=
Su Y. Ha, c3VoYUB3c3UuZWR1