 Sarah E. Cotterill
 Jan Dolfing
 Thomas P. Curtis
 Elizabeth S. Heidrich
- School of Engineering, Newcastle University, Newcastle upon Tyne, United Kingdom
The formation of an electrochemically active biofilm is critical to the function of a Microbial Electrolysis Cell (MEC). We used Illumina 16S rDNA sequencing to analyse the formation and composition of anodic biofilms of two pilot-scale MECs, operated in continuous flow mode on domestic wastewater for over 6 months, and inoculated with that same wastewater. We observe: (i) a clear correlation between the frequency of detection of taxa in the MECs and their abundance in the metacommunity, (ii) the existence of a “core community” that was present across sites, and (iii) the percentage of Geobacter tended to increase with longevity of retention time of the wastewater in the reactor. This suggests that: (i) community composition was largely governed by stochastic processes, (ii) that the technology should work on most if not all domestic wastewaters, as long as the anodes are seeded with the target wastewater, and (iii) that deterministic factors may also play a role in establishing the anodic community. Geobacter, the archetypical electrogen in bioelectrochemical systems, comprised only 1.0 ± 0.7% of the sequences recovered from a functioning pilot-scale MEC anode. Our results imply that influent flow rate may need to be optimized separately for start-up and for operating conditions for maximal performance.
Introduction
Microbial Electrolysis Cells (MECs) have been promoted as an emerging technology that could change the energy balance of wastewater treatment (Foley et al., 2010; Escapa et al., 2016). MECs are essentially a biological battery, with specialized bacteria living in a biofilm on the anode. Biofilms are an ‘assemblage of bacterial cells, attached to a surface and enclosed in an adhesive matrix (Madigan et al., 2012) and are the most common growth mechanism for bacteria in nature. The enrichment of bacteria on an electrode to form an electrochemically active biofilm (EAB) is critical to the underlying process of an MEC (Ringelberg et al., 2011). In an MEC, bacteria in the EAB consume organic material in the wastewater, donating electrons to the anode, on which the EAB is formed, liberating protons in the process. The electrons travel in a circuit producing an electrical current, which can be used to produce electricity, or (with the protons released and an added potential) products at the cathode, such as hydrogen gas (Ditzig et al., 2007). Details of these types of fuel cells can be found in the literature (Logan, 2008; Scott and Yu, 2016).
Only a few species of bacteria are able to form an EAB (Chabert et al., 2015). Studies of the biofilms in MECs and Microbial Fuel Cells (MFCs), report a predominance of known exoelectrogenic genera, such as Geobacter and Shewanella (Holmes et al., 2004; Logan et al., 2005; Cusick et al., 2010; Kiely et al., 2011a), though the existence of other, as yet unknown, electrogens is a possibility. The microbial community of domestic wastewater, which is usually used as inoculum for MFCs and MECs is dominated by Bacteriodetes and Proteobacteria (Chabert et al., 2015), and effective exoelectrogenic genera are usually found in low numbers [as few as 0.6 cells per mL (Heidrich et al., 2016)].
Community assembly is an emerging topic in MEC research (Croese et al., 2013; Ruiz et al., 2013; Zhou et al., 2013; Ishii et al., 2014; Jiang et al., 2016), generating knowledge that can guide and optimize the start-up of MFCs and MECs. Understanding how an electrogenic community forms and importantly how it evolves with scale will be vital in the implementation of MECs, yet there are only a few studies of microbial anodes at scale, and fewer still on systems operated on real wastewaters. Oliot et al. compared the kinetics of acetate-fed microbial anodes, with projected surface areas of 9 and 50 cm2, and found a modest decline in performance with increasing scale (Oliot et al., 2017). This was partially attributed to differences in the biofilm development across the anode, due to variation in the local anode potential (Oliot et al., 2017). However, a loss of performance (in terms of current density) was not observed with increasing scale in pilot-scale MECs operated under “real-world” conditions (Cotterill et al., 2017). This may have been due to lower overall current densities recorded, and a high degree of variability (Cotterill et al., 2017). Additionally, there was a difference in the substrate used [acetate (Oliot et al., 2017) vs. wastewater (Cotterill et al., 2017)], and the size of the “scaled-up” anodes reported in these two studies [9–50 cm2 (Oliot et al., 2017) vs. 600–2,400 cm2 (Cotterill et al., 2017)]. While both are still far from the scale needed for wastewater treatment, the latter is more likely to provide insight that could inform a real world system.
The electrochemical design challenges of scaling-up MECs, including methanogenic competition and internal resistance, have been well-documented (Rozendal et al., 2008; Fornero et al., 2010; Logan, 2010), but there has been less attention given to understanding the effect of a large electrode surface area on the development of a productive electrogenic biofilm (Borole et al., 2011; Cotterill et al., 2017). This might be due to a lack of familiarity with the techniques available (or the value of information that can be obtained from them) or be due to a misappreciation for their applicability to the experimental design (Koch et al., 2017).
To understand MECs, we need to unpick the microbial ecology and the underlying patterns that determine their function. With an increase in the availability of sequencing data and computational power, researchers have begun to develop new ways to establish relationships between wastewater and MEC performance, beyond listing community composition, aiming to better understand the interactions and changes within a community with both time and scale.
One of these tools, is the neutral community model (NCM) (Sloan et al., 2006), based on the unified neutral theory of biodiversity (Hubbell, 2001). Neutral theory eschews traditional niche-based theory which assumes that communities are shaped by deterministic factors, such as competition, leading to the development of traits that provide a competitive advantage in the environments they inhabit. Instead, neutral theory assumes that bacteria have the same mean fitness, and thus stochastic factors (specifically births, deaths, and immigration) are the largest influencers in community assembly. The NCM (Sloan et al., 2006) was developed to mathematically depict neutral theory in microbial communities, and assumes that taxa in a system are sampled at random from a metacommunity. A community is an interacting group of species in a common location. Essentially, it is the living, or biological component, of an ecosystem. The metacommunity is defined as “a set of local communities that are linked by the dispersal of multiple, potentially interacting, species” (Battin et al., 2007). In theory, the metacommunity constitutes a pool of species capable of growing in an environment. In practice, the metacommunity can be observed by sampling many similar communities, since each local community is a sample of the metacommunity.
In an NCM, the presence or absence of a taxon (defined as a taxonomic group of any rank, such as a species, family, or class) within a source community is evaluated by comparison to its relative abundance within the metacommunity. If a sample has a low relative abundance in the metacommunity, yet is present in all the target (or sample) communities then it is may be overrepresented, i.e., it occurs more frequently than the model would predict. Conversely, if a taxon has a high relative abundance in the metacommunity, yet is absent in most of the target communities, then it may be underrepresented. If the presence of a taxon in the target community (i.e., the anode) is as the neutral model would predict, based on its relative abundance in the metacommunity, then it is said to be neutrally assembled, i.e., stochastic factors of birth, death and migration could account for the distribution of taxa. If it deviates substantially from the neutral model, then deterministic factors (i.e., a taxon's “fitness” for the environment) are thought to have played an important role in shaping the community.
Neutral theory has been successfully applied to systems as varied as the human lung microbiome (Venkataraman et al., 2015) and wastewater treatment plants (Ofiteru et al., 2010). The application to MEC could provide a framework to understand the complexity of these systems. Zhou et al. explored community assembly in MEC, finding stochastic processes dominant in determining both community structure and ecosystem function (Zhou et al., 2013). The insight gained from applying NCM to MEC may have implications for the design of reactors: allowing us to optimize reactor parameters to engineer or maintain a given population. This information becomes more powerful when we can combine it with estimations of microbial quantities and distribution.
Here, we analyzed the anodic biofilms of two pilot-scale MECs, operated in continuous flow mode on wastewater treatment sites with low temperatures, along with the community of the wastewater itself. The objectives were to (i) identify the bacterial communities in pilot-scale MECs, fed real wastewater for ≥6 months, through Illumina 16S rDNA sequencing, (ii) determine, through use of the NCM, the dominant processes underpinning community assembly, and (iii) compare spatial variation in both community composition and biofilm distribution within and across the anode surface with increased scale-up. The findings from these approaches were used to provide suggestions to improve design, start-up and operating conditions to optimize the biofilm in pilot-scale MEC.
Materials and Methods
MEC Materials and Configuration
Two MECs (MEC1 and MEC2) were constructed, based on a cassette-style design previously described by Heidrich (Heidrich et al., 2014), although MEC2 received modifications to the cathode, electrical connections and the frame of the module, as described in Cotterill et al. (2017). Schematic illustrations are given in previous publications. MEC1 was a 135 L PVC tank (dimensions 1.36 × 0.26 × 0.38 m) containing 10 separate modules that functioned individually. Each module was constructed from 10 mm PVC sheet giving an anodic liquid volume of 2.6 L. The modules included two carbon felt anodes (supplied by Olmec Advanced materials ltd, UK), of dimensions 300 × 200 × 10 mm. The total anode surface area to liquid volume ratio was 12 m2/m3. The carbon felt was encased by two sheets of stainless steel mesh, secured with bolts. The cathode was housed in a sealed chamber between the two anodes. The cathode was composed of 20 grams of 438 grade 1 stainless steel wool (Merlin Ltd, UK), and the cathode compartment was filled with 0.1 M NaCl. The electrodes were separated by a low cost microporous battery separator, Rhinohide, made of ultra-high molecular weight polyethylene (UHMWPE), routinely used in lithium-ion batteries.
MEC2 was a 45 L PVC tank containing three separate modules. Each anode surface area was 0.24 m2 (total 1.44 m2) and each cathode surface area was 0.20 m2 (total 0.6 m2). The cathode was comprised of a flat sheet of 316 stainless steel mesh (Patterson Ryan Wireworkers Ltd. UK), a tab (protruding from the module) to provide a direct electrical connection, and 80 grams of stainless steel wire wool (Merlin, UK), scaled-up proportionally from MEC1, due to the 4-fold increase in surface area, which was woven throughout the steel mesh. The cathode chamber, with 9 mm thick PVC frame, was sealed on both sides by a non-selective battery separator (as before, Entek, UK) and filled with 0.1 M NaCl, which had been autoclaved before use.
The catholyte was periodically replaced during operation, at monthly intervals. A tab design was also used for the stainless steel current collector at the anodes (Patterson Ryan Wireworkers Ltd., UK), reducing the number of wire connections needed. The anode material was graphite felt (supplied by SGL, Germany) dimensions 400 × 600 × 4.5 mm. The current collectors were secured tightly to both sides of the anode with cable ties. In both MECs, cathodic gas was captured into Tedlar™ gas bags (Sigma Aldrich, UK), through 3 mm ID Tygon F-4040 tubing (VWR International, UK).
MEC Operating Conditions
Both MECs were installed on operational sewage treatment works (STW) in the north east of England. They were operated in continuous flow mode for a period of 6 months (MEC1) and 8 months (MEC2). MEC1 was operated July–December 2014 on a STW with a small population equivalent (PE = 2,500), which created low and variable flows (15 ± 6 L/s) of primarily domestic and agricultural waste (with no industrial waste). A Watson Marlow 520S peristaltic pump drew raw domestic wastewater (prior to primary clarification) into MEC1 from the grit removal channel. After problems with clogging, wastewater was drawn into a header tank, which then fed from the clarifier at 75 mL/min. This resulted in a hydraulic retention time (HRT) of 24 h in MEC1.
MEC2 was installed in an unheated shipping container on a domestic STW with a PE of 24,581, a dry weather flow of 8,356 m3/d (97 L/s) and a full flow to treatment consent of 194 L/s. It was operated October 2015–May 2016. A small submersible pump drew settled wastewater into a header tank from a distribution chamber (used to distribute wastewater to the trickling filters) following primary settlement and dosing of sodium hydroxide. Sodium hydroxide was dosed on site to raise pH (to between pH 7 and 8.5) prior to the trickling filters. Adjustment of pH was required after ferric sulfate dosing for phosphorous removal. Sodium hydroxide is unlikely to have had a material effect on performance, as the measured pH (8.0 ± 0.3) and conductivity (812 ± 116 μS/cm) were routinely within the boundaries of un-dosed wastewater. A peristaltic pump (Watson Marlow 520S, UK) was used to pump the wastewater into MEC2 at a hydraulic retention time (HRT) of 5 h (304 min), equating to a pumping rate of 150 mL/min.
Wastewater left both MECs by gravity. An applied voltage of 1.2 V (MEC1) and 0.9 V (MEC2) was supplied by PSM 2/2A variable DC power supplies (Caltek Industrial Ltd., Hong Kong). No acetate or synthetic substrates were used to supplement the wastewater in either MEC. The anodes of both MECs were inoculated with local domestic wastewater (from each STW) upon start-up of the continuous flow mode. The wastewater from the two sites varied in; COD concentration (670 ± 370 mg/L in MEC1, 340 ± 200 mg/L in MEC2), conductivity (1.05 mS/cm in MEC1, 0.8 mS/cm in MEC2), temperature (16.2 ± 3°C in MEC1, 11.4 ± 3°C in MEC2), chemical dosing (none in MEC1, ferric sulfate and sodium hydroxide upstream of MEC2), and sulfate concentration (284 ± 41 mg/L in MEC1, 118 ± 18 mg/L in MEC2). Both MECs produced hydrogen gas for more than 100 days, with a purity of 98.4 ± 2.5% in MEC1, and 92.8 ± 7% in MEC2.
Sample Collection
Five liquid wastewater samples were taken at monthly intervals during the operation of MEC1 and analyzed via Illumina 16S rDNA sequencing. Biofilm samples were taken from the anodes of both MECs for DNA sequencing, scanning electron microscopy (SEM) and epifluorescence microscopy at the end of operation. A total of 72 anodic samples were taken for Illumina 16S rDNA sequencing: 48 samples from MEC1, including 24 from the front-facing and 24 samples from the rear-facing anode of the same module; and 24 samples from MEC2, including 12 samples from the front-facing and 12 samples from the rear-facing anode of the same module. Each 9.5 mm diameter sample (taken using a core-boring device) formed part of a transect of the top, middle and bottom of each anode, and was used to assess the heterogeneity of the community. Simultaneously, 16 samples were taken for SEM imaging from MEC1. These samples, taken using a 9.5 mm core-boring device, were immediately fixed in 2% glutaraldehyde in Sorenson's phosphate buffer and refrigerated overnight. Additionally, 12 sections were taken from MEC1 and MEC2 to visualize the biomass distribution across the anode. Sections of anode, measuring 3 cm2, and <1 mm thick, were cut with a sterile scalpel. Each sample was placed into a petri-dish and submerged with a nucleic acid stain, as described in SYBR Gold Staining and UV Visualization.
16S rDNA Sequencing
DNA was extracted from the 72 anode samples using a commercially available kit: BIO 101 FastDNA Spin Kit for soil (MP Biomedical, USA). The core-bored sample was added to a lysing matrix tube and the weight of each sample was recorded (0.26 g ± 0.11 for MEC1 and 0.14 g ± 0.05 for MEC2). The average weight was larger in MEC1, due to the use of a thicker graphite felt anode in MEC1 (10 mm) compared to MEC2 (4.6 mm). For the liquid wastewater samples, 250 μL of wastewater influent was added to each lysing matrix tube. The manufacturer's instructions were followed for cell lysis, DNA isolation and purification. Samples were eluted into 50 μL of DES (DNase/Pyrogen-Free Water) prior to PCR.
DNA extracts were shipped in safe-lock Eppendorf tubes to LGC Genomics (Berlin, Germany) for further processing. 16S rDNA genes were amplified by PCR with a 341F forward primer and 785R reverse primer pair. Samples were checked for size, after which a clean-up of the PCR products followed. Each PCR amplicon was quantified to calculate and create an equimolar pool. Quality control of the library preparation took place using an Agilent 2100 Bioanalyzer. The pooled sample library underwent paired-end sequencing (2 × 300 bp) on the Illumina MiSeq platform (V3 subunit) to produce up to 5 million paired-end reads. The FASTQ files were submitted to LGC Genomics' bioinformatics service for analysis of the bacterial and archeal community diversity.
Sequenced paired-end reads from the Illumina MiSeq V3 subunit were processed via LGC Genomics' bioinformatics service. Processing included inline barcode demultiplexing, clipping of sequencing adapters from 3′ ends of reads, and pre-processing of amplicons using Mothur 1.35.1 including filtering, denoising, taxonomic classification and creation of Operational Taxonomic Unit (OTU) tables. Following this, species level annotation was carried out using NCBI BLAST + 2.2.29 and sample diversity was analyzed using QIIME 1.9.0 (including both within-sample and between-sample diversity). Samples with a rarefaction depth of 32,417 were used to compare the biofilm within and between anodes. All statistical tests were carried out using IBM SPSS statistics 23 (IBM Corp. NY, USA).
Neutral Model Analyses
Using relative abundance data (from Illumina 16S rDNA sequencing), we applied the NCM method (Sloan et al., 2006) to determine whether community assembly could be attributed to stochastic processes. In Sloan's model, (i) species can be competitively advantaged or disadvantaged, and (ii) Hubbell's discrete model (Hubbell, 2001) is converted to a continuous diffusion equation, to allow the modeling of large population sizes (Sloan et al., 2006). The NCM employs the least-squares method to generate the best-fit distribution curve with two distribution parameters (Sloan et al., 2006). The number of individuals (NT) is typically assumed to be constant, and local deaths are replaced either by an immigrant, with probability m, or by a “birth” (growth) from one of the organisms already present in the community, with probability m-1. Local abundance is based on a function of relative abundance in the metacommunity and NTm.
Whilst the metacommunity cannot be quantified directly, a close representation could be achieved by collecting many samples over time. Each local community (e.g., a sample from an MEC anode) is a subset of the metacommunity, or pool of bacteria capable of growing in that environment (i.e., the MEC reactor). The relative abundance of taxa in the metacommunity was calculated as the proportion of the total number of sequences containing those taxa. The frequency of detection for taxa in the anodic biofilm was calculated as the proportion of the biofilm samples in which taxa were detected. For example, taxa detected in 19 out of 24 samples (e.g., Shewanellacae Figure 1B), would have a frequency of detection in that MEC of 0.792. For each taxon shared between the anodic biofilm and the metacommunity, a beta probability distribution was used to calculate the expected frequency of detection in the anode (shown as the black line in Figure 1). The variability around the expected detection frequency was calculated for each taxon, to allow the best-fit neutral model curve to be determined, and under or over represented taxa to be identified.
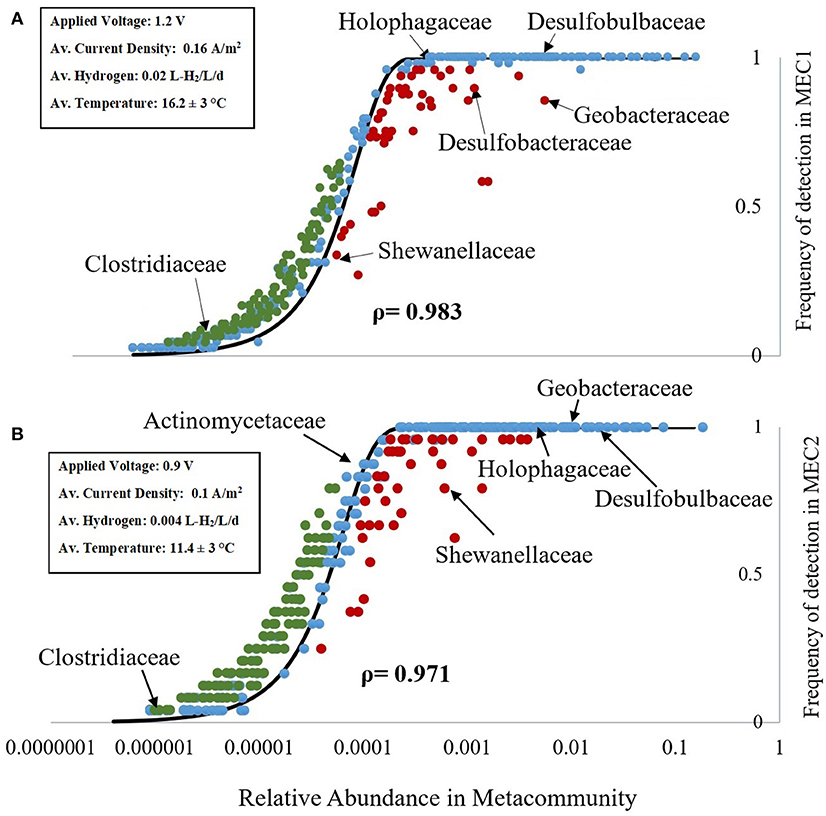
Figure 1. Mean relative abundance of taxa in the metacommunity vs. the frequency of detection in the anodes of MEC1 (A) and MEC2 (B). Blue dots represent taxa whose observed frequency of detection in the MEC samples aligns with the NCMs prediction (black line), based on their relative abundance in the metacommunity. Taxa observed more (or less) frequently in the MEC than would be predicted, based on their relative abundance in the metacommunity, are shown in green (and red), respectively. The NTm values were 18,091 for MEC1 (A), and 18,607 for MEC2 (B). Key families of anaerobic and electrogenic bacteria are labeled. Key operating conditions and performance data are highlighted in the inset box.
SYBR Gold Staining and UV Visualization
Twenty-four 3 cm2 sections of anode (12 from MEC1 and 12 from MEC2) were submerged in a SYBR gold staining solution (S11494, Life Technologies) in a petri dish and incubated for 30 min. SYBR gold is a sensitive fluorescent stain which binds to nucleic acids to enable the detection of double- or single-stranded DNA or RNA. It does not target individual species: all bacteria and archea in the sample will fluoresce upon binding with SYBR gold. The staining solution was prepared by adding 5 μL of 10,000 × SYBR gold stock solution per 50 mL PBS (50 mM). The Petri dish was covered in foil to prevent bleaching of the stain. After incubation, each sample was rinsed in fresh 50 mM PBS buffer, transferred to a clean Petri dish, and stored in foil. Each Petri dish was visualized inside a gel documentation system (iBOXR, UVP), where UV light (at 340 nm) was applied in epi-illumination mode and the emission was visualized using a band-pass filter (485–655 nm; Popescu, 2016).
Outputs were converted to 8-bit grayscale files. Using ImageJ software, the 8-bit files were converted to binary images, by adjusting the threshold of the image. This collapsed 256 levels of pixel intensity to just two levels: black (0) and white (255). Parts of the biofilm that picked up the stain were visualized as white, and parts which had not were visualized as black. The ratio of white pixels to black pixels was calculated, giving the percentage of the anode which had been stained. This is not an exact measurement of biofilm coverage, but a proxy for determining variation in biofilm distribution within an anode. Measurements are solely used to compare samples subject to the same preparation and visualization at the same time.
Results
Neutral Community Model
From the NCM (Figure 1) we can see whether taxa are neutrally assembled or whether selective pressures have promoted or discouraged their occurence in the MEC community. Taxa whose observed frequency of detection in the MEC (from 16S rDNA sequencing) aligns with the NCMs prediction (black line), based on their relative abundance in the metacommunity are shown as blue dots. Taxa observed more frequently in the MEC than would be predicted, based on their relative abundance in the metacommunity, are shown as green dots. Taxa observed less frequently in the MEC than would be predicted, based on their relative abundance in the metacommunity, are shown as red dots (Figure 1).
There were 438 family-level taxa plotted in the NCM for MEC1 and 405 family-level taxa plotted for MEC2. There was a very strong, positive Spearman's ρ correlation between the frequency of detection in the MEC and abundance in the metacommunity for both MEC1 [ρ(438) = 0.983, p = 0.000] and MEC2 [ρ(405) = 0.971, p = 0.000]. The NTm values were 18,091 for MEC1 (Figure 1A), and 18,607 for MEC2 (Figure 1B). The immigration probability (m) could not be calculated, as the number of individuals (NT) had not been previously determined by qPCR.
Taxa found more frequently than expected, such as Clostridiaceae (a family of obligate anaerobes including the genus Clostridium), may be enriched or good at migrating (the family contains spore formers). However, taxa that were found more frequently than expected were generally found in low abundance in the metacommunity (0.0001–0.0003%; Figure 1). The fit to the best-fit neutral model curve was best for taxa found in greater abundance in the metacommunity, such as Holophagaceae (a family containing the exoelectrogenic genus, Geothrix), with 0.05–0.5% relative abundance (Figure 1) and families of sulfur reducing bacteria (i.e., Desulfobulbaceae and Desulfobacteraceae), with 0.08–1.5% relative abundance. These bacteria are anaerobic and some of them are capable of exoelectrogenic activity.
Some families of electrogenic bacteria were less frequent than predicted from the metacommunity abundance (or more abundant than implied by their frequency) in both MECs. Shewanellaceae, the family containing the electrogenic genus Shewanella, was found less frequently in both MECs than would be expected based on relative abundance in the metacommunity (Figure 1). In MEC2, Shewanellaceae was detected in 19 out of 24 samples; 21% less frequently than would be predicted based on a relative abundance of 0.06% in the metacommunity. Geobacteraceae, a family containing the electrogenic genus Geobacter, was detected in all samples from MEC2 (frequency = 1), as predicted by the neutral model. A Spearman's ρ correlation analysis was run to determine if there was a relationship between the relative abundances of Geobacter and Shewanella. There was a possible, negative correlation between the two variables, but it was not statistically significant [ρ(23) = −0.41, p = 0.051]. In MEC1, Shewanellaceae was found in 16 out of 48 samples; four fewer samples (or 8% less) than would be expected based on its relative abundance in the metacommunity. Geobacteraceae, which was only present in 41 of 48 samples in MEC1, was detected 15% less frequently than would be predicted. Both MECs produced hydrogen gas throughout their operation. The 10 modules in MEC1 varied significantly in the amount of hydrogen produced; some modules produced no gas, and others produced up to 0.04 L-H2/L/d over 115 days of operation. The module that was sampled in this study, one of the higher performing modules in MEC1, produced ~ 0.3 L-H2/d (on average 0.02 L-H2/L/d) with a current density of 0.16 A/m2. MEC2 had a lower rate of hydrogen production (0.004 L-H2/L/d), and a lower current density (0.1 A/m2), however, it maintained performance for a longer duration of time. Additionally, an adjacent, larger MEC on site with MEC2 [reported in (Cotterill et al., 2017)], which was subject to the same start-up and operating conditions as MEC2 in this study, had a larger current density (0.29 A/m2), with a comparable hydrogen production rate (0.003 L-H2/L/d), although there were believed to be significant hydrogen losses from the MEC (Cotterill et al., 2017).
Enriched taxa typically have a competitive advantage in the anodic biofilm, or increased dispersal ability (meaning the distance taxa can move from the local community to a new population) relative to other microbes in the influent. Underrepresented taxa are either disadvantaged in the anodic biofilm, or have limited dispersal from the wastewater.
Analysis of the wastewater influent community, revealed that the relative abundance of electrogenic bacteria, such as Geobacter and Geothrix, were several orders of magnitude higher in both MECs than the wastewater. Geobacter was, on average, 80 × more abundant in the MEC anodes than the raw wastewater, and Geothrix was 30 × more abundant. Geobacteraceae, and Holophagacea (the families that contain Geobacter and Geothrix) were both neutrally assembled (Figure 1). Some methanogenic species were found more frequently in the anodes than the wastewater, but the methanogenic bacteria did not represent a large proportion of the anodic community: Methanobacteriales (<0.1% abundance), Methanosarcinales (<0.1% abundance) and Methanomicrobiales (<0.2% abundance).
Community Composition
Of the 1,247 genera identified after sequencing, 801 genera (64%) were common between the two pilot reactors, including: Clostridium, Geobacter, Desulfomicrobium, Desulfovibrio, Desulfobulbus, and Bacteroides. Transect data showed a high level of spatial variation in certain taxa at family level (Figure 2). Notably: Geobacteraceae was significantly more abundant in the bottom than the top (p = 0.016) or middle (p = 0.01; Figure 2). Desulfovibrionaceae was more abundant in the top of the anode than the middle (p = 0.016), or the bottom (p = 0.035). The depth of the anode was 30 cm in MEC1 (Figures 2A,B) and 40 cm in MEC2 (Figures 2C,D). A one-way ANOVA of unweighted UniFrac distance matrices from a principle coordinate analysis suggested between-group variation (i.e., between MEC1 and MEC2) was larger than within-group variation (i.e., variation between samples from MEC1) [F(2, 65) = 659.872, p = 0.000].
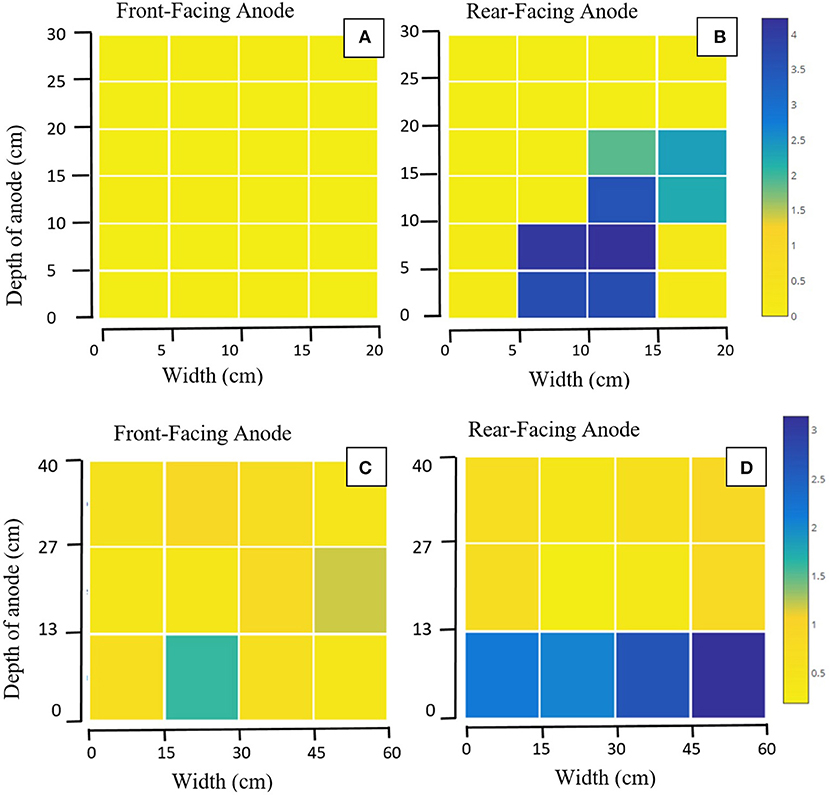
Figure 2. Heat maps showing the relative abundance (%) of Geobacteraceae from transect sampling across four anodes: (A) Front-facing anode of MEC1, (B) Rear-facing anode of MEC1, (C) Front-facing anode of MEC2, (D) Rear-facing anode of MEC2. Each square represents one sample taken: with 24 taken from each of (A,B), and 12 taken from each of (C,D). Axes show the distance in cm from the bottom left corner of the anode.
Community composition may have varied with HRT. The influent wastewater on the sites housing MEC1 and MEC2, with the highest flow rate (lowest HRT), had a community with the lowest proportional abundance of Geobacter, at 0.05 ± 0.03%. MEC2, which had a flow rate of 150 mL/min and an HRT of 5 h, had a 1 ± 0.7% proportional abundance of Geobacter. MEC1, which had a flow rate of 75 mL/min and an HRT of 24 h, had a 10 ± 8% relative abundance of Geobacter. This is consistent with the proportional abundance of Geobacter in Heidrich's pilot MEC (12 ± 11%) which was also operated with a 24 h HRT (Figure 3; Heidrich et al., 2014).
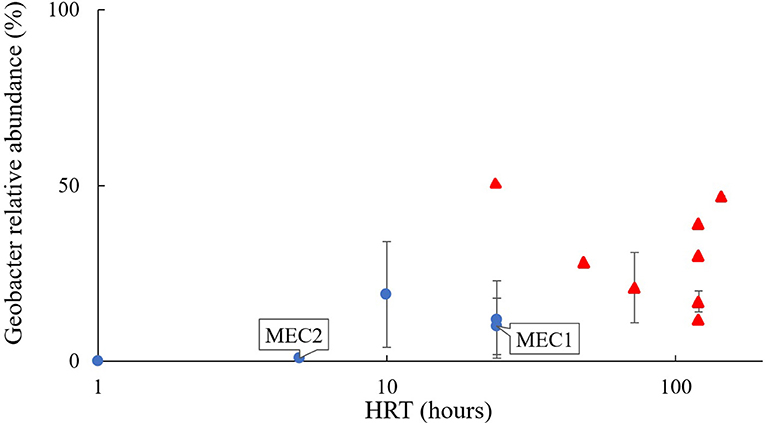
Figure 3. Proportion of Geobacter found in MEC anodes fed real wastewater, relative to the hydraulic retention time of the reactor. Blue dots, continuous flow; red triangles, batch-fed; References are given in Table 1.
Laboratory reactors batch-fed with wastewater (shown as red triangles in Figure 3) where “retention time” in the reactor is calculated as the number of days between feeds, or the batch cycle duration, had even higher proportional abundances of Geobacter: e.g., 21 ± 10% in wastewater-fed systems (Figure 3; Heidrich et al., 2018). References for Figure 3 are provided in Table 1.
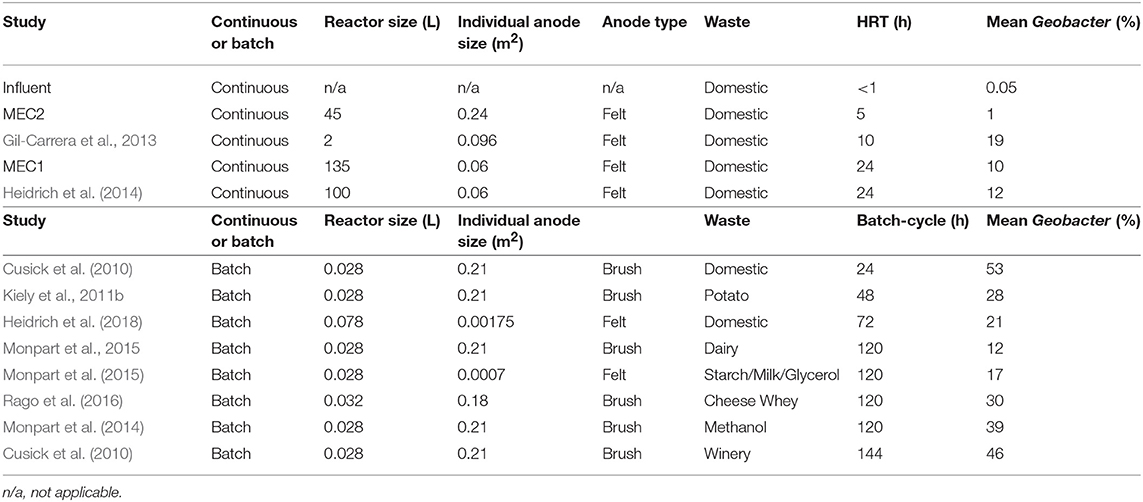
Table 1. Experimental conditions of the MEC anodes fed real wastewater shown in Figure 3.
Biofilm Distribution
Visualization of the SYBR gold-stained carbon felt samples showed the attachment of bacteria, and indicated a high level of spatial variability on one anode in MEC2 (Figure 4). The stain, which does not distinguish between live/dead bacteria or different species, adhered in small localized patches and was not uniform. The ratio of white to black pixels was calculated, by creating a binary image. In the front-facing anode (i.e., facing the flow of wastewater), on average, 5% (± 4) of the sample was stained (Figure 4). Coverage varied from 1% in the bottom right (Figure 4B), to 16.6% in the sample immediately left of this sample (Figure 4A). These samples were spaced 12 cm apart horizontally and were on the same vertical plane.
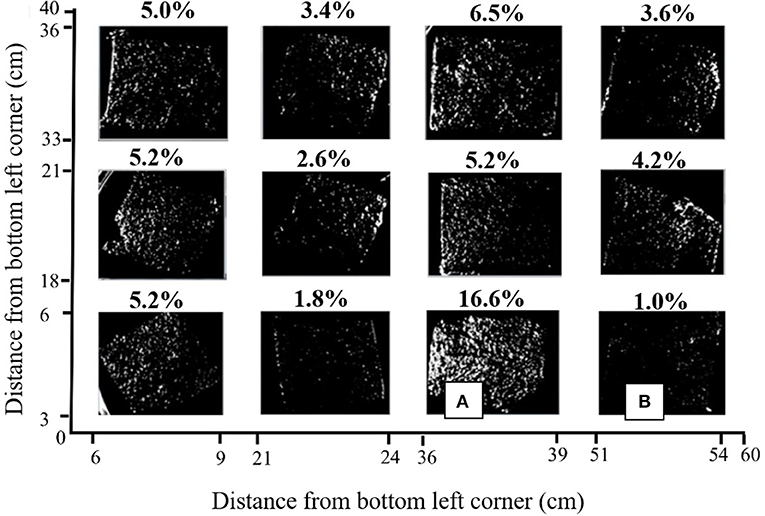
Figure 4. Binary image of SYBR gold stained anode from MEC2 visualized in an iBOX UVP gel documentation system under UV light at 340 nm. Axes indicate the positioning of each sample on the original 40 × 60 cm anode surface. The percentage of sample which was fluorescent is shown above each square. (A), The sample with the highest percentage of visible fluorescent stain, at 16.6%, (B), The sample with the lowest percentage of visible fluorescent stain at 1.0%.
Discussion
Community assembly is an emerging topic in MECs but, with few studies carried out at pilot-scale, our understanding of the effect of a large surface area on the development of a productive EAB is still limited. The composition of the anodic communities of two large-scale wastewater-fed MECs showed a good, though not perfect, fit to the neutral community model: a model that shows the extent to which taxa detected in the MEC community could be predicted based on their abundance in the metacommunity. We can therefore say with reasonable confidence, that stochastic processes (birth, deaths and immigration), have an important role in community assembly of MEC anodes.
Analysis of the NCM showed that many families containing electrogenic species were neutrally assembled. Electrogenic species, such as Geobacter, Shewanella, and Geothrix, are capable of donating electrons to an anode, and may be expected to be enriched by the environment in the MEC. Shewanellaceae was underrepresented in both MEC communities (i.e., found less frequently in the anode samples than would be expected). Geobacteraceae was underrepresented in MEC1, but it is important to note that not all members of Geobacteraceae are electrogenic [e.g., Pelobacter carbinolicus (Richter et al., 2007) and Geobacter bemidjiensis (Nevin et al., 2005)] and this may have influenced the results. The relatively low detection of Geobacteraceae (0.5–2%) and Shewanellacea (0.004–0.06%) in the metacommunity could be a consequence of poor amplification in the PCR process, (or preferential amplification of other taxa; Reysenbach et al., 1992). The accuracy of the NCM is therefore dependent on obtaining an accurate value for relative abundance in the metacommunity. A metagenomics approach (thus avoiding PCR) may strengthen the model's findings.
Community variation was statistically significant between the two sites, but we observed a common or “core” community (64% of genera identified were shared) between the reactors' anodic biofilms, which was comparable with previous findings at laboratory-scale with synthetic wastewater (Jiang et al., 2016). A core community is to be expected where stochastic processes are important and has now been observed several times, independently and with different inocula, in MEC. This is potentially significant for the implementation of MEC: it provides support that the technology will work on multiple sites, inoculated with wastewater of different compositions. Moreover, it implies that the extent of the core community can be modeled, predicted and possibly even manipulated using NCM providing the model parameters are known or can be predicted.
Factors, such as applied voltage and wastewater flow rate, may have also played a role in shaping distinct communities in similarly designed reactors either as deterministic ecological factors or by influencing the elements of the birth, death immigration process (for example by increasing the overall number of individuals). MEC1 had a higher purity of hydrogen gas (98.4 ± 2.5%) than MEC2 (92.8 ± 7%), and a higher current density (0.16 A/m2) than MEC2 (0.1 A/m2). This may be due to differences in microbial community, such as abundance of Geobacter, or abiotic factors, such as wastewater composition, temperature, and applied voltage, which varied significantly between the two sites. Although, studies have shown that substrate and electrode potential can affect electrogenic community composition (Torres et al., 2009; Kiely et al., 2011a; Ishii et al., 2014), so it may be difficult to identify a single causal element.
Zhou et al. found that species interactions, selection and priority effects may intensify the variation caused by stochastic processes (Zhou et al., 2013). Some form of competitive exclusion may have affected Shewanellaceae, which was underrepresented in both MEC communities. A slight, negative correlation [ρ(23) = −0.41, p = 0.051] was observed between Shewanella and Geobacter in MEC2. There is a small, but appreciable, chance (1/19.6) that this observation occurred randomly. However, given many members of the Geobacter and Shewanella genera are known to be electrogenic it seems likely that these bacteria are in competition. A larger study, or more detailed characterization of the bacteria, might solicit a more definitive result.
We observed a correlation between wastewater flow rate and relative abundance of Geobacter, an obligate anaerobe and one of the most frequently detected exoelectrogens. There are perhaps two underlying reasons for this. The first is that there is typically more dissolved oxygen in wastewater at higher flow rates (Li et al., 2008). Ieropoulous et al. suggest that MFC inoculated with aerobic wastewater contain a higher proportion of aerobic and facultative species, than would be found in an anaerobic inoculum ensuring that surplus oxygen is scavenged and performance is improved (Ieropoulos et al., 2010). Secondly, the complexity of the waste in a real-world system, requires other bacteria besides Geobacter to assist with the breakdown of organics to simple substrates, such as acetate. This does not mean waste is not degraded at shorter HRTs, rather that it may not be done via Geobacter at shorter HRTs. This finding has implications for reactor start-up at scale. There may be an advantage to starting up MECs with a longer HRT to enable the development of a productive EAB, before increasing the flow rate during operation.
The low relative abundance of Geobacter may be a limiting factor for MEC performance, or it may simply be a symptom of low hydrolysis rates and a lack of acetate, for example. The anodic samples showed a similar level of diversity as previously reported wastewater-fed reactors (Heidrich et al., 2018). There is conflicting data on the relationship between the percentage of Geobacter and MEC performance. Kiely et al. stated the importance of anodic Geobacteraceae populations on the performance of bioelectrochemical systems (Kiely et al., 2011a,b). Previous studies have shown microbial communities with high per-biomass electrogenic activity tend to contain a high relative abundance of known exoelectrogens, such as Geobacter and Desulfuromonas (Ishii et al., 2014). Yet, other studies have shown good power production (Patil et al., 2009) and H2 production (Heidrich et al., 2014) with little or no detection of Geobacter at the anode. Making use of more complex analyses, using microbial models and tools, may provide more clarity on the relationship between certain exoelectrogens, community compositions, and performance.
It is difficult to quantify the number of electrogens accurately: there is no universal “electrogen gene” (Heidrich et al., 2016) and methods to enumerate electrogens have limitations (Yang et al., 2016). Yang et al. found 1 × 10³-7.5 × 10⁵ electrogenic cells/mL suggesting 0.0006–0.5% cells in a wastewater sample are electrogens (Yang et al., 2016). Heidrich et al. found 17 exoelectrogenic cells/mL using MPN, and 1.6 × 10⁸ cells/mL in a direct cell count of wastewater using epifluorescence microscopy (Heidrich et al., 2016). This quantification suggests only 0.00001% of the cells in wastewater are viable electrogens capable of initiating current in reactors. In this study, proportional abundance of Geobacter was shown to be 1–2 orders of magnitude higher in both MEC1 and MEC2 than the wastewater influent, suggesting that effective electrogens are present in very low numbers in wastewater, but are more abundant within MECs.
Biofilm distribution (Figure 4), was shown to be heterogeneous across the anode. Furthermore, we observed different spatial distributions of taxa, such as Geobacter (Figure 2), across the anode, particularly with depth. Large-scale studies, of which there are few, provide an opportunity to study this spatial variation. SYBR gold is a non-targeted staining technique that allows for the detection of all single and double-stranded DNA in the sample. Therefore, the 5% coverage of the anode surface area, visible under UV, does not indicate the amount of electrogenic bacteria (as we do not have a targeted electrogenic stain), but provides an indication of the coverage of the bulk biofilm. It is unlikely that 5% is the maximum achievable coverage, since 16% coverage was observed in one portion of the anode. This indicates that the anode is not being colonized and used to its full potential. This is critical for two reasons: (i) addressing the uneven nature of the biofilm may be necessary to improve performance, and ensure effective treatment, and (ii) the anode is the most expensive part of an MEC [at 69% of the total cost (Cotterill et al., 2017)], and wastage, or misuse of the material, is likely to affect the economic viability of the technology.
It may be of interest to determine whether biofilm distribution is proportional to current density, as with biofilm thickness (He et al., 2011; Ishii et al., 2014) and biofilm growth (Ieropoulos et al., 2010). Ieropoulos et al. reported different uniformity in the biofilms of reactors inoculated with: a pure culture, G. sulfurreducens (obtaining the highest uniformity); mixed aerobic cultures (producing a good level of colonization) and mixed anaerobic cultures (providing the least uniform biofilm, dominated by “clumpy growth”; Ieropoulos et al., 2010). It is unknown how these clumps affect performance: they may support EAB, through the provision of products from fermentative bacteria (Chang et al., 2006) or they may inhibit electron transfer (Ieropoulos et al., 2010). Alternatively, this patchy distribution may be a consequence of a still-developing biofilm. Monitoring biofilm development over time may provide answers as to whether distribution is linked to maturity and/or performance.
Conclusions
In this study, the composition and formation of multiple pilot-scale MECs' anodic biofilms were evaluated. The neutral community model was supported, suggesting stochastic processes were responsible for a sizable fraction of the community assembly. However, stochastic factors alone may not explain all the variation observed in complex microbial communities, such as MECs. Many known electrogens are found at a low relative abundance in MECs; therefore, it will be important to determine if this is a natural limit of the system, or if it can be optimized.
We proposed a link between wastewater HRT and relative abundance of Geobacter. This finding may result in the selection of different influent flow rates for the start-up and stable phases of operation for maximal performance. We anticipated that the large surface area of the pilot-scale anodes may lead to spatially distinct communities. Sequencing revealed the presence of a core community (64% of genera identified were shared between MECs), but despite that, composition varied significantly with increasing anodic depth. Furthermore, fluorescence microscopy showed that biofilm adhesion to the anode was heterogenous. Further research may inform whether a more uniform biofilm can increase performance, through more efficient and complete use of the anodic surface area.
It is not practical, nor possible, for every new MEC experiment to apply advanced microbial ecology analyses (Koch et al., 2017), but we can explore options beyond just sequencing the community, to understand where environmental, operational and deterministic factors play a role (alongside stochastic processes) in shaping communities. If it is possible to “design” the microbial community to a set of specifications (e.g., with a more uniform biofilm, or with a greater proportion of Geobacter), our next questions should be what design will yield the best performance, and how do we achieve this for real-world applications.
Author Contributions
This work was carried out as part of the corresponding author's doctoral research, at Newcastle University, for which TC, JD, and EH were academic supervisors. Each of the four authors have contributed to the conception and design of the research, and the drafting and critical revision of the manuscript. All of the authors agree to be accountable for all aspects of the work.
Conflict of Interest Statement
The authors declare that the research was conducted in the absence of any commercial or financial relationships that could be construed as a potential conflict of interest.
Acknowledgments
The work was funded by the Engineering and Physical Sciences Research Council and Northumbrian Water, through a STREAM IDC engineering doctorate (EP/G037094/1). The authors would like to thank LGC Genomics for processing the microbial samples.
References
Battin, T. J., Sloan, W. T., Kjelleberg, S., Daims, H., Head, I. M., Curtis, T. P., et al. (2007). Microbial landscapes: new paths to biofilm research. Nat. Rev. Microbiol. 5, 76–81. doi: 10.1038/nrmicro1556
Borole, A. P., Reguera, G., Ringeisen, B., Wang, Z. W., Feng, Y., and Kim, B. H. (2011). Electroactive biofilms: currentzz status and future research needs. Energy Environ. Sci. 4, 4813–4834. doi: 10.1039/c1ee02511b
Chabert, N., Ali, O. A., and Achouak, W. (2015). All ecosystems potentially host electrogenic bacteria. Bioelectrochemistry 106, 88–96. doi: 10.1016/j.bioelechem.2015.07.004
Chang, I. S., Moon, H., Bretschger, O., Jang, J. K., Park, H. O., and Nealson, K. H. (2006). Electrochemically active bacteria (EAB) and mediator-less microbial fuel cells. J. Microbiol. Biotechnol. 16, 163–177. Available online at: http://www.jmb.or.kr/journal/download.php?Filedir=./submission/Journal/016/&num=2481
Cotterill, S. E., Dolfing, J., Jones, C., Curtis, T. P., and Heidrich, E. S. (2017). Low temperature domestic wastewater treatment in a microbial electrolysis cell with 1m2 anodes: towards system scale-up. Fuel Cells 17, 584–592. doi: 10.1002/fuce.201700034
Croese, E., Keesman, K. J., Widjaja-Greefkes, A. H., Geelhoed, J. S., Plugge, C. M., Sleutals, T. H. J. A., et al. (2013). Relating MEC population dynamics to anode performance from DGGE and electrical data. Syst. Appl. Microbiol. 36, 408–416. doi: 10.1016/j.syapm.2013.05.004
Cusick, R. D., Kiely, P. D., and Logan, B. E. (2010). A monetary comparison of energy recovered from microbial fuel cells and microbial electrolysis cells fed winery or domestic wastewaters. Int. J. Hydrogen Energy. 35, 8855–8861. doi: 10.1016/j.ijhydene.2010.06.077
Ditzig, J., Liu, H., and Logan, B. E. (2007). Production of hydrogen from domestic wastewater using a bioelectrochemically assisted microbial reactor (BEAMR). Int. J. Hydrogen Energy. 32, 2296–2304. doi: 10.1016/j.ijhydene.2007.02.035
Escapa, A., Mateos, R., Martinez, E. J., and Blanes, J. (2016). Microbial electrolysis cells: an emerging technology for wastewater treatment and energy recovery. From laboratory to pilot plant and beyond. Renew. Sust. Energy Rev. 55, 942–956. doi: 10.1016/j.rser.2015.11.029
Foley, J. M., Rozendal, R. A., Hertle, C. K., Lant, P. A., and Rabaey, K. (2010). Life cycle assessment of high-rate anaerobic treatment, microbial fuel cells, and microbial electrolysis cells. Environ. Sci. Technol. 44, 3629–3637. doi: 10.1021/es100125h
Fornero, J. J., Rosenbaum, M., and Angenent, L. T. (2010). Electric power generation from municipal, food, and animal wastewaters using microbial fuel cells. Electroanalysis 22, 832–843. doi: 10.1002/elan.200980011
Gil-Carrera, L., Escapa, A., Carracedo, B., Morán, A., and Gómez, X. (2013). Performance of a semi-pilot tubular microbial electrolysis cell (MEC) under several hydraulic retention times and applied voltages. Bioresour. Technol. 146, 63–69. doi: 10.1016/j.biortech.2013.07.020
He, G., Gu, Y., He, S., Schröder, U., Chen, S., and Hou, H. (2011). Effect of fiber diameter on the behavior of biofilm and anodic performance of fiber electrodes in microbial fuel cells. Bioresour. Technol. 102, 10763–10766. doi: 10.1016/j.biortech.2011.09.006
Heidrich, E. S., Curtis, T. P., Woodcock, S., and Dolfing, J. (2016). Quantification of effective exoelectrogens by most probable number (MPN) in a microbial fuel cell. Bioresour. Technol. 218, 27–30. doi: 10.1016/j.biortech.2016.06.066
Heidrich, E. S., Dolfing, J., Wade, M. J., Sloan, W. T., Quince, C., and Curtis, T. P. (2018). Temperature, inocula and substrate: contrasting electroactive consortia, diversity and performance in microbial fuel cells. Bioelectrochemistry 119, 43–50. doi: 10.1016/j.bioelechem.2017.07.006
Heidrich, E. S., Edwards, S. R., Dolfing, J., Cotterill, S. E., and Curtis, T. P. (2014). Performance of a pilot scale microbial electrolysis cell fed on domestic wastewater at ambient temperatures for a 12-month period. Bioresour. Technol. 173, 87–95. doi: 10.1016/j.biortech.2014.09.083
Holmes, D. E., Bond, D. R., O'Neil, R. A., Reimers, C. E., Tender, L. R., and Lovley, D. R. (2004). Microbial communities associated with electrodes harvesting electricity from a variety of aquatic sediments. Microb. Ecol. 48, 178–190. doi: 10.1007/s00248-003-0004-4
Hubbell, S. P. (2001). The Unified Neutral Theory of Biodiversity and Biogeography. Princeton, NJ: Princeton University Press.
Ieropoulos, I., Winfield, J., and Greenman, J. (2010). Effects of flow-rate, inoculum and time on the internal resistance of microbial fuel cells. Bioresour. Technol. 101, 3520–3525. doi: 10.1016/j.biortech.2009.12.108
Ishii, S., Suzuki, S., Norden-Krichmar, T. M., Phan, T., Wanger, G., Nealson, K. H., et al. (2014). Microbial population and functional dynamics associated with surface potential and carbon metabolism. ISME J. 8, 963–978. doi: 10.1038/ismej.2013.217
Jiang, X., Shen, J., Lou, S., Mu, Y., Wang, N., Han, W., et al. (2016). Comprehensive comparison of bacterial communities in a membrane-free bioelectrochemical system for removing different mononitrophenols from wastewater. Bioresour. Technol. 216, 645–652. doi: 10.1016/j.biortech.2016.06.005
Kiely, P. D., Cusick, R., Call, D. F., Selembo, P. A., Regan, J. M., and Logan, B. E. (2011b). Anode microbial communities produced by changing from microbial fuel cell to microbial electrolysis cell operation using two different wastewaters. Bioresour. Technol. 102, 388–394. doi: 10.1016/j.biortech.2010.05.019
Kiely, P. D., Regan, J. M., and Logan, B. E. (2011a). The electric picnic: synergistic requirements for exoelectrogenic microbial communities. Curr. Opin. Biotechnol. 22, 378–385. doi: 10.1016/j.copbio.2011.03.003
Koch, C., Korth, B., and Harnisch, F. (2017). Microbial ecology-based engineering of microbial electrochemical technologies. Microb. Biotechnol. 11, 22–38. doi: 10.1111/1751-7915.12802
Li, Z., Yao, L., Kong, L., and Liu, H. (2008). Electricity generation using a baffled microbial fuel cell convenient for stacking. Bioresour. Technol. 99, 1650–1655. doi: 10.1016/j.biortech.2007.04.003
Logan, B. E. (2008). Microbial Fuel Cells. Hoboken, NJ: John Wiley & Sons, Inc. doi: 10.1002/9780470258590
Logan, B. E. (2010). “Materials for BES,” in Bioelectrochemical Systems: From Extracellular Electron Transfer to Biotechnological Application, eds K. Rabaey, L. Angenent, U. Schroder, and J. Keller (London: IWA Publishing), 185–201.
Logan, B. E., Murano, C., Scott, K., Gray, N. D., and Head, I. M. (2005). Electricity generation from cysteine in a microbial fuel cell. Water Res. 39, 942–952. doi: 10.1016/j.watres.2004.11.019
Madigan, M. T., Martinko, J. M., Stahl, D. A., and Clark, D. P. (2012). Brock Biology of Microorganisms, 13th Edn. Boston, MA: Pearson Education, Inc.
Monpart, N., Rago, L., Baeza, J. A., and Guisasola, A. (2015). Hydrogen production in single chamber microbial electrolysis cells with different complex substrates. Water Res. 68, 601–615. doi: 10.1016/j.watres.2014.10.026
Monpart, N., Ribot-Llobet, E., Garlapati, V. K., Rago, L., Baeza, J., and Guisasola, A. (2014). Methanol opportunities for electricity and hydrogen production in bioelectrochemical systems. Int. J. Hydrogen Energy 39, 770–777. doi: 10.1016/j.ijhydene.2013.10.151
Nevin, K. P., Holmes, D. E., Woodard, T. L., Hinlein, E. S., Ostendorf, D. W., and Lovley, D. R. (2005). Geobacter bemidjiensis sp. nov. and Geobacter psychrophilus sp. nov., two novel Fe(III)-reducing subsurface isolates. Int. J. Syst. Evol. Microbiol. 55, 1667–1674. doi: 10.1099/ijs.0.63417-0
Ofiteru, I. D., Lunn, M., Curtis, T. P., Wells, G. F., Criddle, C. S., Francis, C. A., et al. (2010). Combined niche and neutral effects in a microbial wastewater treatment community. Proc. Natl. Acad. Sci. U.S.A. 107, 15345–15350. doi: 10.1073/pnas.1000604107
Oliot, M., Chong, P., Erable, B., and Bergel, A. (2017). Influence of the electrode size on microbial anode performance. Chem. Eng. J. 327, 218–227. doi: 10.1016/j.cej.2017.06.044
Patil, S. A., Surakasi, V. P., Koul, S., Ijumulwar, S., Vivek, A., Shouche, Y. S., et al. (2009). Electricity generation using chocolate industry wastewater and its treatment in activated sludge based microbial fuel cell and analysis of developed microbial community in the anode chamber. Bioresour. Technol. 100, 5132–5139. doi: 10.1016/j.biortech.2009.05.041
Popescu, D. M. (2016). Imaging Biomass Distribution on Electrodes. An Investigation of Bacterial Composition and Biofilm Structure. Ph.D. thesis, Newcastle University.
Rago, L., Baeza, J. A., and Guisasola, A. (2016). Bioelectrochemical hydrogen production with cheese whey as sole substrate. J. Chem. Technol. Biotechnol. 92, 173–179. doi: 10.1002/jctb.4987
Reysenbach, A. L., Giver, L. J., Wickham, G. S., and Pace, N. R. (1992). Differential amplification of rRNA genes by polymerase chain reaction. Appl. Environ. Microbiol. 58, 3417–3418.
Richter, H., Lanthier, M., Nevin, K. P., and Lovley, D. R. (2007). Lack of electricity production by pelobacter carbinolicus indicates that the capacity for Fe(III) Oxide reduction does not necessarily confer electron transfer ability to fuel cell anode. Appl. Environ. Microbiol. 73, 5347–5353. doi: 10.1128/AEM.00804-07
Ringelberg, D. B., Foley, K. L., and Reynolds, C. M. (2011). Electrogenic capacity and community composition of anodic biofilms in soil-based bioelectrochemical systems. Appl. Microbiol. Technol. 90, 1805–1815. doi: 10.1007/s00253-011-3264-9
Rozendal, R. A., Hamelers, H. V. M., Rabaey, K., Keller, J., and Buisman, C. J. (2008). Towards practical implementation of bioelectrochemical wastewater treatment. Trends Biotechnol. 26, 450–459. doi: 10.1016/j.tibtech.2008.04.008
Ruiz, Y., Baeza, J. A., and Guisasola, A. (2013). Revealing the proliferation of hydrogen scavengers in a single-chamber microbial electrolysis cell using electron balances. Int. J. Hydrogen Energy 38, 15917–15927. doi: 10.1016/j.ijhydene.2013.10.034
Scott, K., and Yu, E. H. (2016). Microbial Electrochemical and Fuel Cells: Fundamentals and Applications. Cambridge, UK: Woodhead Publishing.
Sloan, W. T., Lunn, M., Woodcock, S., Head, I. M., Nee, S., and Curtis, T. P. (2006). Quantifying the roles of immigration and chance in shaping prokaryote community structure. Environ. Microbiol. 8, 732–740. doi: 10.1111/j.1462-2920.2005.00956.x
Torres, C. I., Krajmalnik-Brown, R., Parameswaran, P., Marcus, A. K., Wanger, G., Gorby, Y. A., et al. (2009). Selecting anode-respiring bacteria based on anode potential: phylogenetic, electrochemical, and microscopic characterization. Environ. Sci. Technol. 43, 9519–9524. doi: 10.1021/es902165y
Venkataraman, A., Bassis, C. M., Beck, J. M., Young, V. B., Curtis, J. L., Huffnagle, G. B., et al. (2015). Application of a neutral community model to assess structuring of the human lung microbiome. mBio 6:e02284–14. doi: 10.1128/mBio.02284-14
Yang, Z. C., Cheng, Y. Y., Zhang, F., Li, B. B., Mu, Y., Li, W. W., et al. (2016). Rapid detection and enumeration of exoelectrogenic bacteria in lake sediments and a wastewater treatment plant using a coupled WO3 nanoclusters and most probable number method. Environ. Sci. Technol. Lett. 3, 133–137. doi: 10.1021/acs.estlett.6b00112
Keywords: community assembly, rDNA sequencing, microbial electrolysis cell, neutral community model, wastewater
Citation: Cotterill SE, Dolfing J, Curtis TP and Heidrich ES (2018) Community Assembly in Wastewater-Fed Pilot-Scale Microbial Electrolysis Cells. Front. Energy Res. 6:98. doi: 10.3389/fenrg.2018.00098
Received: 28 June 2018; Accepted: 04 September 2018;
Published: 25 September 2018.
Edited by:
Vânia Oliveira, Faculdade de Engenharia, Universidade do Porto, PortugalReviewed by:
Hiroshige Matsumoto, Kyushu University, JapanDeepak Pant, Flemish Institute for Technological Research, Belgium
Copyright © 2018 Cotterill, Dolfing, Curtis and Heidrich. This is an open-access article distributed under the terms of the Creative Commons Attribution License (CC BY). The use, distribution or reproduction in other forums is permitted, provided the original author(s) and the copyright owner(s) are credited and that the original publication in this journal is cited, in accordance with accepted academic practice. No use, distribution or reproduction is permitted which does not comply with these terms.
*Correspondence: Sarah E. Cotterill, c2FyYWguY290dGVyaWxsM0BnbWFpbC5jb20=