 Xuning Feng
 Siqi Zheng1
 Xiangming He
 Li Wang
- 1Institute of Nuclear and New Energy Technology, Tsinghua University, Beijing, China
- 2State Key Laboratory of Automotive Safety and Energy, Tsinghua University, Beijing, China
Thermal runaway is one of the key failure reasons for the lithium-ion batteries. The potential of thermal runaway in applications increases when the industry starts to use high energy LiNixCoyMnzO2 cathode. The thermal runaway mechanism is still unclear, because the side reactions are complex. Heat generation during thermal runaway can be caused by the decomposition of individual cell components, or by interactive reactions between multiple components. This paper tries to comb the heat sources during thermal runaway using a novel method named the “Time Sequence Map” (TSM). The TSM tracks the heat sources according to the notion of thermodynamic systems. The thermodynamic system means a combination of materials that stay and react together, and generate heat independently without interruptions from other thermodynamic systems. With the help of the defined thermodynamic systems, researchers will be rescued from being trapped in the complex reactions, and the heat sources during thermal runaway can be clearly explained from bottom up. The thermal runaway results for two battery samples demonstrate the validity of the TSM. The TSM shows the heat sources including that: (1) fire, (2) internal short circuit, (3) oxidation-reduction reaction between the cathode and anode, etc. The contributions for the heat sources to the thermal runaway are further discussed. Conclusions come to: (1) the major heat source is the oxidation-reduction reaction; (2) the fire releases lots of heat, but most of the heat is not to heat the cell itself; (3) the internal short circuit is critical to trigger the oxidation-reduction reaction; (4) the internal short circuit is not the major heat source that heat the cell to 800°C or higher; (5) the oxidation-reduction reaction is triggered when the temperature reaches a critical temperature. The TSM helps depict the frontiers in the researches of battery thermal runaway. It suggests that we focus on: (1) the relationship between internal short circuit and thermal runaway; (2) the mechanism of the oxidation-reduction reaction between the cathode and anode; (3) the detailed reaction mechanisms for a specific thermodynamic system within the cell.
Introduction
Electrochemical energy storage system (EESS) is one of the heart components of the clean energy systems in the future, because the EESS can help regulate the intermittent power output by the renewable energy sources (Zhang, 2013). Lithium-ion battery, given its high energy density and extended life time, is a promising choice for the EESS (Feng et al., 2012; Ji et al., 2015; Kong et al., 2018). The application in transportation systems (Ouyang et al., 2016; Lai et al., 2018; Zheng Y. et al., 2018) and electronic devices (Duh et al., 2018; Zhang et al., 2018; Zhu et al., 2018) require compact design of an EESS, thereby proposing demand of higher energy density for the lithium-ion batteries (Zeng et al., 2018). The target of energy density for the lithium-ion batteries is 300 Wh·kg−1 in the “Made in China 2025” project funded by the Chinese State Council and the “Strategic Priority Research Program” funded by the Chinese Academy of Sciences (Liang et al., 2016). The lithium vanadium phosphate (Mao et al., 2015) or the lithium manganese rich cathode (Yan et al., 2015) might be promising to fulfill the target. However, due to their limited cycle life, the massive applications of them are still far away. A more favorable roadmap is to use cathode with ternary oxide LiMO2 (M can be Ni, Co, Mn, or Al, etc.) and anode with silicon additions (Feng et al., 2018a; Vitoux et al., 2018). The cathode with Ni rich ternary oxide LiMO2 has higher energy density among others, but Ni rich cathodes usually have poorer thermal stabilities (Noh et al., 2013). Accidents emerge as the cell with LiMO2 cathode starts to substitute the cell with LiFePO4 cathode in the transportation and electronics (Feng et al., 2018b). The customers are fearing about the smoke, fire, and explosion (Huang et al., 2015) that accompany with the battery failures, therefore the safety issues of high energy lithium-ion batteries are arousing more and more attentions in recent years (Feng et al., 2016a, 2018c,d; Guo et al., 2016; Huang et al., 2016; Wu et al., 2018).
Thermal runaway (TR) is the root cause of the hazards that occur during battery accidents. Wang et al. (2012) proposes that the essence of the battery TR should be a moment when the exothermic reaction goes out of control, that is the reaction rate increases due to an increase in temperature causing a further increase in temperature and hence a further increase in the reaction rate. Feng et al. (2018a) advances the definition of battery TR to the Heat-Temperature-Reaction (HTR) loop. The HTR loop always exists for lithium-ion battery when it is exposed to extreme temperature. The TR occurs once the HTR loop goes out of control.
Conducting a successful battery TR research should consider five key factors:
Key Factor 1: How to trigger a TR?–The way to trigger TR.
Key Factor 2: How to characterize the phenomenon-during tests?–The technique for TR characterization.
Key Factor 3: How to interpret the TR mechanisms behind the observations?–The methodology for mechanism interpretation.
Key Factor 4: How to quantify the TR process by a mathematical model?–The establishment of a good TR model that can capture the underlying mechanisms.
Key Factor 5: How to reduce the TR hazard in cell and system design in application?–The model-based battery safety design considering the TR hazards.
For the key factor 1, the core thing is to heat the cell to extreme temperature higher than 80°C or even higher, until the HTR loop runs out of control. Heating a battery can be fulfilled by oven-box heating (Dahn et al., 2013), penetration (Feng et al., 2015a; Mao et al., 2018), overcharge (Ouyang et al., 2015; Ren et al., 2017; Qi et al., 2018), power heater (Coman et al., 2017a; Gao et al., 2017), etc.
For the key factor 2, calorimetric instruments can help quantify the heat generation during the HTR loop, thereby benefiting studying the TR mechanisms. The common utilization of a calorimetry includes: the accelerating rate calorimetry (ARC) (Feng et al., 2014a,b); the differential scanning calorimetry (DSC) (Zheng S. et al., 2018); the C80 micro calorimetry (Ping et al., 2014); the cone calorimetry (Ping et al., 2018); other self-made calorimetry (Chen et al., 2016; Liu et al., 2017) etc.
For the key factor 4, the TR model is always built by chemical reactions using Arrhenius Equations. Hatchard et al. (2001) built the first TR model, which is propagated by Spotnitz and Franklin (2003), further extended to 3D simulations by Kim et al. (2007), and followed by others (Peng and Jiang, 2015; Coman et al., 2017b; Abada et al., 2018). Recent years the TR model is evolving to not only predict the temperature, but also the voltage, called as the electrochemical-thermal coupled TR model (Lee et al., 2015; Melcher et al., 2016; Ping et al., 2017). The accuracy of the TR model is being improved by considering gas venting (Coman et al., 2016, 2017c) and aging effects (Abada et al., 2018; Ren et al., 2018b). Most of the parameters used in those papers are similar, in other words the TR model has been inherited for nearly 20 years. Actually, the kinetic parameters in the Arrhenius Equations can be acquired from calorimetric tests. Ping et al. proposed a deconvolution method to acquire the pre-order factor and activation energy in the Arrhenius Equations (Ping et al., 2014). A classical approach for calibrating the kinetic parameters of the Arrhenius Equations is the Kissenger's method in the chemical dynamic theory (Wang et al., 2011). Practice succeeded in Ren's (Ren et al., 2018a) work, therefore the kinetic parameters of the chemical reactions can be measured by experiments, no longer needing to be inherited from the Hatchard's model.
For the key factor 5, model-based safety design is an attracting technology arousing concerns from industry. Safety design at system level is the major application of the TR models built in key factor 4. The TR model is modified with heat transfer functions for simulating the TR propagation in a battery system (Feng et al., 2015b, 2016b). High precision prediction of the TR propagation process in system level requires accurate setting of the boundary conditions of heat transfer and a TR model with adequate accuracy. Sometimes the chemical kinetics can be simplified by lookup tables in the propagation simulation (Yeow and Teng, 2013; Chen et al., 2015). Those kinds of model-based TR propagation simulation help optimize the safety design of a battery pack, significantly reducing the TR hazard in the system level, and enhancing the efficiency of correlated research and development. However, model-based safety design of a battery cell is rarely seen up to now, to the best knowledge of the authors. The researchers of materials have switched to new cell chemistries, which can bring them more reputations in paper publications, but left the practical problem of TR of lithium-ion batteries for the engineers. The target of model-based safety design at cell level still cannot be fulfilled, because the TR model still cannot reflect all the key physical and chemical processes. This is caused by the lack of researches on the key factor 3, which bridges the gap between key factor 2 and key factor 4.
For the key factor 3, we are still lacking strong weapons for interpreting the TR mechanisms from test observations. Generally, a good approach for interpreting the complex reaction mechanisms can comb the relationships between different physical and chemical processes. The Semenov Diagram is a mature technique in analyzing the controllability of heat generations (Samba et al., 2014). The Semenov Diagram can also help reveal the reaction mechanisms of battery TR. For a quantified analysis of TR mechanisms, the Semenov Diagram must work with an accurate battery TR model, which forms a logic loop here. Wang et al. (2010) proposed a 3D diagram that can illustrate a swallowtail catastrophe of battery TR using dimensionless parameters. However, the accuracy of the 3D diagram also depends on the accuracy of the TR model. Feng et al. (2018a) tries to summarize the reaction kinetics of cell components using an “Energy Release Diagram,” with 3D variables including the critical temperature, the heat generation power, and the enthalpy of the reactions. Current available approaches usually establish a phase diagram with temperature as x axis. However, they omit the information at time domain, thereby losing information on the sequential order of different physical/chemical processes. Upon this, we guess that a diagram with time as x axis might be more intuitive for people to understand the TR mechanisms.
This paper tries to establish a novel method, named the Time Sequence Map (TSM), for interpreting the TR mechanisms of lithium-ion batteries. The TSM tracks the heat sources according to the notion of thermodynamic system, of which the heat generation power can be measured by DSC. The temperature curve is transformed into cartoonish vectors that can clearly reflect the key heat sources that contribute to the TR process. The theory of the TSM has been validated by two kinds of commercial lithium-ion batteries with LiMO2 cathode, making it convincible for guiding the battery TR modeling and safety design.
Materials and Methods
Battery Samples
Table 1 lists the battery samples used in the calorimetric tests for validating the proposed TSM. Both the Sample A and the Sample B have cathode with LiMO2, carbon based anode and separator with ceramic coating on the PE base. Both the Sample A and the Sample B have large format and capacity no <20 Ah. The battery samples are charged to 100% state-of-charge before test, to represent the most dangerous status.
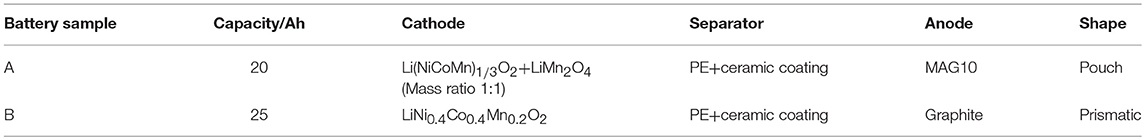
Table 1. The battery samples used in the calorimetric tests.
Calorimetric Tests
Accelerating rate calorimetry (ARC) manufactured by Thermal Hazard Technology® (THT) is used to conduct adiabatic TR tests of the battery samples. The ARC has extended-volume to hold the large format samples, as shown in Figure 1. A thermocouple was inserted between the two cells to measure the internal temperature of the battery sample. Thermal runaway tests were conducted under the heat-wait-seek-exotherm mode. The ARC builds an adiabatic boundary condition around the cell during the exotherm mode, ensuring accurate measurement of the heat generation during TR. More detailed experimental settings can be seen in Zheng S. et al. (2018).
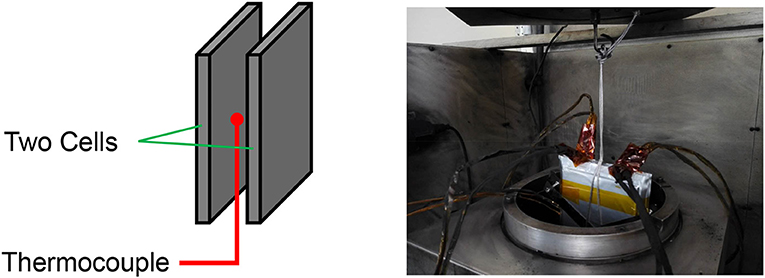
Figure 1. Experimental settings for the ARC test.
Differential scanning calorimetry (DSC), manufactured by Netzsch® with name of DSC 214 Polyma, is used to evaluate the thermal stabilities of the cell components. The DSC results from the segments in the TSM. The samples for the DSC tests are the cell components scratched from the battery samples. The mass ratio for the powder of “anode+electrolyte” is “3.6 mg + 0.96 μL,” and for that of “cathode+electrolyte” is “6.3 mg + 0.7 4 μL.” The mass ratio is same as that in the porous electrodes. The DSC scans the samples from 50 to 600°C with a temperature rise rate of 20°C·min−1.
Theoretical
The Key Characteristics of Battery Thermal Runaway
Figure 2 displays the key characteristics of battery TR. Figure 2A shows the voltage, temperature and the temperature rate in the ARC test results for Cell Sample A. Characteristic temperatures {T1, T2, T3} can be observed in many of the ARC tests (Feng et al., 2018e). T1 (78.2°C for Battery Sample A) is regarded as the onset temperature of heat generation. In ARC results, T1 means when the ARC detects obvious temperature rise, which is usually judged by a preset threshold of temperature rise rate, e.g., 0.01°C min−1 or so. T2 is the triggering temperature for TR. T2 is the flag when the HTR loop runs out of control. Understanding T2 is quite critical for battery safety design, because a higher T2 usually means better overall thermal stability, and the battery can thus be more likely to pass an abuse test in a standard. However, there is still no quantifiable definition of T2, to the best knowledge of the authors. T3 is the maximum temperature that the battery can reach during TR. The difference ΔT = T3 −T2 directly links to the total heat generation during TR (ΔHTR) as shown in Equation (1), where M is the cell mass and Cp is the heat capacity. The TR propagation behavior largely depends on the intensive heat release between T2 and T3. Figure 2B shows that smoke is possible to occur during TR test for Battery Sample A, whereas Figure 2C shows that fire is possible to occur after TR is triggered. The key characteristics of battery TR includes the characteristic temperatures {T1, T2, T3}, and the unique phenomenon (smoke, fire and explosion) that occurs during TR. The relationships between those key characteristics seem to be complex, because they contain several physical/chemical processes at high temperature. We are proposing the TSM to connect the underlying logics between those key characteristics of battery TR.
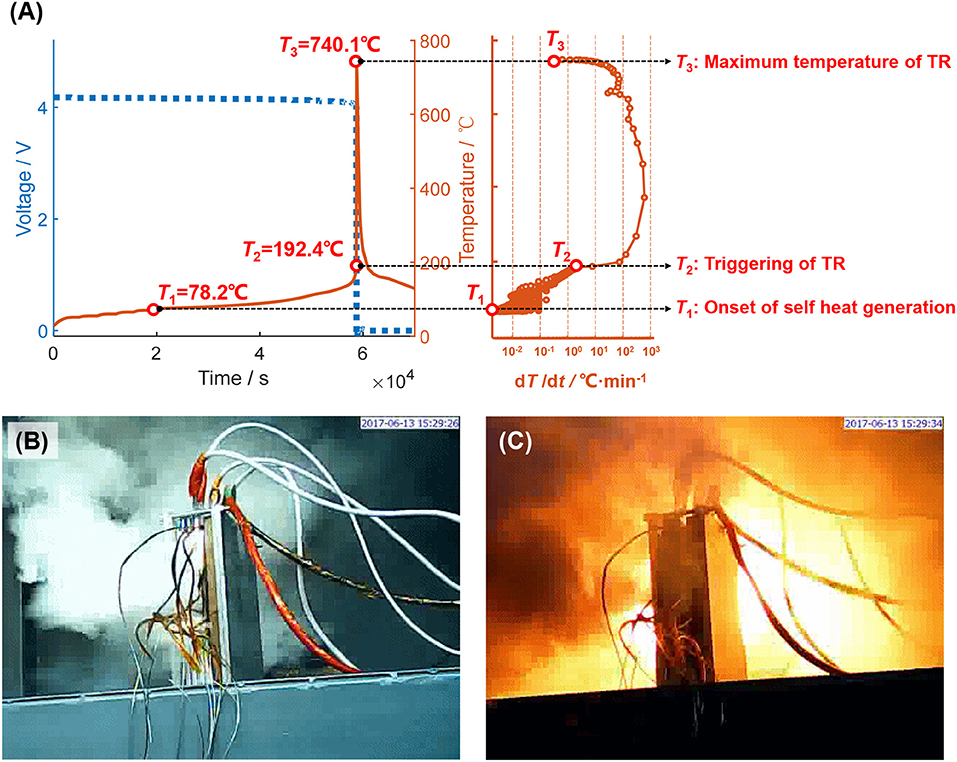
Figure 2. Key characteristics for battery TR, data from Battery Sample A. (A) Characteristic temperatures for a TR during ARC test; (B) Smoke during a TR test; (C) Fire during a TR test.
A Demo for the Time Sequence Map
Figure 3 shows a demo for the TSM, which interprets the TR mechanisms of battery Sample A. From left to right, the TSM in Figure 3 can be divided into two regions: (1) The left side shows the reaction systems, which will be defined in Figure 4. The onset temperatures are marked to show the initial condition of the reactions. (2) The right side shows the characteristics during TR. Although it seems to be complex at the first sight of TSM, it contains almost all of the key chemical/physical processes during TR. The reader can know what process is happening at what stage of TR illustrated in the TSM. The details of the TSM is being introduced as follows.
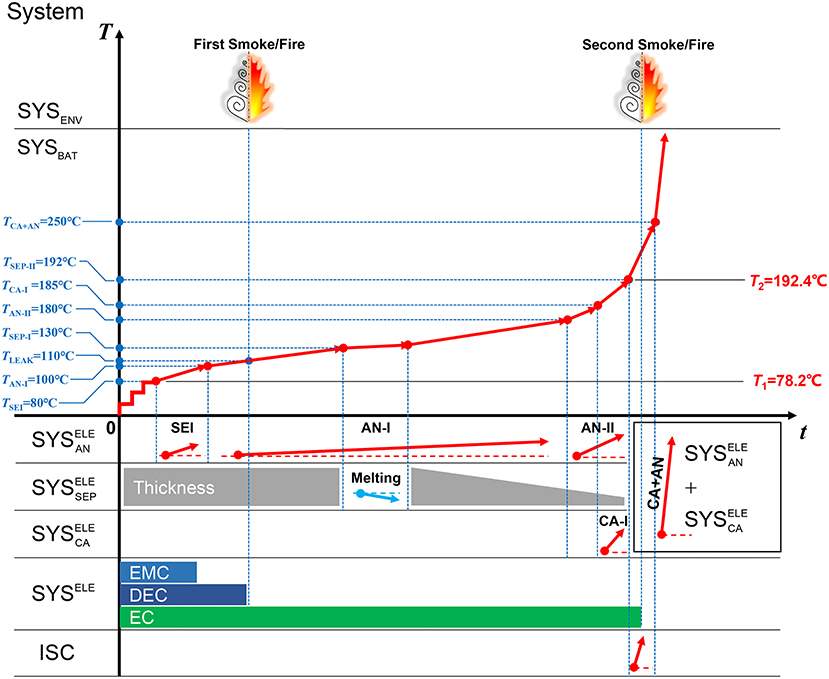
Figure 3. The time sequence map for interpreting the thermal runaway mechanism of the Battery Sample A.
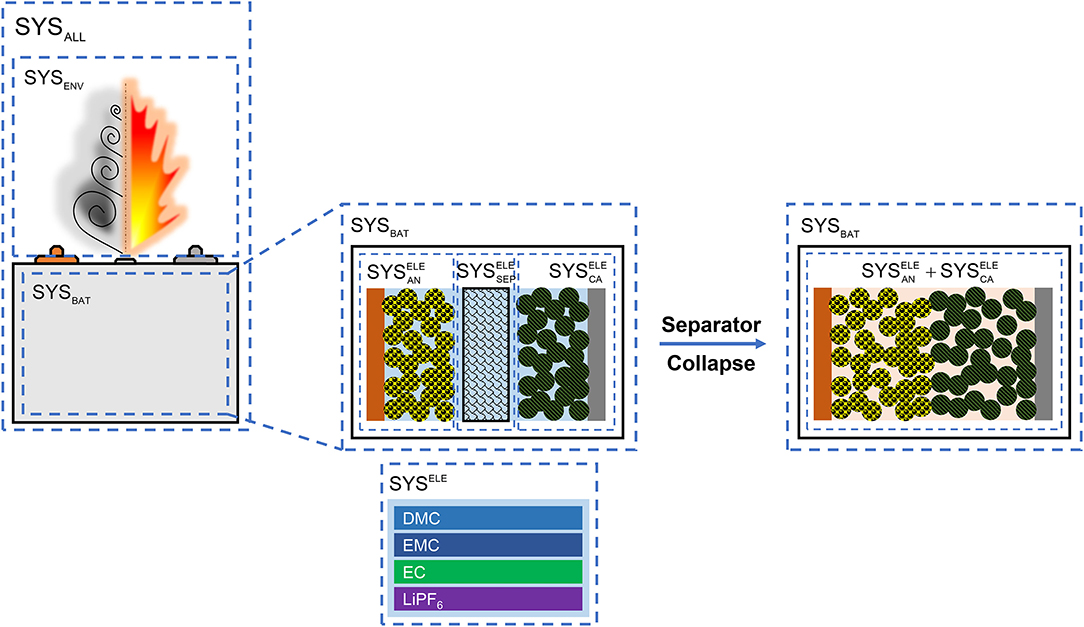
Figure 4. The thermodynamic systems involved for drawing a Time Sequence Map.
The Definition of System During Battery Thermal Runaway
The chemical/physical processes usually occur within a confined thermodynamic system. Actually, the Hatchard's model (Hatchard et al., 2001), which is regarded as the first TR model, calculates the summation of all kinds of chemical reactions, which are assumed to be occurring independently. Figure 4 illustrates the thermodynamic system in a lithium-ion cell. From left to right, we use the symbol “SYS” to represent an independent thermodynamic system, which has a heat capacity that can absorb the generated heat during TR. The SYSALL denotes that cell and its surroundings. The cell is marked as “SYSBAT,” whereas the surroundings are regarded as the SYSENV. The physical/chemical processes in the SYSENV have not been considered in the Hatchard's model and its descendants. The Hatchard's model predicts the temperature within the SYSBAT. The notion of SYSENV and SYSALL are quite important. The smoke, fire and explosion usually occur in the SYSENV, after cell venting, therefore if one wishes to simulate the behavior of fire and explosion, he/she should focus on the major chemical/physical process outside the cell. If one wishes to simulate the temperature rise during TR, he/she should focus on the chemical/physical processes within the SYSBAT. The fire and explosion have their own modeling principles, which are different from that in the Hatchard's model. Strictly, when we call a TR model, it is more for the Hatchard's model for SYSBAT, rather than the model for fire and explosion for SYSENV. Interestingly, cell venting is an important process that bridges the chemical/physical process from SYSBAT to SYSENV, as cell venting transfers mass from inside out. The mass exhausting during TR can vary from 10 to 70%, as seen from experimental experiences. Therefore, considering cell venting in the TR model is important, if the mass loss is huge.
The venting is always caused by massive gas generation inside the cell during TR. There are two sources of gas generations: (1) The vaporization of the solvents (DMC, EMC, DEC, EC, etc.), once the temperature rises to the boiling point of the solvents, they will gasify and run out of the cell (Larsson et al., 2018). (2) The gas generated by the decomposition of cell components (Feng et al., 2018a). Before TR is triggered, it seems that the source (1) is the major source of cell venting, and the venting temperature is quite near to the boiling point of the components in the solvents.
Now we look at the chemical/physical processes in SYSBAT. Figure 4 shows that as the separator perfectly isolates the cathode and anode, the SYSBAT can be divided into three independent thermodynamic systems: (1) for the anode, including the porous electrode materials and the electrolyte filling the pores; (2) for the separator, including the porous separator and the electrolyte filling the pores; (3) for the cathode, including the porous electrode materials and the electrolyte filling the pores. The electrolyte itself has unique properties, because the gasification always starts from the solvents in the electrolyte system, which we define as SYSELE, as at the central bottom of Figure 4. Here we assume that the components in the SYSELE are LiPF6 with 1:1:1 DMC:EMC:EC solvents.
The separator will collapse at high temperature (Arora and Zhang, 2004), that means the will vanish at high temperature, as shown at the right side of Figure 4. At this moment the thermodynamic system inside SYSBAT may combine into +. The mixing of the and at extreme temperature can lead to rapid oxidation-reduction reactions (Liu et al., 2018; Ren et al., 2018b). It seems that none of the Hatchard's model and its descendants consider this reaction. That might be the reason for why the Hatchard's model cannot predict the TR behavior well. Actually, most of its descendants are fearing about showing the fitting results with the experimental data. However, the true mechanisms of the rapid oxidation-reduction reactions for the system of + still requires further study.
The Temperature Segments in the Time Sequence Map
There are cartoonish temperature segments in the TSM, as shown at the upper right in Figure 3. Those segments come from the DSC test data for the systems defined in section The Definition of System During Battery Thermal Runaway. As the system defined in section The Definition of System During Battery Thermal Runaway are independent upon the chemical reactions, the behavior of the SYSBAT can be regarded as the superposition of the sub-systems. Therefore, we can test the thermodynamics at high temperature of the sub-systems by DSC tests, and then infer the behavior of the SYSBAT at ARC tests. Moreover, as the division of the sub-system is reasonable, the calorimetric tests on the sub-systems (, , +, etc.) are practical in operations.
Figure 5 shows the methodology of how to transfer the DSC test results into the segments in the TSM. Key characteristics of the DSC peak, which usually represents a chemical reaction of the tested sample include the onset temperature (T0,x), the total heat generation (ΔHx) and the average heat release power (), as shown at the left side of Figure 5. The subscript x means the parameter is for an arbitrary reaction x. Then the key characteristics of the DSC peak are transferred into the segment in the TSM by Equations (2, 3):
where ΔTx is the total temperature rise of the SYSBAT caused by the reaction x, mx the mass of the reactants for reaction x, M is the total mass of the SYSBAT, Cp is the heat capacity of the SYSBAT, and α the angle between the segments and the time axis in the TSM.
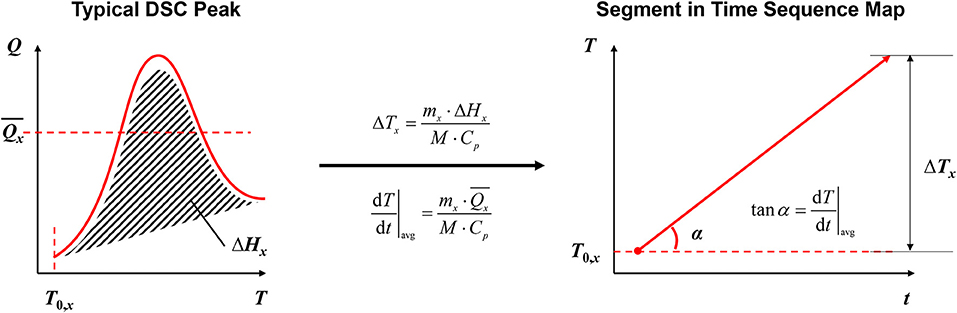
Figure 5. Transformation from typical DSC peak to segment in the Time Sequence Map.
In the next section, we are introducing the actual reactions x involved in the TR process, and showing the details of the reactions at the sub-systems of the SYSBAT.
The Key Chemical/Physical Processes During Thermal Runaway for the Defined Systems
This section introduces the key chemical/physical processes during TR for the defined thermodynamic systems. The chemical reactions involved in the heat generations that are measured by DSC tests for the sub-systems are described in details. Practices on transformation of the DSC peak into segments in the TSM according to Figure 5 have been performed. Other physical processes that do not generate heat, but their influences on the TR characteristics are also discussed.
Key Process for SYSELE
The SYSELE connects the systems of , , and , and the vaporization of its components determines the venting of the cell. The electrolyte of current commercial lithium-ion batteries usually contains a salt, for which LiPF6 is pervasively used, and contains binary or ternary organic solvents, including DMC (boiling point 91°C), EMC (boiling point 110°C), DEC (boiling point 126°C), PC (boiling point 242°C), and EC (boiling point 248°C) (Kalhoff et al., 2015).
The gasification of the solvent components can explain the reason for the cell venting during TR. As the boiling points for the binary/ternary solvents are different, therefore multi-stage jet can be observed during experiments (Wang et al., 2017; Larsson et al., 2018). Figure 6 provides a cartoonish explanation of the multi-stage jet/venting that is commonly observed during TR tests, assuming that the components in the SYSELE are LiPF6 with 1:1:1 DMC:EMC:EC solvents. Figure 6A shows that when the temperature of the cell (TBAT) reaches 100~110°C, which exceeds the boiling point of DMC and EMC, venting with white-gray smoke will be observed during TR tests. This is the first chance for the experimentalists to observe smoke/fire in their TR tests. The smoke tends to has white or gray color, because it mainly contains the vaporized solvents. Fire is possible if the run-out vapors are ignited. The inventory of DMC and EMC will soon drops to a very low level after venting occurs, drying out some of the porous electrodes, causing capacity degradation of the cell (Feng et al., 2014b). Figure 6B shows that when the TBAT reaches 250°C, the EC will vaporize and burst out from inside. There will be some alkane CxHy or other organic gases running out simultaneously with the vaporized EC, because the side reactions at the can generate correlated substances (Feng et al., 2018a). Figure 6C shows that a third jet smoke/fire is possible after the TR is triggered. The electrode powders will burst out with the gases generated during the oxidation-reduction reactions in +, because the aluminum current collector will melt into fragments at its melting point of 660°C, resulting in heavy smoke with black color. As the smoke in the third stage contains much proportion of organic gases, and the temperature of the gases is much higher than that in the first and the second stages, fire and explosion will be more prone to occur in this stage.
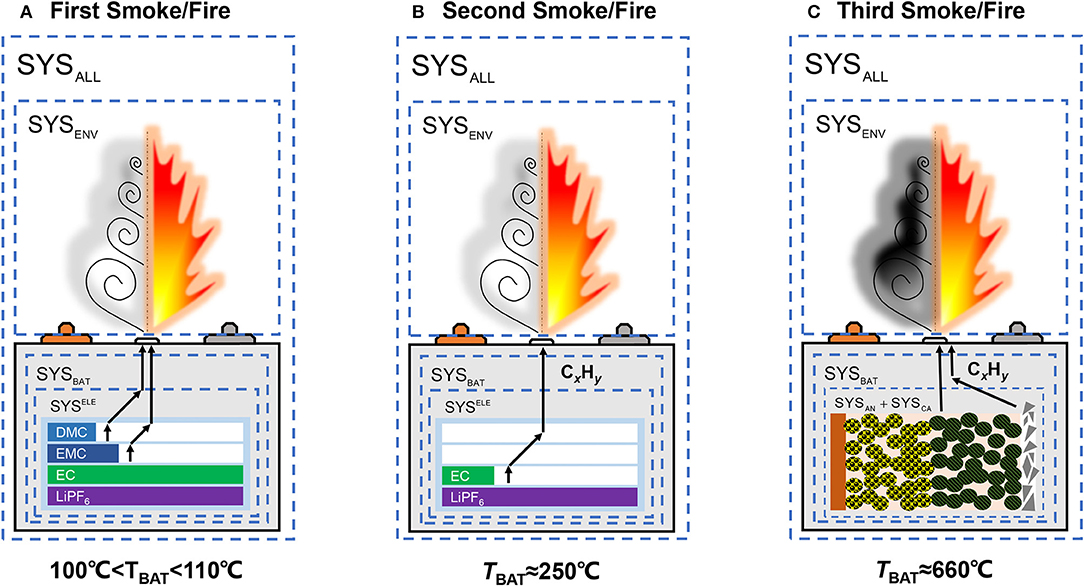
Figure 6. Interpretation of the multi-stage smoke or jet fire during thermal runaway tests. (A) The first smoke/fire due to the gasification of DMC and EMC, the color of the smoke is white-gray; (B) The second smoke/fire due to the gasification of EC, the color of the smoke is white-gray; (C) The third smoke/fire due to the melting of aluminum collector and CxHy bursting out during thermal runaway. The smoke is black, if the aluminum collector is collapsed.
The moment of jet smoke/fire has been marked at the top in the TSM, whereas the inventory of the ternary electrolyte is marked at the bottom in the TSM. With the cartoonish presentation in the TSM (Figure 3), the reader will be clear about the contributions of the electrolyte to the TR process.
Key Process for
The key role of the separator in defining the thermodynamic systems within the lithium-ion cell is to isolate the and the , The collapse of the separator determines the transition point from separate systems into a mixed system +. The commonly used base materials for current commercial separators include PE (polyethylene) and PP (polyethylene). The PE/PP based separator will melt and shrink, when the temperature reaches their melting points. The melting points of the PE and PP separators are ~130 and 170°C (Arora and Zhang, 2004), respectively. Although the close of the holes can shutdown the ion transfer inside the cell under abuse conditions such as short circuit or overcharge, the advantages of the separator shutdown is limited under high temperature heating. Shrinkage of the separator is possible after the separator melts, as shown in Figure 7. Figure 7 shows the heating results of the PE base+ceramic coated separator from Battery Sample B. Shrinkage can be observed after the temperature reaches the melting point of PE.
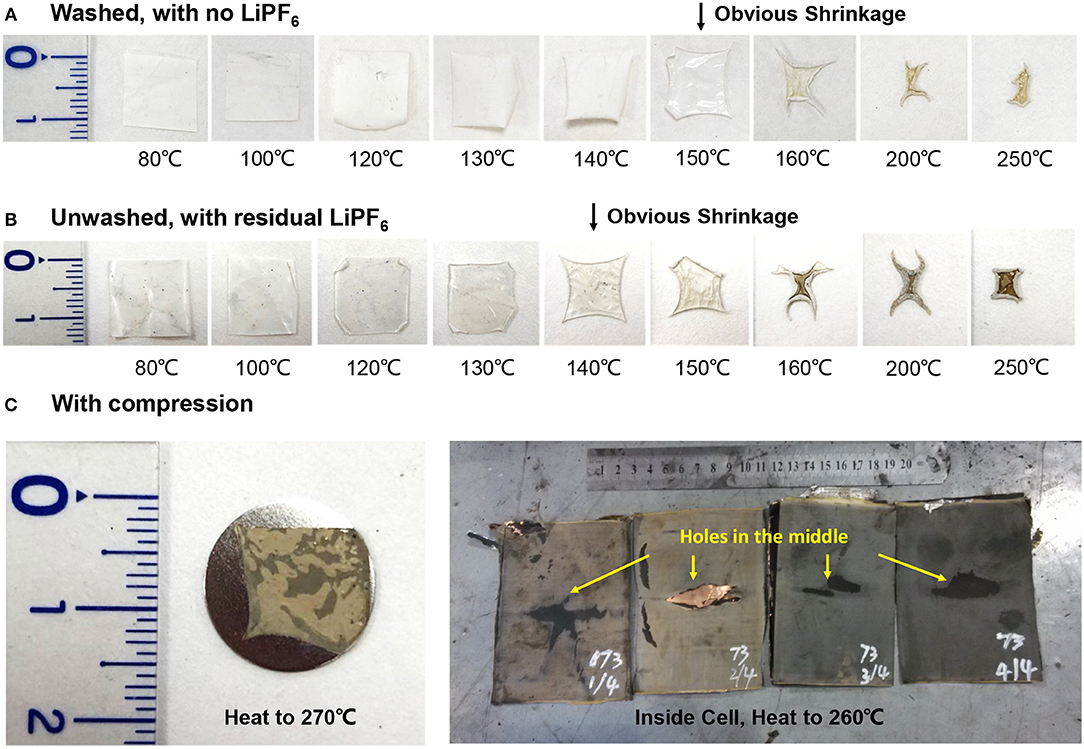
Figure 7. Inferring the collapsing temperature of the PE+ceramic-coated separator, which is from Battery Sample B. (A) Separator heated to different temperatures, with LiPF6 washed out. (B) Separator heated to different temperatures, with residual LiPF6. (C) Separator heated to extreme temperature with compression, with reduced shrinkage.
Nevertheless, the collapse temperature can be much higher than the melting point of the separator base. In other words, the shrinkage of separator base does not equal to the collapse of separator. Although the pure PE based separator will collapse at 130°C, the PE based separator with ceramic coating can hold to much higher temperature, usually higher than 200°C (Feng et al., 2018a). The ceramic coating can provide the skeletons of the separator structure (Zhu et al., 2015; Jiang et al., 2017), and the shrinkage will be confined within the ceramic structure, thereby increasing the collapse temperature of the separator. Interestingly, we have recently found that the collapse temperature of the separator can be influenced by the electrolyte and the compression load. Figures 7A,B infer that the shrinkage will be advanced to lower temperature if the separator is soaked with electrolyte. The reason might be that the products of the decomposition of LiPF6 may attack the PE base, thereby decreasing the temperature for shrinkage. Another interesting finding is that with tight compression inside the battery cell, the separator with PE base+ceramic coating can hold to as high as 260°C, as observed in one of the experiments for Battery Sample B (Figure 7C). Figure 7C shows that the area of the separator can hold at high temperature (260°C or higher), but with much thinner thickness, indicating that the shrinkage mainly occurs at the vertical direction under high compression forces. There will be holes initiating from the center of the separator, if the shrinkage becomes more severe at higher temperature, as shown in Figure 7C.
Key Reactions for and
The isolation by the provides convenience for us to investigate the independent behaviors of heat generations for the and the during TR process. This section discusses the independent heat generation mechanisms for the and the , given that the is still intact. The details of the transformation from typical DSC peaks to the segments in the TSM will be described as follows.
Figure 8 shows the DSC test data of the for the Battery Sample A and B, and the transformation results from the DSC heat flow into the segments in the TSM. Figures 8A,B show that there might be four major stages of reactions in the of the Battery Samples, therefore the DSC results can be transformed into four independent segments with different T0,x and α. The four independent segments are marked with SEI, AN-I, AN-II, and AN-III, inferring the different stages of heat generation for the , respectively. The segments in Figure 8A have been reflected in the TSM in Figure 3 at the bottom part. Note that due to the long storage time after scratching powders from the cell anodes, the heat generation by SEI decomposition is not obvious in Figure 8A.
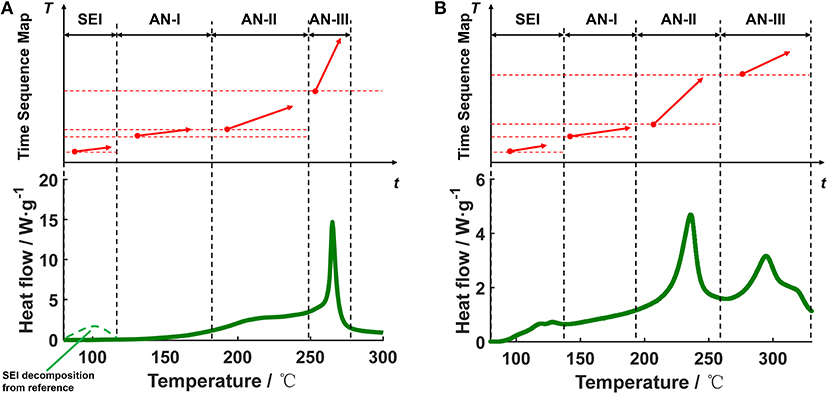
Figure 8. Transformation of the DSC data into the segments in the Time Sequence Map, for the anode system of (A) Battery Sample A, (B) Battery Sample B.
Figure 9 shows the DSC test data of the for the Battery Sample A and B, and the transformation results from the DSC heat flow into the segments in the TSM. Figures 9A,B show that there might be two major stages of exothermic reactions in the of the Battery Samples, therefore the DSC results can be transformed into two independent segments with different T0,x and α. Note that the endothermic peak caused by electrolyte vaporization and the venting of the DSC crucible has been omitted, because in a real case the venting effect on the ARC results is not obvious. The two independent segments are marked as CA-I, and CA-II, inferring the two stages of heat generation for the , respectively. The segments in Figure 9A have been also reflected in the TSM in Figure 3 at the bottom part, below the segments for .
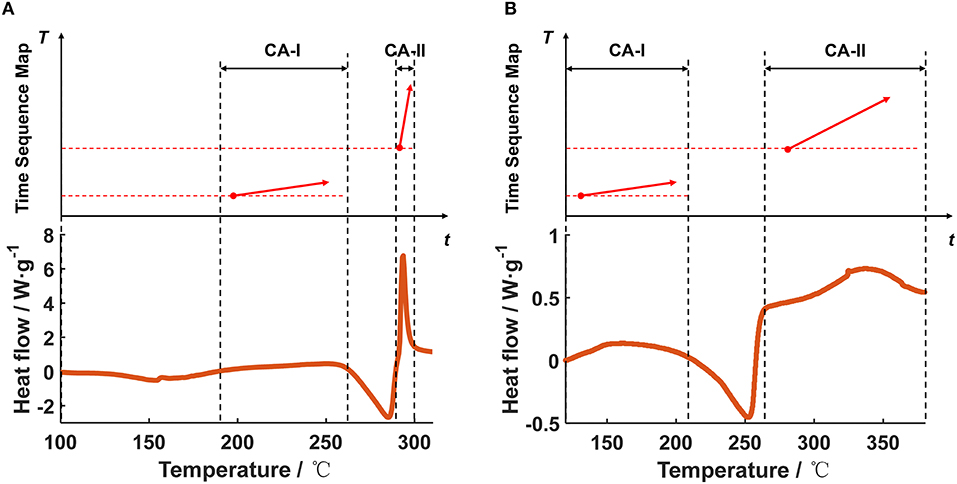
Figure 9. Transformation of the DSC data into the segments in the Time Sequence Map, for the cathode system of (A) Battery Sample A, (B) Battery Sample B.
Key Reactions for + After Separator Collapse
After the separator collapses, the SYSBAT changes into a mixed thermodynamic system of +, in which the rapid oxidation-reduction will occur, generating intensive heat. This section describes the details of the transformation from typical DSC peak to the segment in the TSM for the reaction in + at high temperature. As we assume that most of the solvents might be vaporized before the reaction occurs, the solvents have been dried out in the DSC tests with mixed powder from cathode and anode.
Figure 10 shows the DSC test data of the + for the Battery Sample A and B, and the transformation results from the DSC heat flow into the segments in the TSM. Figures 10A,B show that there is only one sharp peak in the DSC test data, denoting the fierce heat generation caused by the oxidation-reduction reaction between the cathode and the anode. The T0,x for the reaction is quite high (250°C for Battery Sample A, and 270°C for Battery Sample B), indicating that once the temperature of the SYSBAT reaches 250°C or higher, and the separator already collapses, there will be fierce reaction between the cathode and the anode, releasing large amount of heat generation. The segment for the “CA+AN” reaction for Battery Sample A has already been marked in Figure 3, with a block combining the region of , , and located at the middle right.
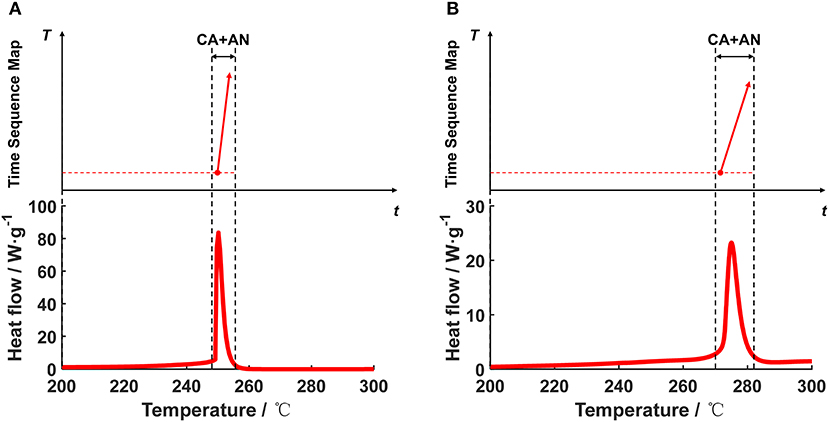
Figure 10. Transformation of the DSC data into the segment in the Time Sequence Map, for the mixed system of +. (A) Battery Sample A, (B) Battery Sample B.
Internal Short Circuit for
The Hatchard's TR model does not consider ISC, therefore cannot fit the experimental data well. Recently, researchers are introducing terms that can reflect the heat generation by ISC in the TR model (Feng et al., 2015b; Coman et al., 2017b). However, the accurate proportion of the heat generation by ISC in the TR process remains unclear, based on the current literature. Our recent calculation (Feng et al., 2018e) indicates that the ISC is critical to trigger the oxidation-reduction reaction, however, the ISC is not the major heat source that heat the cell to 800°C or more. And Liu et al. (2018) suggests that the ISC is not an essential condition for TR. Some hints are indicating that there can be TR without ISC. Nevertheless, the exact relationship between ISC and TR for all kinds of lithium-ion batteries still requires more researches. Here we focus on discussing the certain conditions for the occurrence of TR, and the quantified analysis of the ISC during TR for the specific experimental data.
The essential condition for ISC includes: 1 The cathode and the anode have contact; 2 There is pathway for the Li-ion to transfer. For condition 1, the separator should have defects, e.g., shrinkage or collapse at high temperature. For condition 2, there should be electrolyte that can transfer Li-ions. Even if the condition 1 is satisfied, the resistance of the cell can be very high, resulting in low heating power during ISC. Generally, the heat generation power of ISC (QISC) can be estimated by:
where U is the cell voltage, η is the conversion coefficient for electrical-thermal effect, RISC is the equivalent ISC resistance at the point of ISC. The ISC can release large amount of heat instantaneously if RISC is very low. A fierce ISC always occurs at a relative low temperature before cell venting because there is still sufficient electrolyte inside the cell. Figure 11 shows the hints for the fierce short that occurred during TR. The copper collector (melting point 1,083°C) has melted, as shown in the yellow circuit in Figure 11, indicating that the ISC can be quite intensive and release large amount of heat in a limited area. The ISC occurred at the edges at the electrode, where the separator shrinkage initiates, as in Figure 11. While the ISC in Figure 7 occurs at the center, where the shrinkage in the thickness direction cannot hold. The occurrence of ISC can be picked up when we see voltage drop during TR test, although the heat generation of ISC can vary. Therefore, it is easy to locate the ISC in the TSM, according to the measured voltage.
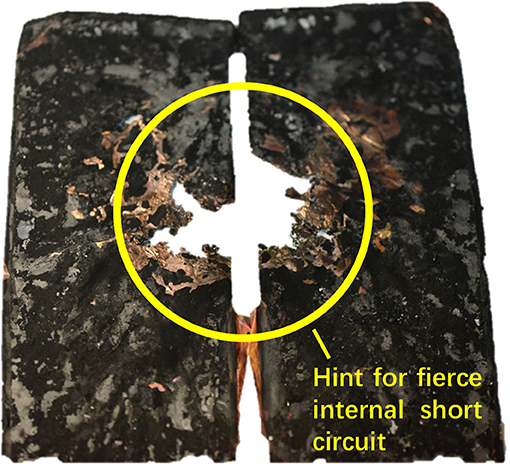
Figure 11. The hint for fierce internal short circuit during thermal runaway test.
Result and Discussions
Mechanism Interpretation Using the Time Sequence Map
Figure 3 uses the TSM to interpret the TR mechanism of Battery Sample A. According to the TSM, there might be two stages of smoke/fire, first for the vaporization of DMC and EMC, another for the vaporization of EC and the gas generated during TR. The major heat source comes from the anode under 180°C. Although the separator melts at ~130°C, the collapse will not occur until 192°C. The temperature rise rate accelerates after the temperature reaches 180°C, because the heat generation of anode accelerates and the cathode joins to release heat. ISC occurs at ~192°C, further increasing the heat generation power. The SYSBAT switches to + when the separator collapses at 192°C, but the rapid oxidation-reduction reaction will not occur until the temperature rises to 250°C or higher, when the TR is finally triggered. The characteristic temperatures for TR can be explained by the TSM as in Figure 3. T1 is the onset temperature for heat generation, caused by the decomposition of SEI, whereas, T2 is the collapse temperature of the separator, representing the moment of ISC and the system transition in SYSBAT. It looks like the TR is triggered at T2 = 192°C, however, the major heat will not be released until TCA+AN = 250°C.
The Influence of the Internal Short Circuit on the Thermal Runway Behavior
Figure 12 illustrates two cases in the ARC tests to discuss the influence of the ISC on the TR behaviors. The two tests are both conducted for a same batch of Battery Sample B, however, with different TR characteristics. The T2 varies much, though the ISC temperature (TISC) for both of them are ~130°C. The T2, which is defined as the moment when the temperature rise rate exceeds 10°C·min−1, varies from 250.2°C for Case A to 132.7°C for Case B. It should be noted that T2 = TISC for Case B, indicating that the TR is directly triggered by ISC. While for Case A, the triggering mechanism is similar with that for Battery Sample A, that is “ISC occurs first, the oxidation-reduction reaction is triggered later.”
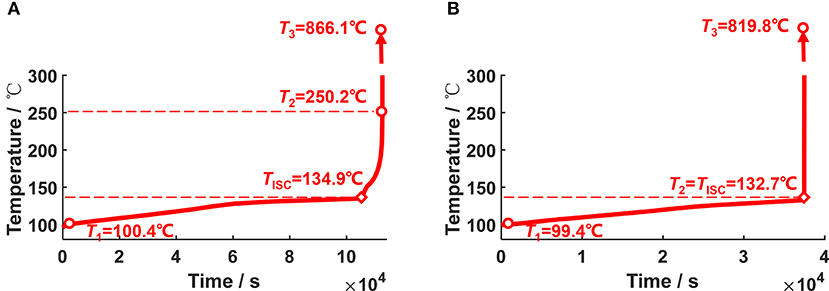
Figure 12. Two different ARC test results for Battery Sample B. (A) A case when TR occurs at 250.2°C, (B) A case when TR occurs at 132.7°C.
The TSM in Figure 13 helps interpret the different features that displayed in the ARC tests for Battery Sample B. The thermodynamics of the sub-systems for Case A and B should be the same. The only difference is the heat release speed of ISC. The ISC in Case A, as shown in Figure 12A and Figure 13A, is milder than that in Case B, as shown in Figure 12B and Figure 13B. Therefore, TR will not be triggered at the same moment of ISC for Case A, whereas, TR is triggered at the same moment of ISC for Case B. The results are interesting, indicating that the degree of ISC can change the moment of TR, even if the batteries are produced in a same batch. And the heat release of TR is mainly determined by the oxidation-reduction reaction in the +, the ISC is just a sector that accelerate the temperature rise to T2. Moreover, the role of separator in controlling the degree of ISC is important, if the separator can mild the ISC during its breakage, the TR may be delayed to a higher temperature, which represents a better safety.
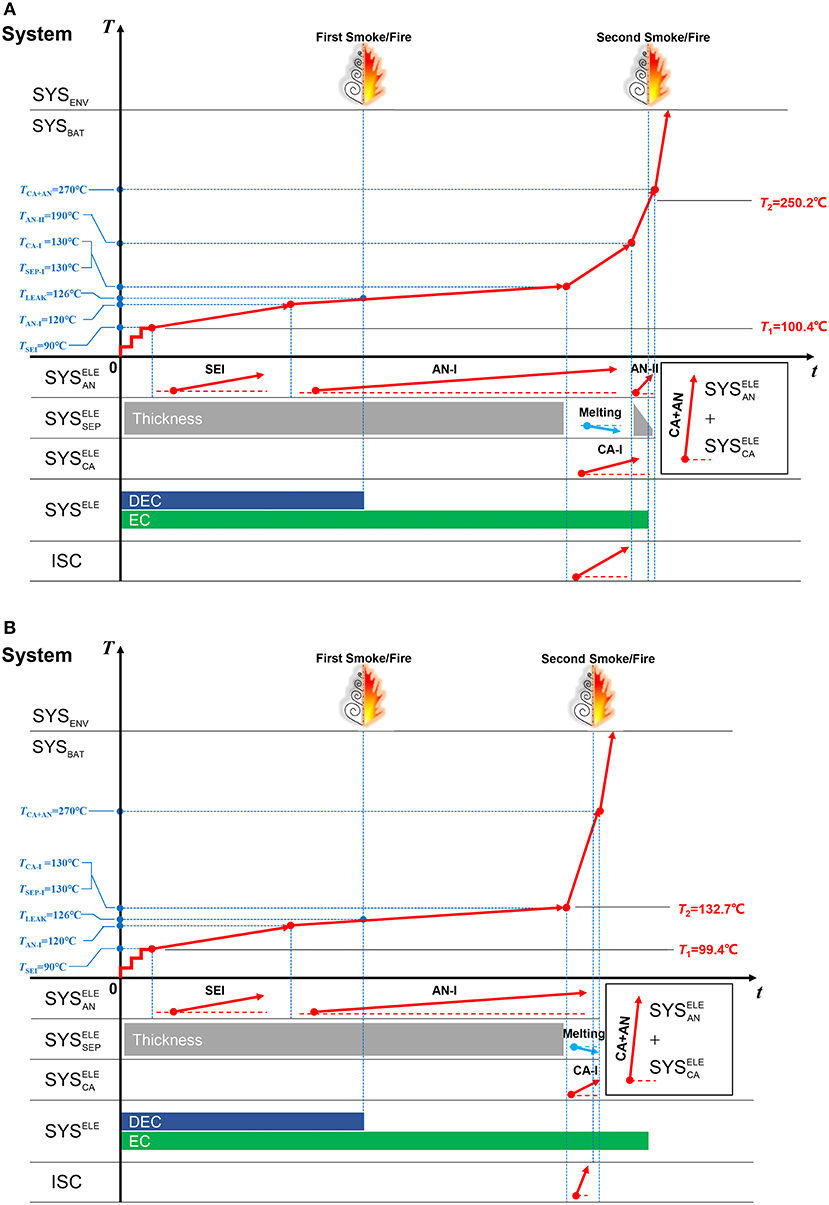
Figure 13. The TSM for interpreting two different ARC test results for Battery Sample B. (A) The TSM for Case A, (B) The TSM for Case B.
Possible Improvements of the Time Sequence Map
The divisions of thermodynamic systems as in section The Definition of System During Battery Thermal Runaway are useful for further interpretation of the TR mechanisms of lithium-ion batteries using the TSM, however, the DSC tests cannot guarantee the ideal in-situ test environment yet. The ideal in-situ test environment means that the test condition (temperature and pressure of the system) during material characterization is the same as that during battery characterization. In this paper, the battery characterization is conducted using ARC, whereas the material characterization is conducted using DSC. The difference in the environment of temperature locates at that the test environment in the ARC is adiabatic, whereas that in the DSC is constant rate scanning. To reduce this difference, one should select a scanning rate that is similar to the temperature rise rate in the ARC test when characterizing a specific reaction. The difference in the environment of pressure locates at that the venting time of the battery cell and the material with electrolyte might be different, because there is compression force inside battery cell but no for the material in the crucible. In other words, the toughness of the crucible in DSC test and that of the cell case are different. Controlling the temperature and pressure during material characterization is quite difficult but meaningful for improving the credibility of the TSM. We are calling for new inventions in the calorimetric techniques that might be essential to fill in the gap. However, considering the limitations in the test methods, the most convenient way to obtain the information of the materials' properties is to use DSC.
Nevertheless, there might be coincidence that the venting of the crucible might be similar with what occurs in a pouch cell, if the test condition can be properly controlled (Ren et al., 2018a). Then the TR behavior of the battery cell can be calculated by the superimposition of the materials' chemical kinetics. How to control the test condition in order to make the DSC test closer to the real condition is ongoing in our lab.
Moreover, one may find that the mass change in the system also brings the change in the reaction mechanisms. However, the current TSM does not consider much on the mass change. According to the experimental data, the ignorance of the mass change might be good approximations for the cells with Ni-poor NCM cathodes, whereas that for the cells with Ni-rich NCM cathodes, which generate more gases during high temperature decomposition, might be not good. TGA/DSC joint system was recently installed in our lab. Correlated improvements in the DSC test facilities are ongoing. The mass change will be considered in the ver. 2.0 of the TSM, once we made significant progress.
One more concern on the improvements of the TSM might be the influence of the fire on the heat transfer from the SYSENV to the SYSBAT. The ignorance of the combustion after venting comes from Feng et al. (2015a), in which the data shows that the heating effect caused by fire on the cells might be quite limited, because the temperature at the bottom of the fire is low to form large gradients for heat transfer.
Conclusion
The paper tries to propose a graphical methodology, name the TSM, to help interpret the TR (Thermal runaway) mechanism of lithium-ion batteries. The graphical method contains all the key physical/chemical processes that occur during battery TR. The key physical/chemical processes are ordered sequentially in the TSM, vividly depicting the underlying mechanisms of battery TR. The TR results of two battery samples demonstrate the validity of the TSM. With the help of the proposed TSM, conclusions can come to: (1) the major heat source is the oxidation-reduction reaction; (2) the fire releases lots of heat, but most of the heat is not used to heat the cell itself; (3) the internal short circuit (ISC) is critical to trigger the oxidation-reduction reaction; (4) the ISC is not the major heat source that heat the cell to 800°C or more; (5) the oxidation-reduction reaction is triggered when the temperature reaches the initiation temperature. The TSM further helps depict the frontiers in the battery TR researches. It suggests that in the future work on battery TR we should focus on: (1) the relationship between ISC and TR; (2) the mechanism of the oxidation-reduction reaction between the cathode and the anode; (3) the detailed reaction mechanisms for a specific thermodynamic system within the cell.
Author Contributions
XF proposed the idea of time sequence map and organized the data and paper. SZ and LW participated in the discussion for the embryonic form of the time sequence map. SZ, YW, and DR participated in the experiments. XH and MO gave suggestions on experimental design and paper organization.
Funding
This work was supported by the Ministry of Science and Technology of China (Grant Nos. 2018YFB0104404 and 2016YFE0102200); the National Natural Science Foundation of China (Grant Nos. 51706117 and U1564205); the China Postdoctoral Science Foundation (Grant No. 2017M610086). XF thanks the support of Young Elite Scientist Sponsorship Program from China Association for Science and Technology.
Conflict of Interest Statement
The authors declare that the research was conducted in the absence of any commercial or financial relationships that could be construed as a potential conflict of interest.
Acknowledgments
XF appreciates the beneficial discussions from Dr. Shriram Santhanagopalan with National Renewable Energy Laboratory, U.S.
References
Abada, S., Petit, M., Lecocq, A., Marlair, G., Sauvant-Moynot, V., and Huet, F. (2018). Combined experimental and modeling approaches of the thermal runway of fresh and aged lithium-ion batteries. J. Power Sour. 399, 264–273. doi: 10.1016/j.jpowsour.2018.07.094
Arora, P., and Zhang, Z. (2004). Battery separators. Chem. Rev. 104, 4419–4462. doi: 10.1021/cr020738
Chen, M., Sun, Q., Li, Y., Wu, K., Liu, B., Peng, P., et al. (2015). A thermal runaway simulation on a lithium titanate battery and the battery module. Energies 8, 490–500. doi: 10.3390/en8010490
Chen, W., Wang, Y., and Shu, C. (2016). Adiabatic calorimetry test of the reaction kinetics and self-heating model for 18650 Li-ion cells in various states of charge. J. Power Sour. 318, 200–209. doi: 10.1016/j.jpowsour.2016.04.001
Coman, P. T., Darcy, E. C., Veje, C. T., and White, R. E. (2017a). Numerical analysis of heat propagation in a battery pack using a noel technology for triggering thermal runaway. Appl. Energ. 203, 189–200. doi: 10.1016/j.apenergy.2017.06.033
Coman, P. T., Darcy, E. C., Veje, C. T., and White, R. E. (2017b). Modelling Li-ion cell thermal runaway triggered by an internal short circuit device using an efficiency factor and Arrhenius formulations. J. Electrochem. Soc. 164, A587–A593. doi: 10.1149/2.0341704jes
Coman, P. T., Mátéfi-Tempfli, S., Veje, C. T., and White, R. E. (2017c). Modeling vaporization, gas generation and venting in Li-ion battery cells with a dimethyl carbonate electrolyte. J. Electrochem. Soc. 164, A1858–A1865. doi: 10.1149/2.0631709jes
Coman, P. T., Rayman, S., and White, R. E. (2016). A lumped model of venting during thermal runaway in a cylindrical lithium cobalt oxide lithium-ion cell. J. Power Sour. 307, 56–62. doi: 10.1016/j.jpowsour.2015.12.088
Dahn, J. R., Trussler, S., Dugas, S., Coyle, D. J., Dahn, J. J., and Burns, J. J. (2013). Accurate and precise temperature-controlled boxed for the safe testing of advanced automotive Li-ion cells with high precision coulometry. J. Electrochem. Soc. 160, A251–A258. doi: 10.1149/2.047302jes
Duh, Y. S., Lin, K. H., and Kao, C. S. (2018). Experimental investigation and visualization on thermal runaway of hard prismatic lithium-ion batteries used in smart phones. J. Therm. Anal. 132, 1677–1692. doi: 10.1007/s10973-018-7077-2
Feng, X., Fang, M., He, X., Ouyang, M., Lu, L., Wang, H., et al. (2014a). Thermal runaway features of large format prismatic lithium ion battery using extended volume accelerating rate calorimetry. J. Power Sour. 255, 294–301. doi: 10.1016/j.jpowsour.2014.01.005
Feng, X., He, X., Lu, L., and Ouyang, M. (2018c). Analysis on the fault features for internal short circuit detection using an electrochemical-thermal coupled model. J. Electrochem. Soc. 165, A155–A167. doi: 10.1149/2.0501802jes
Feng, X., He, X., Ouyang, M., Lu, L., Wu, P., Kulp, C., et al. (2015b). Thermal runaway propagation model for designing a safer battery pack with 25Ah LiNixCoyMnzO2 large format lithium ion battery. Appl. Energ. 154, 74–91. doi: 10.1016/j.apenergy.2015.04.118
Feng, X., Li, J., Lu, L., Hua, J., Xu, J., and Ouyang, M. (2012). Research on a battery test profile based on road test data from hybrid fuel cell buses. J. Power Sour. 209, 30–39. doi: 10.1016/j.jpowsour.2012.02.069
Feng, X., Lu, L., Ouyang, M., Li, J., and He, X. (2016b). A 3D thermal runaway propagation model for a large format lithium ion battery module. Energy 115, 194–208. doi: 10.1016/j.energy.2016.08.094
Feng, X., Ouyang, M., Liu, X., Lu, L., Xia, Y., and He, X. (2018a). Thermal runaway mechanism of lithium ion battery for electric vehicles: a review. Ener. Storage Mater. 10, 246–267. doi: 10.1016/j.ensm.2017.05.013
Feng, X., Ouyang, M., and Lu, L. (2018b). “Overview about accidents: selected lessons learned from prior safety-related failures of Li-ion batteries,” in The Electrochemical Power Sources: Fundamentals, Systems, and Applications- Li-Battery Safety, eds J. Garche and K. Brandt (Amsterdam: Elsevier Press), 65–96. doi: 10.1013/B978-0-444-93777-2.00012-8
Feng, X., Pan, Y., He, X., Wang, L., and Ouyang, M. (2018d). Detecting the internal short circuit in large-format lithium-ion battery using model-based fault-diagnosis algorithm. J. Ener. Storage 18, 26–39. doi: 10.1016/j.est.2018.04.020
Feng, X., Sun, J., Ouyang, M., He, X., Lu, L., Han, X., et al. (2014b). Characterization of large format lithium ion battery exposed to extremely high temperature. J. Power Sour. 272, 457–467. doi: 10.1016/j.jpowsour.2014.08.094
Feng, X., Sun, J., Ouyang, M., Wang, F., He, X., Lu, L., et al. (2015a). Characterization of penetration induced thermal runaway propagation process within a large format lithium ion battery module. J. Power Sour. 275, 261–273. doi: 10.1016/j.jpowsour.2014.11.017
Feng, X., Weng, C., Ouyang, M., and Sun, J. (2016a). Online internal short circuit detection for a large format lithium ion battery. Appl. Energ. 161, 168–180. doi: 10.1016/j.apenergy.2015.10.019
Feng, X., Zheng, S., Ren, D., He, X., Wang, L., Liu, X., et al. (2018e). “Key characteristics for thermal runaway of li-ion batteries,” in 10th International Conference on Applied Energy (Hong Kong).
Gao, S., Feng, X., Lu, L., Ouyang, M., and Ren, D. (2017). A test approach for evaluating the safety considering thermal runaway propagation within the battery pack. ECS Trans. 77, 225–236. doi: 10.1149/07711.0225ecst
Guo, R., Lu, L., Ouyang, M., and Feng, X. (2016). Mechanism of the entire overdischarge process and overdischarge-induced internal short circuit in lithium-ion batteries. Sci. Rep. 6:30248. doi: 10.1038/srep30248
Hatchard, T. D., MecNeil, D. D., Basu, A., and Dahn, J. R. (2001). Thermal model of cylindrical and prismatic lithium-ion cells. J. Electrochem. Soc. 148, A755–A761. doi: 10.1149/1.1377592
Huang, P., Ping, P., Li, K., Chen, H., Wang, Q., Wen, J., et al. (2016). Experimental and modeling analysis of thermal runaway propagation over the large format energy storage battery module with Li4Ti5O12 anode. Appl. Ener. 183, 659–673. doi: 10.1016/j.apenergy.2016.08.160
Huang, P., Wang, Q., Li, K., Ping, P., and Sun, J. (2015). The combustion behavior of large scale lithium titanate battery. Sci. Rep. 5:7788. doi: 10.1038/srep07788
Ji, W., Jiang, B., Ai, A., Yang, H., and Ai, X. (2015). Temperature-responsive microspheres-coated separator for thermal shutdown protection of lithium ion batteries. RSC Adv. 5, 172–176. doi: 10.1039/C4RA11500G
Jiang, X., Zhu, X., Ai, X., Yang, H., and Cao, Y. (2017). Novel ceramic-grafted separator with highly thermal stability for safe lithium-ion batteries. ACS Appl. Mater. Inter. 9, 25970–25975. doi: 10.1021/acsami.7b05535
Kalhoff, J., Eshetu, G. G., Bresser, D., and Passerini, S. (2015). Safer electrolytes for lithium-ion batteries: state of the arat and perspectives. ChemSusChem 8, 2154–2175. doi: 10.1002/cssc.201500284
Kim, G. H., Pesaran, A., and Spotnitz, R. (2007). A three-dimensional thermal abuse model for lithium-ion cells. J. Power Sour. 170, 476–489. doi: 10.1016/j.jpowsour.2007.04.018
Kong, X., Zheng, Y., Ouyang, M., Lu, L., Li, J., and Zhang, Z. (2018). Fault diagnosis and quantitative analysis of micro-short circuits for lithium-ion batteries in battery packs. J. Power Sour. 395, 358–368. doi: 10.1016/j.jpowsour.2018.05.097
Lai, X., Zheng, Y., and Sun, T. (2018). A comparative study of different equivalent circuit models for estimating state-of-charge of lithium-ion batteries. Electrochim. Acta 259, 566–577. doi: 10.1016/j.electacta.2017.10.153
Larsson, F., Bertilsson, S., Furlani, M., Albinsson, I., and Mellander, B. (2018). Gas explosions and thermal runaway during external heating abuse of commercial lithium-ion graphite-LiCoO2 cells at different levels of ageing. J. Power Sour. 373, 220–231. doi: 10.1016/j.jpowsour/2017.10.085
Lee, C. H., Bae, S. J., and Jang, M. (2015). A study on effect of lithium ion battery design variables upon features of thermal-runaway using mathematical model and simulation. J. Power Sour. 293, 498–510. doi: 10.1016/j.jpowsour.2015.05.095
Liang, J., Li, F., and Cheng, H. (2016). High-capacity lithium ion batteries: bridging future and current. Energy Storage Mater. 4, A1–A2. doi: 10.1016/j.ensm.2016.05.010
Liu, J., Wang, Z., Gong, J., Liu, K., Wang, H., and Guo, L. (2017). Experimental study of thermal runaway process of 18650 lithium-ion battery. Materials 10:230. doi: 10.3390/ma10030230
Liu, X., Ren, D., Hsu, H., Feng, X., Xu, G., Zhuang, M., et al. (2018). Thermal runaway of lithium-ion batteries without internal short circuit. Joule Accept. 2, 2047–2064. doi: 10.1016/j.joule.2018.06.015
Mao, B., Chen, H., Cui, Z., Wu, T., and Wang, Q. (2018). Failure mechanism of the lithium ion battery during nail penetration. Int. J. Heat Mass Trans. 122, 1103–1115. doi: 10.1016/j.ijheatmasstransfer.2018.02.036
Mao, W., Fu, Y., Zhao, H., Ai, G., Dai, Y., Meng, D., et al. (2015). Rational design and facial synthesis of Li3V2(PO4)3@C nanacomposites using carbon with different dimensions for ultrahigh-rate lithium-ion batteries. ACS Appl. Mater. Inter. 7, 12057–12066. doi: 10.1021/acsami.5b02242
Melcher, A., Ziebert, C., Rohde, M., and Seifert, H. J. (2016). Modeling and simulation of the thermal runaway behavior of cylindrical Li-ion cells-computing of critical parameters. Energies 9:292. doi: 10.3390/en9040292
Noh, H., You, S., Yoon, C. S., and Sun, Y. (2013). Comparison of the structural and electrochemical properties of layered Li[NixCoyMnz]O2 (x = 1/3, 0.5, 0.6, 0.7, 0.8 and 0.85) cathode material for lithium-ion batteries. J. Power Sour. 233, 121–130. doi: 10.1016/j.jpowsour.2013.01.063
Ouyang, M., Feng, X., Han, X., Lu, L., Li, Z., and He, X. (2016). A dynamic capacity degradation model and its applications considering varying load for a large format Li-ion battery. Appl. Energ. 165, 48–59. doi: 10.1016/j.apenergy.2015.12.063
Ouyang, M., Ren, D., Lu, L., Li, J., Feng, X., Han, X., et al. (2015). Overcharge-induced capacity fading analysis for large format lithium-ion batteries with LiyNi1/3Co1/3Mn1/3O2+LiyMn2O4 composite cathode. J. Power Sour. 279, 626–635. doi: 10.1016/j.jpowsour.2015.01.051
Peng, P., and Jiang, F. (2015). Thermal behavior analyses of stacked prismatic LiCoO2 lithium-ion batteries during oven tests. Int. J. Heat Mass Trans. 88, 421–423. doi: 10.1016/j.ijheatmasstransfer.2015.04.101
Ping, P., Kong, D., Zhang, J., Wen, R., and Wen, J. (2018). Characterization of behavior and hazards of fire and deflagration for high-energy Li-ion cells by over-heating. J. Power Sour. 398, 55–66. doi: 10.1016/j.jpowsour.2018.07.044
Ping, P., Wang, Q., Chung, Y., and Wen, J. (2017). Modelling electro-thermal response of lithium-ion batteries from normal to abuse conditions. Appl. Energ. 205, 1327–1344. doi: 10.1016/j.apenergy.2017.08.073
Ping, P., Wang, Q., Huang, P., Sun, J., and Chen, C. (2014). Thermal behavior analysis of lithium-ion battery at elevated temperature using deconvolution method. Appl. Energ. 129, 261–273. doi: 10.1016/j.apenergy.2014.04.092
Qi, C., Zhu, Y., Gao, F., Yang, K., and Jiao, Q. (2018). Mathematical model for thermal behavior of lithium ion battery pack under overcharge. Int. J. Heat Mass Tran. 124, 552–563. doi: 10.1016/j.ijheatmasstransfer.2018.03.100
Ren, D., Feng, X., Lu, L., Ouyang, M., Zheng, S., Li, J., et al. (2017). An electrochemical-thermal coupled overcharge-to-thermal runaway model for lithium ion battery. J. Power Sour. 364, 328–340. doi: 10.1016/j.jpowsour.2017.08.035
Ren, D., Liu, X., Feng, X., Lu, L., Ouyang, M., Li, J., et al. (2018a). Model-based thermal runaway prediction of lithium-ion batteries from kinetics analysis of cell components. Appl. Energ. 228, 633–644. doi: 10.1016/j.apenergy.2018.06.126
Ren, D., Smith, K., Guo, D., Han, X., Feng, X., Lu, L., et al. (2018b). Investigation of lithium plating stripping process in Li-ion batteries at low temperature using an electrochemical model. J. Electrochem. Soc. 165, A2167–A2178. doi: 10.1149/2.0661810jes
Samba, A., Omar, N., Gualous, H., Firouz, Y., Bossche, P. V. D., Mierlo, J. V., et al. (2014). Development of an advanced two-dimensional thermal model for large size lithium-ion pouch cells. Electrochim. Acta 117, 246–254. doi: 10.1016/j.electacta.2013.11.113
Spotnitz, R., and Franklin, J. (2003). Abuse behavior of high-power, lithium-ion cells. J. Power Sour. 113, 81–100. doi: 10.1016/S0378-7753(02)00488-3
Vitoux, L., Reichardt, M., Sallard, S., Novák, P., Sheptyakov, D., and Villevieille, C. (2018). A cylindrical cell for operando neutron diffraction of Li-ion battery electrode materials. Front. Energy Res. 6:76. doi: 10.3389/fenrg.2018.00076
Wang, H., Tang, A., and Huang, K. (2011). Oxygen evolution in overcharged LixNi1/3Co1/3Mn1/3O2 electrode and its thermal analysis kinetics. Chinese J. Chem. 29, 1583–1588. doi: 10.1002/cjoc.201180284
Wang, Q., Huang, P., Ping, P., Du, Y., Li, K., and Sun, J. (2017). Combustion behavior of lithium iron phosphate battery induced by external heat radiation. J. Loss Prevent. Proc. 49, 961–969. doi: 10.1016/j.jlp.2016.12.002
Wang, Q., Ping, P., and Sun, J. (2010). Catastrophe analysis of cylindrical lithium ion battery. Nonlinear Dyn. 61, 763–772. doi: 10.1007/s11071-010-9685-7
Wang, Q., Ping, P., Zhao, X., Chu, G., Sun, J., and Chen, C. (2012). Thermal runaway caused fire and explosion of lithium ion battery. J. Power Sour. 208, 210–224. doi: 10.1016/j.jpowsour.2012.02.038
Wu, T., Chen, H., Wang, Q., and Sun, J. (2018). Comparison analysis on the thermal runaway of lithium-ion battery under two heating modes. J. Hazard. Mater. 344, 733–741. doi: 10.1016/j.jhazmat.2017.11.022
Yan, P., Zheng, J., Xiao, J., Wang, C. M., and Zhang, J. G. (2015). Recent advances on the understanding of structural and composition evolution of LMR cathodes for Li-ion batteries. Front. Energy Res. 3:26. doi: 10.3389/fenrg.2015.00026
Yeow, K., and Teng, H. (2013). Charaterizing thermal runaway of lithium-ion cells in a battery system using finite element analysis approach. SAE Int. J. Alt. Power. 2, 180–186. doi: 10.4271/2013-01-1534
Zeng, Z., Murugesan, V., Han, K. S., Jiang, X., Cao, Y., Xiao, L., et al. (2018). Non-flammable electrolytes with high salt-to-solvent ratios for Li-ion and Li-metal batteries. Nat. Ener. 3, 674–681. doi: 10.1038/s41560-018-0196-y
Zhang, L., Guo, X., Huang, J., Qu, Y., Niu, C., Du, Z., et al. (2018). Coin-cell-based in situ characterization techniques for Li-ion batteries. Front. Energy Res. 6:16. doi: 10.3389/fenrg.2018.00016
Zhang, S. S. (2013). Status, opportunities, and challenges of electrochemical energy storage. Front. Energy Res. 1:8. doi: 10.3389/fenrg.2013.00008
Zheng, S., Wang, L., Feng, X., and He, X. (2018). Probing the heat sources during thermal runway process by thermal analysis of different battery chemistries. J. Power Sour. 378, 527–536. doi: 10.1016/j.jpowsour.2017.12.050
Zheng, Y., Ouyang, M., Han, X., Lu, L., and Li, J. (2018). Investigating the error sources of the online state of charge estimation methods for lithium-ion batteries in electric vehicles. J. Power Sour. 377, 161–188. doi: 10.1016/j.jpowsour.2017.11.094
Zhu, W., Liu, D., Paolella, A., Gagnon, C., Gariépy, V., Vijh, A., et al. (2018). Application of operando X-ray diffraction and Raman spectroscopies in elucidating the behavior of cathode in lithium-ion batteries. Front. Energy Res. 6:66. doi: 10.3389/fenrg.2018.00066
Keywords: lithium-ion battery, battery safety, thermal runaway, accelerating rate calorimetry, differential scanning calorimetry, energy storage, internal short circuit, fire
Citation: Feng X, Zheng S, He X, Wang L, Wang Y, Ren D and Ouyang M (2018) Time Sequence Map for Interpreting the Thermal Runaway Mechanism of Lithium-Ion Batteries With LiNixCoyMnzO2 Cathode. Front. Energy Res. 6:126. doi: 10.3389/fenrg.2018.00126
Received: 02 September 2018; Accepted: 07 November 2018;
Published: 26 November 2018.
Edited by:
Ping Ping, University of Warwick, United KingdomReviewed by:
Zonghai Chen, Argonne National Laboratory (DOE), United StatesXiangyu Zhao, Nanjing Tech University, China
Copyright © 2018 Feng, Zheng, He, Wang, Wang, Ren and Ouyang. This is an open-access article distributed under the terms of the Creative Commons Attribution License (CC BY). The use, distribution or reproduction in other forums is permitted, provided the original author(s) and the copyright owner(s) are credited and that the original publication in this journal is cited, in accordance with accepted academic practice. No use, distribution or reproduction is permitted which does not comply with these terms.
*Correspondence: Xiangming He, aGV4bUB0c2luZ2h1YS5lZHUuY24=
Minggao Ouyang, b3V5bWdAdHNpbmdodWEuZWR1LmNu