 Shun'ichi Ishii1*
 Hiroyuki Imachi1,2
 Kenjiro Kawano3Daisuke Murai3
 Miyuki Ogawara2
 Katsuyuki Uemastu4
 Kenneth H. Nealson5
 Fumio Inagaki1,6,7
- 1R&D Center for Submarine Resources, Japan Agency for Marine-Earth Science and Technology (JAMSTEC), Nankoku, Japan
- 2Department of Subsurface Geobiological Analysis and Research (D-SUGAR), Japan Agency for Marine-Earth Science and Technology (JAMSTEC), Yokosuka, Japan
- 3Kanto Natural Gas Development Co., Ltd., Mobara, Japan
- 4Marine Works Japan Co., Ltd., Yokosuka, Japan
- 5Department of Earth Science, University of Southern California, Los Angeles, CA, United States
- 6Kochi Institute for Core Sample Research, Japan Agency for Marine-Earth Science and Technology (JAMSTEC), Nankoku, Japan
- 7R&D Center for Ocean Drilling Science, Japan Agency for Marine-Earth Science and Technology (JAMSTEC), Yokohama, Japan
In subsurface anoxic environments, microbial communities generally produce methane as an end-product to consume organic compounds. This metabolic function is a source of biogenic methane in coastal natural gas aquifers, submarine mud volcanoes, and methane hydrates. Within the methanogenic communities, hydrogenotrophic methanogens, and syntrophic bacteria are converting volatile fatty acids to methane syntrophically via interspecies hydrogen transfer. Recently, direct interspecies electron transfer (DIET) between fermentative/syntrophic bacteria and electrotrophic methanogens has been proposed as an effective interspecies metabolite transfer process to enhance methane production. In this study, in order to stimulate the DIET-associated methanogenic process at deep biosphere-aquifer systems in a natural gas field, we operated a bioelectrochemical system (BES) to apply voltage between an anode and a cathode. Two single-chamber BESs were filled with seawater-based formation water collected from an onshore natural gas well, repeatedly amended with acetate, and operated with 600 mV between electrodes for 21 months, resulting in a successful conversion of acetate to methane via electrical current consumption. One reactor yielded a stable current of ~200 mA/m2 with a coulombic efficiency (CE) of >90%; however, the other reactor, which had been incidentally disconnected for 3 days, showed less electromethanogenic activity with a CE of only ~10%. The 16S rRNA gene-based community analyses showed that two methanogenic archaeal families, Methanocalculaceae and Methanobacteriaceae, were abundant in cathode biofilms that were mainly covered by single-cell-layered biofilm, implicating them as key players in the electromethanogenesis. In contrast, family Methanosaetaceae was abundant at both electrodes and the electrolyte suspension only in the reactor with less electromethanogenesis, suggesting this family was not involved in electromethanogenesis and became abundant only after the no-electron-flow event. The anodes were covered by thick biofilms with filamentous networks, with the family Desulfuromonadaceae dominating in the early stage of the operation. The family Geobacteraceae (mainly genus Geoalkalibacter) became dominant during the longer-term operation, suggesting that these families were correlated with electrode-respiring reactions. These results indicate that the BES reactors with voltage application effectively activated a subsurface DIET-related methanogenic microbiome in the natural gas field, and specific electrogenic bacteria and electromethanogenic archaea were identified within the anode and/or cathode biofilms.
Introduction
In most subsurface microbial ecosystems in oxygen-depleted organic-rich sedimentary environments, heterotrophic microbial communities generally produce methane as an end-product of the microbial respirations via CO2 reduction. This biogeochemical ecosystem function widely occurs on Earth, including not only a wide range of terrestrial and marine environments (e.g., rice paddy soils, cow rumen, wetlands, natural forest soils, thawing permafrost, and coastal sediments; see Matthews and Fung, 1987; Bartlett and Harriss, 1993) but also anthropogenic microbial habitats (e.g., anaerobic digester, agricultural and industrial wastewaters; see Mao et al., 2015). To date, so called “biogenic methane” in anaerobic subsurface systems has been largely explored as one of the energy sources; e.g., coastal natural gas aquifers (Sano et al., 2017), submarine mud volcanoes (Ijiri et al., 2018), methane hydrates (Kvenvolden, 1995) and coal/shale beds (Inagaki et al., 2015). Activity of the naturally occurring microbial methanogenic processes is generally extraordinarily low due to the low energy availability in the deep biosphere (Lever et al., 2015). Nevertheless, several methanogens have been successfully isolated from methane hydrate-bearing sediment (Imachi et al., 2011), submarine mud volcano (Ijiri et al., 2018), and formation water from a natural gas field (Mochimaru et al., 2007). The widespread distribution of biogenic methane clearly indicates that microorganisms play an important role in biogeochemical carbon cycling on the Earth.
Within the methanogenic microbial communities, two different types of methanogenic archaea are observed as hydrogenotrophic (Equation 2) and aceticlastic (Equation 3) methanogens.
Hydrogenotrophic (H2-consuming) methanogens syntrophically convert volatile fatty acids, such as acetate and propionate, to methane in conjunction with syntrophic bacteria (Equation 1 and Equation 2) (Schink, 1997). Since H2 and formate are scavenged mainly by the CO2 reduction of hydrogenotrophic methanogens, an efficient interspecies transfer of electron equivalents (as H2 and formate) has been achieved by close physical contact between syntrophs and methanogens (de Bok et al., 2004; Ishii et al., 2005, 2006).
In addition to hydrogen transfer, the possibility of a syntrophic coupling through direct electron transfer (DIET) has recently reported between methanogenic/methanotrophic archaea and bacteria as well as between bacteria (Lovley, 2017; McGlynn, 2017). DIET and the associated microbial extracellular electron transfer (EET) are both known to be accelerated by metal-oxide nano-particles such as magnetite and ferrihydrite (Kato et al., 2012, 2013), suggesting that the DIET and EET could be particularly important processes in subsurface environments where metal-oxide minerals are often abundant.
In order to identify and accelerate the DIET process, a bioelectrochemical system (BES) could also be applicable by using electrodes to add voltage between electrodes (Figure 1A). Within the bioreactor, the electron-capturing anode enhances the EET process from electrogenic microbes to the electrode (Equation 4), while the electron-releasing cathode facilitates the EET process from the electrode to electrotrophic methanogenic microbes (Equation 5) (Logan, 2009; Rabaey and Rozendal, 2010).
The biocathodic reaction to produce methane from CO2 and electrons is called as “electromethanogenesis” (Cheng et al., 2009; Blasco-Gómez et al., 2017). In fact, electromethanogenic microbes were stimulated by electric power input to increase methane production in the anaerobic digesters (Yu et al., 2018), as well as a subsurface methanogenic microbiome from oilfield formation water (Sato et al., 2013; Kobayashi et al., 2017). Blasco-Gomez et al. reviewed the studies of electromethanogenic microbes within complex biocathodic communities and their possible methanogenic routes (Blasco-Gómez et al., 2017), concluding that further research is needed to identify the electromethanogenic processes, especially in mineral-packed subsurface methanogenic microbiomes.
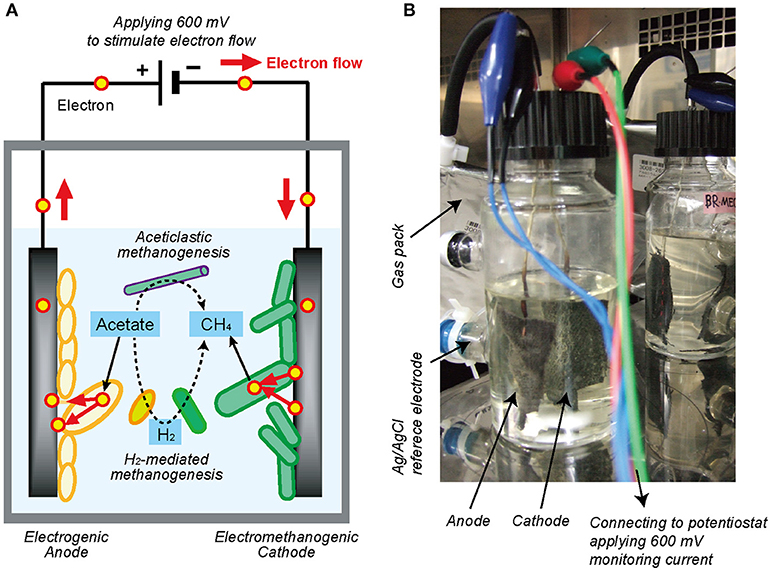
Figure 1. Single-chambered bioelectrochemical system (BES) reactor used in this study. (A) Schematic diagram of electromethanogenesis that is stimulated by accelerating external electron flow with voltage input in a BES reactor. The EET flow for the electromethanogenesis is shown by solid arrow, while competitive methanogenic reactions are shown by dashed lines. (B) The single-chambered BES reactors filled with formation water at natural gas field. Anode and cathode were connected to potentiostat and apply 600 mV between them. An Ag/AgCl reference electrode was used for monitoring electrode potentials.
In this study, in order to stimulate the subsurface DIET-associated electromethanogenic process and identify the EET-active members (Figure 1A), we inoculated the gas-rich formation water samples in Minami-Kanto gas field to duplicate BES bioreactors that supplied a voltage (600 mV) continuously between an electron-accepting anode and an electron-donating cathode (Figure 1B). Throughout the 2 years of BES operation, we periodically analyzed both bioelectrochemical characteristics and microbial community dynamics of the anode biofilm, cathode biofilm, and planktonic cells based on 16S rRNA gene phylogeny, which were systematically integrated. The results offer new insights about how subsurface DIET-associated microbes were stimulated by the voltage input and competed against typical methanogenesis in the electromethanogenic BES bioreactor (Figure 1A).
Materials and Methods
BES Bioreactor Configuration and Operation
Two single-chamber, double-electrode bioelectrochemical system (BES) bioreactors (reactors A or B) were used for enrichment of anodic electrogenic and cathodic electromethanogenic communities with voltage input between electrodes. The BES bioreactor was a bottle-type reactor (375-mL in capacity) equipped with two electrodes made of carbon cloth (3 cm × 7 cm, 42 cm2 projected surface area; TMIL, Japan). The top of the bottle was sealed using a tight butyl-rubber stopper pierced with two Ti wires (ϕ1 mm), and the electrodes were connected by the wires (Figure 1B). After sterilization of the BES reactor, 190 mL of gas-associated formation water KTG1 (30.5°C, pH 7.5, conductivity 74 mS/cm, Cl− 18.95 g/L), sampled from a production well KTG1 at the Minami-Kanto Gas field (Chiba, Japan), was anaerobically added to the duplicate BES reactors without any pretreatment in an anaerobic glove box (COY Laboratory Products, USA) equipped with Table KOACH open cleaning system (KOACH T500-F, Koken Ltd., Japan), and two electrodes were immersed in the formation water. The formation water was anaerobically sampled at the production well and stored at 4°C before use. After adding 2 mmol of sodium acetate as a carbon substrate, a multi-channel potentiostat (PS-08; Toho technical research, Japan) was used to supply a voltage of 600 mV across the electrodes, and the generated current was monitored and recorded every 5 min. The BES reactors were gently agitated with a magnetic stirrer and incubated at 30°C.
When depletion of the substrates caused the electric current to decrease, 2 mmol or 2.5 mmol of sodium acetate was re-injected. When the current-consuming performance decreased because of the accumulation of secondary metabolites and/or sodium ion, the formation water was fully discarded in the anaerobic glove box and refilled with the stored formation waters, KTG1, KTG2 (28.3°C, pH 7.5, conductivity 75 mS/cm, Cl− 19.13 g/L) or KTG3 (19.2°C, pH 8.2, conductivity 47 mS/cm, Cl− 11.83 g/L), which were all anaerobically sampled from different production wells in the Minami-Kanto gas field and stored at 4°C before use.
Polarization Analysis
Potential step voltammetry analyses were conducted using a potentiostat (PS-08; Toho technical research, Japan) to obtain polarization curves. The applied voltage between electrodes was changed from 0 mV to +600 mV in stepwise increments of 50 mV for 15 min or 5 min, and the corresponding current was recorded after stabilization (<1 min). An Ag/AgCl reference electrode (+200 mV vs. standard hydrogen electrode [SHE], RE-5B; BASi, USA) was placed at the side port of the BES reactors (Figure 1B), and the anode and cathode potentials were also recorded with a voltage logger (VR-71; T&D, Tokyo) during the step voltammetry analyses. The total time of the voltammetry analyses was 150 min for 15 min interval and 50 min for 5 min interval, respectively.
Chemical Analyses
Acetate concentrations were measured with a high-pressure liquid chromatography (HPLC) instrument equipped with a multiple wavelength detector (Class VP; Shimadzu, Japan) and a reverse-phase C18 column (TSKgel ODS-100V; Tosoh Bioscience, Japan). The eluent was 0.1% phosphoric acid at a flow rate of 1.0 mL/min. Gas production was quantified by capturing the produced gas in a 1-L aluminum gas bag (AAK-1; Asone, Japan) connected to the bioreactor with FDA viton tubing (Masterflex L/S25, Cole-Palmer, Japan) (Figure 1B). The methane concentration in the gas phase was monitored with a methane sensor (BCP-CH4; BlueSens, Germany) that was frequently inserted into the gas line.
Coulombic efficiency, CE (%), was calculated as CE = Cp/Cth×100, where Cp (C) is the total charge consumed during a single batch, and Cth (C) is the theoretical amount of charge allowable from either complete acetate oxidation on the anode or methane production on the cathode. The CEanode (%) was calculated from the Cth from complete acetate oxidization (8 mmol of e− per 1 mmol of acetate, Equation 4). The CEcathode (%) was calculated from the Cth theoretically required to produce methane from CO2 (8 mmol of e− per 1 mmol of CH4, Equation 5).
Microbial Composition Analysis
Small portions of anodic and cathodic carbon cloth (6 mm × 6 mm) were collected by using ethanol-sterilized scissors in an anaerobic glove box. Planktonic cells suspended in the electrolyte solution were also collected and centrifuged to make cell pellets. Total DNA was extracted from the electrode biofilms or suspended cells by using the PowerBiofilm™ DNA Isolation Kit (MO BIO, USA) with physical disruption by bead beating for 2.5 min. PCR amplification of the small subunit (SSU) rRNA gene (V4–V5 regions) was performed using the LA Taq (TaKaRa Bio, Japan) with universal primer pair 530F/907R (Nunoura et al., 2012), which contains overhang adapters at the 5′ ends. The PCR amplification conditions have been described elsewhere (Hirai et al., 2017). After PCR amplification, PCR products were purified enzymatically (ExoSAP-IT PCR Product Cleanup Reagent; Thermo Fisher, USA). To add multiplexing indices and Illumina sequencing adapters, a second PCR amplification was performed with Ex Taq polymerase (TaKaRa Bio, Japan). The amplified products were purified with the Agencourt AMPure XP (Beckman Coulter, USA), and quantified using the Quant-iT dsDNA High-Sensitivity Assay Kit (Thermo Fisher, USA). The PCR products were subjected to DNA denaturing and sample loading on a sequencer using MiSeq v3 reagent (Illumina, USA), and sequenced using the MiSeq platform (Illumina, USA) as the 300 bp paired end according to Illumina's standard protocol. The DNA nucleotide sequences have been deposited in the NCBI Short Read Archive under accession number SRR7990743-SRR7990766.
Analysis of SSU rRNA Gene Tag Sequencing Data
After merging paired-end reads with PEAR (Zhang et al., 2014), the regions of PCR primers were removed using Cutadapt v1.10 (Martin, 2011). Low-quality (Q score <30 in more than 3% of sequences) and short (<150 bp) reads were filtered out using a custom perl script. The SSU rRNA gene amplicon analysis was performed using the QIIME software package v1.9.1 (Caporaso et al., 2010). After the removal of chimeric sequences using USEARCH (Edgar, 2010) in QIIME, operational taxonomic units (OTUs) were selected at the 97% similarity level using UCLUST (Edgar, 2010) and were subsequently assigned to a taxon (at phylum, class, order, family, and genus levels) by comparison with the non-redundant 16S rRNA small subunit SILVA 128 database (Quast et al., 2013). Database searches for related SSU rRNA gene sequences were further conducted using the BLAST program to refer non-redundant nucleotide (nr/nt) database excluding uncultured/environmental sample sequences. Canonical correspondence analysis was performed using XLSTAT (Addinsoft, USA) to evaluate the correlations between community composition and environmental factors (Terbraak, 1986). The phylogenetic position of the OTUs was analyzed using a maximum likelihood-based phylogenetic tree created after alignment by MUSCLE in CLC Genomics Workbench version 8.5 (CLC bio, USA). Bootstrap resampling analysis for 100 replicates was performed to estimate the confidence of tree topologies. The nucleotide sequences of dominant OTUs have been deposited in the GSDB/DDBJ/EMBL/NCBI nucleotide sequence databases under accession numbers MK035761-MK035843.
Focused Ion Beam Scanning Electron Microscopy (FIB/SEM)
A small portion of carbon cloth was collected from the anodes, fixed for 2 h with 2.5% glutaraldehyde in filtered formation water, and preserved in the same fixative till post-fixation at 4°C. Samples were then washed in filtered artificial seawater and post-fixed with 2% osmium tetroxide in filtered artificial seawater for 2 h at 4°C. After the specimens were rinsed with distilled water, conductive staining was performed by incubating the specimens in 0.2% aqueous tannic acid (pH 6.8) for 30 min. After another wash with distilled water, the specimens were further stained with 1% aqueous osmium tetroxide for 1 h. Finally, the specimens were dehydrated in a graded series of ethanol, gently dried with a critical point dryer (JCPD5; JEOL, Japan), and coated with osmium using an osmium plasma coater (POC-3; Meiwafosis, Japan). SEM observations were carried out on a Helios G4 UX (Thermo Fisher, USA), an extreme high resolution (XHR) field-emission scanning electron microscope (FE-SEM) equipped with Focused Ion Beam (FIB), at an acceleration voltage of 3 kV. The cross sectioning of the anodic and cathodic biofilms on the carbon fibers were obtained by using the FIB milling at acceleration voltage of 30 kV without deposition, and the FE-SEM observations were carried out at an acceleration voltage of 1 kV after the FIB milling.
Results
Long-Term BES Enrichment and Current Generation
The gas-rich formation water sample (KTG1) was placed into two BES bioreactors where it served as a microbial inoculum as well as an electrolyte for the electromethanogenic operations. Enrichment of both electromethanogenic and electrogenic microbes was accomplished by establishing a voltage (600 mV) that was continuously applied between the cathode and the anode in each of two single-chamber BES reactors (A and B) (Figure 1). Current production was observed 7 days after acetate addition and stabilized at ~1.3 mA for both reactors (Figure 2). During initial four months, the current production was notably unstable as the communities adapted to the electrode environment, with operational currents that fluctuated between 0.5 mA and 2.0 mA (Table 1). After step voltammetry analysis of reactor B at day 149, the reactor B was accidentally held at open-circuit conditions (no voltage input) for 3 days, and subsequently returned to the applied voltage operation (Figure 2). This EET-limited stimulus had a significant impact on the electromethanogenic production for reactor B, with a drop of current output from 1.36 mA (phase B-I) to 0.76 mA (phase B-II), indicating a lowered level of electromethanogenesis after the disconnection. However, the treatment time at phase B-II was significantly shorter than that of phase B-I (10.3 day to 3 day) (Table 1). These changes suggest that the different types of acetate-oxidizing methanogenesis such as hydrogen-mediated syntrophic methanogenesis (Equations 1, 2) or aceticlastic methanogenesis (Equation 3) outcompeted the EET-mediated electromethanogenesis (Equation 4, 5) in reactor B after the disconnection stimulus.
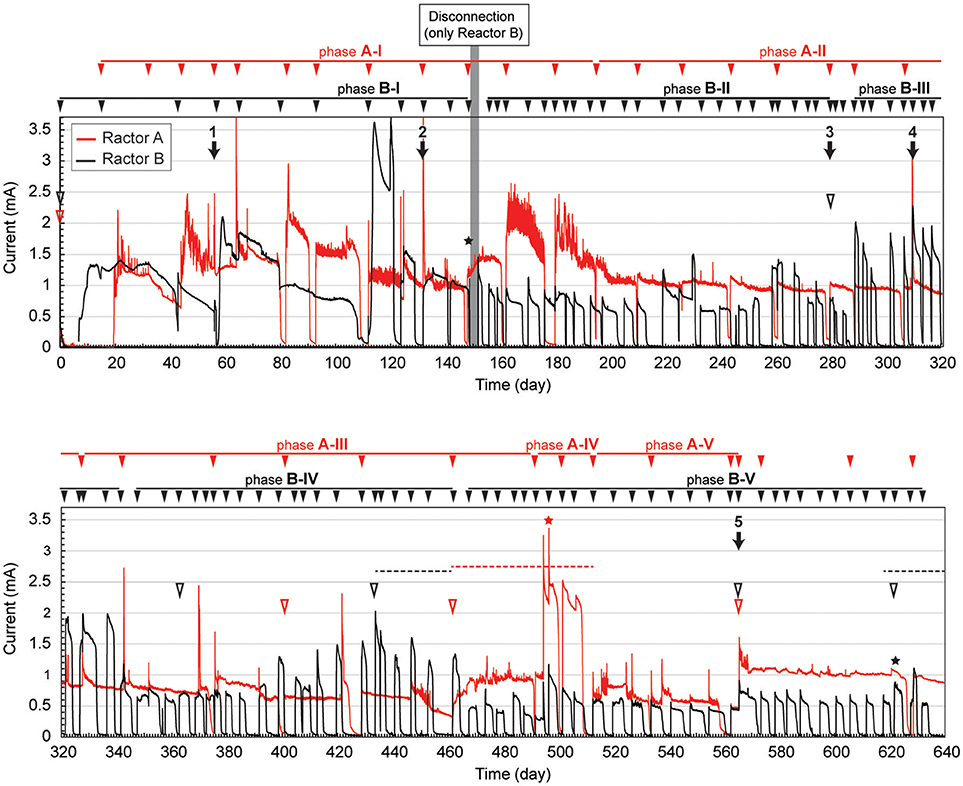
Figure 2. Long-term electrical current output in duplicate BES reactors fed with acetate. Current generation with 600 mV of voltage application in duplicate single-chambered BESs is shown as red (reactor A) and black (reactor B) lines. Filled arrowheads above charts indicate feeding of acetate to the BES. Filled arrows indicate biofilm and suspension sampling for DNA extraction, and the numbers above the arrow indicate IDs for the microbial community composition analysis. Open arrowheads indicate exchange of formation water in the BESs. Stars indicate step voltammetry. Dashed lines indicate methane concentration logging. The marks with red color indicate reactor A, while marks with black color indicate reactor B.
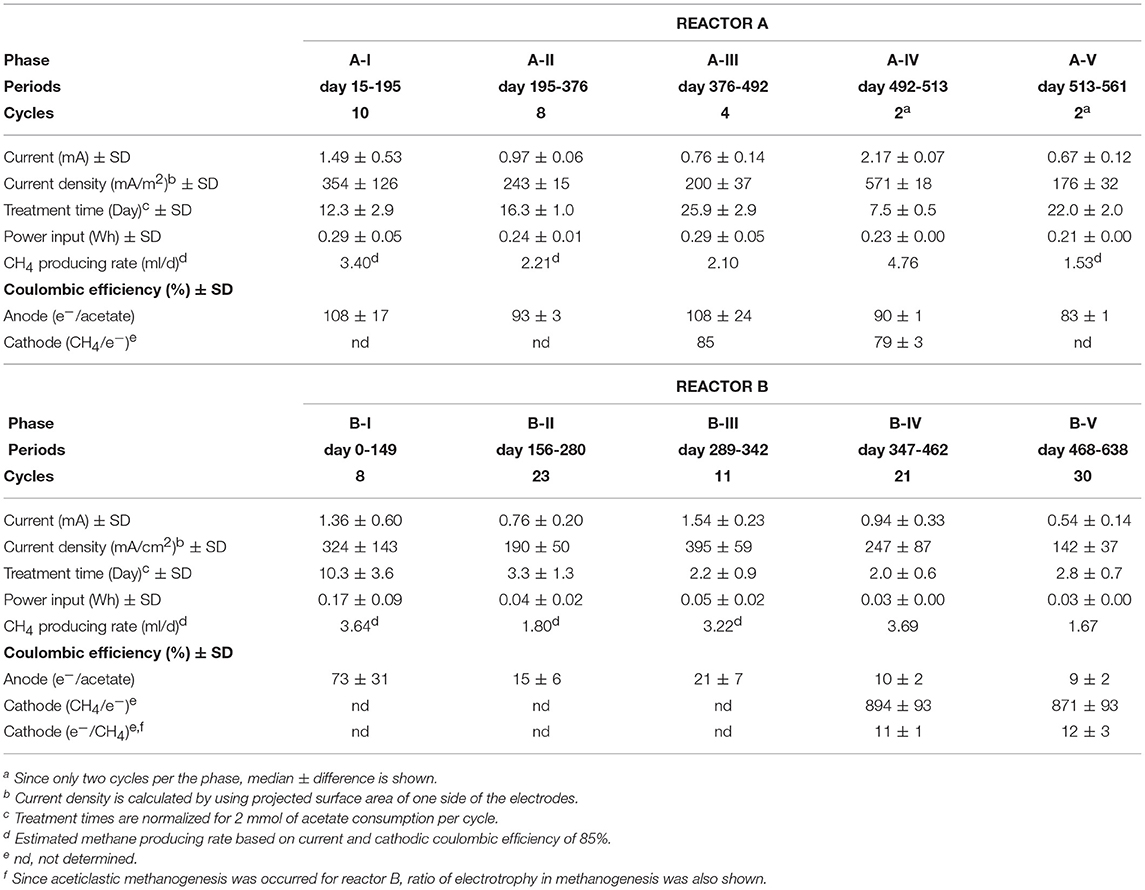
Table 1. Summary of electromethanogenic profiles of BESs with 600 mV voltage input.
When the current output decreased during the long-term operation, the electrolyte was replaced with stored formation water in order to remove excess suspended cells and accumulated secondary metabolites. Such electrolyte replacement occurred three times for reactor A (initial replacement was to KTG1, and the other two were to KTG2), and five times for reactor B (all replacements were to KTG3), and all the treatments were carried out after the 270-day operational period. After the electrolyte replacement, current output was restored to the previously observed current output, thereafter enhanced current outputs were routinely observed (Figure 2).
During each batch cycle of the reactors, acetate decreased concomitantly with current output, and the current production was falling to near zero when acetate was fully consumed (Supplementary Figure S1). Methane concentration in the gas phase also showed consistent increase with current consumption, stopping the increase when the current output fell to near zero (Supplementary Figure S2). Thus, methane production was directly correlated with the current output and/or acetate degradation. The treatment time of one batch cycle was significantly correlated with the current output throughout the long-term operation for reactor A, but only phase B-I for reactor B (Supplementary Figure S3), which is also consistent with the notion that that current-independent acetate-consuming methanogenesis became the dominant process in reactor B after the disconnection event.
After the long-term BES operation, dense biofilms were visibly apparent at both anode and cathode surfaces (Supplementary Figure S4), which might lead to a reduction of current output due to an overall increase in an internal resistance by electron, proton, and substrate transport limitation (Figure 2). Denser biofilms were observed in less-electromethanogenic reactor B, suggesting that non-electromethanogenic cells were growing at a distance from the electrode surfaces. Red-colored biofilms were observed at only anodes in both reactors (Supplementary Figure S4), suggesting that the red molecules such as c-type cytochromes were accumulated within the electrogenic anode biofilms.
Bioelectrochemical Performance
The anodic electron-releasing and cathodic electron-capturing yields were calculated as coulombic efficiency (CE) based on the estimated half reactions of DIET (Equation 4 and Equation 5), which was found to be stable at 80–100% for both half reactions in reactor A throughout the operation (Table 1). These high CEs clearly indicate that almost all of electron flows were associated with the acetate oxidation by electrogenic microbes on the anode (Equation 4) and with the methane production by electromethanogenic microbes on the cathode (Equation 5). This result also suggests that other competing reactions such as typical acetate-oxidizing methanogenesis (Equations 1–3, Figure 1A), oxygen respiration, anaerobic respiration with soluble electron acceptors such as sulfate and nitrate, and/or anabolic biosynthesis rarely occurred in reactor A.
On the other hand, reactor B showed different trend of CEs for both half reactions after the 3-day disconnection event (Table 1). Before the disconnection, the CEanode of reactor B was 73%; however, the CEanode dropped to 15% at phase B-II and subsequent decrease to ~10% after the 350-day BES operation. The cathodic CE showed over the 850% after phase B-IV, while another way of CEcathode calculation (consumed electron per methane production) showed that only 11–12% of the methane was generated via current consumption with electromethanogenic reaction in reactor B (Table 1). These poor CEs indicate that current-independent methanogenesis mainly carried out during the operational periods from phase B-II to phase B-V.
During the long-term operations, anodic, cathodic, and whole electrochemical cell polarization curves were determined three times via step-wise increase by 50 mV of applied voltages (Figure 3). The current generation trends were notably different over 300 mV of applied voltage among the three operational phases (Figure 3A), implying that different internal resistances were yielded by the biocatalytic features on both electrodes. Current generation was first observed at 120 mV of applied voltage, −320 mV vs. SHE of anode potential, and −440 mV vs. SHE of cathode potential, respectively (Figure 3B). The anode potential was stable by the −320 mV vs. SHE between 100 mV and 350 mV of applied voltage, suggesting that the anode potential was controlled by the anodic biocatalytic reaction of acetate-oxidizing electrode reduction. In fact, the operational anode potential during the batch cycle with 600 mV of applied voltage suddenly changed from −250 mV to 0 mV vs. SHE when acetate was totally consumed (Supplementary Figure S1B). In contrast, the cathode polarization curve showed consistent decrease with more voltage input to reach −800 mV vs. SHE, which allowed hydrogen production on the cathode. These results imply that anodic biocatalytic reaction with acetate oxidation was a key for producing hydrogen on the cathode and achieving the electromethanogenic reaction in the BES reactors.
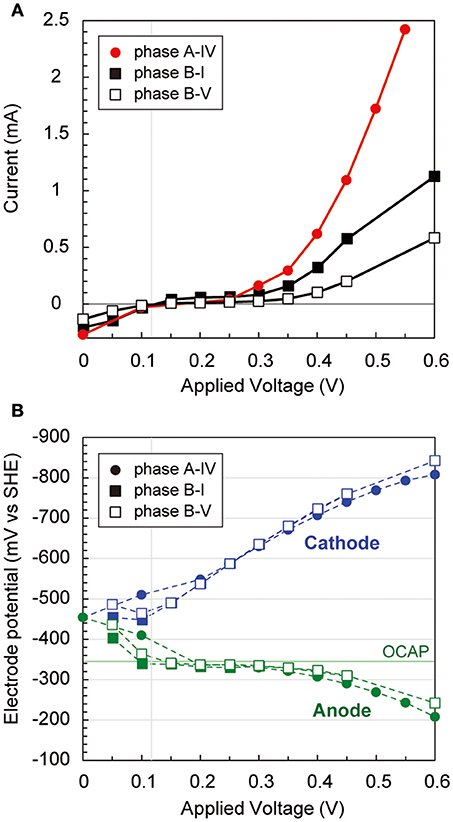
Figure 3. Polarization curves via potential step voltammetry in the electromethanogenic BESs. (A) During potential step voltammetry, current generation after 5 min (for reactor a) or 15 min (for reactor b) with applying different voltages is plotted for different phases of the BESs (box for labels). (B) Anodic (blue dashed lines and blue labels) and cathodic (green dashed lines and green labels) potentials are plotted during the potential step voltammetry. OCAP indicates open circuit anode potentials.
Microbial Community Dynamics
To compare microbial community composition dynamics of the anode biofilm, cathode biofilm and planktonic cells, we conducted SSU rRNA gene-based tag-sequencing (iTAG) analysis for the samples collected at day 56 (time 1), day 132 (time 2), day 280 (time 3, only for reactor B), day 307 (time 4), and day 561 (time 5) (Figure 2). The iTAG analysis was also performed from the stored formation water samples KTG1, KTG2, and KTG3, which functioned as inoculum sources for the enrichments. The phylum- or class-level community compositions clearly revealed that only three taxonomic groups, Gammaproteobacteria (25%), Deltaproteobacteria (19%), and Euryarchaeota (19%), were highly abundant within the BES reactors (Figure 4). As minor members in the BES communities, Synergistetes (9%), Alphaproteobacteria (4%), and Bacteroidetes (4%) were also frequently seen. In total, these six taxa accounted for about 80% of the BES communities established from subsurface natural gas-associated microbiome throughout the long-term operation.
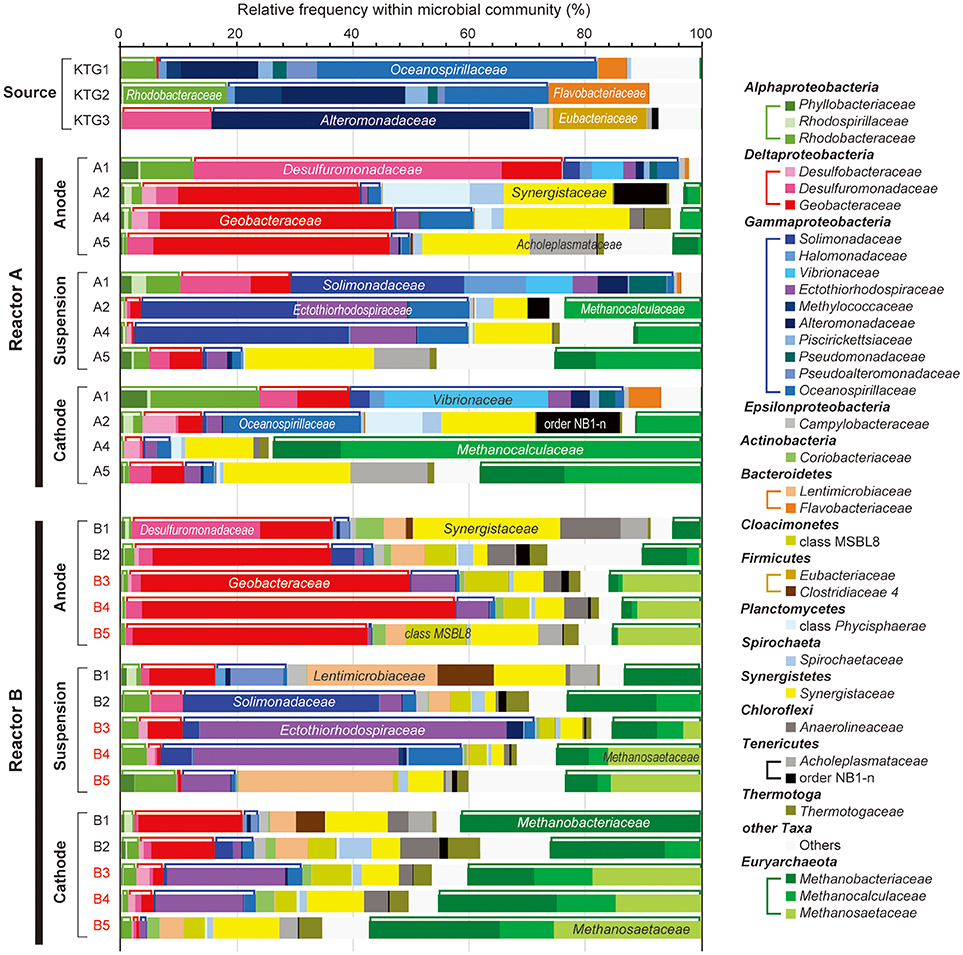
Figure 4. Taxonomic distributions of 16S rRNA community profile within anode biofilm, suspension, and cathode biofilm of electromethanogenic BESs. The family-level taxonomic profiles (three unclassified families are shown by using upper level taxonomy) for anode biofilms (Anode), planktonic cell suspensions (suspension) and cathode biofilm (Cathode) within the duplicate BESs at day 56 (1), day 132 (2), day 280 (3), day 310 (4), and day 566 (5) of enrichment, and the original inoculum source of formation water at different natural gas production wells (Source). Several abundant families are also described in the bars. Class Alphaproteobacteria, Deltaproteobacteria, Gammaproteobacteria, and phylum Euryarchaeota are tied by brackets above the bars.
With regard to the class Deltaproteobacteria, only two families, Desulfuromonadaceae and Geobacteraceae, were abundant in the BES reactors, with the former dominating in the early stages of enrichment, and the Geobacteraceae increasing to nearly 50% at later stage of the enrichments (Figure 4). In phylum Euryarchaeota, three families, Methanobacteriaceae, Methanocalculaceae, and Methanosaetaceae, occupied 40–70% of the cathode biofilms after 250-day operation (Figure 4). Interestingly, the family Methanosaetaceae was only seen after the 3-day disconnection event that occurred between B2 and B3 in reactor B, and these cells were also seen in the anode biofilm and as planktonic cells. In class Gammaproteobacteria, ten different families were frequently shown in the BES reactors. Within them, the families Solimonadaceae and Ectothiorhodospiraceae were initially abundant in the planktonic cells to occupy over 40%. Although the families Alteromonadaceae and Oceanospirillaceae were highly dominant in the source formation waters (Figure 4), they were never seen as dominant forms in any of the enrichments. The portion of the two Gammaproteobacteria families decreased to only ~10% after the long-term enrichment.
Correlation Between Microbial Families and Locations
Weighted canonical correspondence analysis (wCCA) is a comparative evaluation tool that can be used to represent correlations between key environmental variables, such as locations (anode, cathode or planktonic), inocula, operation time, and associated microbial taxa compositions (Ishii et al., 2013b, 2014, 2017; Suzuki et al., 2013). Figure 5A shows associations between the variables as five vectors and highly abundant families in reactor A with weighting by sum of relative frequencies, while Figure 5B shows associations between the valuables and abundant microbial families in reactor B. As expected, the relatively abundant families in the inoculated formation water (Alteromonadaceae, Flavobacteriaceae, Oceanospirillaceae, and Rhodobacteraceae) were not associated with neither the operational time nor any of the locations in both BES enrichments.
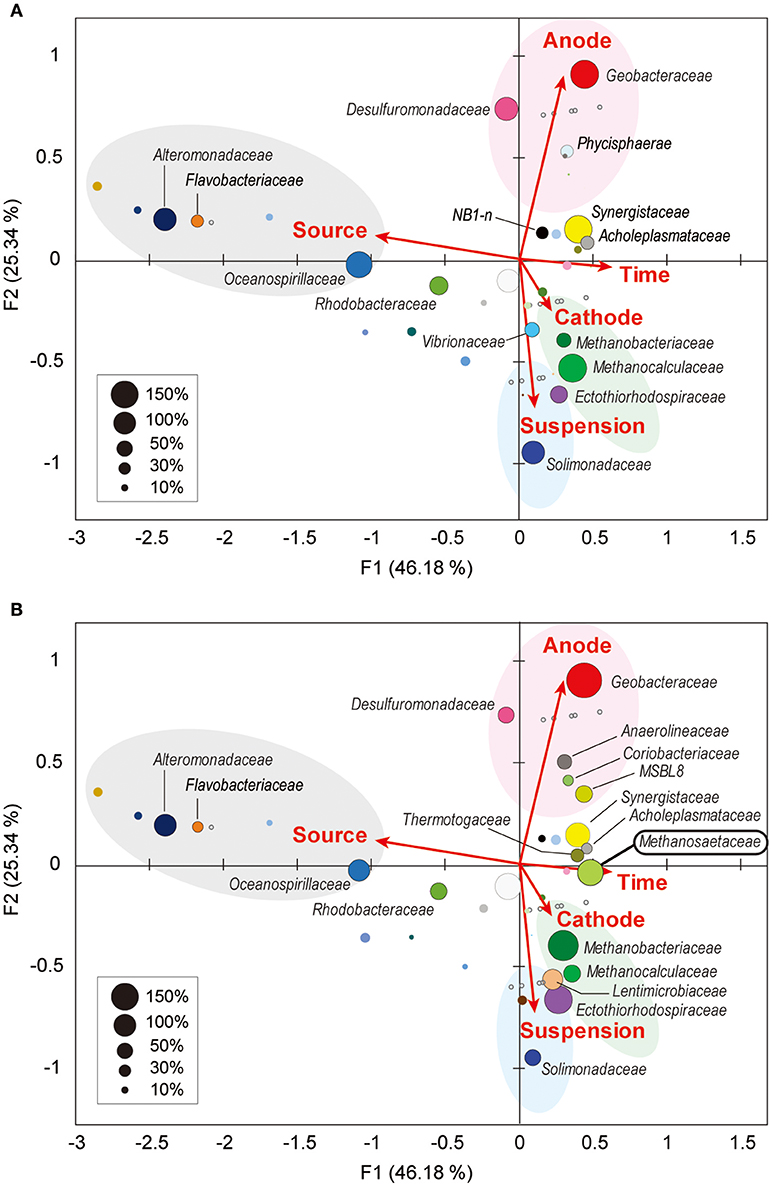
Figure 5. Weighted canonical correspondence analysis (wCCA) diagram correlating microbial taxa and the environmental factors. wCCA diagrams show relationships between operational variables (red arrows) and dominant microbial taxa (filled bubbles) in BES reactor A (A) and reactor B (B). The bubble colors indicate families that described in Figure 4. Bubble sizes indicate sum of relative frequencies (%) within the microbial community analyses for each reactor with the inoculated formation waters (maximum 1,500% for reactor A, and 1,800% for reactor B). Family names of the taxa of the abundant members (sum of relative frequencies over 20%) are depicted near bubbles, and the full list of the family names is shown in Supplementary Figure S5. Gray open circles indicate samples for microbial community analyses.
Among the three locations, two Deltaproteobacteria families (Geobacteraceae and Desulfuromonadaceae) were clearly correlated with anode biofilms in both BES reactors, while family Geobacteraceae became more abundant with time (Figure 5). This trend indicates that family Geobacteraceae was more functional within the electrogenic anode biofilms. Two Gammaproteobacteria families were associated with the planktonic niche, while family Solimonadaceae was more frequent in reactor A and Ectothiorhodospiraceae was abundantly observed in reactor B. Two Euryarchaeota families (Methanobacteriaceae and Methanocalculaceae) were tightly associated with cathode biofilm, suggesting that these two families were both important groups for the electromethanogenic reactions on the cathode. Strikingly, we found that another Euryarchaeota family, Methanosaetaceae, which was only shown in the poorly electromethanogenic reactor B and tightly correlated with the time valuable (Figure 5B). This trend is consistent with what Methanosaetaceae microbe was only presented after the 3-day disconnection event in reactor B.
OTUs in the Electromethanogenic and Electrogenic Communities
Figure 6 shows the OTUs (>97% cut-off value) that were abundant in the three different niches in the BES reactors. The minor OTUs (i.e., lower relative abundance) are summarized in Supplementary Table S1. The preferable location (anode, cathode, biofilm, suspension, or source) was estimated from the wCCA diagram (Supplementary Figure S6) by using all 84 OTUs. These abundant OTUs occupied 84–98% of the community compositions for all thirty communities (Supplementary Table S1).
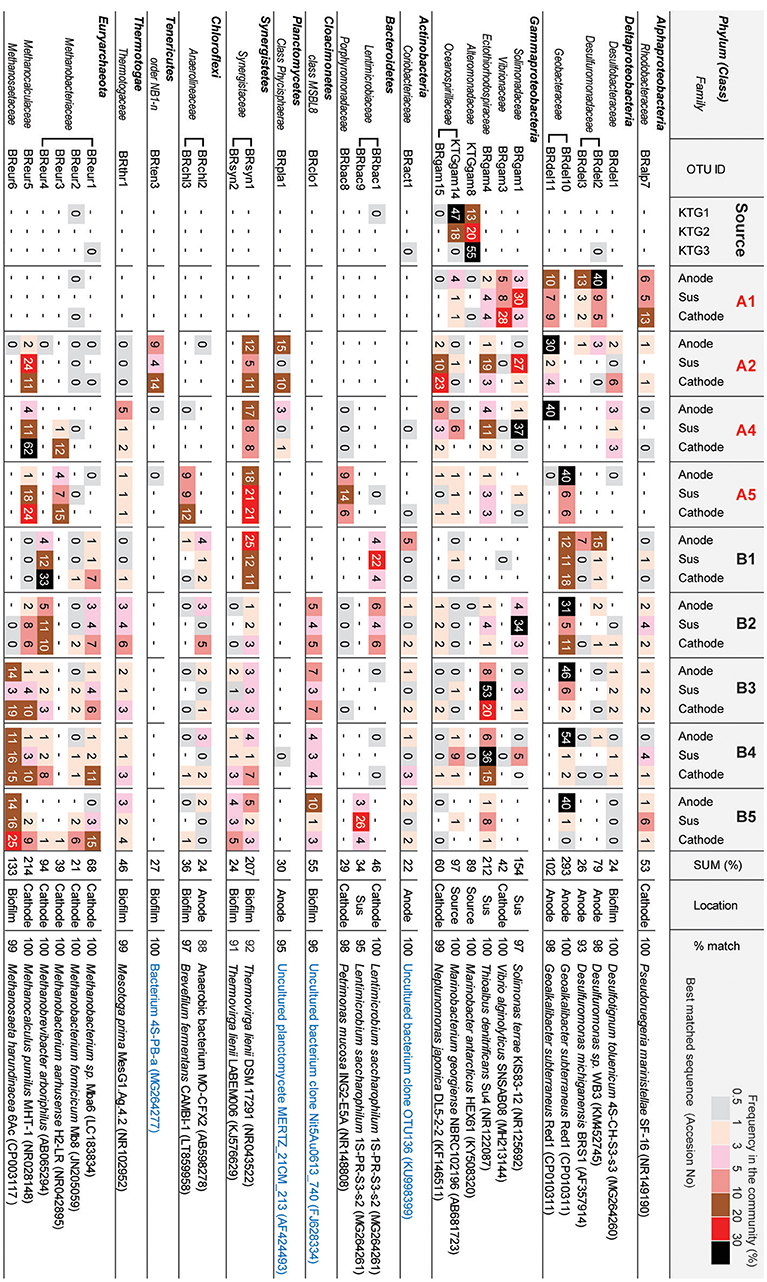
Figure 6. Heatmap table of major phylotypes in the microbial communities. The major phylotypes were selected as those with frequencies that summed to over 20% in all 30 clone libraries. The calculation of frequency (%) was conducted based on Supplemental Table S1. Best matched sequence was identified by BLAST to nr/nt excluding Uncultured/environmental sample sequences (black letters) or including them (blue letter).
In class Deltaproteobacteria, eleven different OTUs were enriched in anode biofilms of both BES reactors, and five were relatively abundant (Figure 6). The dominance of these OTUs changed over time from two Desulfuromonadaceae OTUs (BRdel2 and BRdel3) to two Geobacteraceae OTUs (BRdel10 and BRdel11). From their phylogenetic positions, highly abundant Geobacteraceae OTUs are both affiliated to genus Geoalkalibacter, while the Desulfuromonadaceae OTUs BRdel2 and BRdel3 were not affiliated with any known genus (Figure 7).
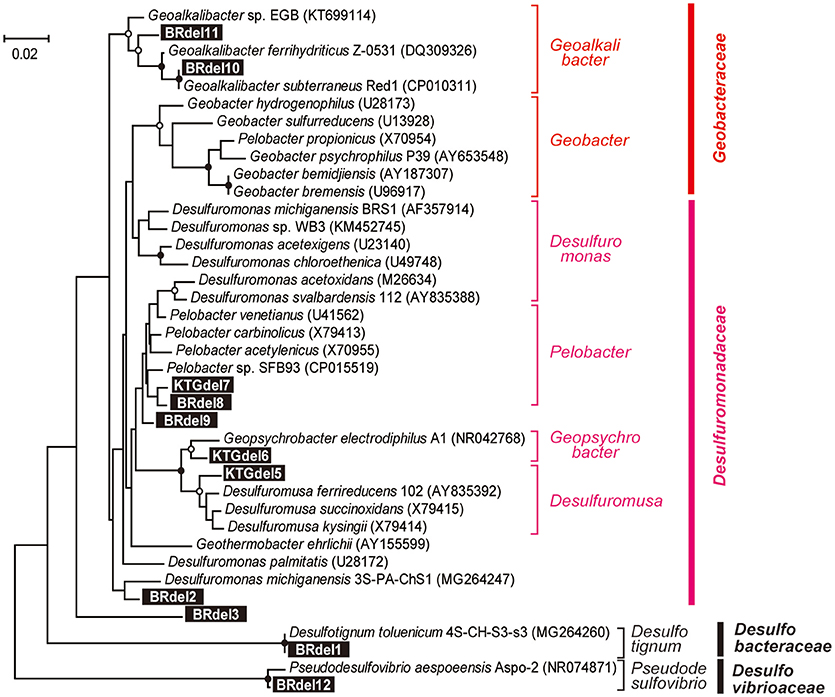
Figure 7. Maximum likelihood based phylogenetic trees showing positions of major DIET-related Deltaproteobacteria OTUs representing anodic electrogenic microbial populations. Branch points supported with bootstrap values (100 trials) of >90% are indicated with closed circles, while those between 70 and 90% are indicated with open circles. Accession numbers of reference sequences are indicated in parentheses.
In the phylum Euryarchaeota, six different OTUs were observed mainly in the cathodic biofilm (Figure 6); three of these OTUs were placed in the genus Methanobacterium, and one each to the genera Methanobrevibacter, Methanocalculus, and Methanosaeta (Figure 8). From them, the Methanosaeta OTU BReur6 was comprised over 10% at all three locations only in the reactor B after the disconnection event, which trends are likely correlated with the lower coulombic efficiency of reactor B.
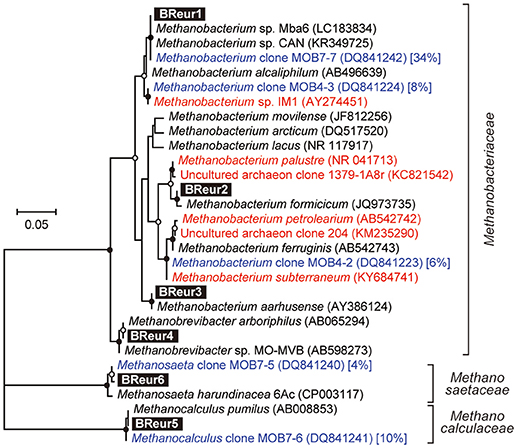
Figure 8. Maximum likelihood based phylogenetic trees showing positions of major DIET-related Euryarchaeota OTUs representing cathodic electromethanogenic microbial populations. Branch points supported with bootstrap values (100 trials) of >90% are indicated with closed circles, while those between 70 and 90% are indicated with open circles. Accession numbers of reference sequences are indicated in parentheses. Euryarchaeal clones observed in different formation water from Minami-Kanto gas field (Mochimaru et al., 2007) were highlighted by blue letter, and the relative frequency within the formation water (%) was described after accession number. Methanobacterium clones observed in other electromethanogenic community or iron-oxidizing methanogenic community were highlighted by red letter.
In the class Gammaproteobacteria, eighteen different OTUs were found to be community members at source formation water and/or suspended cells in the BES reactors (Supplementary Table S1), while six OTUs were relatively abundant among them (Figure 6). Two OTUs, Marinobacter KTGgam8 and Marinobacterium KTGgam14, comprised over 40% of the inoculum community, but these OTUs decreased the frequencies in all locations of both BES reactors. Two different OTUs, Solimonas BRgam1 and Thioalbus BRgam4, were highly abundant in the planktonic niches of both BES reactors; however, both OTUs decreased their relative frequencies in later stages of the enrichment process (Figure 6). Thus, while diverse Gammaproteobacteria OTUs were introduced from the formation water, they were not seen at later stages, and it is unlikely that these taxa play an important role in electrogenic or electromethanogenic biofilms.
SEM Observation of Anodic and Cathodic Biofilms
In order to examine the morphology of EET-active anode and cathode biofilms in both BES reactors, biofilm samples were taken on day 516 (phase A-V or B-V, time 5 for the community analyses) and subjected to observe by using a FE-SEM. Focused ion beam (FIB) equipped with the FE-SEM was used for cutting the biofilms to observe the cross-sectional images (Supplementary Figures S7, S8). The electron micrographs of reactor A (Figure 9) and reactor B (Figure 10) revealed different biofilm morphologies, electrode surface structures, and cell shapes for the two reactors.
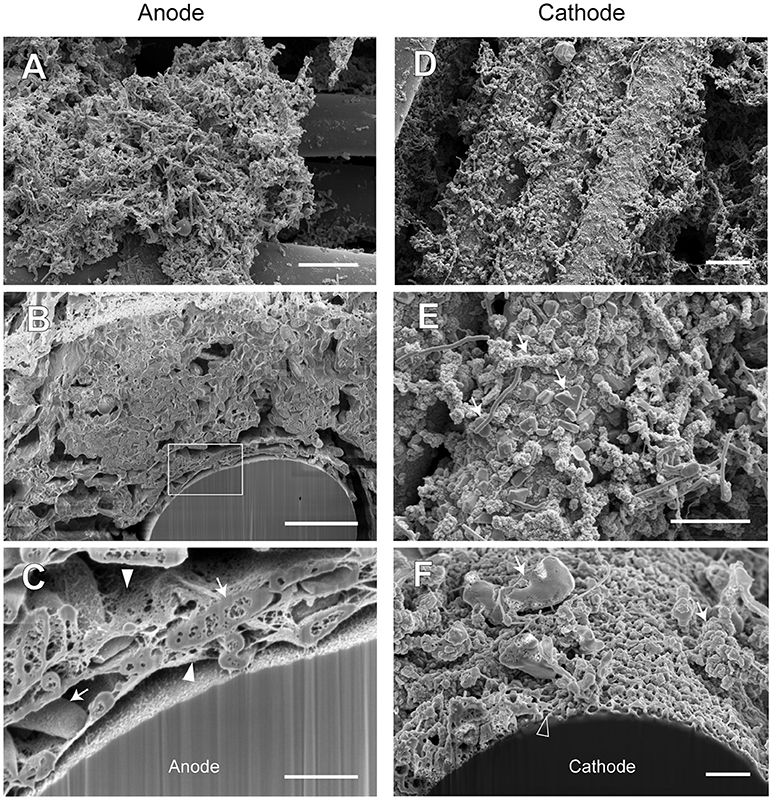
Figure 9. FE-SEM images for anode and cathode biofilms adhering onto carbon cloth electrodes in the electromethanogenic BES reactor A. Anode (A–C) and cathode (D–F) samples were collected from BES reactor A after 19-month enrichment process. B,C,F are cross-section images of biofilms that were processed by a focused ion beam, and (C) shows a magnified image near electrode [rectangle region in (B)]. Arrows in (C,E,F) indicate microbes close to the electrodes. Filled arrowheads in (C) indicate filamentous mat structures in the anode biofilm, while open arrowhead in (F) indicates mesh-patterned structure in the cathode surface. Bars (A,D) = 10 μm. Bars (B,E) = 5 μm. Bars (C,F) = 1 μm.
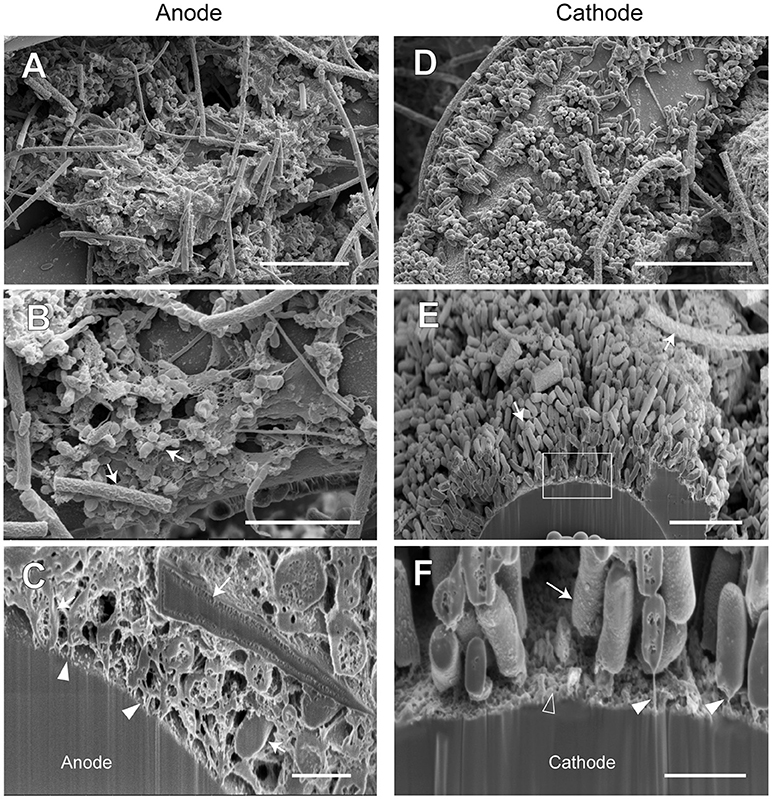
Figure 10. FE-SEM images for anode and cathode biofilms adhering onto carbon cloth electrodes in the electromethanogenic BES reactor B. Anode (A–C) and cathode (D–F) samples were collected from BES reactor B after 19-month enrichment process. B,E,F are cross-section images of biofilms that were processed by a focused ion beam, and (F) shows a magnified image near electrode [rectangle region in (E)]. Arrows in B,C,E,F indicate microbes close to the electrodes. Filled arrowheads in (C,F) indicate filamentous structures in the anode biofilm, while open arrowhead in (F) indicates heterogeneous deposit on the cathode surface. Bars (A, D) = 10 μm. Bars (B, E) = 5 μm. Bars (C, F) = 1 μm.
In reactor A, the anode biofilm was attached on graphite fibers in the form of big aggregates along with morphologically different microbes at the surface of the aggregates (Figure 9A), while the cross-sectional image showed the dense anode biofilm with thickness of 10 to 50 μm (Supplementary Figure S7B) and the unique rod-shaped microbe inside the biofilm (Figure 9B). On the other hand, the cathode biofilm was fully covered with single-layered microbes (Figure 9D), and three different morphologies (irregular coccoid, thin filament, and rod-shaped with a lot of membrane vesicles) were seen on the covered microbes in the vicinity of the carbon fibers (Figure 9E). The dense biofilms were also observed sparsely at the interspace of the graphite fiber (Supplementary Figure S7C). Magnified electron micrographs after FIB cutting revealed the presence of a filamentous mat structure of thin, thread-like appendages in the anode biofilms that connected microbial cells to one another, and to the anode electrode (Figure 9C), while the mesh-patterned structure was seen as a visible layer on the cathode surface (Figure 9F). These images indicate that different types of microbes performed EET process from/to the electrodes by using different ways in the BES reactor A.
In reactor B, different biofilm morphologies were observed on both anode and cathode electrodes, where the surfaces of bio-mats were fully covered by cylindrical microbes (Supplementary Figure S8). Below the cylindrical microbes, the egg-shaped microbes with thin filamentous appendages were abundantly observed inside the anode biofilm (Figures 10A,B), while the rod-shaped microbes formed an orderly single-layered biofilm onto the cathode (Figures 10D,E). The magnified cross-sectional image of the anode revealed the bridges between microbial cells and the electrodes by using the filamentous appendages (Figure 10C), while that of the cathode revealed the bridge between the rod-shaped microbe and the electrode by using polar filaments (Figure 10F).
The SEM observations revealed a variety of filamentous structure in the anode and cathode biofilms, and the filaments seem to be important for the EET processes between microbes and electrodes in the electromethanogenic BES reactors.
Discussion
The Minami-Kanto gas field, where gases are dissolved in seawater-based formation water, is characterized by the accumulation of biogenic methane in subsurface marine turbidite sand layers interbedded with mud layers (Mochimaru et al., 2007; Katayama et al., 2015; Sano et al., 2017). Here, we report for the fist time, the long-term electromethanogenic processes at ambient temperature and associated EET-active community members enriched from subsurface microbiome in the seawater-based formation water (Table 2). Duplicate BES reactors were operated for 21 months, and we successfully stimulated and enriched DIET-associated members of the subsurface microbes where methane is naturally produced biologically (Mochimaru et al., 2007; Katayama et al., 2015; Sano et al., 2017). Even though three methanogenic pathways are possible when acetate was amended as a substrate to the BES operation (Figure 1A, Equations 1–5), EET-related electromethanogenesis was highly dominant (CE >80%) in reactor A (Table 1), which implies stimulation of DIET via voltage input outcompeted other two typical methanogenic pathways, hydrogenotrophic methanogenesis with syntroph and aceticlastic methanogenesis. However, in reactor B, the electromethanogenesis was remarkably limited (CE <15%) when electron flow was accidentally stopped for 3 days (Table 1). The electromethanogenic performance was not recovered even after re-establishment of the voltage to the electrodes, indicating that the activation of the other competitive reactions (Equations 3–5) was irreversible. The effect of no EET flow in the BES reactor and electromethanogenesis-related microbial community functions are separately discussed as below.
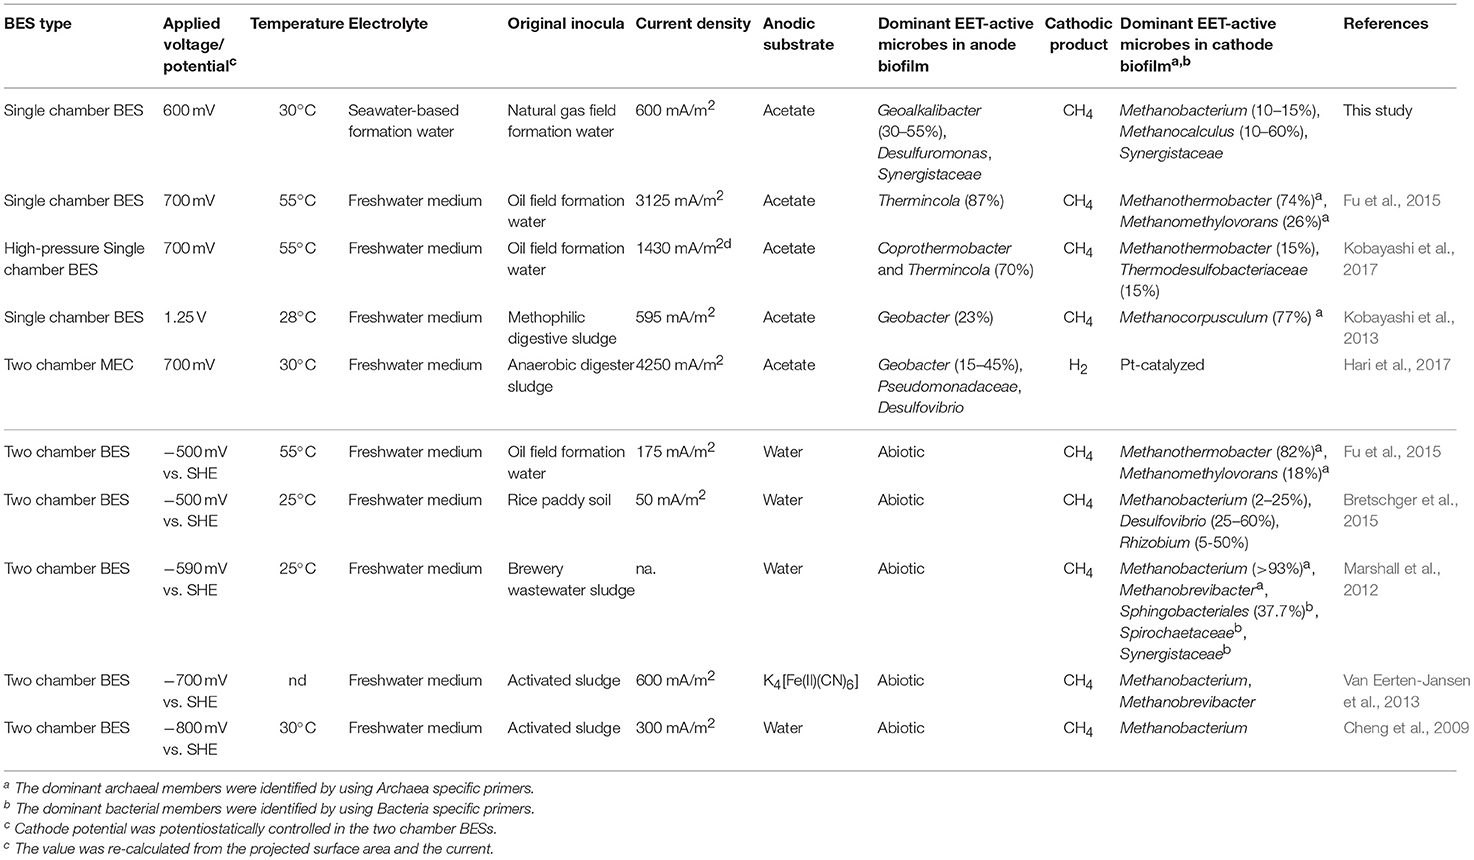
Table 2. Comparison of this work with other studies dealing with microbial community analyses in voltage-applied BESs and electromethanogenic BESs.
Effect of No Electron Flow to Electromethanogenic Community
For an electromethanogenic biocathode community, Bretschger et al reported similar trends to show 87% drop in volumetric methane production rates after 45-min open-circuit perturbation, and recovery of the electromethanogenic performance after four months under poised-potential operation (Bretschger et al., 2015). On the other hand, we have also studied the effects of open-circuit no-EET stimulus to the electrogenic communities by using state-of-the-art Meta-Omics approaches, demonstrating that EET-active microbes quickly sensed and responded to the stimulus (Ishii et al., 2013a, 2015, 2018). These previous observations suggest that EET-active microbes are quite sensitive to an open-circuit perturbation that halts EET between microbes and electrodes.
After the open-circuit event in reactor B, the abrupt increase at all locations of the relative abundances of the euryarchaeal OTU BReur6 (affiliated to the genus Methanosaeta) were seen (Figure 6). In addition, the associated abrupt drops of both anodic and cathodic CEs were only shown after the open-circuit perturbation (Table 1). The SEM images of both anodic and cathodic biofilms revealed cylindrical microbes, similar in morphology to the marine Methanosaeta strain (Kita et al., 2016), only in reactor B (Supplementary Figure S8), and the cylindrical microbes did not adhere to the electrode surface as well as EET-active biofilms (Figure 10). These results imply that OTU BReur6 was not involved with EET on the electrodes (Figure 1A). The genus Methanosaeta was originally reported to be a strict aceticlastic methanogen (Equation 3) (Smith and Ingram-Smith, 2007). Recently, co-cultures of Methanosaeta harundinacea and electrogenic Geobacter metallireducens were shown to convert ethanol to methane via interspecies electron and acetate transfers, suggesting that DIET is possible for at least one member of the genus Methanosaeta (Rotaru et al., 2014). Our results demonstrate that the enriched subsurface Methanosaeta OTU BReur6 did not carry out DIET or EET, leading to poor electromethanogenic performance on the cathode. The high abundance of Methanosaeta was only shown in reactor B, and the population did not decrease with time even after reconnection of the electric circuit (Figures 4–6). We suspect that the higher amounts of the aceticlastic Methanosaeta population will increase tolerance or accelerate their metabolic rates, and they are possible to overcome the electrode-assisted electromethanogenic metabolism in reactor B.
Electromethanogenic Microbes on Cathode Biofilm
Our community dynamics analyses and the associated wCCA diagrams clearly show that family Methanobacteriaceae, including genera Methanobacterium and Methanobrevibacter, were key methanogenic members responsible for the electromethanogenic reaction on the cathode (Figures 4–6, Supplementary Figure S5). Although the genus Methanobacterium is known as a hydrogenotrophic methanogen (Thauer et al., 2008), the genus has been frequently observed within electromethanogenic cathode biofilms that carry out methanogenesis from e−/H+/CO2 (Siegert et al., 2015; Blasco-Gómez et al., 2017) (Table 2). The phylogenetic positions of the dominant Methanobacterium OTUs in our BES reactors revealed that the most frequently observed OTUs (BReur1 and BReur3) were different from reported electromethanogenic Methanobacterium microbes but close relatives of the subsurface methanogens enriched from the Minami-Kanto Gas Field (Mochimaru et al., 2007) or isolated from marine sediments (Shlimon et al., 2004) (Figure 8). Thus, previously unidentified subsurface electromethanogenic Methanobacterium microbes were enriched in our BES operation fed with seawater-based formation water from natural gas field.
The genera Methanocalculus and Methanobrevibacter, which are reported to be strictly hydrogenotrophic methanogens (Equation 1) (Thauer et al., 2008), were also abundant in cathode biofilms (Figures 4–6). The direct attachment on the cathode electrode of many irregular clumps (Figures 9E,F) similar to Methanocalculus (Sorokin et al., 2015) suggests that this methanogen was playing a role in the electromethanogenic cathode of the reactor A, although this genus has not been reported in electromethanogenic communities (Blasco-Gómez et al., 2017) (Table 2). The phylogenetic positions of the BReur4 and BReur5 (Figure 8) revealed close relationship to the methanogens enriched from the Minami-Kanto Gas Field (Mochimaru et al., 2007) or isolated from sub-seafloor sediments (Imachi et al., 2011), which also implies that seawater-based formation water of the natural gas field introduced electromethanogenic archaea different from frequently observed Methanobacterium and Methanothermobacter (Table 2).
Two EET mechanisms have been proposed for the electromethanogenic reaction on a poised cathode electrode; one is direct electron uptake from the electrode to methanogens, the other is hydrogen/formate production on the cathode followed by a hydrogenotrophic methanogenic reaction (Blasco-Gómez et al., 2017). Our polarization analyses indicate that a cathodic potential of −800 mV vs. SHE at an input voltage of 600 mV (Figure 3) allowed hydrogen production on the cathode. Hydrogen-mediated methanogenesis was thereby made possible for the enriched subsurface methanogens. In contrast, the electromethanogenic biocathodes revealed single-layered biofilms anchored on the carbon fiber via filamentous appendages (Figures 9, 10). The inclusion among the cathodic communities of numerous (>40%) methanogenic microbes suggests that direct electron transport from the electrode to the methanogens likely occurred in addition to hydrogen-mediated methanogenesis as reported elsewhere (Uchiyama et al., 2010; Lohner et al., 2014). Identification of the mechanism associated with the electromethanogenic reaction will require further investigation via electrochemical, biocatalytic, and MetaOmics analyses.
Acetate-Oxidizing Electrogenesis in Anode Biofilm
In the acetate-consuming electrogenic anodes, SEM images revealed remarkably thick biofilms with pili-like filamentous structures intertwined among the microbes and also between the electrode and microbes (Figures 9, 10). Such morphologies have frequently been observed in EET-active anodic biofilms dominated by model acetate-oxidizing electrogenic Geobacter microbes (Ishii et al., 2008, 2014; Torres et al., 2009; Lovley, 2012). However, none of the abundantly observed Deltaproteobacteria OTUs was affiliated with genus Geobacter in this study (Figure 7). The two highly abundant OTUs in the anode biofilms were closely related to Geoalkalibacter subterraneus, which was isolated from a petroleum reservoir as an anaerobic metal reducing bacterium (Greene et al., 2009). The Geoalkalibacter microbe has also been used as a halophilic, anode-respiring bacterium for electricity production in a BES reactor with a controlling anode potential of +200 mV vs. SHE (Carmona-Martínez et al., 2013), which produced a higher current density (4.7 A/m2) under saline conditions (3.5% NaCl) compared to the current density in this study (0.2–0.6 A/m2, Table 1). The lower anode potential (−250 mV vs. SHE) in our BES reactors (Figure 3) and/or lower biocatalytic activity for cathodic electromethanogenic reaction may contribute to the difference.
In the early stage of the BES operation, various Desulfuromonadaceae OTUs dominated the electrogenic anode communities, but the two Geoalkalibacter OTUs subsequently became the key electrogenic microbial members (Figures 4–6). The shift of dominant Deltaproteobacteria members from Desulfuromonadaceae to Geobacteraceae was a common occurrence throughout community development in the BES reactors (Ishii et al., 2014, 2017). Holmes et al. reported that various Desulfuromonas phylotypes are enriched in an electrogenic biofilm inoculated with marine and saltmarsh sediments (Holmes et al., 2004). These features imply that these two genera, Geoalkalibacter and Desulfuromonas, likely function as an electrogenic microbe under saline conditions such as the formation waters of the natural gas field. The salinity of the formation water was seawater level (~50 mS/cm), while that of freshwater medium was only ~4 mS/cm (Ishii et al., 2014). This difference likely introduce Geoalkalibacter and Desulfuromonas microbes in the electrogenic anodic communities in this study instead of well-known Geobacter microbes (Table 2).
Features of Planktonic Cells
In the planktonic cells of the BES reactors and the inoculated formation waters, diverse Gammaproteobacteria OTUs were shown (Figure 6, Supplementary Table S1), and many of them are affiliated with well-characterized marine bacteria (Evans et al., 2008; Miyazaki et al., 2008). This result is appropriate for the enrichment process in the seawater-based formation water. Several Gammaproteobacteria microbes have been thoroughly studied as electrogenic microbes, including Shewanella oneidensis (Fredrickson et al., 2008) and Aeromonas hydrophila (Pham et al., 2003). In contrast, several marine Gammaproteobacteria species have been reported as electrotrophic members within biocathodic biofilms that consumed electrons via oxygen respiration: namely, “Ca. Tenderia electrophaga” in the family Chromatiaceae (Wang et al., 2015; Eddie et al., 2017) and Marinobacter spp. in the family Alteromonadaceae (Strycharz-Glaven et al., 2013). Although oxygen was not provided in this study, the appearance of diverse Gammaproteobacteria species in our BES system (Figure 6) suggests that they might be involved in the EET reaction by using another electron donor/acceptors.
Rare Microbial Taxa
OTUs belonging to phyla Synergistetes, Chloroflexi, and Bacteroidetes were frequently observed in the electromethanogenic BES reactors (Figure 6). The family Synergistaceae in phylum Synergistetes was abundantly observed in the reactor A, and the family has been reported as amino acid degraders (Dahle and Birkeland, 2006; Jumas-Bilak et al., 2009). Several microbes affiliated with family Anaeroliniaceae in phylum Chloroflexi were frequently observed in both anode and cathode biofilms (Figure 6). Members of this family are know to be fermenters, consuming sugars and/or peptides (Yamada et al., 2006), and have been documented as members of methanogenic consortia from deep subsurface microbiomes (Imachi et al., 2011) (Supplementary Table S1). The general role of Bacteroidetes (which were also commonly seen in the BES reactors) is the fermentation of sugars (Xu et al., 2003). The potential metabolic capabilities of these three taxa suggest that they may play important roles in stabilizing biofilms via degradation of cell lysate released by dead cells, secondary metabolites, and excess polysaccharide produced by other microbes.
Electromethanogenesis by Subsurface Microbiome
Deep subsurface biosphere is one of the frontiers for examining the DIET process to convert organic compounds to biogenic methane. If the DIET-related methanogenesis is occurring in subsurface environments, the process is possible to be stimulated by voltage addition in BES reactors. Recently, Sato et al. (2013) have proposed storing CO2 in a subterranean geological reservoir and biologically converting the stored CO2 to methane via in situ electromethanogenesis. Electromethanogenesis in a thermophilic, single-chamber BES under high-pressure conditions has been successfully carried out with an inoculation of subsurface microbes in the formation water from a petroleum reservoir. Electrogenic bacteria affiliated with the genus Thermincola were present on the anode, and a thermophilic methanogen belonging to the genus Methanothermobacter was present on the cathode (Kobayashi et al., 2017) (Table 2). The temperatures of used formation waters in this study are much lower (15–35°C) than the temperature of oil reservoir formation waters (45–91°C), while the formation waters at the Minami-Kanto gas field include a wide variety of methanogenic archaea among different production wells (Katayama et al., 2015). In this study, we identified that mesophilic subsurface methanogens affiliated with the genera Methanobacterium and Methanocalculus that enabled the electromethanogenic process to take place on the cathode, whereas the metabolism of mesophilic subsurface bacteria affiliated with the genus Geoalkalibacter released electrons on the anode. The taxonomic difference in the electromethanogenic enrichments between an oil reservoir and natural gas field was likely due to the different temperatures and salinity under the BES operations and/or in situ environments (Table 2).
Conclusion
We successfully stimulated EET-active subsurface microbes from the Minami-Kanto Gas field, and enriched the DIET-associated electromethanogenic microbes in the BES reactor. We used community dynamics and statistical analyses to correlate the genera Methanobacterium, Methanobrevibacter, and Methanocalculus with the electromethanogenic biocathode, while the genera Geoalkalibacter and Desulfuromonas were dominant at the acetate-oxidizing electrogenic bioanode. The genus Methanosaeta was a major competitor for the DIET-associated members by performing aceticlastic methanogenesis. The dominance of the Methanosaeta was induced by only a three day period of no-electron-flow (open circuit), and was not reversed by the voltage application during the time of our experiment. These discoveries are important for understanding the fundamental nature of EET-active communities established from an active subsurface microbiome. In addition, these DIET-associated subsurface microbiomes and the BES bioreactor system would be possible to apply bioelectrochemical power-to-gas (BEP2G), which is a potentially convenient way of storing renewable surplus electricity in the form of methane (Geppert et al., 2016). We will use MetaOmics approaches to further examine the metabolic roles and EET mechanisms in the electrogenic/electromethanogenic members (Ishii et al., 2013a, 2015, 2018), and try to apply the processes for the BEP2G in the near future.
Author Contributions
SI designed and performed most of research. MO performed microbial community dynamics analysis. KU performed SEM observation. KK and DM performed formation water management. SI, HI, KN, and FI wrote the paper.
Conflict of Interest Statement
KK and DM were employed by Kanto Natural Gas Development Co., Ltd.
The remaining authors declare that the research was conducted in the absence of any commercial or financial relationships that could be construed as a potential conflict of interest.
Acknowledgments
We thank Takeru Ogatsu and Shoji Kunisue (Kanto Natural Gas Development Co., Ltd.) for supporting with the formation water sampling, Yuichi Hanada, Maya Hanada, Misako Utoh, and Kozue Mastuzaki for technical assistance in bioreactor construction, 16S rRNA sequencing and HPLC analyses. This work was supported by JSPS KAKENHI Grant Numbers 15H06906 and 17K19435.
Supplementary Material
The Supplementary Material for this article can be found online at: https://www.frontiersin.org/articles/10.3389/fenrg.2018.00144/full#supplementary-material
References
Bartlett, K. B., and Harriss, R. C. (1993). Review and assessment of methane emissions from wetlands. Chemosphere 26, 261–320. doi: 10.1016/0045-6535(93)90427-7
Blasco-Gómez, R., Batlle-Vilanova, P., Villano, M., Balaguer, M. D., Colprim, J., and Puig, S. (2017). On the edge of research and technological application: a critical review of electromethanogenesis. Int. J. Mol. Sci. 1:874. doi: 10.3390/ijms18040874
Bretschger, O., Carpenter, K., Phan, T., Suzuki, S., Ishii, S., Grossi-Soyster, E., et al. (2015). Functional and taxonomic dynamics of an electricity-consuming methane-producing microbial community. Bioresour. Technol. 195, 254–264. doi: 10.1016/j.biortech.2015.06.129
Caporaso, J. G., Kuczynski, J., Stombaugh, J., Bittinger, K., Bushman, F. D., Costello, E. K., et al. (2010). QIIME allows analysis of high-throughput community sequencing data. Nat Methods 7, 335–336. doi: 10.1038/nmeth.f.303
Carmona-Martínez, A. A., Pierra, M., Trably, E., and Bernet, N. (2013). High current density via direct electron transfer by the halophilic anode respiring bacterium Geoalkalibacter subterraneus. Phys. Chem. Chem. Phys. 15, 19699–19707. doi: 10.1039/c3cp54045f
Cheng, S. A., Xing, D. F., Call, D. F., and Logan, B. E. (2009). Direct biological conversion of electrical current into methane by electromethanogenesis. Environ. Sci. Technol. 43, 3953–3958. doi: 10.1021/es803531g
Dahle, H., and Birkeland, N. K. (2006). Thermovirga lienii gen. nov. sp. nov. a novel moderately thermophilic, anaerobic, amino-acid-degrading bacterium isolated from a North Sea oil well. Int. J. Syst. Evol. Microbiol. 56, 1539–1545. doi: 10.1099/ijs.0.63894-0
de Bok, F. A., Plugge, C. M., and Stams, A. J. (2004). Interspecies electron transfer in methanogenic propionate degrading consortia. Water Res. 38, 1368–1375. doi: 10.1016/j.watres.2003.11.028
Eddie, B. J., Wang, Z., Hervey, W. J., Leary, D. H., Malanoski, A. P., Tender, L. M., et al. (2017). Metatranscriptomics supports the mechanism for biocathode electroautotrophy by “Candidatus Tenderia electrophaga”. mSystems 2, e00002–e00017. doi: 10.1128/mSystems.00002-17
Edgar, R. C. (2010). Search and clustering orders of magnitude faster than BLAST. Bioinformatics 26, 2460–2461. doi: 10.1093/bioinformatics/btq461
Evans, F. F., Egan, S., and Kjelleberg, S. (2008). Ecology of type II secretion in marine gammaproteobacteria. Environ. Microbiol. 10, 1101–1107. doi: 10.1111/j.1462-2920.2007.01545.x
Fredrickson, J. K., Romine, M. F., Beliaev, A. S., Auchtung, J. M., Driscoll, M. E., Gardner, T. S., et al. (2008). Towards environmental systems biology of Shewanella. Nat. Rev. Microbiol. 6, 592–603. doi: 10.1038/nrmicro1947
Fu, Q., Kuramochi, Y., Fukushima, N., Maeda, H., Sato, K., and Kobayashi, H. (2015). Bioelectrochemical analyses of the development of a thermophilic biocathode catalyzing electromethanogenesis. Environ. Sci. Technol. 49, 1225–1232. doi: 10.1021/es5052233
Geppert, F., Liu, D. D., Van Eerten-Jansen, M., Weidner, E., Buisman, C., and Ter Heijne, A. (2016). Bioelectrochemical power-to-gas: state of the art and future perspectives. Trends Biotechnol. 34, 879–894. doi: 10.1016/j.tibtech.2016.08.010
Greene, A. C., Patel, B. K. C., and Yacob, S. (2009). Geoalkalibacter subterraneus sp nov., an anaerobic Fe(III)- and Mn(IV)-reducing bacterium from a petroleum reservoir, and emended descriptions of the family Desulfuromonadaceae and the genus Geoalkalibacter. Int. J. Syst. Evol. Microbiol. 59, 781–785. doi: 10.1099/ijs.0.001537-0
Hari, A. R., Venkidusamy, K., Katuri, K. P., Bagchi, S., and Saikaly, P. E. (2017). Temporal microbial community dynamics in microbial electrolysis cells - influence of acetate and propionate concentration. Front. Microbiol. 8:1371. doi: 10.3389/fmicb.2017.01371
Hirai, M., Nishi, S., Tsuda, M., Sunamura, M., Takaki, Y., and Nunoura, T. (2017). Library construction from subnanogram DNA for pelagic sea water and deep-sea sediments. Microbes Environ. 32, 336–343. doi: 10.1264/jsme2.ME17132
Holmes, D. E., Bond, D. R., O'neil, R. A., Reimers, C. E., Tender, L. R., and Lovley, D. R. (2004). Microbial communities associated with electrodes harvesting electricity from a variety of aquatic sediments. Microb. Ecol. 48, 178–190. doi: 10.1007/s00248-003-0004-4
Ijiri, A., Inagaki, F., Kubo, Y., Adhikari, R. R., Hattori, S., Hoshino, T., et al. (2018). Deep-biosphere methane production stimulated by geofluids in the Nankai accretionary complex. Sci. Adv. 4:eaao4631. doi: 10.1126/sciadv.aao4631
Imachi, H., Aoi, K., Tasumi, E., Saito, Y., Yamanaka, Y., Saito, Y., et al. (2011). Cultivation of methanogenic community from subseafloor sediments using a continuous-flow bioreactor. ISME J. 5, 1913–1925. doi: 10.1038/ismej.2011.64
Inagaki, F., Hinrichs, K. U., Kubo, Y., Bowles, M. W., Heuer, V. B., Hong, W. L., et al. (2015). Exploring deep microbial life in coal-bearing sediment down to ~2.5 km below the ocean floor. Science 349, 420–424. doi: 10.1126/science.aaa6882
Ishii, S., Kosaka, T., Hori, K., Hotta, Y., and Watanabe, K. (2005). Coaggregation facilitates interspecies hydrogen transfer between Pelotomaculum thermopropionicum and Methanothermobacter thermautotrophicus. Appl. Environ. Microbiol. 71, 7838–7845. doi: 10.1128/AEM.71.12.7838-7845.2005
Ishii, S., Kosaka, T., Hotta, Y., and Watanabe, K. (2006). Simulating the contribution of coaggregation to interspecies hydrogen fluxes in syntrophic methanogenic consortia. Appl. Environ. Microbiol. 72, 5093–5096. doi: 10.1128/AEM.00333-06
Ishii, S., Suzuki, S., Norden-Krichmar, T. M., Phan, T., Wanger, G., Nealson, K. H., et al. (2014). Microbial population and functional dynamics associated with surface potential and carbon metabolism. ISME J. 8, 963–978. doi: 10.1038/ismej.2013.217
Ishii, S., Suzuki, S., Norden-Krichmar, T. M., Tenney, A., Chain, P. S., Scholz, M. B., et al. (2013a). A novel metatranscriptomic approach to identify gene expression dynamics during extracellular electron transfer. Nat. Commun. 4:1601. doi: 10.1038/ncomms2615
Ishii, S., Suzuki, S., Norden-Krichmar, T. M., Wu, A., Yamanaka, Y., Nealson, K. H., et al. (2013b). Identifying the microbial communities and operational conditions for optimized wastewater treatment in microbial fuel cells. Water Res. 47, 7120–7130. doi: 10.1016/j.watres.2013.07.048
Ishii, S., Suzuki, S., Tenney, A., Nealson, K. H., and Bretschger, O. (2018). Comparative metatranscriptomics reveals extracellular electron transfer pathways conferring microbial adaptivity to surface redox potential changes. ISME J. 12, 2844–2863. doi: 10.1038/s41396-018-0238-2.
Ishii, S., Suzuki, S., Tenney, A., Norden-Krichmar, T. M., Nealson, K. H., and Bretschger, O. (2015). Microbial metabolic networks in a complex electrogenic biofilm recovered from a stimulus-induced metatranscriptomics approach. Sci Rep 5:14840. doi: 10.1038/srep14840
Ishii, S., Suzuki, S., Yamanaka, Y., Wu, A., Nealson, K. H., and Bretschger, O. (2017). Population dynamics of electrogenic microbial communities in microbial fuel cells started with three different inoculum sources. Bioelectrochemistry 117, 74–82. doi: 10.1016/j.bioelechem.2017.06.003
Ishii, S., Watanabe, K., Yabuki, S., Logan, B. E., and Sekiguchi, Y. (2008). Comparison of electrode reduction activities of Geobacter sulfurreducens and an enriched consortium in an air-cathode microbial fuel cell. Appl. Environ. Microbiol. 74, 7348–7355. doi: 10.1128/AEM.01639-08
Jumas-Bilak, E., Roudière, L., and Marchandin, H. (2009). Description of 'Synergistetes' phyl. nov. and emended description of the phylum 'Deferribacteres' and of the family Syntrophomonadaceae, phylum 'Firmicutes'. Int. J. Syst. Evol. Microbiol. 59, 1028–1035. doi: 10.1099/ijs.0.006718-0
Katayama, T., Yoshioka, H., Muramoto, Y., Usami, J., Fujiwara, K., Yoshida, S., et al. (2015). Physicochemical impacts associated with natural gas development on methanogenesis in deep sand aquifers. ISME J. 9, 436–446. doi: 10.1038/ismej.2014.140
Kato, S., Hashimoto, K., and Watanabe, K. (2012). Microbial interspecies electron transfer via electric currents through conductive minerals. PNAS 109, 10042–10046. doi: 10.1073/pnas.1117592109
Kato, S., Hashimoto, K., and Watanabe, K. (2013). Iron-oxide minerals affect extracellular electron-transfer paths of Geobacter spp. Microbes Environ. 28, 141–148. doi: 10.1264/jsme2.ME12161
Kita, A., Suehira, K., Miura, T., Okamura, Y., Aki, T., Matsumura, Y., et al. (2016). Characterization of a halotolerant acetoclastic methanogen highly enriched from marine sediment and its application in removal of acetate. J. Biosci. Bioeng. 121, 196–202. doi: 10.1016/j.jbiosc.2015.05.018
Kobayashi, H., Nagashima, A., Kouyama, M., Fu, Q., Ikarashi, M., Maeda, H., et al. (2017). High-pressure thermophilic electromethanogenic system producing methane at 5 MPa, 55°C. J. Biosci. Bioeng. 124, 327–332. doi: 10.1016/j.jbiosc.2017.04.001
Kobayashi, H., Saito, N., Fu, Q., Kawaguchi, H., Vilcaez, J., Wakayama, T., et al. (2013). Bio-electrochemical property and phylogenetic diversity of microbial communities associated with bioelectrodes of an electromethanogenic reactor. J. Biosci. Bioeng. 116, 114–117. doi: 10.1016/j.jbiosc.2013.01.001
Kvenvolden, K. A. (1995). A review of the geochemistry of methane in natural gas hydrate. Organ. Geochem. 23, 997–1008. doi: 10.1016/0146-6380(96)00002-2
Lever, M. A., Rogers, K. L., Lloyd, K. G., Overmann, J., Schink, B., Thauer, R. K., et al. (2015). Life under extreme energy limitation: a synthesis of laboratory- and field-based investigations. FEMS Microbiol. Rev. 39, 688–728. doi: 10.1093/femsre/fuv020
Logan, B. E. (2009). Exoelectrogenic bacteria that power microbial fuel cells. Nat. Rev. Microbiol. 7, 375–381. doi: 10.1038/nrmicro2113
Lohner, S. T., Deutzmann, J. S., Logan, B. E., Leigh, J., and Spormann, A. M. (2014). Hydrogenase-independent uptake and metabolism of electrons by the archaeon Methanococcus maripaludis. ISME J. 8, 1673–1681. doi: 10.1038/ismej.2014.82
Lovley, D. R. (2012). Electromicrobiology. Annu. Rev. Microbiol. 66, 391–409. doi: 10.1146/annurev-micro-092611-150104
Lovley, D. R. (2017). Happy together: microbial communities that hook up to swap electrons. ISME J. 11, 327–336. doi: 10.1038/ismej.2016.136
Mao, C. L., Feng, Y. Z., Wang, X. J., and Ren, G. X. (2015). Review on research achievements of biogas from anaerobic digestion. Renew. Sust. Energy Rev. 45, 540–555. doi: 10.1016/j.rser.2015.02.032
Marshall, C. W., Ross, D. E., Fichot, E. B., Norman, R. S., and May, H. D. (2012). Electrosynthesis of commodity chemicals by an autotrophic microbial community. Appl. Environ. Microbiol. 78, 8412–8420. doi: 10.1128/AEM.02401-12
Martin, M. (2011). Cutadapt removes adapter sequences from high-throughput sequencing reads. EMBnet J 17, 10–12. doi: 10.14806/ej.17.1.200
Matthews, E., and Fung, I. (1987). Methane eission from natural wetlands: global distribution, area, and environmental characteristics of sources. Global Biogeochem. Cycles 1, 61–86. doi: 10.1029/GB001i001p00061
McGlynn, S. E. (2017). Energy metabolism during anaerobic methane oxidation in ANME Archaea. Microbes Environ. 32, 5–13. doi: 10.1264/jsme2.ME16166
Miyazaki, M., Nogi, Y., Fujiwara, Y., Kawato, M., Kubokawa, K., and Horikoshi, K. (2008). Neptunomonas japonica sp nov., an Osedax japonicus symbiont-like bacterium isolated from sediment adjacent to sperm whale carcasses off Kagoshima, Japan. Int. J. Syst. Evol. Microbiol. 58, 866–871. doi: 10.1099/ijs.0.65509-0
Mochimaru, H., Uchiyama, H., Yoshioka, H., Imachi, H., Hoaki, T., Tamaki, H., et al. (2007). Methanogen diversity in deep subsurface gas-associated water at the Minami-kanto gas field in Japan. Geomicrobiol. J. 24, 93–100. doi: 10.1080/01490450701266571
Nunoura, T., Takaki, Y., Kazama, H., Hirai, M., Ashi, J., Imachi, H., et al. (2012). Microbial diversity in deep-sea methane seep sediments presented by SSU rRNA gene tag sequencing. Microbes Environ. 27, 382–390. doi: 10.1264/jsme2.ME12032
Pham, C. A., Jung, S. J., Phung, N. T., Lee, J., Chang, I. S., Kim, B. H., et al. (2003). A novel electrochemically active and Fe(III)-reducing bacterium phylogenetically related to Aeromonas hydrophila, isolated from a microbial fuel cell. FEMS Microbiol Lett. 223, 129–134. doi: 10.1016/S0378-1097(03)00354-9
Quast, C., Pruesse, E., Yilmaz, P., Gerken, J., Schweer, T., Yarza, P., et al. (2013). The SILVA ribosomal RNA gene database project: improved data processing and web-based tools. Nucleic Acids Res. 41, D590–596. doi: 10.1093/nar/gks1219
Rabaey, K., and Rozendal, R. A. (2010). Microbial electrosynthesis - revisiting the electrical route for microbial production. Nat. Rev. Microbiol. 8, 706–716. doi: 10.1038/nrmicro2422
Rotaru, A. E., Shrestha, P. M., Liu, F. H., Shrestha, M., Shrestha, D., Embree, M., et al. (2014). A new model for electron flow during anaerobic digestion: direct interspecies electron transfer to Methanosaeta for the reduction of carbon dioxide to methane. Energy Environ. Sci. 7, 408–415. doi: 10.1039/C3EE42189A
Sano, Y., Kinoshita, N., Kagoshima, T., Takahata, N., Sakata, S., Toki, T., et al. (2017). Origin of methane-rich natural gas at the West Pacific convergent plate boundary. Sci. Rep. 7:15646. doi: 10.1038/s41598-017-15959-5
Sato, K., Kawaguchi, H., and Kobayashi, H. (2013). Bio-electrochemical conversion of carbon dioxide to methane in geological storage reservoirs. Energy Convers. Manag. 66, 343–350. doi: 10.1016/j.enconman.2012.12.008
Schink, B. (1997). Energetics of syntrophic cooperation in methanogenic degradation. Microb. Mol. Biol. Rev. 61, 262–280.
Shlimon, A. G., Friedrich, M. W., Niemann, H., Ramsing, N. B., and Finster, K. (2004). Methanobacterium aarhusense sp. nov. a novel methanogen isolated from a marine sediment (Aarhus Bay, Denmark). Int. J. Syst. Evol. Microbiol. 54, 759–763. doi: 10.1099/ijs.0.02994-0
Siegert, M., Yates, M. D., Spormann, A. M., and Logan, B. E. (2015). Methanobacterium dominates biocathodic archaeal communities in methanogenic microbial electrolysis cells. ACS Sustain. Chem. Eng. 3, 1668–1676. doi: 10.1021/acssuschemeng.5b00367
Smith, K. S., and Ingram-Smith, C. (2007). Methanosaeta, the forgotten methanogen? Trends Microbiol. 15, 150–155. doi: 10.1016/j.tim.2007.02.002
Sorokin, D. Y., Abbas, B., Merkel, A. Y., Rijpstra, W. I., Damste, J. S., Sukhacheva, M. V., et al. (2015). Methanosalsum natronophilum sp. nov. and Methanocalculus alkaliphilus sp. nov. haloalkaliphilic methanogens from hypersaline soda lakes. Int. J. Syst. Evol. Microbiol. 65, 3739–3745. doi: 10.1099/ijsem.0.000488
Strycharz-Glaven, S. M., Glaven, R. H., Wang, Z., Zhou, J., Vora, G. J., and Tender, L. M. (2013). Electrochemical investigation of a microbial solar cell reveals a nonphotosynthetic biocathode catalyst. Appl. Environ. Microbiol. 79, 3933–3942. doi: 10.1128/AEM.00431-13
Suzuki, S., Ishii, S., Wu, A., Cheung, A., Tenney, A., Wanger, G., et al. (2013). Microbial diversity in The Cedars, an ultrabasic, ultrareducing, and low salinity serpentinizing ecosystem. Proc. Natl. Acad. Sci. U.S.A. 110, 15336–15341. doi: 10.1073/pnas.1302426110
Terbraak, C. J. F. (1986). Canonical correspondence-analysis - a new eigenvector technique for multivariate direct gradient analysis. Ecology 67, 1167–1179. doi: 10.2307/1938672
Thauer, R. K., Kaster, A. K., Seedorf, H., Buckel, W., and Hedderich, R. (2008). Methanogenic archaea: ecologically relevant differences in energy conservation. Nat. Rev. Microbiol. 6, 579–591. doi: 10.1038/nrmicro1931
Torres, C. I., Krajmalnik-Brown, R., Parameswaran, P., Marcus, A. K., Wanger, G., Gorby, Y. A., et al. (2009). Selecting anode-respiring bacteria based on anode potential: phylogenetic, electrochemical, and microscopic characterization. Environ. Sci. Technol. 43, 9519–9524. doi: 10.1021/es902165y
Uchiyama, T., Ito, K., Mori, K., Tsurumaru, H., and Harayama, S. (2010). Iron-corroding methanogen isolated from a crude-oil storage tank. Appl. Environ. Microbiol. 76, 1783–1788. doi: 10.1128/AEM.00668-09
Van Eerten-Jansen, M. C., Veldhoen, A. B., Plugge, C. M., Stams, A. J., Buisman, C. J., and Ter Heijne, A. (2013). Microbial community analysis of a methane-producing biocathode in a bioelectrochemical system. Archaea 201:481784. doi: 10.1155/2013/481784
Wang, Z., Leary, D. H., Malanoski, A. P., Li, R. W., Hervey, W. J., Eddie, B. J., et al. (2015). A previously uncharacterized, nonphotosynthetic member of the Chromatiaceae is the primary CO2-fixing constituent in a self-regenerating biocathode. Appl. Environ. Microbiol. 81, 699–712. doi: 10.1128/AEM.02947-14
Xu, J., Bjursell, M. K., Himrod, J., Deng, S., Carmichael, L. K., Chiang, H. C., et al. (2003). A genomic view of the human-Bacteroides thetaiotaomicron symbiosis. Science 299, 2074–2076. doi: 10.1126/science.1080029
Yamada, T., Sekiguchi, Y., Hanada, S., Imachi, H., Ohashi, A., Harada, H., et al. (2006). Anaerolinea thermolimosa sp. nov. Levilinea saccharolytica gen. nov. sp. nov. and Leptolinea tardivitalis gen. nov. sp. nov. novel filamentous anaerobes, and description of the new classes Anaerolineae classis nov. and Caldilineae classis nov. in the bacterial phylum Chloroflexi. Int. J. Syst. Evol. Microbiol. 56, 1331–1340. doi: 10.1099/ijs.0.64169-0
Yu, Z., Leng, X., Zhao, S., Ji, J., Zhou, T., Khan, A., et al. (2018). A review on the applications of microbial electrolysis cells in anaerobic digestion. Bioresour. Technol. 255, 340–348. doi: 10.1016/j.biortech.2018.02.003
Keywords: microbial electrosynthesis, electromethanogenesis, extracellular electron transfer, microbial community dynamics, FIB-SEM, subsurface microbiome
Citation: Ishii S, Imachi H, Kawano K, Murai D, Ogawara M, Uemastu K, Nealson KH and Inagaki F (2019) Bioelectrochemical Stimulation of Electromethanogenesis at a Seawater-Based Subsurface Aquifer in a Natural Gas Field. Front. Energy Res. 6:144. doi: 10.3389/fenrg.2018.00144
Received: 03 August 2018; Accepted: 12 December 2018;
Published: 17 January 2019.
Edited by:
Deepak Pant, Flemish Institute for Technological Research, BelgiumReviewed by:
Kangning Zhao, University of Wisconsin-Madison, United StatesSam Molenaar, W&F Technologies BV, Netherlands
Copyright © 2019 Ishii, Imachi, Kawano, Murai, Ogawara, Uemastu, Nealson and Inagaki. This is an open-access article distributed under the terms of the Creative Commons Attribution License (CC BY). The use, distribution or reproduction in other forums is permitted, provided the original author(s) and the copyright owner(s) are credited and that the original publication in this journal is cited, in accordance with accepted academic practice. No use, distribution or reproduction is permitted which does not comply with these terms.
*Correspondence: Shun'ichi Ishii, c2lzaGlpQGphbXN0ZWMuZ28uanA=