 Saba Seyedi
 Kaushik Venkiteshwaran
- Department of Civil, Construction and Environmental Engineering, Marquette University, Milwaukee, WI, United States
Aqueous pyrolysis liquid (APL) is a high-COD byproduct of wastewater biosolids pyrolysis that is comprised of numerous complex organic compounds and ammonia nitrogen (NH3-N). One potential beneficial use of APL is as a co-digestate to produce more biogas in anaerobic digesters. However, some APL organics and NH3-N are known to inhibit methane-producing microbes. Autocatalytic pyrolysis which uses previously-produced biochar as a catalyst during biosolids pyrolysis, increases energy-rich py-gas while eliminating bio-oil production and reducing COD concentration in the APL (catalyzed APL). However, the catalyzed APL still has a high organic strength and no suitable treatment strategies have yet been identified. In this study, the methane production yields and methanogenic toxicity of non-catalyzed and catalyzed APLs were investigated. Both non-catalyzed and catalyzed APLs were produced at 800°C from a mix of digested primary and raw waste activated sludge from a municipal water resource reclamation facility. Using the anaerobic toxicity assay, APL digester loading rates higher than 0.5 gCOD/L for non-catalyzed and 0.10 gCOD/L for catalyzed APL were not sustainable due to toxicity. The IC50 values (APL concentration that inhibited methane production rate by 50%) for non-catalyzed and catalyzed APLs were 2.3 and 0.3 gCOD/L, respectively. Despite having significantly fewer identified organic compounds catalytic APL resulted in higher methanogenic toxicity than non-catalytic APL. NH3-N was not the main inhibitory constituent and other organics in APL, including 3,5-dimethoxy-4-hydroxybenzaldehyde, 2,5-dimethoxybenzyl alcohol, benzene, cresol, ethylbenzene, phenols, styrene, and xylenes as well as nitrogenated organics (e.g., benzonitrile, pyridine) ostensibly caused considerable methane production inhibition. Future research focused on pretreatment methods to overcome APL toxicity and the use of acclimated biomass to increase methane production rates during APL anaerobic digestion or co-digestion is warranted.
Introduction
Primary and waste activated sludge volumes produced from municipal water reclamation processes are increasing due to population increase and more strict effluent requirements (Agrafioti et al., 2013; Bravo et al., 2017). Conventional solids management including landfilling and biosolids land application for agriculture are employed (Agrafioti et al., 2013; McNamara et al., 2016). However, there are health and environmental concerns related to these approaches due to pathogens, micropollutants, and excess nutrients in the environment as well as a desire for energy and resource recovery from wastewater solids (Bridle and Skrypski-Mantele, 2004; Tsai et al., 2009; Hamidi et al., 2017; Khazaei et al., 2017, 2018). Therefore, technologies that destroy pathogens and micropollutants while generating energy, such as thermochemical processes, are being investigated.
Pyrolysis is one thermochemical technology that converts wastewater solids to biochar, pyrolysis gas (py-gas), and pyrolysis liquid. In pyrolysis, sludges or solids are heated in the absence of oxygen to temperatures >400°C (McNamara et al., 2016; Liu et al., 2017, 2018). Biochar is a solid product similar to charcoal that can be used as a beneficial soil amendment because of its high capacity to hold moisture and nutrients for plants (Laird et al., 2009; McNamara et al., 2016). In addition, pyrolysis reduces or eliminates pathogens and micropollutant mass when transforming sludge to biochar (McNamara et al., 2016; Liu et al., 2017). Py-gas is a relatively clean-burning product containing hydrogen (H2), carbon monoxide (CO), methane (CH4) and other constituents that can be combusted alone or mixed with anaerobic digester biogas in boilers, engines, and other equipment for renewable energy (Domínguez et al., 2006; McNamara et al., 2016).
Pyrolysis liquid is a light- to dark-brown material consisting of a complex mixture containing hundreds of organic compounds (Huber et al., 2006). Often, pyrolysis liquid separates into an organic, light non-aqueous phase (bio-oil), and an aqueous phase known as aqueous pyrolysis liquid (APL) (Park et al., 2008; Fonts et al., 2012). Crude bio-oil that has not been upgraded may damage typical combustion systems due to its corrosiveness, high viscosity, water content, and ash content (Evans and Milne, 1987; Xiu and Shahbazi, 2012). Therefore, bio-oil upgrading is typically required to obtain a stable, renewable fuel product (Xiu and Shahbazi, 2012; Chen et al., 2014; McNamara et al., 2016).
The APL contains numerous complex aromatic and nitrogenated compounds (Hübner and Mumme, 2015). APL also has a high pH value and sometimes a high NH3-N concentration. Park et al. (2008), investigated the nitrogen content in pyrolysis oils obtained from pyrolysis of dried sewage sludge containing polymer flocculants in a fluidized bed reactor at temperatures between 446 and 720°C. They reported relatively high nitrogen content, from 5 to 7 wt% was mainly due to NH3-N produced during pyrolysis. Approximately, 70% of the total nitrogen in the pyrolysis oils was in the form of NH3-N. Pyrolysis of pine nut shells yielded APL having 85–90% water content and a low heating value, whereas the bio-oil contained <10% water content and a high heating value (Li et al., 2009; Chen et al., 2016). Zhang et al. (2005) reported that APL from fast pyrolysis of sawdust at 470°C contained organic compounds including acetic acid, hydroxyacetone, and phenol (Zhang et al., 2005). Torri and Fabbri (2014) described volatile fatty acids (VFAs) concentrations in APL derived from pyrolysis of corn stalk pellets at 400°C in a fixed bed reactor, with acetic, isovaleric, and propionic acid concentrations of 26, 3.2, and 1.6 g Kg−1, respectively, whereas isobutyric, butyric and valeric acid concentrations were all lower (<0.5 g Kg−1). Currently, APL has no apparent use and must be carefully managed due to its high organic strength. The complex composition of APL makes it a challenging wastewater to treat and suitable methods to recover resources or energy from APL are yet to be established.
One potential strategy could be to convert the organic compounds in APL to methane for energy recovery via anaerobic digestion; however, APL can be a difficult substrate to digest since it contains organic compounds that are known to inhibit methanogens and methane production. Andreoni et al. (1990) described anaerobic digestion of pyroligneous acid from pyrolysis of wood mixed with swine slurry. Upflow anaerobic digesters were employed and some COD removal was achieved at low organic loading rates, whereas pyroligneous acid concentrations greater than about 10% v/v significantly inhibited methane production (Andreoni et al., 1990). Another study concluded that condensate from pyrolysis of dried wastewater biosolids was anaerobically digestible under the specific conditions studied; however, the pyrolysis temperature was low (200°C) and only short-term, batch biochemical methane potential tests were performed with a diluted bio-oil which may not reproduce conditions under continuous feeding (Parry et al., 2012). Torri and Fabbri (2014), described inhibition of methanogenic batch tests seeded with unacclimated biomass, using the aqueous phase from corn stalk pyrolysis. By adding biochar to the systems, methane production rate increased to 60% of the theoretical methane yield (Torri and Fabbri, 2014). Another methanogenic batch study conducted using unacclimated inoculum showed that APL derived from digestate pyrolysis at lower temperatures (330 and 430°C) was less inhibitory than APL generated at 530°C (Hübner and Mumme, 2015).
Autocatalytic pyrolysis, which uses biosolids-derived biochar as a catalyst during subsequent pyrolysis, is one promising method to increase py-gas production and decrease or eliminate bio-oil (Liu et al., 2017). Catalyzed pyrolysis shifted the energy from bio-oil to py-gas such that at the highest catalyst loading, py-gas energy increased from 2,940 kJ/kg biosolids-pyrolyzed to 10,200 kJ/kg biosolids-pyrolyzed, while bio-oil energy decreased from 2,900 kJ/kg-biosolids-pyrolyzed to 275 kJ/kg-biosolids-pyrolyzed (Liu et al., 2017). Unlike bio-oil, py-gas does not require extensive conditioning before use as a fuel. Therefore, increasing py-gas and reducing bio-oil yields can be a favorable process to simplify and increase energy recovery at water resource recovery facilities (Liu et al., 2017). Autocatalytic pyrolysis changes APL composition, resulting in significantly lower organic content. However, APL produced during autocatalysis (catalyzed APL) still contains organics and requires further treatment for disposal (Liu et al., 2017; Seyedi, 2018). The application of catalyzed APL as a suitable co-substrate for methane production through anaerobic digestion has not been previously investigated.
Therefore, the objective of this study was to investigate the methane production yield and methanogenic toxicity of non-catalyzed and catalyzed APLs produced at 800°C from pyrolysis of municipal wastewater biosolids. Anaerobic toxicity assays (ATA) were performed to determine catalyzed and non-catalyzed APL organic loading rates that would be sustainable in anaerobic digesters containing unacclimated biomass. APL composition was determined, and NH3-N stripping was performed to reduce potential inhibitory concentrations of NH3-N in APL before anaerobic digestion.
Materials and Methods
APL Production and APL NH3-N Air Stripping
Catalyzed and non-catalyzed APLs were produced by pyrolysis of commercially available, dried biosolids at 800°C. The biosolids were a mix of anaerobically digested primary sludge and raw waste activated sludge (Milorganite) from the Jones Island Water Resource Recovery Facility (Milwaukee, Wisconsin) as described elsewhere (Liu et al., 2017). Air stripping was utilized to reduce the NH3-N concentration in some APL samples before anaerobic digestion. For this, 30 mL of catalyzed or non-catalyzed APL was aerated (2 L/min, 1 atm, 20°C) for 9 h to air-strip NH3-N.
Anaerobic Toxicity Assay (ATA)
ATA tests were performed to measure the effect of APLs on the rate of methane production from acetate (Owen et al., 1979; Speece, 2008). For ATA analysis, each of six serum bottles was fed a different APL concentration (Table 1) and all received 10 g/L calcium acetate with basal nutrient media (Speece, 2008). Serum bottles were inoculated with biomass taken from a lab-scale anaerobic digester fed non-fat dry milk and basal nutrients media. NH3-N loadings in bottles receiving air-stripped APL were significantly lower than those in bottles receiving non-air-stripped APL (Table 1). Therefore, toxicity from constituents other than NH3-N was identified using results from bottles receiving air-stripped APL. In addition, preliminary ATA tests were conducted using ammonium chloride to determine the response of the inoculum to NH3-N.
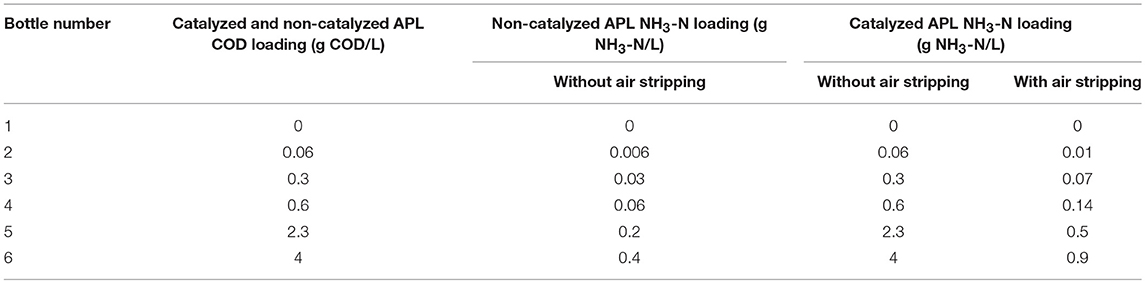
Table 1. ATA COD and NH3-N loadings for catalyzed and non-catalyzed APL.
Analytical Methods
Biogas volume was measured daily using a 100 mL wetted-barrel glass syringe by inserting a needle through serum bottle septa. Biogas methane concentration was measured by gas chromatography (GC System 7890A, Agilent Technologies, Irving, TX, USA) with a thermal conductivity detector GC-TCD. VFA concentrations were measured by gas chromatography (GC System 7890A, Agilent Technologies, Irving, TX, USA) using a flame ionization detector (GC-FID). Total solids (TS), volatile solids (VS), total suspended solids (TSS), volatile suspended solids (VSS), and NH3-N concentrations were measured using standard methods (American Public Health Association, 1998). The pH was measured using a probe and meter (Orion 4 Star, Thermo, Waltham, MA, USA). Statistical analyses including average and standard deviation calculations were performed using Microsoft Excel 2015.
APL constituent concentrations were measured using two different gas chromatography-mass spectrophotometry (GC-MS) methods and two different GC-FID methods. The first GC-MS method employed a DB wax column (Agilent Technologies), whereas the second employed an HP-5MS column (Agilent, Technologies). The GC-MS DB wax column analysis was performed using a GC-MS system (HP-6890 GC with a 5972A mass selective detector) and column with 30 m × 0.53 mm ID × 1.0 μm film thickness (DB-Wax column, Agilent Technologies). The injector employed a split ratio of 50:1 and the injection volume was 1 μL. The GC oven was programmed with an initial temperature of 50°C for 1 min, temperature ramp of 15°C/min and a final temperature of 220°C and final hold time of 40 min. The flow rate was constant at 2.0 mL/min of the helium carrier gas. Both catalyzed and non-catalyzed APLs were diluted with water at ratios of 1:18.7 and 1:45.6, respectively. Also, samples were acidified to pH = 1 using concentrated HCl solution. The second GC-MS analysis was performed using a GC-MS system (HP-7890A GC with a 5975A mass selective detector) fitted with an HP-5MS column with 30 m × 0.25 mm ID × 1.0 μm film thickness (HP5-MS column, Agilent Technologies). The injection volume was 0.5 μL with a split ratio of 10:1. The oven was programmed with an initial temperature of 50°C for 1 min, temperature ramp of 10°C/min and a final temperature of 250°C and final hold time of 4 min. The flow rate was constant at 1.2 mL/min of the helium carrier gas. Both catalyzed and non-catalyzed APLs were undiluted.
The first GC-FID analysis was performed using a GC (GC System 7890B, Agilent Technologies, Irving, TX, USA) that employed a DB FFAP column with 30 m × 0.25 mm ID × 0.25 μm film thickness. The operating system used was OpenLAB CDS—Acquisition Build version 2.1.0.433. The carrier gas was helium with a constant flow rate of 18 mL/min. The helium make-up was 32 mL/min, hydrogen flow at 35 mL/min with an air flow of 300 mL/min. The oven initial temperature was 95°C for 2 min, ramped at 10°C/min and a final temperature of 200°C at 40°C/min with 5 min hold time. A sample volume of 5 μL was injected with a split ratio of 2:1.
The second GC-FID method (GC-FID, Bruker Corporation, Bruker Daltonics, Inc., USA) utilized a 1701 capillary column as described elsewhere (Rover et al., 2015). Quantification of organic compounds by GC-FID was conducted using standard curves for each analyte as described previously (Choi et al., 2014) and concentrations were measured as the mass of analyte per mass of APL (% w/w, raw basis).
Results and Discussion
APL Properties
Autocatalysis during pyrolysis reduced the APL COD from >200 gCOD/L for non-catalyzed APL to 32 ± 1.2 gCOD/L for catalyzed APL (~85% COD reduction) (Table 2). The catalysis effect on NH3-N concentration varied, with non-catalyzed APL NH3-N concentration of 63 ± 0.1 g/L and catalyzed APL NH3-N concentration from 32 to 72 g/L. High NH3-N concentration in the liquid product obtained from sewage sludge pyrolysis was highlighted previously (Park et al., 2008; Fonts et al., 2009). Concentrations of VFAs in APLs were below detection after autocatalytic pyrolysis (Table 3B). In contrast, non-catalyzed APL contained approximately 24 g/L of acetic acid (Table 3A). This is consistent with previous studies which have found high acetic acid concentration in APL (Torri and Fabbri, 2014). Acetic acid is an easily degradable substrate in anaerobic digestion; therefore, the presence of acetic acid indicates that APL could potentially serve as a co-digestate. The majority of organic compounds detected by GC-MS were nitrogen-containing compounds in both non-catalyzed and catalyzed APLs (Tables 3A,B). The highest percent peak area measured by GC-MS HP-5MS column analysis was observed for pyrrole in both non-catalyzed and catalyzed APLs. Acetic acid concentration measured by GC-MS DB wax column analysis was three times higher in non-catalyzed compared to catalyzed APL. However, peak areas of identifiable compounds detected by both GC-MS methods only contributed to a fraction of the total peak area observed, whereas the majority of peaks were unidentified (Tables 3A,B).
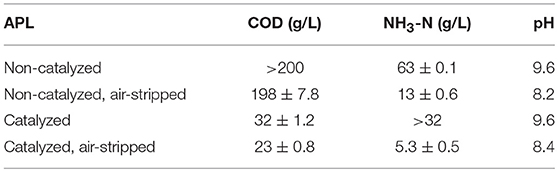
Table 2. COD and NH3-N concentrations and pH in non-catalyzed and catalyzed APL with and without air stripping.
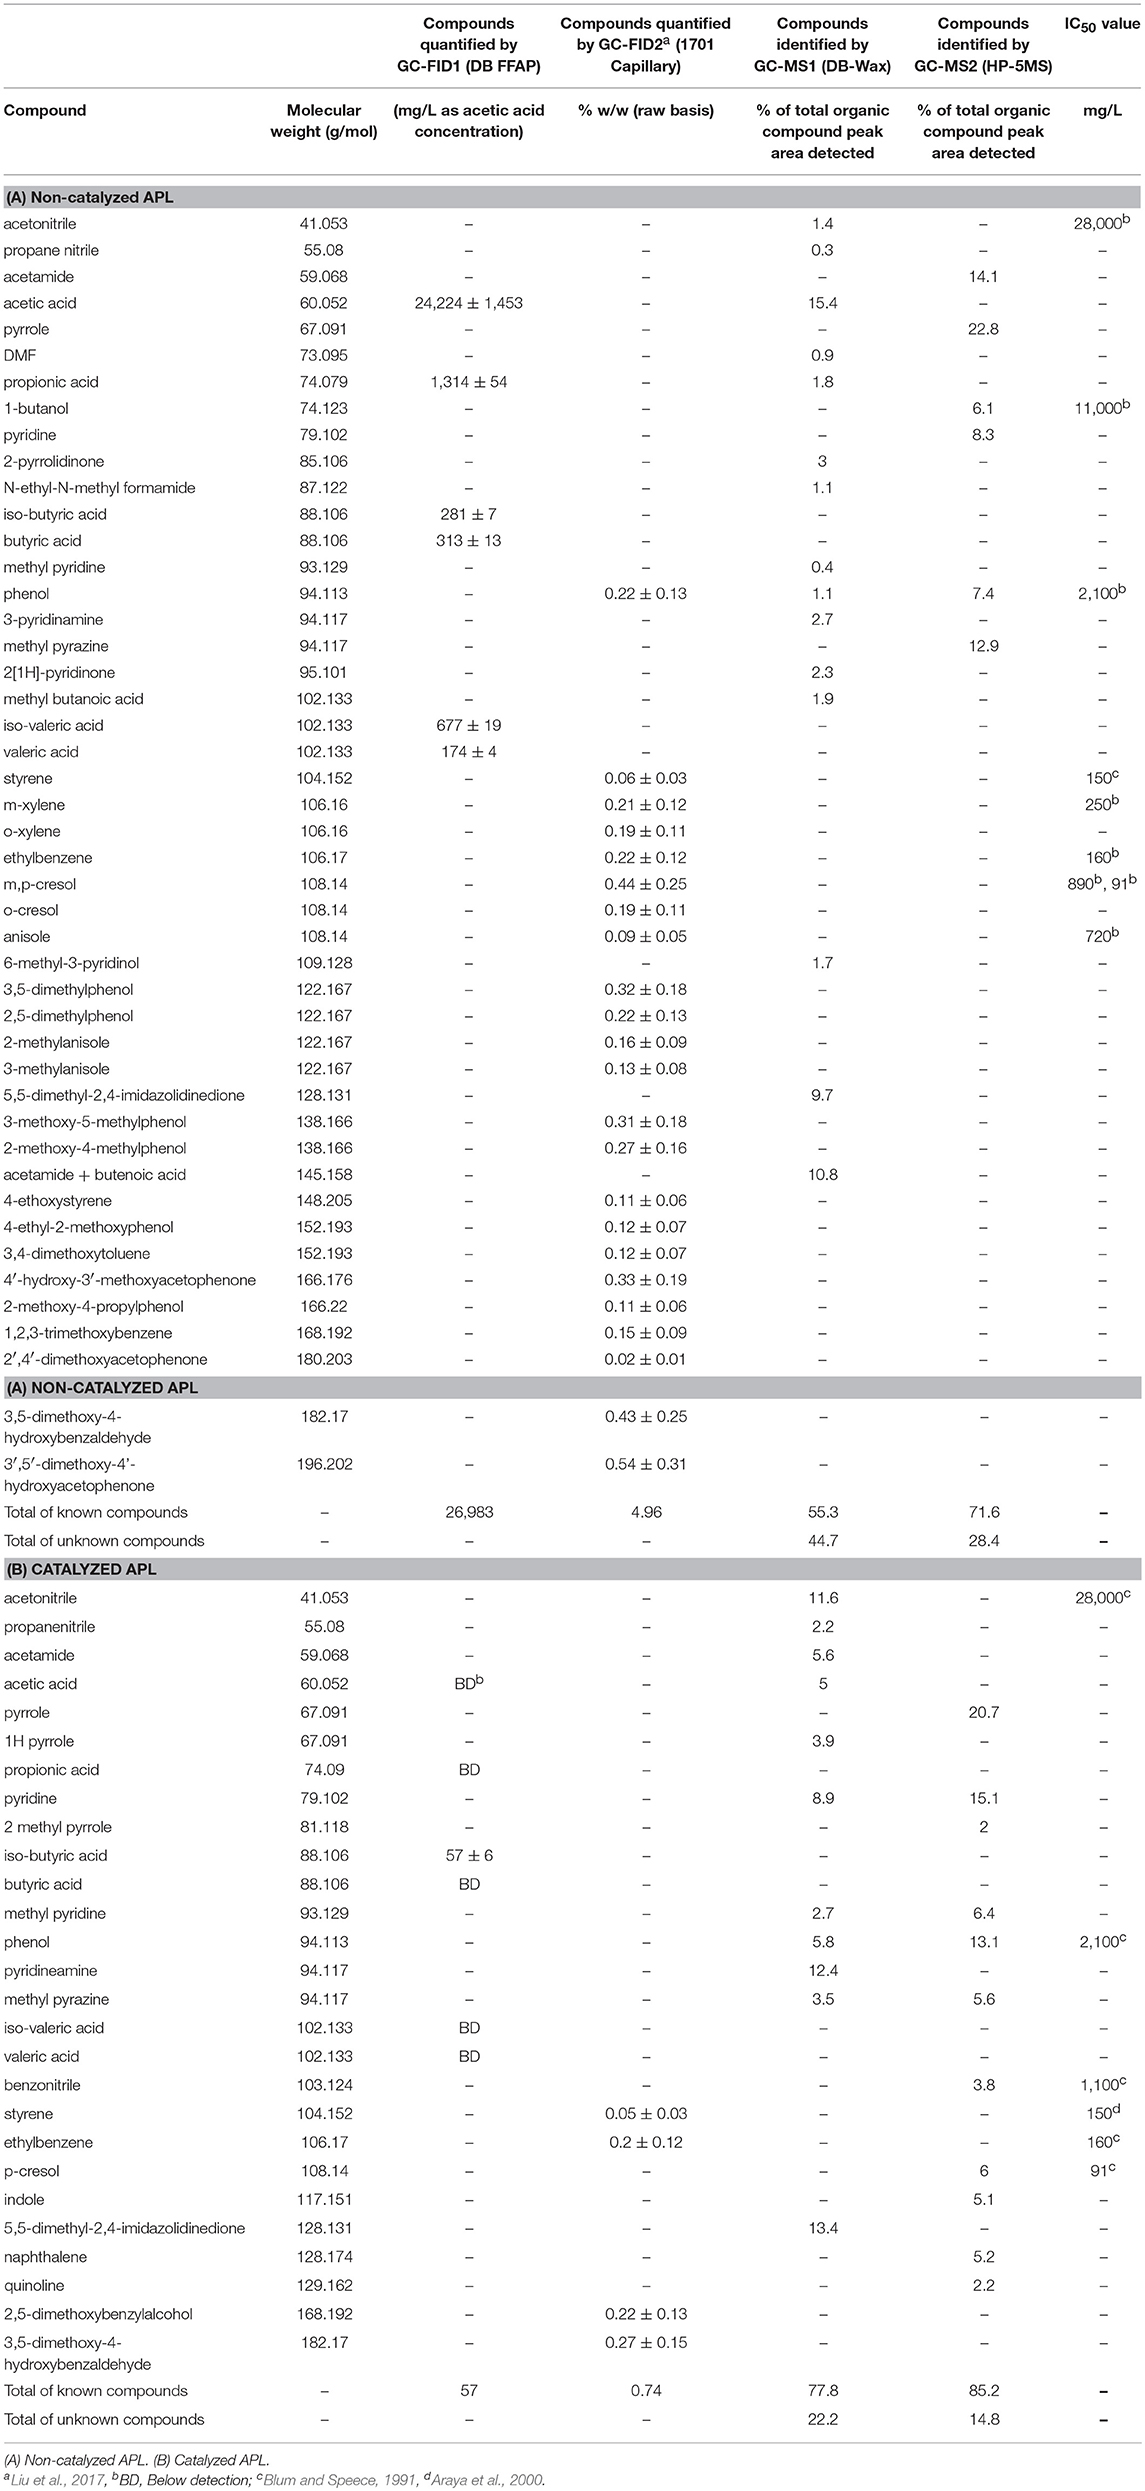
Table 3. APL organic constituents identified by GC-MS and GC-FID methods.
Nearly all the compounds identified by GC-FID in both APLs were aromatic hydrocarbons (Tables 3A,B). Compounds detected by GC-FID in non-catalyzed APL included phenols, xylene, ethylbenzene, cresol and acetophenone. Among these compounds, phenol, m-cresol, p-cresol, and 2,4-dimethylphenol contributed to a significant fraction of the detected substances (1.39% by weight) and are known to inhibit anaerobic processes at IC50 concentrations of 2,100, 890, 91, and 71 mg/L, respectively (Fedorak and Hrudey, 1984; Blum and Speece, 1991). Phenolic compounds damage the cell membrane which adversely affects membrane proteins and cell wall permeability (Madigou et al., 2016). A recent study has summarized that selection of key microbial populations would help improve the removal of refractory pollutants including phenol and p-cresol (Franchi et al., 2018).
In addition, ethylbenzene and m-xylene are not known to be degraded under strictly anaerobic conditions and, therefore, do not serve as a substrate for methane production (Edwards and Grbic-Galic, 1994). Catalyzed APL contained fewer GC-FID-identified organic constituents compared to non-catalyzed APL (Table 3B). Only 4 organic compounds were detected by GC-FID in the catalyzed APL; 3,5-dimethoxy-4-hydroxybenzaldehyde, 2,5-dimethoxybenzyl alcohol, ethylbenzene, and styrene, whereas in the non-catalyzed APL, 23 compounds were identified.
APL Properties After Air Stripping
Both catalyzed and non-catalyzed APLs contained high concentrations of NH3-N that could inhibit anaerobic digestion (Table 2). NH3-N concentrations higher than ~3–5 g/L NH3-N at neutral pH and 35°C exert toxicity and decrease unacclimated methanogenic activity (Speece, 1996; Liu and Sung, 2002). Air stripping decreased NH3-N concentration by approximately 80% in both non-catalyzed and catalyzed APL (Table 2). Air stripping did not significantly change the COD concentration in non-catalyzed APL; however, it reduced the catalyzed APL COD concentration by 30%, indicating catalyzed APL contained a higher fraction of volatile organic carbon than non-catalyzed APL. The pH of both catalyzed and non-catalyzed APLs significantly decreased after aeration, ostensibly due to NH3-N removal (Table 2).
GC-FID analyses of catalyzed and non-catalyzed APLs after air stripping were conducted (Tables 4A,B). Before and after air stripping, essentially the same compounds were present in the non-catalyzed APL. In catalyzed APL after air stripping, however, only 2 compounds were detected; 3,5-dimethoxy-4-hydroxybenzaldehyde and 2,5-dimethoxybenzylalcohol. Therefore, air stripping of catalyzed APL removed the volatile organic chemicals, ethylbenzene, and styrene. The IC50 values of ethylbenzene and styrene to unacclimated methanogenic biomass are each approximately 150 mg/L (Blum and Speece, 1991; Araya et al., 2000). Removing these potentially inhibitory chemicals from APL in addition to NH3-N by air stripping may have resulted in reduced APL toxicity.
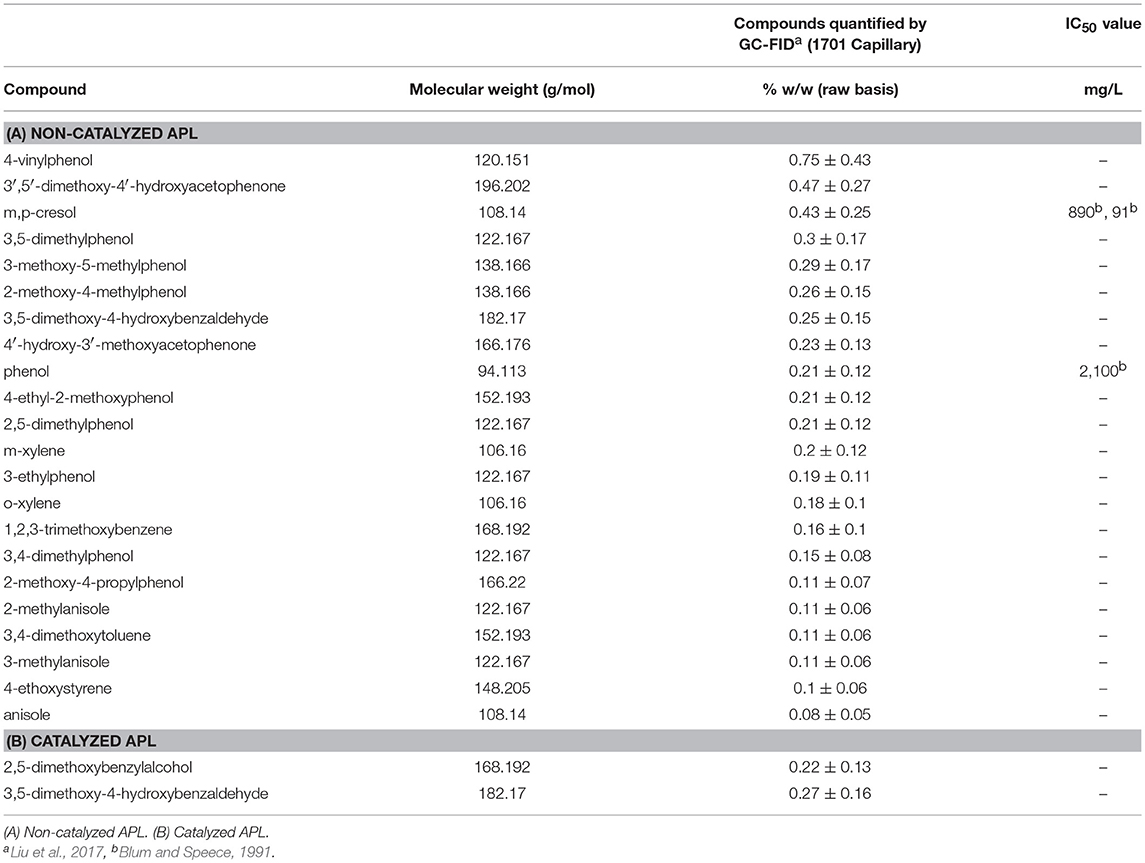
Table 4. Air-stripped APL compounds quantified by GC-FID.
ATA Results Before NH3-N Air Stripping
ATA testing was performed on both non-air-stripped, catalyzed and non-catalyzed APL samples as well as on air-stripped catalyzed APL. Since the non-catalyzed APL NH3-N concentration was significantly below potentially inhibitory concentrations in ATA tests, no ATA testing was not performed on air-stripped, non-catalyzed APL (Table 1).
Non-catalyzed APL significantly inhibited methane production at high concentrations of 2.3 and 4 gCOD/L (Figure 1A). However, at lower concentrations of 0.06 and 0.30 gCOD/L, no significant inhibition was observed, and the initial methane production rates were similar to those of the control system that received no APL. This shows that APL digestion may be feasible at low organic loading rates, but toxicity inhibits the process at high loading rates. The inhibition could be attributed to the presence of compounds such as phenols that are known to adversely affect unacclimated methane-producing cultures at high concentrations (e.g., IC50 for phenol is 2,100 mg/L) (Hübner and Mumme, 2015). Others have also suggested that methane production inhibition could be due to APL constituents including phenols, oxygenated and nitrogen-containing organics (Torri and Fabbri, 2014). In addition, high concentration of phenols in unacclimated anaerobic digesters impedes AD processes resulting in decreased biogas production (Madigou et al., 2016). Metabolic inhibition and modification of community composition are phenomena that negatively affect phenol degradation efficiency (Rosenkranz et al., 2013).
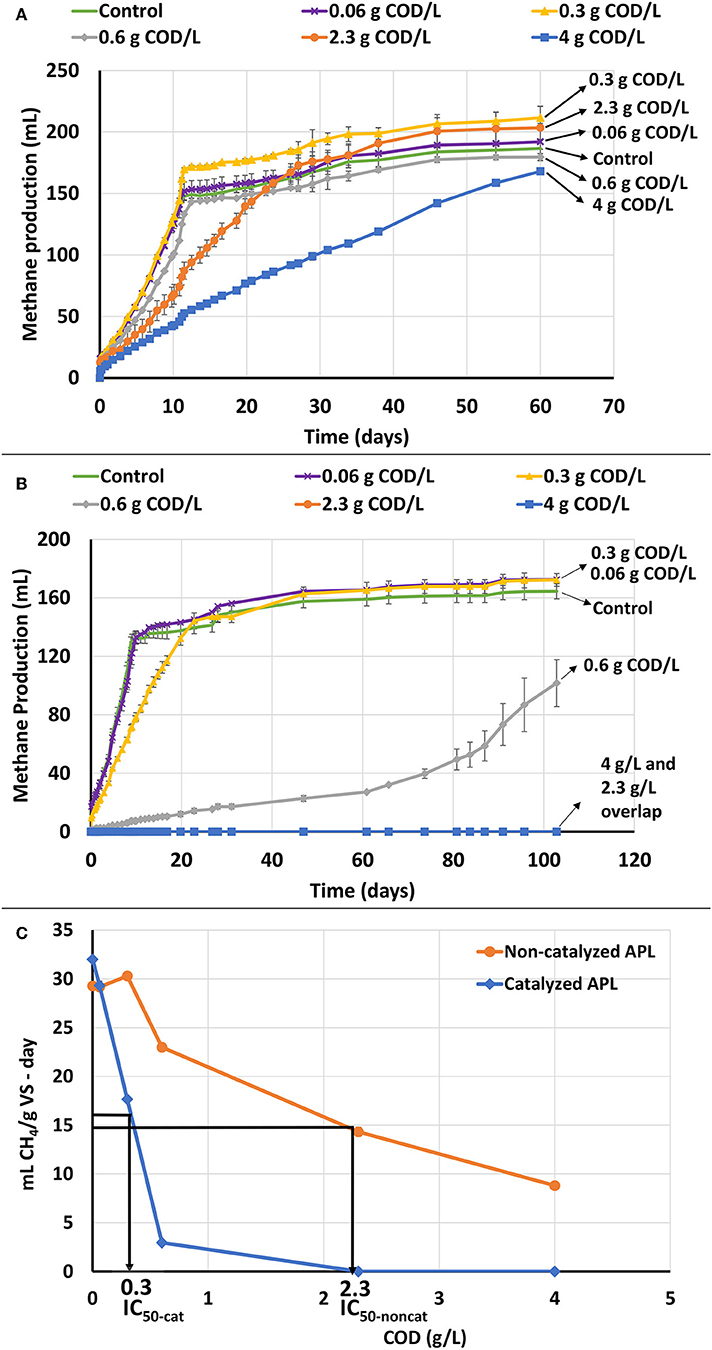
Figure 1. ATA results on catalyzed and non-catalyzed APLs without air stripping. Error bars represent standard deviation among triplicates. (A) Cumulative methane production of non-catalyzed APL at different concentrations. (B) Cumulative methane production of catalyzed APL at different concentrations. (C) ATA dose-response curves based on COD for catalyzed and non-catalyzed APLs and comparison of IC50 values between catalyzed and non-catalyzed APLs.
For catalyzed APL, high concentrations of 2.3 and 4.0 gCOD/L, caused total cessation of methane production (Figure 1B). It was originally assumed that the catalyzed APL would be less toxic than non-catalyzed APL since it contained fewer organic compounds; however, the opposite was observed, and catalyzed APL was more inhibitory than the non-catalyzed APL. The methane production rates for 0.3 and 0.6 gCOD/L APL doses were also lower than those of the controls. The lowest COD loading (0.06 gCOD/L) did not inhibit methane production rate.
Methane production data were analyzed to determine the concentration of APL that inhibited methane production rate by 50% (i.e., the IC50 value). The IC50 values were 0.3 and 2.3 gCOD/L for catalyzed and non-catalyzed APLs, respectively (Figure 1C). The highest APL COD loadings that demonstrated < 10% inhibition were approximately 0.5 and 0.1 g COD/L for non-catalyzed and catalyzed APL, respectively.
ATA Results After NH3-N Air Stripping
In order to determine the toxicity of NH3-N to the seed biomass, an ATA analysis was performed with NH3-N concentration range of 0, 3, 6, and 9 g/L (Figure 2A). High NH3-N concentrations of 6 and 9 g/L NH3-N resulted in high methane production inhibition, whereas a lower concentration of 3 g/L NH3-N, resulted in low, but observable inhibition. The NH3-N IC50 value was 2 g/L NH3-N for the seed biomass (Figure 2B). NH3-N inhibition can be due to multiple factors including a change in the intracellular pH and inhibition of specific enzyme reactions (Rajagopal et al., 2013). It has also been proposed that NH3 is a cause of inhibition because it can permeate the cellular membrane and lead to protein imbalance and/or potassium deficiency (Speece, 1996; Yenigün and Demirel, 2013).
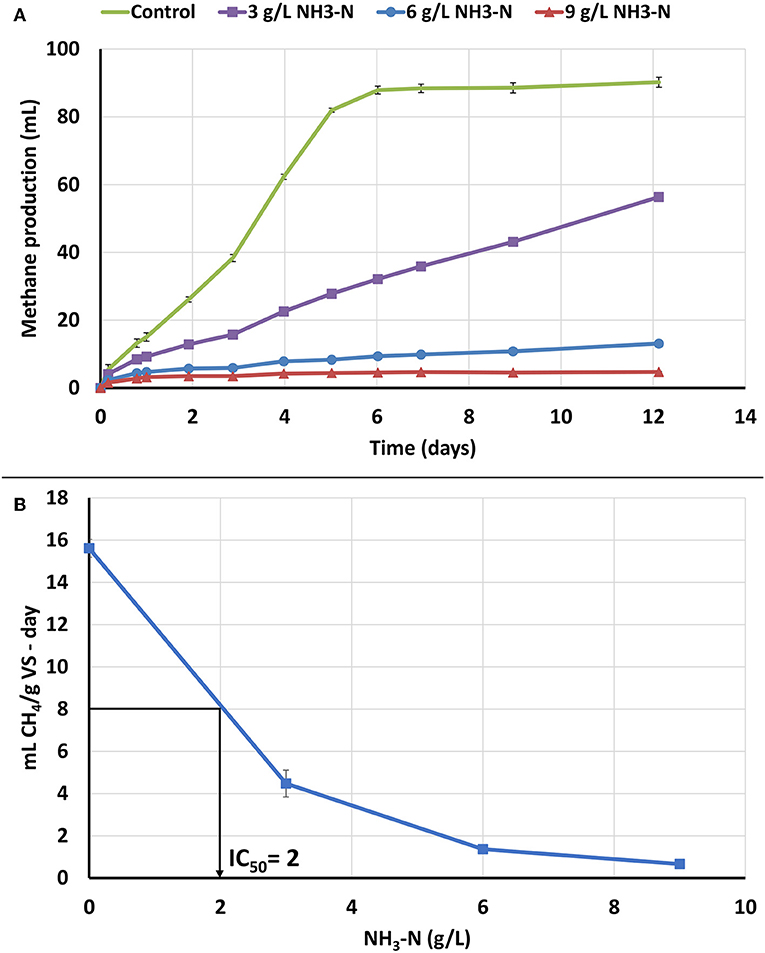
Figure 2. NH3-N ATA results on seed biomass. Error bars represent standard deviation among triplicates. (A) Cumulative methane production. (B) ATA dose response curve for NH3-N ATA and IC50 value of NH3-N to the seed biomass.
ATA testing was performed on catalyzed APL after NH3-N was removed by air stripping. After NH3-N was stripped, the NH3-N concentration in all the ATA bottles was <1 g/L and should not have been significantly inhibitory (Table 1). Therefore, any methane production rate inhibition was ostensibly a result of APL constituents other than NH3-N. ATA results using catalyzed APL after air stripping show that aeration did reduce toxicity at the 0.6 gCOD/L dose, but inhibition was still observed at higher concentrations (Figure 3A). Even after NH3-N was stripped, methane production essentially ceased at 2.3 and 4 gCOD/L APL doses. NH3-N concentrations in these two systems were approximately 0.5 and 0.9 g/L, respectively, which were significantly lower than IC50 value of 2 g/L. Therefore, NH3-N toxicity was not the main cause of inhibition and other APL constituents inhibited methane production.
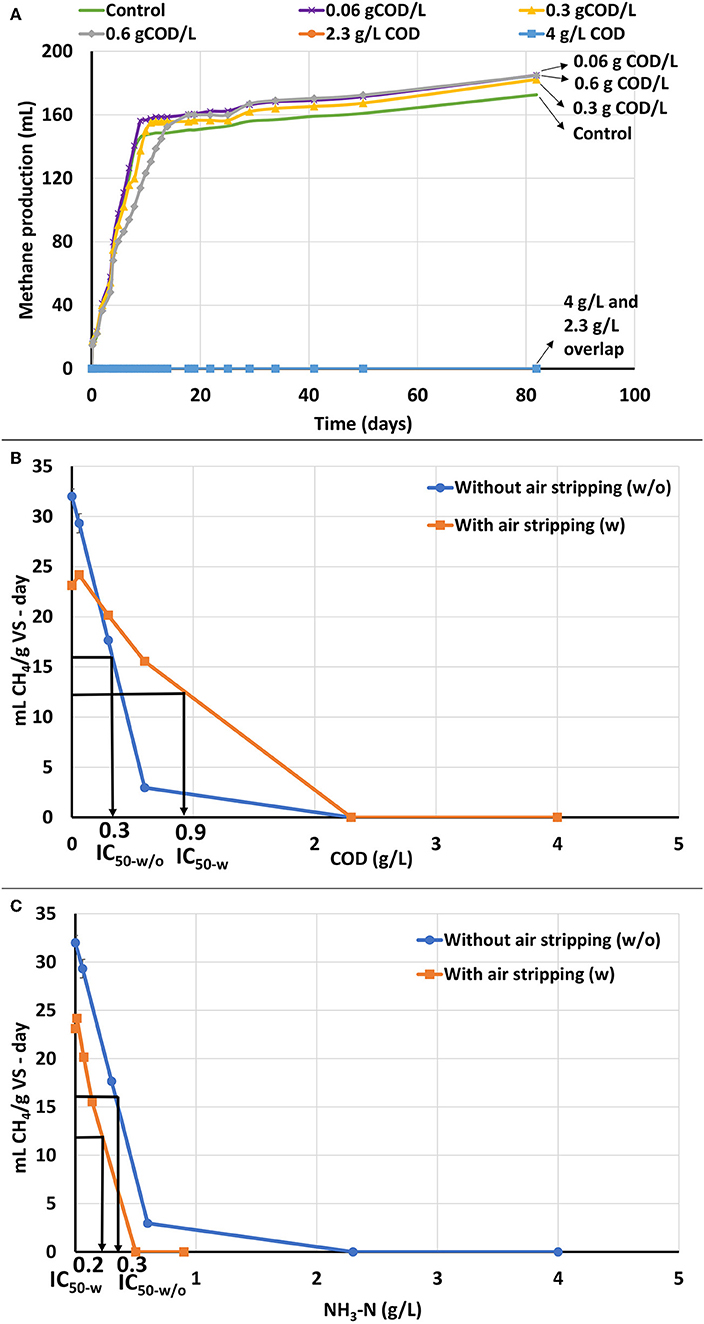
Figure 3. ATA results on catalyzed APL with air stripping. Error bars represent standard deviation among duplicates. (A) Cumulative methane production of catalyzed APL with air stripping at different concentrations. (B) ATA dose-response curves based on COD for catalyzed APL with and without air stripping and comparison of IC50 values between air-stripped and non-air-stripped catalyzed APLs. (C) ATA dose-response curves based on NH3-N for catalyzed APL with and without air stripping and comparison of IC50 values between air-stripped and non-air-stripped catalyzed APLs.
Dose response curves for methane production rate vs. COD and NH3-N concentrations were plotted and IC50 values were calculated (Figures 3B,C). After air stripping, biomass showed higher tolerance to the APL and the IC50 value increased by approximately 300% (Figure 3B). Under both air-stripped and non-air-stripped conditions, the NH3-N concentrations were significantly less than the IC50 value, but methane production inhibition was still observed (Figure 3C). Therefore, NH3-N was not the main or only inhibitory constituent. Inhibitory organic constituents in the APL exerted significant toxicity to the unacclimated biomass.
In summary, higher inhibition was observed using catalyzed vs. non-catalyzed APL despite the catalyzed APL having a lower COD concentration and fewer aromatic compounds. Energy recovery from APL may require pretreatment processes to decrease toxicity of the APL, prior to anaerobic digestion. Utilizing acclimated anaerobic biomass as an inoculum should also be considered to reduce inhibition and improve co-digestion. The APL for this work was produced at 800°C. It may be that APL produced from biosolids at other temperatures has different anaerobic toxicity properties. In addition, the APL produced for this work was derived from a mix of digested primary and raw waste activated sludges; the mix had a relatively high organic nitrogen content. APL derived from other traditional pyrolysis feedstock with lower nitrogen content, such as corn stover or wood, produces APL with lower total nitrogen and probably has different toxicity effects in anaerobic digesters.
Conclusion
Despite having fewer organic compounds, catalyzed APL generated from autocatalytic pyrolysis of wastewater solids resulted in higher methanogenic toxicity compared to conventional, non-catalyzed APL. Inhibition in methane production was observed even after the NH3-N concentration in catalyzed APL was reduced to non-inhibitory values by air stripping. Therefore, the main cause of inhibition is attributed to organic compounds present in catalyzed APL, such as phenol, m-cresol, p-cresol, 2,4-dimethylphenol, 3,5-dimethoxy-4-hydroxybenzaldehyde, 2,5-dimethoxybenzyl alcohol, ethylbenzene, and styrene. The majority of the organic constituents identified in wastewater solids derived catalyzed and non-catalyzed APLs were nitrogen-containing compounds and phenols that are known to inhibit methanogenesis. Future research should focus on pretreatment methods to overcome APL toxicity and the use of acclimated biomass to increase methane production rates during APL anaerobic digestion or co-digestion.
Author Contributions
SS performed experiments, carried out data analysis and drafted the manuscript. KV supervised the research, helped in experiment design and revised the manuscript. DZ planned the research, supervised the research and revised the manuscript.
Conflict of Interest Statement
The authors declare that the research was conducted in the absence of any commercial or financial relationships that could be construed as a potential conflict of interest.
Acknowledgments
The authors thank Mike Dollhopf (Water Quality Center, Marquette University, Milwaukee, USA) for his laboratory contributions and Dr. Zhongzhe Liu (Research Assistant Professor in the Department of Civil, Construction and Environmental Engineering, Marquette University, Milwaukee, USA) for providing the aqueous pyrolysis liquid. We are also grateful to Dynalene Laboratory Services (Whitehall, PA) and Iowa State University Bioeconomy Institute Laboratory (Aimes, IA) for providing GC-MS and GC-FID APL analyses.
References
Agrafioti, E., Bouras, G., Kalderis, D., and Diamadopoulos, E. (2013). Biochar production by sewage sludge pyrolysis. J. Anal. Appl. Pyrolysis 101, 72–78. doi: 10.1016/j.jaap.2013.02.010
American Public Health Association and American Water Works Association. (1998). Standard Methods for the Examination of Water and Wastewater. American public health association.
Andreoni, V., Bonfanti, P., Daffonchio, D., Sorlini, C., and Villa, M. (1990). Anaerobic digestion of wastes containing pyrolignitic acids. Biol. Wastes 34, 203–214. doi: 10.1016/0269-7483(90)90022-K
Araya, P., Chamy, R., Mota, M., and Alves, M. (2000). Biodegradability and toxicity of styrene in the anaerobic digestion process. Biotechnol. Lett. 22, 1477–1481. doi: 10.1023/A:1005636030693
Blum, D. J. W., and Speece, R. E. (1991). A database of chemical toxicity to environmental bacteria and its use in interspecies comparisons and correlations. Res. J. Water Pollut. Control Fed. 63, 198–207.
Bravo, H. R., Bootsma, H., and Khazaei, B. (2017). “Modeling the transport and fate of phosphorus from a point source in the Lake Michigan Nearshore Zone,” in Proceedings of the 37th International Association of Hydraulic Research World Congress (Kuala Lumpur, Malaysia). 6865, 5172–5179.
Bridle, T. R., and Skrypski-Mantele, S. (2004). Experience and lessons learned from sewage sludge pyrolysis in Australia. Water Sci. Technol. 49, 217–223. doi: 10.2166/wst.2004.0648
Chen, D., Chen, X., Sun, J., Zheng, Z., and Fu, K. (2016). Pyrolysis polygeneration of pine nut shell: quality of pyrolysis products and study on the preparation of activated carbon from biochar. Bioresour. Technol. 216, 629–636. doi: 10.1016/j.biortech.2016.05.107
Chen, H., Zhai, Y., Xu, B., Xiang, B., Zhu, L., Qiu, L., et al. (2014). Characterization of bio-oil and biochar from high-temperature pyrolysis of sewage sludge. Environ. Technol. 36, 470–478. doi: 10.1080/09593330.2014.952343
Choi, Y. S., Johnston, P. A., Brown, R. C., Shanks, B. H., and Lee, K. H. (2014). Detailed characterization of red oak-derived pyrolysis oil: integrated use of GC, HPLC, IC, GPC and Karl-Fischer. J. Anal. Appl. Pyrolysis 110, 147–154. doi: 10.1016/j.jaap.2014.08.016
Domínguez, A., Menéndez, J. A., Inguanzo, M., and Pís, J. J. (2006). Production of bio-fuels by high temperature pyrolysis of sewage sludge using conventional and microwave heating. Bioresour. Technol. 97, 1185–1193. doi: 10.1016/j.biortech.2005.05.011
Edwards, E. A., and Grbic-Galic, D. (1994). Anaerobic degradation of toluene and o-xylene by a methanogenic consortium. Appl. Environ. Microbiol. 60, 313–322.
Evans, R. J., and Milne, T. A. (1987). Molecular characterization of the pyrolysis of biomass. Energy Fuels 1, 123–137. doi: 10.1021/ef00002a001
Fedorak, P. M., and Hrudey, S. E. (1984). The effects of phenol and some alkyl phenolicson batch anaerobic methanogenesis. Water Research, 18, 361–367.
Fonts, I., Gea, G., Azuara, M., Ábrego, J., and Arauzo, J. (2012). Sewage sludge pyrolysis for liquid production: a review. Renew. Sustain. Energy Rev. 16, 2781–2805. doi: 10.1016/j.rser.2012.02.070
Fonts, I., Kuoppala, E., and Oasmaa, A. (2009). Physicochemical properties of product liquid from pyrolysis of sewage sludge. Energy Fuels 23, 4121–4128. doi: 10.1021/ef900300n
Franchi, O., Rosenkranz, F., and Chamy, R. (2018). Key microbial populations involved in anaerobic degradation of phenol and p-cresol using different inocula. Electron. J. Biotechnol. 35, 33–38. doi: 10.1016/j.ejbt.2018.08.002
Hamidi, S. A., Ekhtari, N., Hosseiny, H., and Khazaei, B. (2017). Using MODIS remote sensing data for mapping the spatiotemporal variability of water quality and river turbid plume in Green Bay. J. Coast. Conserv. 21, 939–950. doi: 10.1007/s11852-017-0564-y
Huber, G. W., Iborra, S., and Corma, A. (2006). Synthesis of transportation fuels from biomass: chemistry, catalysts, and engineering. Chem. Rev. 106, 4044–4098. doi: 10.1021/cr068360d
Hübner, T., and Mumme, J. (2015). Integration of pyrolysis and anaerobic digestion – Use of aqueous liquor from digestate pyrolysis for biogas production. Bioresour. Technol. 183, 86–92. doi: 10.1016/j.biortech.2015.02.037
Khazaei, B., Bravo, H. R., and Bootsma, H. A. (2017). “Using a hydrodynamic and biogeochemical model to investigate the effects of nutrient loading from a wastewater treatment plant into Lake Michigan,” [Abstract] in [B43B-2123] presented at 2017 Fall Meeting, AGU, (New Orleans, LA).
Khazaei, B., Hamidi, S. A., Houghton, S., Bartlett, S., and Bravo, H. R. (2018). “On the Relation between Sediment Concentration and Water Quality Parameters in the Green Bay of Lake Michigan,”in ASLO 2018 Summer Meeting (Victoria, BC)
Laird, D. A., Brown, R. C., Amonette, J. E., and Lehmann, J. (2009). Review of the pyrolysis platform for coproducing bio-oil and biochar. Biofuels Bioproducts Biorefining 3, 547–562. doi: 10.1002/bbb.169
Li, H., Xu, Q., Xue, H., and Yan, Y. (2009). Catalytic reforming of the aqueous phase derived from fast-pyrolysis of biomass. Renew. Energy 34, 2872–2877. doi: 10.1016/j.renene.2009.04.007
Liu, T., and Sung, S. (2002). Ammonia inhibition on thermophilic aceticlastic methanogens. Water Sci. Technol. 45, 113–120. doi: 10.2166/wst.2002.0304
Liu, Z., McNamara, P., and Zitomer, D. (2017). Autocatalytic pyrolysis of wastewater biosolids for product upgrading. Environ. Sci. Technol. 51, 9808–9816. doi: 10.1021/acs.est.7b02913
Liu, Z., Singer, S., Tong, Y., Kimbell, L., Anderson, E., Hughes, M., et al. (2018). Characteristics and applications of biochars derived from wastewater solids. Renew. Sustain. Energy Rev. 90, 650–664. doi: 10.1016/j.rser.2018.02.040
Madigou, C., Poirier, S., Bureau, C., and Chapleur, O. (2016). Acclimation strategy to increase phenol tolerance of an anaerobic microbiota. Bioresour. Technol. 216, 77–86. doi: 10.1016/j.biortech.2016.05.045
McNamara, P. J., Koch, J. D., Liu, Z., and Zitomer, D. H. (2016). Pyrolysis of dried wastewater biosolids can be energy positive. Water Environ. Res. 88, 804–810. doi: 10.2175/106143016X14609975747441
Owen, W. F., Stuckey, D. C., Healy, J. B., Young, L. Y., and McCarty, P. L. (1979). Bioassay for monitoring biochemical methane potential and anaerobic toxicity. Water Res. 13, 485–492. doi: 10.1016/0043-1354(79)90043-5
Park, E. S., Kang, B. S., and Kim, J. S. (2008). Recovery of oils with high caloric value and low contaminant content by pyrolysis of digested and dried sewage sludge containing polymer flocculants. Energy Fuels 22, 1335–1340. doi: 10.1021/ef700586d
Parry, D. L., Lewis, F. M., Vandenburgh, S., Haug, R. T., and Amador, J. (2012). Pyrolysis of dried biosolids for increased biogas production. Proc. Water Environ. Fed. 2012, 1128–1139. doi: 10.2175/193864712811693533
Rajagopal, R., Masse, D. I., and Singh, G. (2013). A critical review on inhibition of anaerobic digestion process by excess ammonia. Bioresour. Technol. 143, 632–641. doi: 10.1016/j.biortech.2013.06.030
Rosenkranz, F., Cabrol, L., Carballa, M., Donoso-Bravo, A., Cruz, L., Ruiz-Filippi, G., et al. (2013). Relationship between phenol degradation efficiency and microbial community structure in an anaerobic SBR. Water Res. 47, 6739–6749. doi: 10.1016/j.watres.2013.09.004
Rover, M. R., Hall, P. H., Johnston, P. A., Smith, R. G., and Brown, R. C. (2015). Stabilization of bio-oils using low temperature, low pressure hydrogenation. Fuel 153, 224–230. doi: 10.1016/j.fuel.2015.02.054
Seyedi, S. (2018). Anaerobic Co-digestion of Aqueous Liquid from Biosolids Pyrolysis. Thesis. Marquette University.
Speece, R. E. (1996). Anaerobic Biotechnology for Industrial Wastewaters. Nashville, TN: Archae Press, 416.
Speece, R. E. (2008). Anaerobic Biotechnology and Odor/Corrosion Control for Municipalities and Industries. Nashville, TN: Archae Press.
Torri, C., and Fabbri, D. (2014). Biochar enables anaerobic digestion of aqueous phase from intermediate pyrolysis of biomass. Bioresour. Technol. 172, 335–341. doi: 10.1016/j.biortech.2014.09.021
Tsai, W. T., Lee, M. K., Chang, J. H., Su, T. Y., and Chang, Y. M. (2009). Characterization of bio-oil from induction-heating pyrolysis of food-processing sewage sludges using chromatographic analysis. Bioresour. Technol. 100, 2650–2654. doi: 10.1016/j.biortech.2008.11.023
Xiu, S., and Shahbazi, A. (2012). Bio-oil production and upgrading research: a review. Renew. Sustain. Energy Rev. 16, 4406–4414. doi: 10.1016/j.rser.2012.04.028
Yenigün, O., and Demirel, B. (2013). Ammonia inhibition in anaerobic digestion: a review. Process Biochem. 48, 901–911. doi: 10.1016/j.procbio.2013.04.012
Keywords: ammonia toxicity, anaerobic digestion, aqueous phase, autocatalysis, bio-oil, pyrolysis, thermochemical conversion
Citation: Seyedi S, Venkiteshwaran K and Zitomer D (2019) Toxicity of Various Pyrolysis Liquids From Biosolids on Methane Production Yield. Front. Energy Res. 7:5. doi: 10.3389/fenrg.2019.00005
Received: 29 June 2018; Accepted: 17 January 2019;
Published: 08 February 2019.
Edited by:
Claire Dumas, Institut National de la Recherche Agronomique (INRA), FranceReviewed by:
Maizirwan Mel, International Islamic University Malaysia, MalaysiaVivekanand Vivekanand, Malaviya National Institute of Technology, India
Copyright © 2019 Seyedi, Venkiteshwaran and Zitomer. This is an open-access article distributed under the terms of the Creative Commons Attribution License (CC BY). The use, distribution or reproduction in other forums is permitted, provided the original author(s) and the copyright owner(s) are credited and that the original publication in this journal is cited, in accordance with accepted academic practice. No use, distribution or reproduction is permitted which does not comply with these terms.
*Correspondence: Daniel Zitomer, ZGFuaWVsLnppdG9tZXJAbXUuZWR1