 Hui Liang
 Nejdet Erkan
 Virginie Solans
 Shunichi Suzuki1
- 1Department of Nuclear Engineering and Management, The University of Tokyo, Tokyo, Japan
- 2Nuclear Professional School, The University of Tokyo, Ibaraki, Japan
- 3Section of Physics, École Polytechnique Fédérale de Lausanne (EPFL), Lausanne, Switzerland
In the decommissioning of damaged Fukushima Daiichi reactors, the melted and re-solidified fuel debris in the bottom of the reactor pressure vessel and primary containment vessel need to be cut into small pieces before removing them from reactor buildings. During the cutting operations, submicron radioactive aerosol particles are expected to be generated and dispersed into the atmosphere of the primary containment vessel. Those suspended particles must be removed from the air atmosphere inside the containment before escaping to the environment. The water spray system in the upper part of the primary containment vessel is an effective and applicable method to remove airborne radioactive aerosol particles. Computational Fluid Dynamics simulation of aerosol scavenging by spray droplets is complicated but necessary to investigate the aerosol removal process inside the vessel. In this paper, a numerical model was developed and implemented into an open-source computational fluid dynamic code OpenFOAM to simulate the aerosol removal by water spray droplets with considering the collection mechanisms of inertial impaction, interception, and Brownian diffusion. In this model, the dispersed spray droplets were described using the Lagrangian particle tracking method, the continuous particle-laden gas was described using the Eulerian method, and a two-way interaction between dispersed and continuous phases was considered. The polydisperse aerosol particles at different diameters from 0.2 to 1 μm were treated as different gas species of the continuous phase. Continuity equations of each gas specie were solved using a passive scalar transport equation. The numerical model was validated by comparing the simulation results with the experimental data obtained from UTARTS facility. Simulation results agreed well with the experimental results. The simulation results provided more insights to better understand the aerosol removal process, including the time evolution of aerosol mass fraction and flow field of the gas phase.
Introduction
In the decommissioning of Fukushima Daiichi reactors, the re-solidified fuel debris in the bottom of the reactor pressure vessel (RPV) and primary containment vessel (PCV) need to be cut into small pieces before removing them from reactor buildings (Porcheron et al., 2018). The aerosol clouds will be generated in the cutting process and the small particles attached on the surface of internal structures may also resuspend. These aerosol particles will disperse in the air atmosphere of PCV and must be suppressed inside the reactor buildings. Otherwise, they may escape to the outside environment and impose unpredictable health effects on the decommissioning workers and also on the public with intensified inhaled radiation doses.
The water spray system in the upper part of PCV is originally designed to depressurize the containment vessel and mix the stratified atmosphere during a hypothetical severe accident. However, it is also an effective and applicable mitigation method to remove the suspended aerosol particles in the PCV atmosphere. The aerosol particles can be removed by water spray droplets under different collection mechanisms, including mechanical effects (inertial impaction, interception, and Brownian diffusion) and phoretic effects (diffusiophoresis and thermophoresis) (Williams et al., 1997). Though these mechanisms work simultaneously, different mechanism dominates in different size range: Brownian diffusion predominates for the scavenging of particles with diameter dP < 0.1 μm; while inertial impaction and interception are predominant for particles with dP > 1 μm; the phoretic effects are negligible when the temperature difference between droplets and particle-laden gas is small (Ardon-Dryer et al., 2015). Within the size range of 0.1–1 μm (also called Greenfield gap), neither mechanism works efficiently, and the total collection efficiency is much lower than that of other size ranges (Greenfield, 1957).
It is important to clarify the size distribution of generated aerosol particles for the Fukushima case since aerosol particles with different diameters will be removed by spray droplets under different mechanisms. The laser cutting experiments were conducted on in- and ex-vessel fuel debris simulants in IRSN, France (Journeau et al., 2017; Porcheron et al., 2018). The experiments yielded aerosol particles with the diameter sizes of 0.01–10 μm, and its mass mean diameter D50 was 0.16 μm for the ex-vessel cutting and 0.27 μm for the in-vessel cutting, which indicated that a large proportion of generated aerosol particles had sizes within the Greenfield gap. So, the collection mechanisms of inertial impaction, interception, and Brownian diffusion will work simultaneously but not that efficiently when these aerosol particles are removed by spray droplets.
Previous researchers had conducted aerosol removal experiments by water sprays. The French research institute IRSN performed aerosol removal tests in the TOSQAN facility, which was initially pressurized with steam to simulate the primary circuit breach and seeded with silicon carbide (SiC) particles with arithmetic mean diameter D10= 1.11 μm to simulate the released fission products (Porcheron et al., 2010). Their results showed that water spray can significantly remove aerosol particles under the mechanical effects and also diffusiophoresis caused by the steam concentration gradient around spray droplets. Based on the aerosol removal experiments in the TOSQAN facility, an aerosol removal model with considering mechanical and phoretic collection mechanisms was developed and implemented in the Lumped-parameter Accident Source Term Evaluation Code (ASTEC; Marchand et al., 2006). The aerosol washout experiments were also conducted in the THAI experimental facility, in which the soluble Cesium Iodine (CsI) particles with a mean diameter of 1.76 and 1.19 μm were used as fission product simulants and the containment was pressurized up to 1.5 bar (Kaltenbach and Laurien, 2018). The corresponding numerical simulation was conducted in commercial CFD software ANSYS CFX with employing Euler-Euler two-fluid and Euler-Euler three-fluid approaches. In their numerical model, the water spray droplets were treated as a component in the continuous phase and conservation equations were solved by using the Eulerian method. Different mechanisms including settling, inertial impaction, interception, and Brownian diffusion were implemented to ANSYS CFX via user-defined functions. However, the priority of the Lagrangian method over the Eulerian method in modeling the dispersed spray droplets was proved by previous research (Ding et al., 2017). Goniva et al. (2009) simulated the capturing of dust particles by droplets in a Venturi scrubber using a Euler–Lagrange approach with CFD code OpenFOAM (Open-source Field Operation And Manipulation). The droplets were modeled in a Lagrangian frame of reference and the gas phase was solved using the Eulerian approach, while the fine dust particles were treated as additional passive Eulerian phases. The dust particles were represented by 6 diameter fractions ranging from 0.1 to 1 μm and the collection mechanisms of inertial impaction, interception and Brownian diffusion were considered. The advantage of the Lagrangian method in modeling dispersed droplets was taken in their simulation. Nevertheless, the simulated capturing efficiency did not agree well with experimental data for smaller particles with diameter dP < 0.4 μm in low gas velocity case. What's worse, in high gas velocity case the accuracy of the capturing prediction for all diameters within 0.1–1 μm was not yet satisfying. This might be caused by an unsuitable choice of empirical correlations in defining the collection efficiency of different mechanisms, especially Brownian diffusion which works more effectively for removing smaller particles in a moderate or low inertia dominated flow fields. Moreover, the flow physics in a Venturi scrubber were different from that in the spray systems. In a Venturi scrubber, droplets were formed by atomization of the liquid when high-velocity gas flowed through and came into contact with the liquid at the Venturi throat. For spray systems, high-velocity spray droplets were injected into gas phase using spray nozzles and large velocity gradients existed between the areas with and without spray droplets.
Fukushima problem exclusively differs from the aforementioned studies, particularly, in terms of the thermal-hydraulic conditions, such as pressure and temperature, and spatial dimensions i.e., a large enclosure with coexisting multi variable flow fields. In addition, many empirical correlations in literature are available for describing the collection efficiency of different mechanisms. Proper correlations should be selected to predict the capture of particles accurately, especially for smaller particles with dP < 0.4 μm. Considering these factors, a new numerical model of aerosol scavenging by water spray droplets for Fukushima case is needed. The aim of this paper is to develop the aerosol removal model which can predict the capturing of smaller particles more accurately comparing with previous researches. Still, the Lagrangian particle tracking method was used to model dispersed spray droplets and the collection mechanisms of inertial impaction, interception, and Brownian diffusion were considered to remove aerosol particles as Goniva et al. (2009) did. However, more case-specific empirical correlations, especially the collection efficiency of inertial impaction for particles with smaller Stokes number and the collection efficiency of Brownian diffusion which predominates for the scavenging of smaller particles in a moderate or low inertia dominated flow fields, were chosen and implemented into OpenFOAM source code. The numerical model was validated by comparing the simulated time evolution of total aerosol mass and the aerosol mass at different diameters ranging from 0.2 to 1 μm with experimental data. The simulation results were expected to provide more detailed information for a better understanding of the aerosol scavenging process.
Numerical Simulation Model in OpenFOAM
Euler-Lagrange Approach
In this study, numerical simulations of aerosol removal by water spray droplets were carried out using the Euler-Lagrange approach. The Euler method was used to describe the continuous phase (particle-laden gas) and the Lagrange method was used to describe the dispersed phase (spray droplets). The continuous phase was consistent with air and small Zirconium dioxide (ZrO2) particles. The ZrO2 particles at different diameters were viewed as different gas species in the continuous phase and were transported by diffusion and convection. The particles were small enough (0.2–1 μm in the current study) to ensure the Stokes number St was below 1. Thus, the suspended particles can follow the flow of the gas phase very well and had the same velocity as the gas phase. Continuous phase and dispersed droplet phase influenced each other by means of drag force. Aerosol removal was considered as source and sink terms in mass equations. Such kind of simulations can be realized using the sprayFoam solver in OpenFOAM together with our developed aerosol removal model.
Originally, the sprayFoam solver inside OpenFOAM was used to simulate high-pressure diesel injection in the form of droplet parcels using the Lagrangian particle tracking method. In this study, the sprayFoam solver was used to simulate the dispersed spray droplets. Also, the existed phase change model in OpenFOAM was used to simulate the steam condensation on cold water spray droplets (Erkan and Okamoto, 2015). Similar to the process of steam condensation on the spray droplet surface, the aerosol particles were also captured on the droplet surface due to different collection mechanisms. In this study, an aerosol removal model considering the mechanical collection mechanisms was developed based on the steam condensation model and was implemented into the OpenFOAM source code to simulate the aerosol scavenging by water spray droplets.
Governing Equations
The control equations for different phases and the empirical formula for calculating the collection efficiency of different collection mechanisms are presented below. The energy conservation equation is not considered because the temperatures of spray droplets and particle-laden gas are both at room temperature.
Particle-Laden Gas Using Eulerian Method
The total mass transfer equation for the particle-laden gas phase can be written as:
where, ρ is gas density, t is time, UG is gas velocity, is the sink term to model aerosol removal by spray droplets.
All species in the gas phase are solved by the passive scalar transport equation and only aerosol particles are consumed due to the capturing by spray droplets. The mass equation for individual specie in the gas phase can be described as:
where, Yi is the mass fraction of aerosol with a diameter of dP,i for ith gas specie (i = 1, 2, 3, ⋯ ). μeff is the total viscosity and is defined as the sum of laminar and turbulent viscosities, i.e., μeff = μL + μT. The source term is non-zero only for aerosol particle species.
The momentum transport equation is:
where, p is the pressure, g is the gravitational acceleration, FS is the momentum source term induced by the spray droplets. dev returns the deviatoric part of a symmetric tensor defined as .
Spray Droplets Using Lagrangian Method
The dispersed spray droplets are described using the Lagrangian particle tracking method. The method assumes that spray injection consists of different droplet parcels and each parcel consists of many spray droplets sharing the same location, diameter, velocity, and temperature. In current simulations, droplets are assumed to be spherical and droplet fragmentation and coalescence are neglected because of their limited effect on aerosol removal. The motions of droplets are affected by the drag force FD from continuous phase and gravity force GD. And the motion equation for one droplet can be described as:
where, mD is droplet mass and UD is droplet velocity. The drag force FD and gravity force GD are written as:
where, dD is droplet diameter, CD is the drag coefficient, and ρD is droplet density.
Modeling of Aerosol Removal by Water Spray Droplets
Among all the aerosol collection mechanisms, the inertial impaction, interception, and Brownian diffusion play more important roles for removing aerosol particles than diffusiophoresis and thermophoresis (Hähner et al., 1994; Williams et al., 1997). So only the first three mechanisms are considered in our aerosol removal model as depicted in Figure 1.
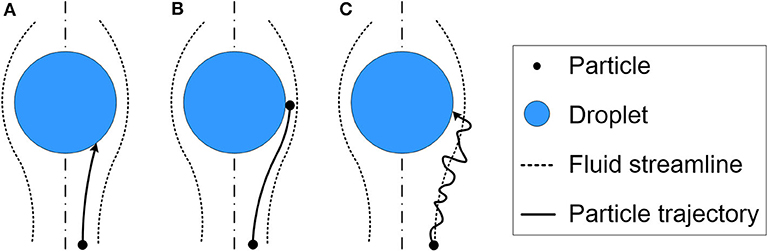
Figure 1. Aerosol collection mechanisms of (A) inertial impaction; (B) interception; and (C) Brownian diffusion (Hähner et al., 1994, with permission from the copyright holder John Wiley and Sons).
To model the inertial impaction accurately, the single droplet collection efficiency of inertial impaction ηimp is defined according to different Stokes number St ranges (Powers and Burson, 1993):
The modified Stokes number St is used for characterizing inertial collection (Goniva et al., 2009):
where, ρP is particle density, μG is the dynamic viscosity of air.
The single droplet collection efficiency for interception ηint is given by Park et al. (2005):
where, αL is the volume fraction of liquid phase, J and K are empirical factors, σ is the ratio of dynamic viscosities between droplets and gas phase , R is a ratio of diameters between aerosol particle and spray droplet .
The single droplet collection efficiency for Brownian diffusion ηdiff is given by Powers and Burson (1993):
with ,
where, Pe is the Peclet number, Ddiff is the diffusion coefficient, kB is Boltzmann constant, vG is the kinematic viscosity of air, C is the Cunningham correction factor and is defined as:
here, l is mean free path length of air.
The total collection efficiency for a single droplet ηtotal can then be calculated as:
To calculate the removed aerosol mass dmD,i by a single droplet during time dt, the volume V that one droplet passes through during time dt and the aerosol molar concentration CAPs,i need to be considered. And they have the following relationship:
where, mD,i is the droplet mass increase due to capturing of ith gas specie, CAPs,i is the molar concentration of ith gas specie around the droplet, and MAPs,i is the molecular weight of ith gas specie.
Thus, the mass variation rate of a single droplet caused by capturing ith gas specie is calculated as:
And the total mass variation rate of a single droplet is:
Validation Experiment
Experiment Setup
Figure 2 depicts the schematic layout of the vessel and instrumentation, as well as other equipment in our experimental setup of UTARTS facility (Aerosol Removal Tests using Water Spray in the University of Tokyo). Aerosol scavenging experiments were conducted inside a cylindrical vessel with two hemispherical heads made of stainless steel (with a height of 2.5 m, internal diameter of 1.5 m, and total volume of 3.92 m3). Thirteen optical windows were designed on the lateral side of the vessel for observing the experimental phenomena and measuring the spray droplet size and velocity. Several small holes were designed in the walls of the vessel for the insertion of instrumentation. The ZrO2 particles with mass mean diameter D50 of 0.15 μm was put inside the aerosol generator and then dispersed inside the vessel. The ZrO2 particles were chosen as aerosol particle simulants because there was a large proportion of ZrO2 according to chemical compositions of in-vessel fuel debris simulants (Journeau et al., 2017). The full-cone spray nozzle was used to inject spray droplets at 300 mm below the top of the vessel. Water for the spray was pumped from a water tank at the flow rate of 2 L/min. During the experiment, the sampling gas flow was pulled from the measurement point on the half radius of the vessel and 1,400 mm below the nozzle outlet and then transferred to the aerosol analyzer Welas2000 to measure the aerosol number concentration. The Welas2000 is a light-scattering spectrometer system which determines particle concentration in the range from <1 particle/cm3 up to 106 particles/cm3 and size between 0.2 and 10 μm. An aerosol particle outlet pipe with a High-efficiency Particulate Air (HEPA) filter near the spray nozzle entrance flange was used to exhaust the aerosol-containing gas to the outside. The water accumulated at the lower plenum of the vessel was discharged outside with a water drain pipe at the bottom of the vessel.
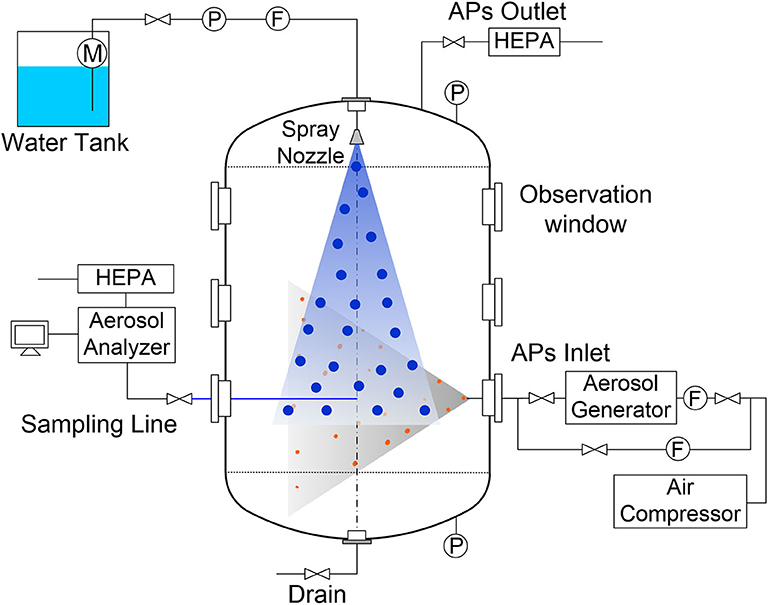
Figure 2. UTARTS facility (Aerosol Removal Tests using Water Spray in the University of Tokyo).
Experiment Procedure
The experiment procedure is as below. The experiment began with the injection of aerosol particles. After the aerosol concentration reached the targeted value, the aerosol injection was stopped. Then we waited for 10 min so that large particles can deposit and other aerosol particles can disperse inside the vessel uniformly. Then the spray injection was activated and spray droplets were continuously injected inside the vessel to remove the aerosol particles. Each experiment case was repeated for three times to check the experiment repeatability.
Validation Experiment Cases
Two experiment cases using two different full-cone spray nozzles were used to validate our numerical simulation model. The two spray nozzles are spray nozzle 1 (model: 1/8GG-SS3004, from the Spraying System Company) and spray nozzle 2 (model: TG2, also from the Spraying System Company), respectively. The spray injection flow rate in both cases was kept at 2 L/min during the experiments. The spray droplet size distribution of two nozzles was measured using a non-intrusive technique of Interferometric Laser Imaging for Droplet Sizing method (Lemaitre et al., 2006) and results are shown in Figures 3A,B, respectively. For spray nozzle 1, most droplets have a size between 121 and 340 μm, with a peak around 195 μm. While for spray nozzle 2, there exist two size groups of droplets, the smaller ones have a peak of around 103 μm, and the larger ones have a peak of around 308 μm. Also, the velocity fields of spray droplets were measured using a non-intrusive technique of Particle Image Velocimetry (Raffel et al., 2018) as shown in Figures 3C–F. For nozzle 1, the measurement area was 207.5 mm below the spray nozzle exit. Based on the PIV measurement results, the spray nozzle 1 has a narrow spray angle of 27° and its maximum droplet velocity magnitude was 22.22 m/s. For nozzle 2, its measurement area was 250 mm below the nozzle outlet. The corresponding spray angle was 66° and the maximum droplet velocity magnitude was 15.05 m/s.
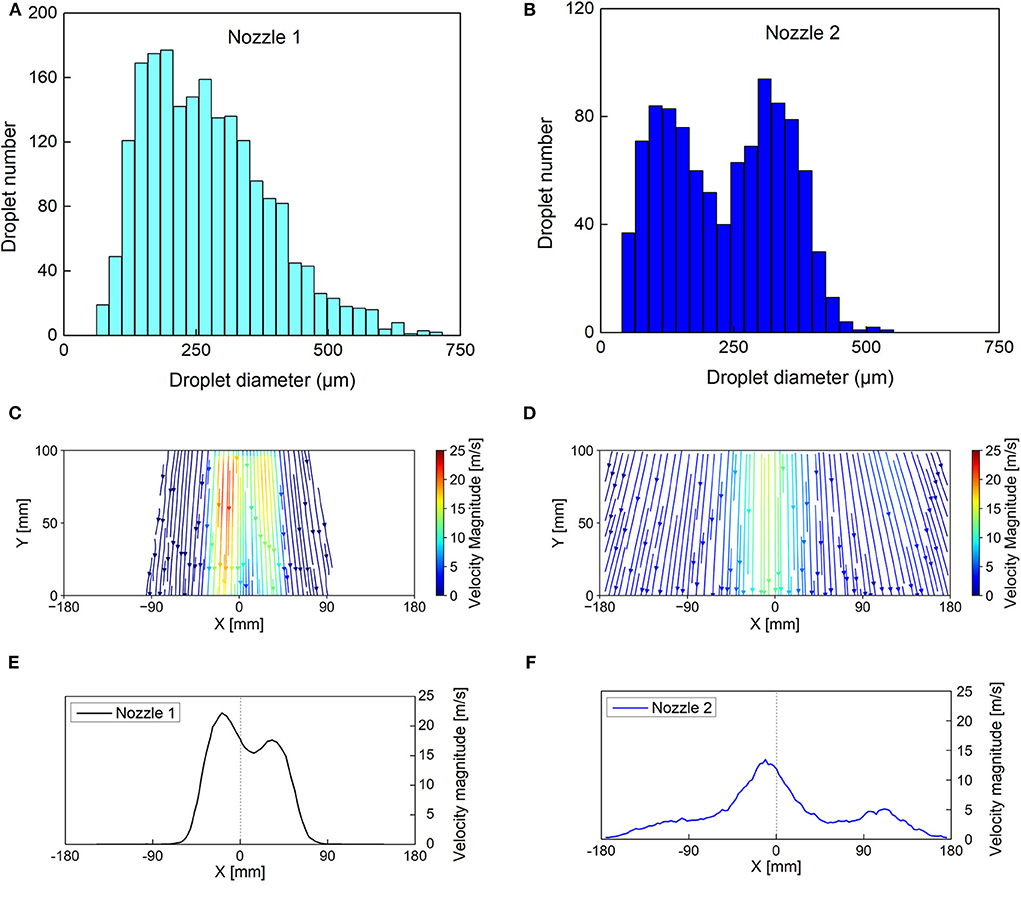
Figure 3. Spray characterization: (A) spray droplet size distribution of nozzle 1; (B) spray droplet size distribution of nozzle 2; (C) spray droplet streamlines of nozzle 1; (D) spray droplet streamlines of nozzle 2; (E) droplet velocity magnitude at 250 mm below the outlet of nozzle 1; and (F) droplet velocity magnitude at 250 mm below the outlet of nozzle 2.
Simulation of Aerosol Scavenging by Spray Droplets
Boundary Conditions
The numerical simulation was conducted using the three-dimensional geometry of the vessel (2.5 m height, 1.5 m diameter, and 3.92 m3 volume) as shown in Figure 4A. The spray nozzle was installed 300 mm below the top of the vessel. Three different mesh schemes were used in the simulation to conduct the mesh independence check and the mesh details were listed in Table 1. The total number of cells for coarse, medium and fine mesh was 141335, 268252, and 555653, respectively. The mesh details on a vertical slice of medium mesh are shown in Figure 4B. Since the interaction between aerosol particles and spray droplets were focused while the flow in the wall-adjacent area was not that important for the interaction, only two layers were added in the boundary layer near the vessel's internal wall. The maximum skewness for all three meshes was smaller than 0.54. The simulated physical time for both cases was the first 1,200 s from the spray activation.
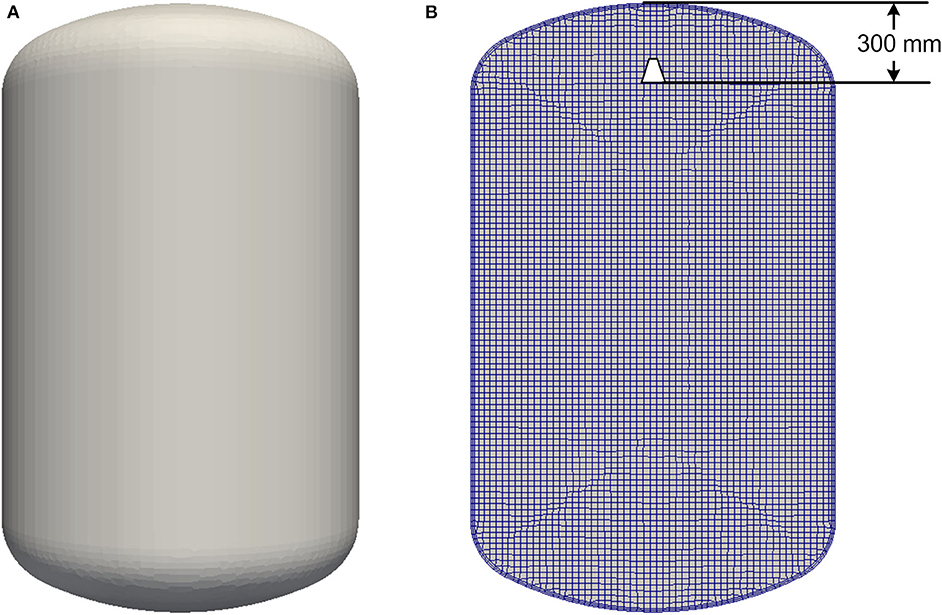
Figure 4. (A) Geometry of the vessel and (B) mesh details on a vertical slice.
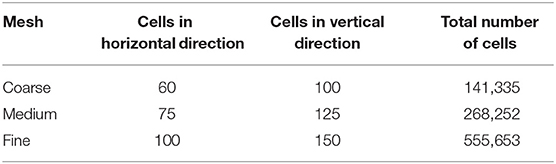
Table 1. Mesh schemes for the mesh independence check.
Two numerical simulation cases were conducted corresponding to the two validation experiment cases as shown in Table 2. The simulation case 1 was conducted at 291 K and atmospheric pressure, while case 2 was conducted at 288 K and atmospheric pressure. The orifice diameter for both nozzles was 1.2 mm. The spray injection flow rate was set as 2 L/min for both simulation cases. The measured droplet size and spray angle of nozzle 1 and nozzle 2 were used in simulation case 1 and case 2, respectively. The accumulation of spray water at the bottom of the vessel was neglected by setting those spray droplets would disappear once they hit the internal wall of the vessel. The adjustable time step was chosen for all simulation cases under the condition that Courant number Co < 1. The convergence criteria were set as 10−6 for all transient terms.
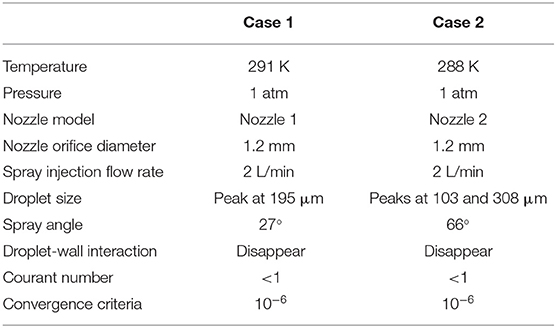
Table 2. Boundary conditions.
Nine size groups of aerosol particles with diameters from 0.2 to 1 μm were treated as nine gas species named from AP2 to AP10, as shown in Table 3. And the initial aerosol mass at different diameters for simulation was obtained from the measured experimental data. It was assumed that aerosol particles were uniformly dispersed inside the vessel at the beginning of two simulation cases.
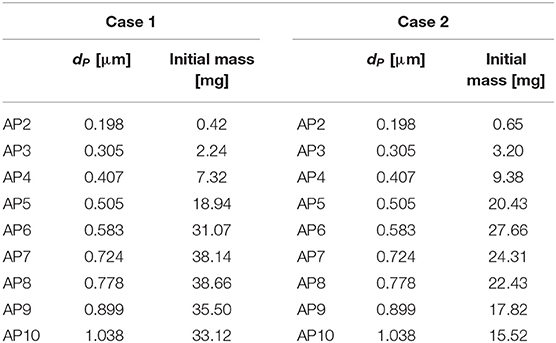
Table 3. Size class of polydisperse aerosol particles.
Simulation Results
Mesh Independence Check
Mesh independence check was conducted by comparing the simulated time evolution of total aerosol mass using three mesh schemes. Take simulation case 1 as an example, the comparison of simulation results using three meshes is shown in Figure 5. According to Figure 5A, the simulation result using coarse mesh was smaller than the results using the other two meshes. If we focus on the details between the spraying time of 1,100–1,200 s as shown Figure 5B, it was found that the maximum difference ratio of simulation results between coarse and medium meshes was 3.82%, while it was only 0.54% between medium and fine meshes. So, the medium mesh was chosen for the following simulation.
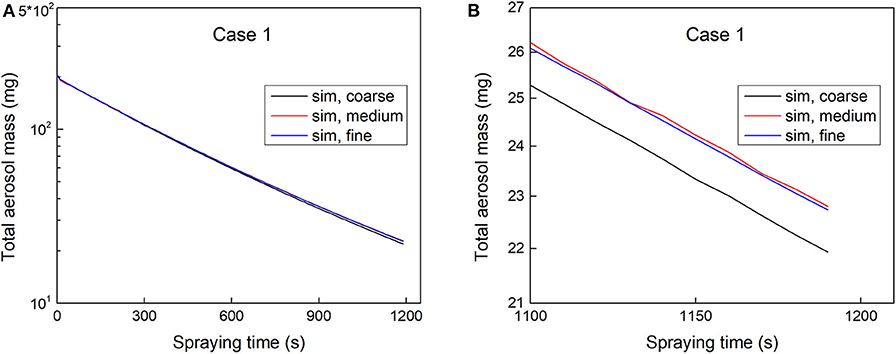
Figure 5. Mesh independence check based on simulation case 1: (A) comparison of total aerosol mass during 0–1,200 s and (B) comparison of total aerosol mass during 1,100–1,200 s.
Validation of Aerosol Removal Model
Comparison of the time evolution of aerosol mass at different diameters between experimental and simulation results was used to validate our numerical model. Take case 1 as an example as depicted in Figures 6A,B, the simulation results were in good agreement with experimental data at particle diameters ranging from 0.2 to 1 μm. Therefore, the aerosol removal model can predict the time evolution of aerosol mass at different diameters very well, even for small aerosol particles of dP < 0.4 μm. For aerosol particles with a diameter of 1 μm, the measured aerosol mass was a little smaller than that of the simulation results. This was likely to be caused by the deposition of large particles. Moreover, the comparison of the time evolution of total aerosol mass between experiment and simulation results was also used to validate our numerical model. Figure 6C is for case 1 and Figure 6D is for case 2. For both cases, a good agreement can be found between the simulation results and experimental data.
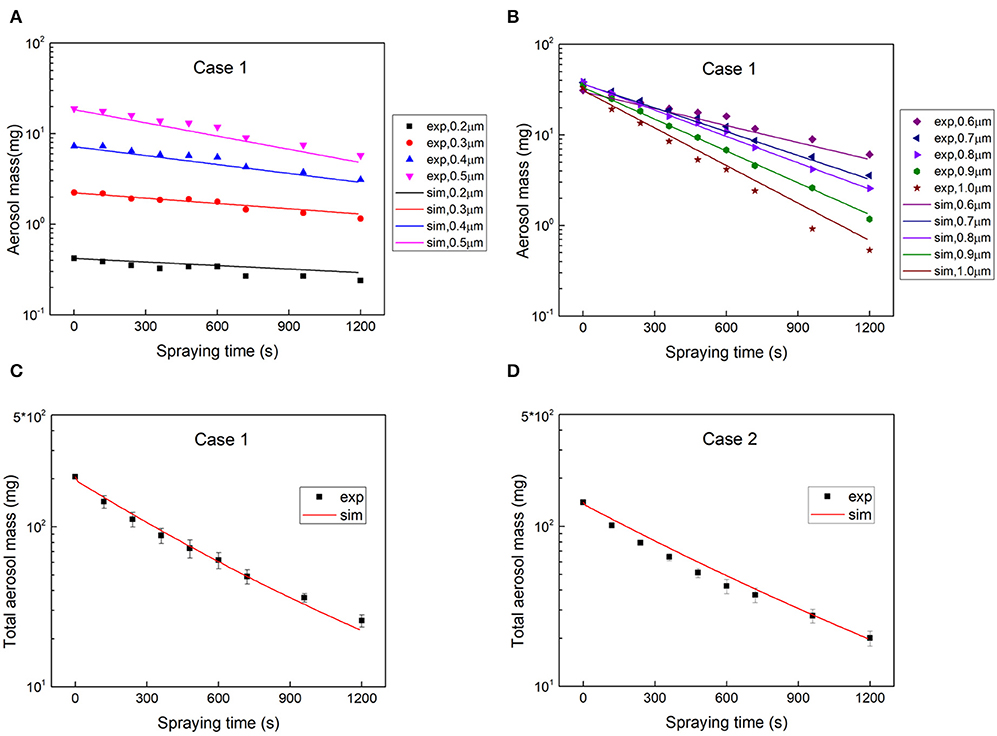
Figure 6. Validation of aerosol removal model: (A) comparison of the time evolution of aerosol mass at dP of 0.2–0.5 μm based on case 1; (B) comparison of the time evolution of aerosol mass at dP of 0.6–1 μm based on case 1; (C) comparison of the time evolution of total aerosol mass based on case 1; and (D) comparison of the time evolution of total aerosol mass based on case 2.
Based on the above comparisons, our aerosol removal model with considering collection mechanisms of inertial impaction, interception, and Brownian diffusion was capable of simulating aerosol removal by water spray droplets for particles with diameters from 0.2 to 1 μm.
Spray Droplets
Figure 7 shows the simulated spray droplets and velocity magnitude of gas-phase for two simulation cases. The spheres stand for spray droplets and the spheres' color refers to the spray droplet diameters as shown in the color bar. The spray droplets would disappear once they hit the vessel's internal wall. The background of the slice refers to the velocity magnitude of the gas-phase. Since two-way coupling was considered in our simulation, the velocity magnitude of the gas-phase was higher inside the spray region than that in other areas, which was caused by the drag between the continuous phase and dispersed phase.
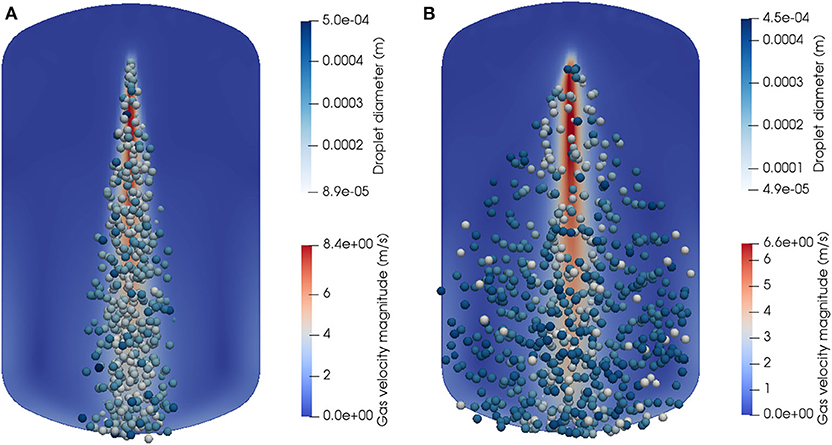
Figure 7. Spray droplets modeling using the Lagrangian particle tracking method: (A) nozzle 1 with a narrow spray angle of 27° and (B) nozzle 2 with a wide spray angle of 66°.
Time Evolution of Aerosol Mass Fraction During Spraying
Figure 8 shows the time evolution of aerosol mass fraction for aerosol particles having a diameter of 0.6 μm (AP6) in case 1. At the beginning t = 0 s as shown in Figure 8A, the aerosol particles were uniformly dispersed inside the vessel. Once the spray injection was activated, the aerosol particles near spray droplets were removed firstly as shown in Figure 8B. From Figures 8B–E, the aerosol particles near the bottom left and right sides started to be removed and the regions expanded along with the spraying time. In Figure 8E at the spraying time of t = 10 s, the washout region in two bottom sides did not expand any more, while the aerosol particles in the upper space of the vessel started to be removed. From t = 10 s, there existed clear boundaries among different regions as shown in Figures 8E–H, which can be explained with the velocity vectors of gas-phase as shown in Figure 9.
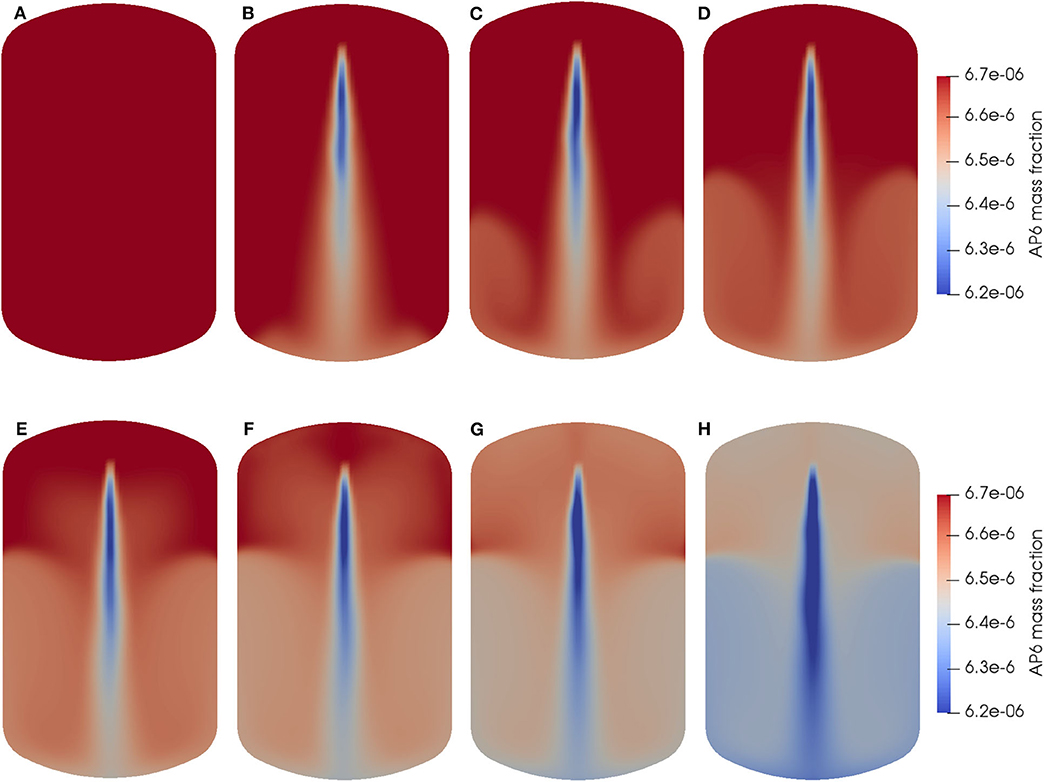
Figure 8. Time evolution of AP6 mass fraction during spraying of simulation case 1: (A) t = 0 s; (B) t = 1 s; (C) t = 3 s; (D) t = 5 s; (E) t = 10 s; (F) t = 15 s; (G) t = 20 s; and (H) t = 30 s.
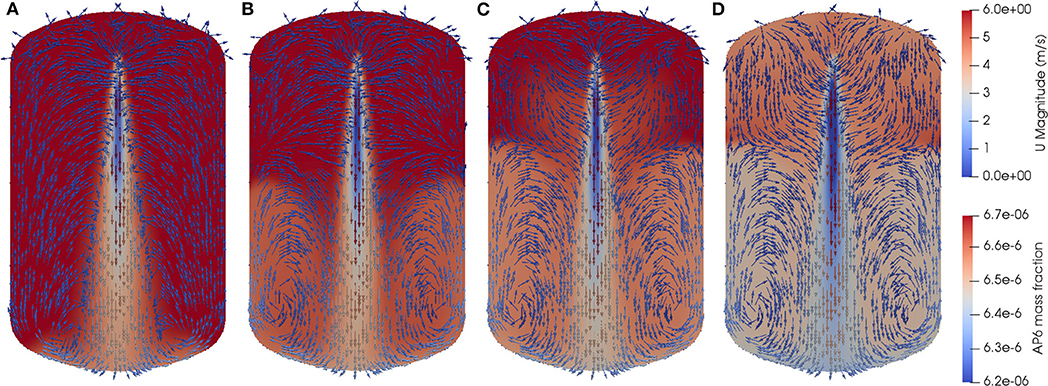
Figure 9. Gas velocity vectors together with AP6 mass fraction of simulation case 1: (A) t = 1 s; (B) t = 5 s; (C) t = 10 s; and (D) t = 20 s.
Figure 9 shows both velocity vectors of gas-phase and AP6 mass fraction for case 1 during the spraying time of the first 20 s. The vectors refer to velocity vectors of the gas-phase and the background of slice refers to AP6 mass fraction. In Figure 9A at t = 1 s, two vortex structures started to form at two lateral sides near the bottom of the vessel. Then the vortex structures developed and shifted upwards until they became dynamically stable at t = 10 s as depicted in Figure 9C. The aerosol particles circulated along with the vortex structures in the lower space of the vessel then were entrained inside the spray region, and finally were removed by spray droplets. From Figures 9C,D, the aerosol particles in the upper part of the vessel were also entrained inside the spray region.
Figure 10 shows the time evolution of AP6 mass fraction for case 2 and Figure 11 shows the velocity vectors of gas-phase and AP6 mass fraction for case 2. The results also exhibited vortex structures and clear boundaries among different flow regions as that in case 1. However, spray nozzle 2 can cover a wider area due to its wider spray angle. And the vortex structures were larger in case 2 than that in case 1.
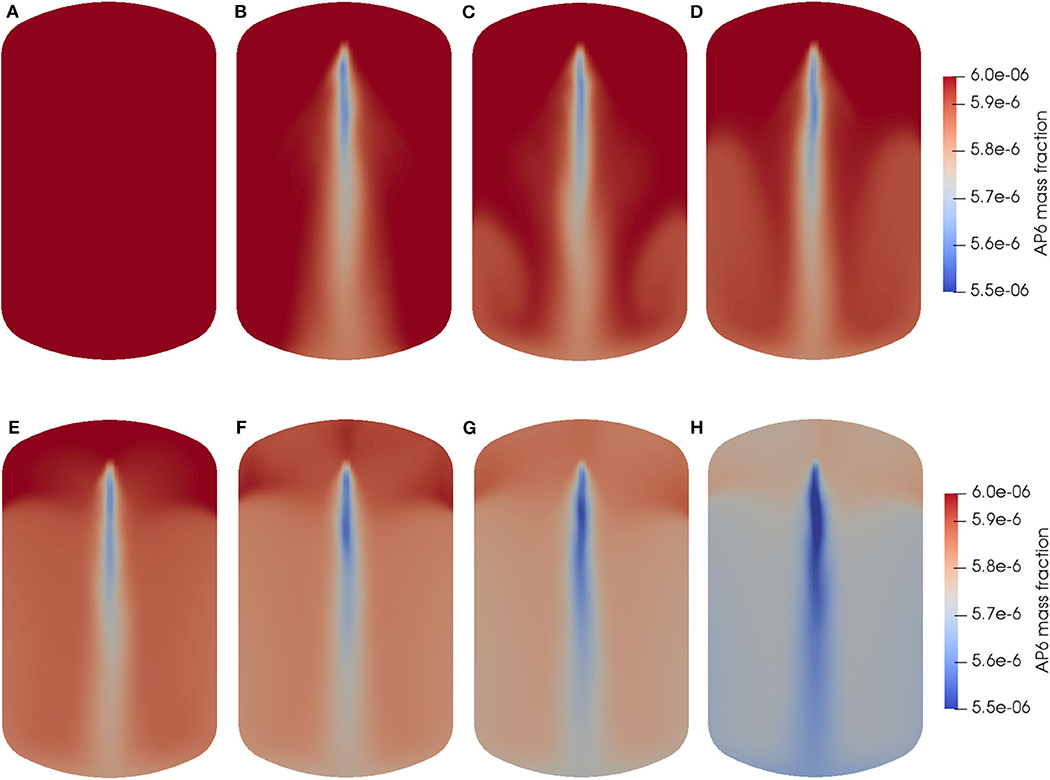
Figure 10. Time evolution of AP6 mass fraction during spraying of simulation case 2: (A) t = 0 s; (B) t = 1 s; (C) t = 3 s; (D) t = 5 s; (E) t = 10 s; (F) t = 15 s; (G) t = 20 s; and (H) t = 30 s.
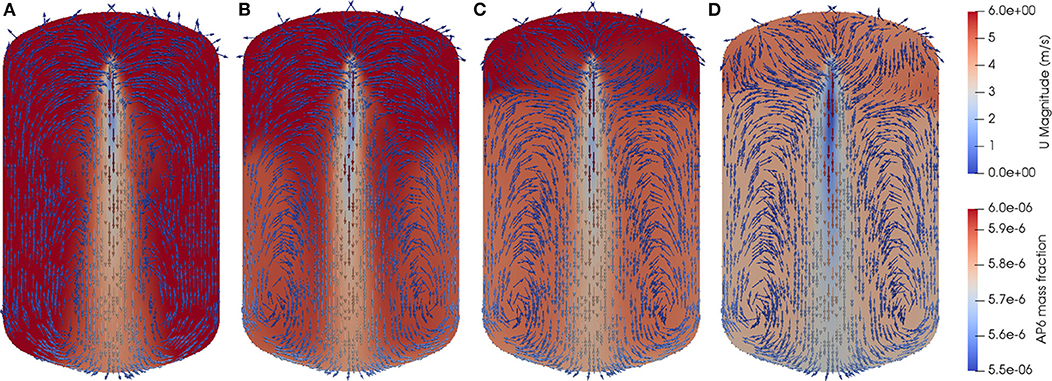
Figure 11. Gas velocity vectors together with AP6 mass fraction of simulation case 2: (A) t = 1 s; (B) t = 5 s; (C) t = 10 s; and (D) t = 20 s.
According to the time evolution of aerosol mass fraction and velocity fields of the gas-phase in two simulation cases, the flow area inside the vessel can be divided into three regions after it became dynamically stable as shown in Figure 12. Region 1 is the spray region (or aerosol washout region), the aerosol particles are mainly removed in this region by interacting with spray droplets directly. Region 2 is the circulation region, aerosol particles in this region circulate along with the vortex structures first, then are entrained inside the spray region, and finally are removed by spray droplets. Region 3 is the entrainment region, the aerosol particles in this region are also entrained inside the spray region first and then removed by spray droplets. Meanwhile, the differences between the two cases are also obvious. The region 1 and region 2 of case 2 are larger than that of case 1 due to different spray angles.
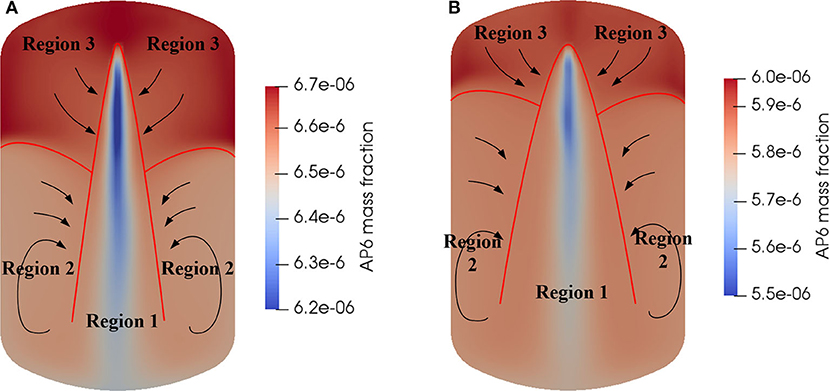
Figure 12. Flow regions inside the vessel during spraying: (A) case 1 with a narrow spray angle and (B) case 2 with a wide spray angle.
Conclusions
In this paper, a numerical model of aerosol scavenging by water spray droplets with considering collection mechanisms of inertial impaction, interception, and Brownian diffusion was developed and implemented into OpenFOAM. Empirical formula from published papers was selected to calculate the collection efficiency of these three aerosol collection mechanisms. The dispersed spray droplets were solved using the Lagrangian particle tracking method and the continuous phase of particle-laden gas was described using the Eulerian method. Nine size groups of aerosol particles with diameters varying from 0.2 to 1 μm were treated as nine gas species in the continuous phase and their movements were solved using passive scalar transport equations. The aerosol removal model was validated by comparing the simulation results about the time evolution of aerosol mass with experimental data and it was proven that the numerical model can predict the removal of aerosol particles accurately, even for smaller particles with dP < 0.4 μm.
The details of the aerosol removal process, including the time evolution of aerosol mass fraction and flow field of gas-phase, were provided by numerical simulation. According to the simulation results, the flow field inside the vessel can be divided into three regions, they are spray region (or aerosol washout region), circulation region and entrainment region. The aerosol particles were mainly removed in the spray region by interacting with spray droplets directly, while the aerosol particles in the circulation region and entrainment region were entrained inside the spray region first and then removed by spray droplets.
When the nozzle 1 with a narrow spray angle was used, the maximum droplet velocity was larger, causing a larger relative velocity between droplets and particle-laden gas and also stronger mixing and turbulence inside the vessel, which was further aiding in removing aerosol particles. When the nozzle 2 with a wide spray angle was used, the spray can cover a wider area, causing a larger spray region and circulation region, which can also increase the interaction between spray droplets and aerosol particles. In the real utilization of the spray system in Fukushima decommissioning, multiple spray nozzles can be used simultaneously. With understanding the aerosol removal process by different spray nozzles, the combination of different spray nozzles can be used to improve the aerosol spray scavenging efficiency. The related experiments and simulations using multiple spray nozzles will be conducted in the future.
Still, there are some improvements can be done about the numerical simulation model for future study. The collection mechanism of thermophoresis was not considered in our aerosol removal model because the temperature difference between spray droplets and particle-laden gas was negligible. However, the humidity inside the vessel may increase after spray activation, thus the diffusiophoresis would start to perform and should be considered in the aerosol removal model.
Data Availability Statement
The raw data supporting the conclusions of this article will be made available by the authors, without undue reservation.
Author Contributions
NE, SS, and HL contributed conception and design of the study. HL and NE carried out the validation experiments. HL, VS, and NE developed the source code of aerosol removal model under supervision of NE. HL conducted the numerical simulation and the results analysis, and wrote the first draft of the manuscript. NE contributed to manuscript revision. All authors contributed to discussion of simulation results.
Funding
This work was financially supported by the Nuclear Energy Science & Technology and Human Resource Development Project from the Japan Atomic Energy Agency/Collaborative Laboratories for Advanced Decommissioning Science.
Conflict of Interest
The authors declare that the research was conducted in the absence of any commercial or financial relationships that could be construed as a potential conflict of interest.
References
Ardon-Dryer, K., Huang, Y. W., and Cziczo, D. J. (2015). Laboratory studies of collection efficiency of sub-micrometer aerosol particles by cloud droplets on a single-droplet basis. Atmos. Chem. Phys. 15, 9159–9171. doi: 10.5194/acp-15-9159-2015
Ding, P., Liu, Y., Wang, B., Li, W., and Wang, J. (2017). The Homogeneous and lagrangian tracking approaches of the spray simulation in the containment. Ann. Nucl. Energy 101, 203–214. doi: 10.1016/j.anucene.2016.09.038
Erkan, N., and Okamoto, K. (2015). “Analysis of PANDA spray experiments performed in two interconnected vessel with openFOAM,” in Proceedings of NURETH-16 (Chicago, IL).
Goniva, C., Tukovic, Z., Feilmayr, C., Burgler, T., and Pirker, S. (2009). “Simulation of offgas scrubbing by a combined eulerian-lagrangian model,” in Proceedings of Seventh International Conference on CFD in the Minerals and Process Industries (Melbourne, VIC). doi: 10.1504/PCFD.2010.035359
Greenfield, S. M. (1957). Rain scavenging of radioactive particulate matter from the atmosphere. J. Meteorol. 14, 115–125. doi: 10.1175/1520-0469(1957)014<0115:RSORPM>2.0.CO;2
Hähner, F., Dau, G., and Ebert, F. (1994). Inertial impaction of aerosol particles on single and multiple spherical targets. Chem. Eng. Technol. 17, 88–94. doi: 10.1002/ceat.270170204
Journeau, C., Monneris, J., Tormos, B., Brissonneau, L., Excoiffier, E., Testud, V., et al. (2017). “Fabricating Fukushima Daiichi in-vessel and ex-vessel fuel debris simulants for the development and qualification of laser cutting technique,” in Proceedings of ERMSAR-2017 European Review Meeting on Severe Accident Research (Warsaw).
Kaltenbach, C., and Laurien, E. (2018). CFD Simulation of aerosol particle removal by water spray in the model containment thai. J. Aerosol Sci. 120, 62–81. doi: 10.1016/j.jaerosci.2018.03.005
Lemaitre, P., Porcheron, E., Nuboer, A., and Grehan, G. (2006). “Interferometric Laser Imaging development for Droplets Sizing (ILIDS) in hostile environment,” in Proceedings of ICLASS (Kyoto).
Marchand, D., Porcheron, E., Lemaitre, P., and Grehan, G. (2006). “Characterization of the washout of aerosol by spraying water for thermal hydraulic conditions representative of a severe accident in a nuclear reactor containment,” in Proceedings of 10th International Conference on Liquid Atomization and Spray Systems (Kyoto).
Park, S. H., Jung, C. H., Jung, K. R., Lee, B. K., and Lee, K. W. (2005). Wet scrubbing of polydisperse aerosols by freely falling droplets. J. Aerosol Sci. 36, 1444–1458. doi: 10.1016/j.jaerosci.2005.03.012
Porcheron, E., Lemaitre, P., Marchand, D., Plumecocq, W., Nuboer, A., and Vendel, J. (2010). Experimental and numerical approaches of aerosol removal in spray conditions for containment application. Nucl. Eng. Des. 240, 336–343. doi: 10.1016/j.nucengdes.2008.08.023
Porcheron, E., Peillon, S., Gelain, T., Chagnot, C., Journeau, C., and Roulet, D. (2018). “Analysis of aerosol emission and dispersion during the laser cutting of Fukushima fuel debris simulants,” in Proceedings of 2018 26th International Conference on Nuclear Engineering (London). doi: 10.1115/ICONE26-81531
Powers, D. A., and Burson, S. B. (1993). A Simplified Model of Aerosol Removal by Containment Sprays (No. NUREG/CR-5966; SAND-92-2689). Washington, DC; Albuquerque, NM: Nuclear Regulatory Commission, Division of Safety Issue Resolution; Sandia National Labs. doi: 10.2172/6503368
Raffel, M., Willert, C. E., Scarano, F., Kähler, C. J., Wereley, S. T., and Kompenhans, J. (2018). Particle Image Velocimetry: A Practical Guide. Cham: Springer doi: 10.1007/978-3-319-68852-7
Williams, K. M. D., Tills, J., Griffith, R. O., Gido, R. G., Tadios, E. L., Davis, F. J., et al. (1997). Code Manual for CONTAIN 2.0: A Computer Code for Nuclear Reactor Containment Analysis. Albuquerque, NM; Sandia National Laboratories, Prepared for the US Nuclear Regulatory Commission, NUREG/CR-6533, SAND97-1735.
Nomenclature
Keywords: CFD, aerosol removal, spray droplets, Euler-Lagrange approach, OpenFOAM, UTARTS
Citation: Liang H, Erkan N, Solans V and Suzuki S (2020) Numerical Simulation and Validation of Aerosol Particle Removal by Water Spray Droplets With OpenFOAM During the Fukushima Daiichi Fuel Debris Retrieval. Front. Energy Res. 8:102. doi: 10.3389/fenrg.2020.00102
Received: 01 April 2020; Accepted: 07 May 2020;
Published: 03 June 2020.
Edited by:
Jun Wang, University of Wisconsin-Madison, United StatesReviewed by:
Xianping Zhong, University of Pittsburgh, United StatesMuhammad Saeed, East China University of Technology, China
Copyright © 2020 Liang, Erkan, Solans and Suzuki. This is an open-access article distributed under the terms of the Creative Commons Attribution License (CC BY). The use, distribution or reproduction in other forums is permitted, provided the original author(s) and the copyright owner(s) are credited and that the original publication in this journal is cited, in accordance with accepted academic practice. No use, distribution or reproduction is permitted which does not comply with these terms.
*Correspondence: Hui Liang, aF9saWFuZ0B2aXMudC51LXRva3lvLmFjLmpw