 Jihong Zhang
 Rui Gao
 Ninghan Xu
 Chaopeng Xie
- The Institute of Quality Development Strategy (IQDS), Wuhan University, Wuhan, China
Promoting the consumption of renewable energy is an important way to optimize power structure, control greenhouse gas emissions and fulfill Intended Nationally Determined Contributions (INDCs) in the Paris Agreement. China's INDCs is to reduce carbon intensity by 60–65% in 2030 (compared to 2005) and promote non-fossil energy consumption proportion in primary energy consumption to 20%. On one hand, China has accomplished its 2020 carbon intensity target in 2017; on the other hand, China also faces certain difficulties achieving the target of 15% non-fossil energy consumption proportion in 2020 and 20% in 2030. Setting appropriate annual overall renewable electricity consumption (REC) and allocating it at sub-national scales can help China reach both carbon intensity and non-fossil energy consumption proportion targets. To this end, we couple the “top-down” and “zero sum gains-data envelopment analysis (ZSG-DEA)” models to form a comprehensive model for the appropriate allocation of REC. First, the “top-down” model was used to calculate the annual overall REC based on the non-fossil energy proportion target. Second, we applied the multi-principle “ZSG-DEA” model to allocate the overall REC effectively among provinces. Based on our analysis, the total REC which can be reached by Chinese government's policy of renewable electricity consumption guarantee mechanism (REC guarantee mechanism) still needs to increase by 15.36 to 20.25% compared with the overall REC calculated by our effectiveness model. In order to achieve non-fossil energy target, 26 provinces need to increase the consumption of renewable electricity compared to their initial shares required by the REC mechanism, most of which are developed coastal areas. Our empirical results provide a scientific basis for the Chinese government to achieve its non-fossil energy targets through the REC guarantee mechanism. We also provide policy makers with ideas for determining the total amount of REC and adjusting the province's consumption responsibility.
Introduction
The development and utilization of non-fossil energy has become an important way for countries around the world to ensure energy security, protect the environment, and respond to climate change (National Development and Reform Commission, 2017). China, as the world's largest greenhouse gas emitter (Zhou et al., 2012), announced its INDCs in 2015, which proposed that its carbon dioxide emissions peak around 2030, striving to reach the peak as soon as possible; the intensity of CO2 emission reduces by 60% to 65% in 2030 compared to the level of 2005; the proportion of non-fossil energy in primary energy consumption increases to about 20%; the 2030's volume of forest reserves increases by 4.5 billion m3 compared with 2005 (Ye et al., 2017; Mo et al., 2018). In 2017, China's carbon intensity decreased by about 46% compared with 2005. It had exceeded the target of 40–45% reduction in carbon intensity in 2020 three years in advance. However, achieving the target of 15% non-fossil energy in 2020 and 20% in 2030 is still a challenge (Shan et al., 2012; Ye et al., 2017). “The China Energy Development Report 2018” shows that in 2018, non-fossil energy accounts for 14.3% of total primary energy consumption, which means that China needs to increase its non-fossil energy share by at least 0.7% to achieve the 2020 non-fossil energy target. However, as shown in Figure 1, the growth of China's non-fossil energy share has significantly slowed down in recent years. Compared with 2016, the non-fossil energy share increased by only 0.3 percentage points in 2017. “China Electric Power Development Report 2017” pointed out that the construction period of nuclear power is extended, and the scale of installed capacity is not expected to meet the planning expectations, which will affect the proportion of non-fossil energy consumption by about 0.2 percentage points.
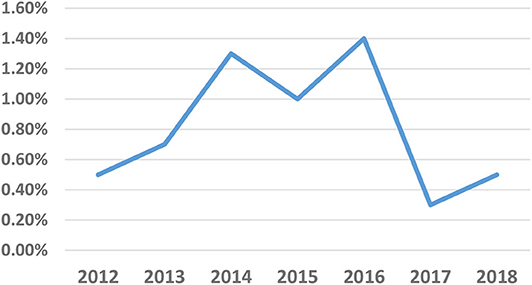
Figure 1. Growth of non-fossil energy proportion in 2012–2018 (China Electric Power Planning and Engineering Institute, 2013, 2014, 2015, 2016, 2017, 2018, 2019).
Non-fossil energy power generation is the main means to increase the proportion of non-fossil energy (Cheng et al., 2010; Shan et al., 2012; Zhou et al., 2012). Studies have shown that the contribution rate of the non-fossil energy power industry to the realization of China's non-fossil energy target is about 80% (Cheng et al., 2010; Ouyang, 2010). Under the influence of the Japanese nuclear leak accident, the development of nuclear power in China has slowed down, which means the realization of non-fossil energy target will mainly depend on the development of renewable energy in the near future (Cheng et al., 2011). Promoting renewable energy generation and consumption requires a balance between top-level design and the underlying foundation. In terms of top-level design, it is necessary to strengthen national legislation, formulate, and improve a series of policy systems related to renewable energy development, such as green power systems, green energy labeling systems, quota systems, renewable energy generation price mechanisms, and preferential investment, and financing mechanism (Yu, 2013; Liu, 2019), etc. In terms of the underlying foundation, it is necessary to coordinate the construction of renewable energy power generation facilities and renewable energy power transmission channels among provinces and regions (Xu et al., 2015; Wang, 2017), and develop renewable energy power generation technologies and large-scale energy storage technologies (Zhao, 2019), etc.
Since the Renewable Energy Law was officially implemented in 2006, China's renewable energy power industry has developed rapidly. In 2018, the installed capacity of renewable energy was 729 million kilowatts, accounting for 38.4% of the total installed power capacity, and renewable energy power generation reached 1.87 trillion kWh, the share of renewable electricity in total electricity increased from 20% in 2012 to 26.7% in 2018 (Zhao, 2019). However, curtailment of renewable electricity generation -i.e., the abandonment of electricity generation of effective power capacity-is becoming part of the “New Normal”1 as wind and solar installation expand across the country (Qi et al., 2018). For example, from 2010 to 2018, 219.9 terawatt hours (TWh), or as much as 13 percent of overall wind generation, was abandoned. In order to further promote the consumption of renewable energy, China's National Development and Reform Commission and the National Energy Administration issued the “Notice on Establishing and Perfecting a renewable electricity consumption Guarantee Mechanism”2 (referred to as the “REC guarantee mechanism”) in May 2019, marking China's renewable portfolio standard policy was formally introduced (Li, 2019). The “REC guarantee mechanism” is one of the most important supporting policies in the renewable energy development process following the Renewable Energy Law (Wang, 2019). According to the experience of renewable portfolio standard in other countries, the “REC guarantee mechanism” can effectively achieve China's non-fossil energy target and establish a long-term mechanism to promote the development and consumption of renewable energy (Jin, 2019). As China's main and most restrictive renewable energy policy in the short term, its design plays a decisive role in achieving China's non-fossil energy goals.
The renewable portfolio standard has been widely used in the energy policy design of many countries and regions in the world. Up to now, more than 100 countries or federal states (provinces) have implemented different forms of renewable portfolio standard (RPS) (Heeter et al., 2019). The design of the RPS mechanism differs in terms of target, compliance entities, eligible resources, operating mechanisms, and penalties (Ringel, 2006; Li and Chen, 2008; Huang et al., 2013; Linnerud and Simonsen, 2017), etc. The renewable portfolio standard related research is also numerous. The research topics include implementation obstacles, implementation effects, and comparison with clean energy subsidy policies (e.g., Feed-in-Tariff) (Yin and Powers, 2010; Zhao et al., 2014; Chang and Li, 2015; Kwon, 2015; Siddiqui et al., 2016; Wiser et al., 2017; Anguelov and Dooley, 2019). However, it needs to be clear that China's REC guarantee mechanism (Figure 2) is different from the RPS in other countries and regions. China's REC guarantee mechanism is that the national-level government places an obligation on provinces to consume a specified fraction of their electricity from renewable electricity, and the provincial government organizes compliance entities to consume renewable electricity in various ways, while other countries' RPS do not set binding goals for the next-level administrative regions (Heeter et al., 2019). The obligatory proportion of renewable electricity (referred to as OP) for each province is the core design of China's REC guarantee mechanism. The OP is set according to renewable power installed capacity, power generation, society's electricity consumption in each province and electricity transmission among provinces, which fully takes the implementation capabilities of provinces into account. However, there are two problems of OP setting: on the one hand, the OP setting is independent of the INDCs, and it remains to be discussed whether the REC guarantee mechanism can achieve the guidance and motivation it should have. On the other hand, only the feasibility of OP is considered, and the principles of equity and efficiency are not taken into account. In view of the above two issues, this paper intends to optimize the allocation of REC in two levels. First, the total amount of REC can effectively achieve the INDCs; second, the inter-provincial allocation takes the principles of equity, efficiency, and achievability into account.
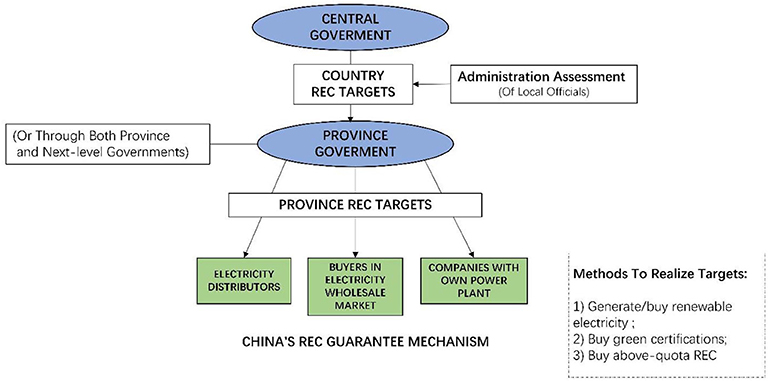
Figure 2. China's REC guarantee mechanism.
The related research on the allocation of the constant total amount is more common in the allocation of carbon emission allowance, energy consumption, and so on among regions (Vaillancourt and Waaub, 2004; Miketa and Schrattenholzer, 2006; Wei et al., 2012; Wang H. et al., 2016; Wu H. et al., 2016; Wu J. et al., 2016; Wang Y. et al., 2017) and industries (Mu et al., 2016; Yang et al., 2017; Chastas et al., 2018). Common allocation methods include weighting method (Zhao R. et al., 2017; Chastas et al., 2018; Fang et al., 2018), scenario analysis method (Chen and He, 2016; Zhao Q. et al., 2017), and zero sum gains-data envelopment analysis (ZSG-DEA) (Gomes and Lins, 2008; Lin and Ning, 2011; Sun et al., 2012; Pan et al., 2015; Qian et al., 2015; Xiong et al., 2017). Among them, the ZSG-DEA model does not need to set weights manually, which largely avoids subjectivity and arbitrariness (Fang et al., 2019). It also can improve the technical efficiency of the entire system (Charnes et al., 1978; Banker et al., 1984), and overcome the unreasonable assumptions that the input or output variables of the decision making units (DMU) in the traditional DEA method are not restricted and unrelated to each other (Lins et al., 2003). More and more studies use ZSG-DEA as a reasonable and powerful means to ensure the allocation of resources and emissions. The principles that allocation should follow are also the focus of academic debate. Although the allocation methods used in the previous studies are different, most studies consider the principle of equity to be the primary principle of allocation (Fang et al., 2019). The literature quantifies the principle of equity from different perspectives such as egalitarianism (e.g., carbon emissions per capita; Pan and Zheng, 2009; Raupach et al., 2014), ability to pay (e.g., GDP per capita; Pan et al., 2014), and grandfather rights (e.g., historical carbon emissions; Wang L. et al., 2017). The allocation principles of efficiency (Miao et al., 2016; Zhao R. et al., 2017) and feasibility (Wang et al., 2011) are also increasingly taken into consideration. Including multiple distribution principles can consider the differences between provinces comprehensively, and ultimately promote the effective implementation of allocation plans (Fang et al., 2019).
Existing literatures on the overall REC allocation mostly use renewable energy potential and consumption as allocation indicators, and the choice of indicators is relatively similar. Wu Rui and He Yongxiu used a top-down decomposition method to construct a target forecasting model for the total amount of renewable electricity and a quota index decomposition model based on renewable energy potential and consumption (Wu and He, 2014). Liu Zhen et al. introduced the EU renewable energy planning model and target decomposition process in detail, and proposed that when the overall target is decomposed into provinces, the renewable energy development potential, economic development level, and the status of renewable energy development should be considered. According to the actual situation in China (Liu et al., 2009), Liu Zhen proposed a target decomposition model based on renewable energy potential and energy consumption (Liu et al., 2011). Since China's REC guarantee mechanism has just been implemented, related research is still at the level of theoretical conception. Actually, there is not much research on the internal logical relationship between China's INDCs and REC allocation. In order to improve the scientific and political relevance of inter-provincial allocation of REC, this paper designs a comprehensive model for the effective allocation of renewable energy consumption based on the INDCs. The model includes two parts: the “Top-down” overall renewable electricity consumption model and a multi-principle allocation model based on “ZSG-DEA.” In general, the contributions of this paper are: (1) we consider the differences between provinces comprehensively, and incorporate multiple principles and corresponding indicators into the allocation model of REC; (2) The comprehensive model for the effective allocation of REC clarifies the internal logical relationship among China's INDCs, the overall REC and allocation method, and provides a new perspective for the future related research; (3) The model can actually calculate the effective overall REC and inter-provincial allocation value, to compare the gap between policies and targets, which can be a reference for determining the renewable electricity consumption allocation in each region in the future.
The rest of the paper is structured as follows. In Section model, the renewable electricity consumption allocation model is designed. Section data and parameter settings describes the model data and parameter settings. Section results shows the results. Conclusions and recommendations are provided in Section conclusions and discussion.
Model
In addition to solving the problems of curtailment of wind power, solar power and hydro, the REC guarantee mechanism is also a main method for the Chinese government to increase the proportion of non-fossil energy in the short term. In order to ensure the realization of China's non-fossil energy targets, the allocation of REC needs to be considered from two aspects. The first one is to calculate an effective overall consumption. The primary task is to clarify the quantitative relationship between the overall REC and non-fossil energy targets. This article uses the renewable electricity market 's contribution rate (Formula 9) to the national non-fossil energy target to reflect this quantitative relationship. The higher contribution rate is, the more effective the renewable electricity market is. The second one is to allocate the overall REC effectively among provinces. We define effective distribution under the principles of “efficiency, equity, and feasibility” and apply a multi-principal ZSG-DEA model to adjust the allocation to reach an optimal state. The model design framework is shown in Figure 3.
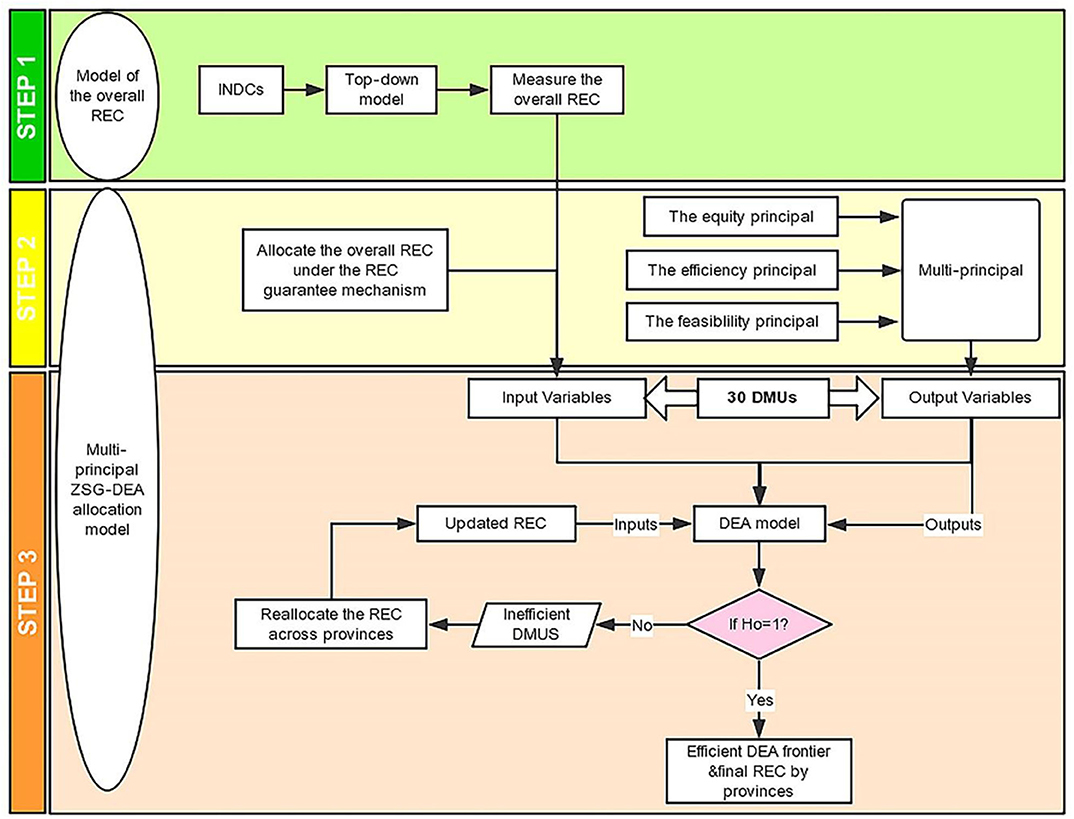
Figure 3. The model design framework.
“Top-Down” Overall Renewable Electricity Consumption Model
The design of the “top-down” overall renewable electricity consumption model is as follows:
First, we assume that the three indicators of non-fossil energy consumption at the national level are: represents the overall non-fossil energy consumption nationwide at the beginning of the planning period, and represents the overall non-fossil energy consumption after t years of implementation of the REC guarantee mechanism. indicates the overall non-fossil energy consumption nationwide under the BAU (Business As Usual) scenario at the end of year t. The BAU scenario refers to the non-fossil energy consumption under the assumptions that no new policies will be introduced and non-fossil energy technologies remain at the old-previous, which means the non-fossil energy will maintain the original speed of development and the ratio of non-fossil energy in primary energy consumption will not change. n denotes non-fossil energy, 0 denotes the beginning of planning period and t denotes it is the t year of planning period. As a result, the three indicators of non-fossil energy consumption can be expressed as:
E refers to the national overall primary energy consumption, R represents the ratio of non-fossil energy in primary energy consumption, η denotes the growth rate of national primary energy consumption during the planning period, ξ represents the growth rate of non-fossil energy ratio during the planning period. All these indicators are non-negative. The relationships among these three indicators are shown in Figure 4.
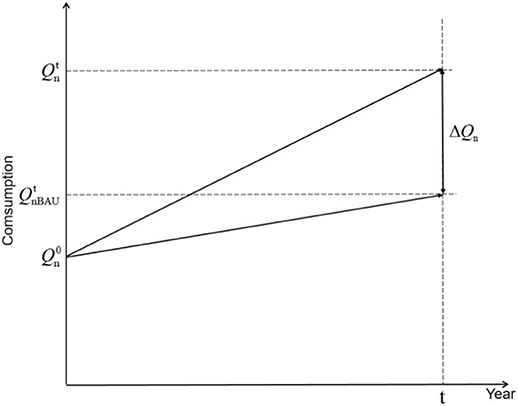
Figure 4. Relationships among , , and .
Therefore, the difference between non-fossil energy consumption with the application of the REC guarantee mechanism and non-fossil energy consumption under the BAU scenario in the planning period can be expressed as:
Similarly, we assume that the three indicators of renewable electricity consumption at the national level are: denotes the overall REC when the planning period starts, denotes the overall REC after t years implementation of the REC guarantee mechanism (the implementation of this mechanism can encourage the innovation of power producers to develop cost-efficient renewable power generation technologies, which may lead to increase in ratio of REC to total electricity consumption) and represents the overall REC under the BAU scenario at the end of year t.
Hence, these indicators of renewable electricity consumption can be written as:
Where m refers to renewable electricity that differs from n, C denotes the national electricity consumption, α represents the proportion of renewable electricity in total electricity consumption, [[Inline Image]]refers to the growth rate of the country's electricity consumption, γ refers to the growth rate of renewable electricity consumption ratio under the implementation of the REC guarantee mechanism and γBAU represents the growth rate of renewable electricity consumption ratio under the BAU scenario. The relationships among these three indicators can be expressed as in Figure 5:
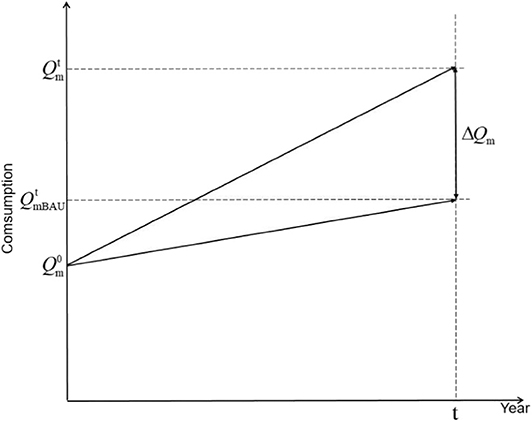
Figure 5. Relationships among , , and .
Similarly, the difference between renewable electricity consumption with the application of the REC guarantee mechanism and renewable electricity consumption under the BAU scenario in the planning period can be expressed as:
We define the contribution rate of the REC guarantee mechanism to national non-fossil energy target as (Unit is unified as standard coal):
m0 denotes the proportion of national renewable electricity consumption in the national non-fossil energy consumption at the beginning of the REC guarantee mechanism's implementation.
After rearranging the formula (9), the growth rate of the renewable electricity consumption ratio after the implementation of REC guarantee mechanism can be expressed as:
Then, the overall REC after t years implementation of the REC guarantee mechanism can be expressed as:
ZSG-DEA Model for REC Allocation
Data envelopment analysis (DEA), proposed by Charnes et al. (1978), can estimate production frontier and measure productive efficiency of decision making units (DMUs) through the ratio of multiple inputs to outputs (Banker et al., 1984). Assume that we allocate the overall renewable electricity consumption to N provinces (Each province is a DMU) and each DMU has an input factor × (Renewable electricity consumption) and P output factors y. Using the classic input-oriented BCC model (Banker et al., 1984), we can evaluate the efficiency of each province, as shown in formula (12):
Where ho represents the efficiency of province o, λi denotes the weight of DMU of i.
Although the classical DEA model can measure DMUs' efficiency, it is unable to bring each DMU together into the DEA frontier. What's more, the classical DEA model holds the hypothesis that all DMUs can freely produce input and output variables without influencing each other, which does not remain true when it comes to REC allocation, as the overall REC is a constant value. The reduced REC of one province must be distributed to other provinces, which means there is a zero-sum game. To deal with the constant constraint of total input or output, Lins et al. (2003) proposed the ZSG-DEA model. The ZSG-DEA model for renewable electricity consumption allocation is formulated as follows:
Provinces with an efficiency score of one are efficient units, while other provinces with a score of <1 are inefficient units. In order to improve the efficiency of inefficient units and make them reach the DEA frontier together, it is necessary to reduce the REC of provinces with an efficiency score of <1. The reduction volume of province o is:
Where xo refers to the REC of province o, hRo is the efficiency value under the condition that the total amount of input is constant. Lins et al. (2003) proved that there is a linear correlation between ho and hRo, which can be expressed as:
W is a set of provinces with the DEA efficiency <1. denotes the DEA efficiency ratio between province i and province o.
To make sure the overall REC remains constant, the reduction volume do has to be divided proportionally to other provinces. As a result, the REC that province i will get from province o is:
As all provinces are adjusting REC simultaneously, the REC of province i will finally be adjusted to:
Some provinces can't reach the DEA frontier after first reallocation, which means we need to reallocate REC again. After several round of reallocation, the efficiency of all provinces will finally reach one. The input oriented ZSG-DEA model is formulated as follows:
Data and Parameter Settings
Parameters in the Overall REC Model
According to Formula (11), in order to calculate the overall REC, we need to know the following five parameters:
(1) ξ:the growth rate of non-fossil energy consumption proportion;
(2) m0: the proportion of renewable electricity consumption in non-fossil energy consumption;
(3) η:the growth rate of national energy consumption;
(4) β:the growth rate of national electricity consumption;
(5) γBAU: the growth rate of renewable electricity consumption proportion under the BAU scenario;
(6) δ: the contribution rate of the REC guarantee mechanism to 2020 non-fossil energy target.
First, according to three official documents published by the Chinese government (the “13th 5-Years Plan” for Renewable Energy Development, the “13th 5-Years Plan” for Energy Development, and the “Strengthening Action on Climate Change-China's Intended Nationally Determined Contributions”), the non-fossil energy target can be expressed as “Non-fossil energy accounts for 15 and 20% of primary energy consumption in 2020 and 2030 respectively”. We set the end of 2018 as the beginning of the planning period, and the end of 2020 as the end of the planning period. This is because the REC guarantee system designed the obligatory renewable electricity proportion of the provinces by 2020, and has not yet specified each province's OP in 2030. The end of 2020 is selected as the end of the planning period of the model in this paper, which can better compare our results with the design of the REC guarantee mechanism. In 2018, China's non-fossil energy proportion in primary energy consumption was 14.3%, which means, in order to achieve the 2020 target, non-fossil energy proportion has to reach an annual growth rate of 2.42% at least. According to the calculation formula of (1 + 2.42%)2-1, resulting in a total growth rate of 4.90% (ξ) in non-fossil energy proportion within the planning period of 2018 to 2020.
Second, China consumed 1815.90 TWh (Equivalent to 223.17 million tons of standard coal)3 renewable electricity in 2018, while non-fossil energy consumption was 663.52 million tons of standard coal (Mtce) (China Electric Power Planning and Engineering Institute, 2019). Thus, m0 is 33.63% at the early stage of the planning period.
In this article, we use the elastic coefficient method (Xue and Zhang, 2013) to predict the national energy consumption (Wu and Huang, 2016) and national electricity consumption (Yang and Wang, 2018) in 2020 under three scenarios, and then derive their corresponding growth rates. Under the planned GDP growth rate of the 13th 5-Years Plan, the growth rate of national energy consumption is 4.8% and that of national electricity consumption is 10.59%. The average GDP growth rate in 2015–2018 is 6.7%. Considering that the larger the national economic base, the more difficult it is to grow. During the planning period of 2018–2020, we set the GDP growth rate in the pessimistic scenario to 6.0%. The GDP growth rate under the optimistic scenario is 6.7%. Under the pessimistic scenario, the growth rate of national energy consumption is 4.16% and that of national electricity consumption is 5.06%. Under the optimistic scenario, the growth rate of national energy consumption is 9.10% and that of national electricity consumption is 11.19%. The parameters of η and β are shown in Table 1.
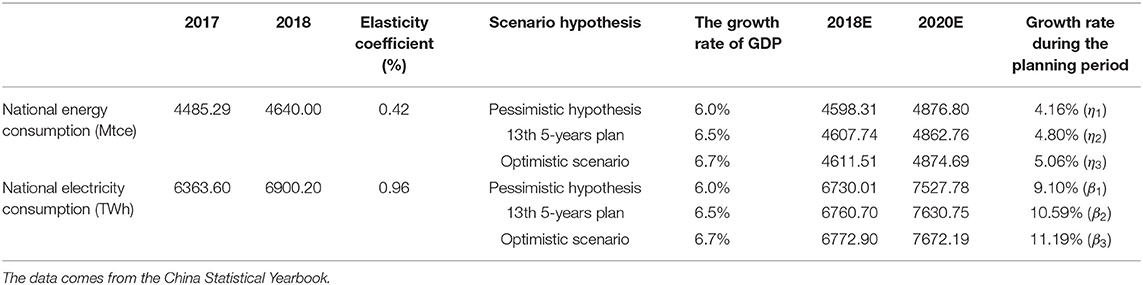
Table 1. The growth rate of national energy consumption and electricity consumption under three scenarios.
Since only 4 years of renewable electricity consumption proportion data are available (2015–2018) (NEA, 2016, 2017, 2018, 2019), a gray prediction model GM(1,1) (Deng, 1982; Hamzacebi and Es, 2014) suitable for small data volume is used to predict the 2020 renewable electricity consumption proportion. The calculation result is 27.71%. According to the National Renewable Energy Development Report, the proportion of renewable energy electricity consumption in 2018 is 26.50%, and the growth rate of renewable electricity consumption ratio in 2018–2020 under the BAU scenario is calculated as 4.57% (γBAU).
At last, we set three contribution rates δ based on what may happen in the future. First of all, it is assumed that no new policies to promote the consumption of non-fossil energy will be introduced in the future, and the old policies will not promote the consumption of non-fossil energy further more. The growth of non-fossil energy consumption is entirely stimulated by the REC guarantee mechanism, which means the contribution rate of the REC guarantee mechanism to the realization of the non-fossil energy goal is 100% in the planning period; Second, assuming that no new policies to promote the consumption of non-fossil energy will come out in the future, and because of the lag in the role of policies, the old policies continue to promote the increase of the non-fossil energy proportion, but the REC guarantee mechanism still plays a major role due to its strong binding force. We assume that contribution rate of the REC guarantee mechanism to the achievement of the non-fossil energy target is 90% under the second situation; Finally, assuming that the old policies still play a role and new policies will come out in the future, however, it is clear that there will be no policies that are more restrictive than the REC guarantee mechanism. We assume that the REC guarantee mechanism plays a major role and contributes 80% to the achievement of non-fossil energy goal under the third situation.
As analyzed above, here we set the parameters as Table 2.
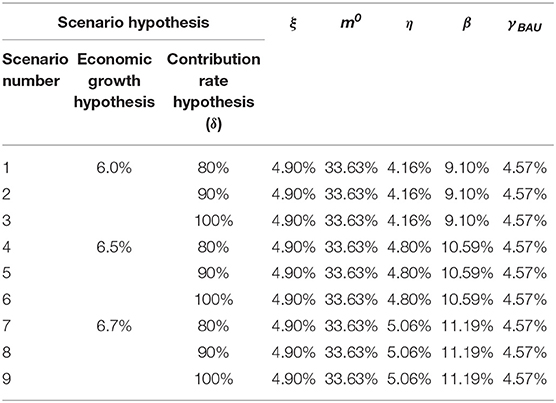
Table 2. Parameters setting of the overall REC model.
Indicators and Data of the ZSG-DEA Model
Input Variable of the ZSG-DEA Model
In order to better compare the results of this article with the design of the REC guarantee mechanism, we use the ratio (φ) of the achievable consumption of each province under the REC guarantee mechanism requirements divided by the sum of provinces' achievable consumption as the basis for the initial allocation. We can get the province i's achievable consumption () through multiplying the OP of province i required by the REC guarantee mechanism and the predicted electricity consumption of province i in 2020. The initial allocation coefficient is . Considering that the development of nuclear energy and biomass energy has a certain contribution to the non-fossil energy target, here we demonstrate the allocation under the scenario of economic growth of 6.5% and contribution rate of 90% without loss of generality. The initial allocation of province i is , which is the input variable of the ZSG-DEA model.
Output Variables of the ZSG-DEA Model
In this paper, we consider the principle of equity, efficiency and feasibility when we determine allocation indicators. Historical renewable electricity consumption, total electricity consumption, and energy consumption gap are selected as output variables for REC allocation. They are expected to reflect the principle of feasibility, equity and efficiency respectively. An analysis of the reasons for choosing output variables is as follows:
When decomposing the overall REC, comprehensive consideration should be given to the renewable energy resource endowment status, renewable energy development potential, economic development status, and grid development status of each province (Liu et al., 2009; Wu and He, 2014). The historical renewable electricity consumption in the province can reflect the renewable power resource endowment and grid development in the region to a certain extent (Lv et al., 2019). Based on data availability, we choose average historical renewable electricity consumption of each province as the embodiment of the regional renewable power resources endowment status. Historical renewable electricity consumption data comes from annual “National Renewable Energy Development Monitoring Evaluation Reports.”
From the perspective of equity, the higher the total electricity consumption is in a province, the more renewable electricity should be consumed. And the total electricity consumption is linked to GDP to a certain extent, it can also reflect the economic development of the region (Yang and Wang, 2018). Therefore, we chose the total electricity consumption as an indicator of economic development. The total electricity consumption in 2020 is predicted by the electricity elasticity coefficient method (Xue and Zhang, 2013) and the data comes from each province's statistical yearbooks.
In addition, we also select energy consumption gap as an indicator. The energy consumption gap is the difference between the energy constraint that required by the “13th 5-Years Plan” and the predicted energy consumption in 2020. The smaller the province's energy consumption gap is, the more difficulty the province has in achieving the energy control target. The reason for choosing energy consumption gap is that currently more than 10 provinces across the country have proposed that the energy consumption target of the “13th 5-Years Plan” cannot be achieved4. According to China's “13th 5-Years Plan for Energy Conservation and Emission Reduction,” renewable energy is not included in the scope of energy consumption control5. Provinces that are not expected to meet their energy control goals can meet the energy needs of economic development by using more renewable energy. We hold the view that allocating more REC quota to areas with less energy consumption gap can loosen energy constraints on the economic development of provinces, which means each unit of renewable electricity produces more economic output. Based on the total energy consumption of each province from 2010 to 2017 (data from each province's statistical yearbooks), we use the GM(1,1) model (Deng, 1982; Hamzacebi and Es, 2014) to predict the total energy consumption of each province in 2020, and compare the predicted value with the energy consumption constraints of the “13th 5-Years Plan,” the differences are energy consumption gap for provinces (Table 3). The DEA model requires inputs and outputs indicators to be positive, but there are negative values in some provinces' energy consumption gap. Based on the consideration that allocating more REC quota to areas with less energy consumption gap, we use the maximum value of the energy consumption gap minus the value of each province's energy consumption gap.
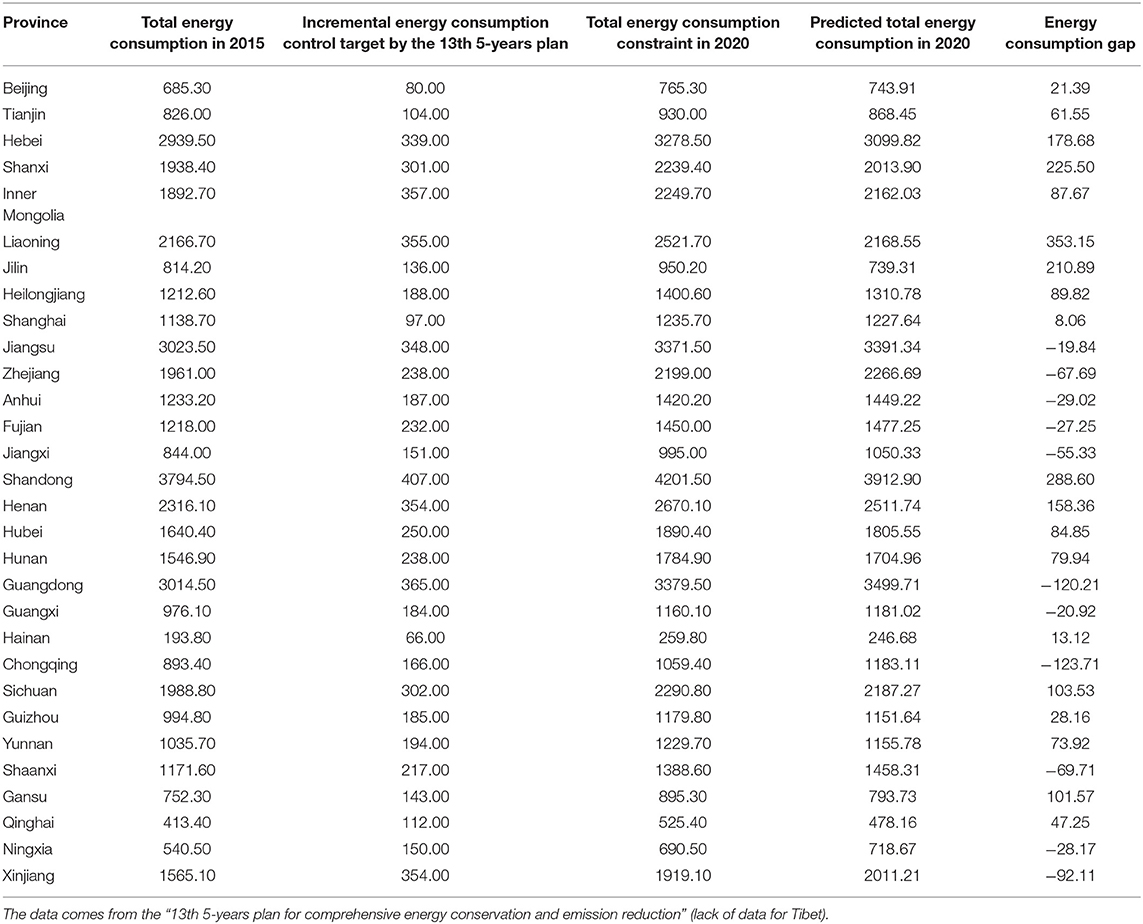
Table 3. Each province's energy consumption constraints and energy consumption gap (Mtce).
Table 4 displays the input and output variables for each province.
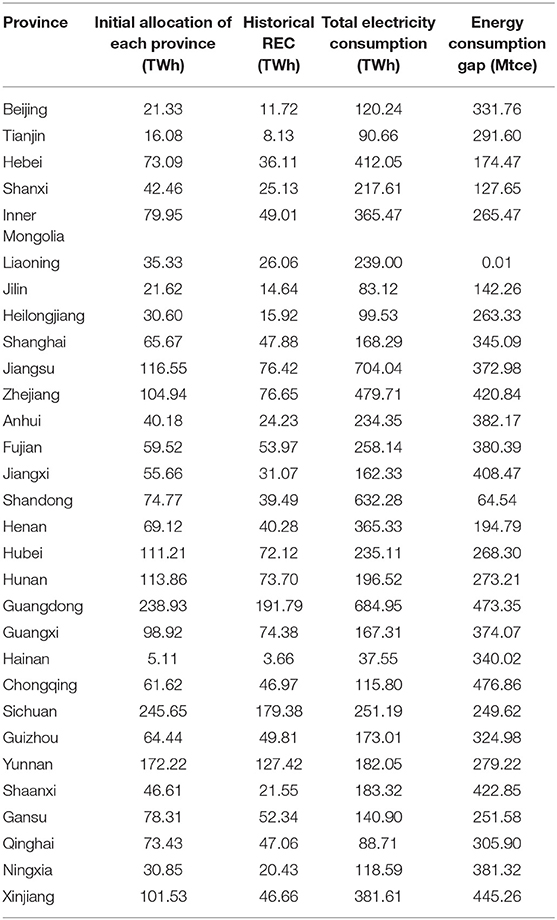
Table 4. Input and output indicators for each province in 2020.
Results
The Overall REC
According to the “National Renewable Energy Power Development Monitoring and Evaluation Report 2018,” the total amount of renewable electricity consumption in China (excluding Tibet) in 2018 () was 1815.90 TWh. The achievable overall REC under the constraint of REC guarantee mechanism is (1986.97 TWh). Using and parameters in Table 2, we can calculate overall RECs () that can achieve the non-fossil energy target under nine scenarios base on Formula (11). We can know whether the current REC mechanism can achieve the non-fossil energy target by simply comparing and .
China needs to consume 2292.16 TWh to 2389.34 TWh renewable electricity to accomplish the 2020 non-fossil energy target (Figure 6). The expected REC under the constraint of the REC guarantee mechanism still needs to increase by 15.36–20.25% to achieve the non-fossil energy target.
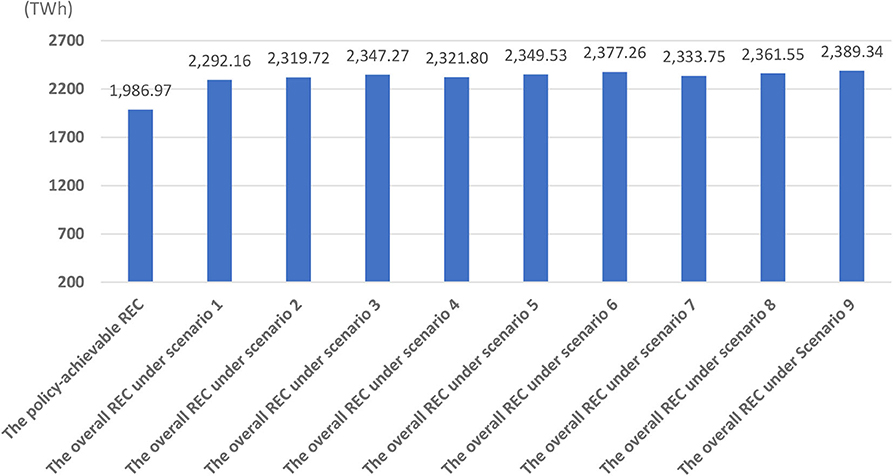
Figure 6. Comparison of and .
The Allocation of Overall REC
Figure 7 shows the evolution of the DEA efficiency value of the initial allocation and reallocation. It needs to be clear that in the allocation of REC, provinces with high efficiency values tend to have insufficient obligatory REC and need to increase their REC quota. Among the 30 provinces, Fujian, Shandong, and Hainan reach the DEA boundary in the beginning with their initial efficiency values equal to one. There are 14 provinces, whose initial DEA efficiency are higher than the average initial efficiency (0.794). Xinjiang 's DEA initial efficiency is the lowest, at 0.590. After the first reallocation, the average DEA efficiency increase to 0.960. The most effective provinces are still Fujian, Shandong, and Hainan. The DEA efficiency value in Xinjiang increase to 0.913 and the lowest value (Shaanxi) is 0.905. After the third reallocation, the overall DEA efficiency value reach one, and six provinces (Shanxi, Inner Mongolia, Heilongjiang, Guizhou, Shaanxi, and Gansu) are weakly effective with an efficiency value of 0.999, while other 24 provinces reach the DEA frontier. After the fifth reallocation, all provinces achieve the maximum DEA efficiency of one.
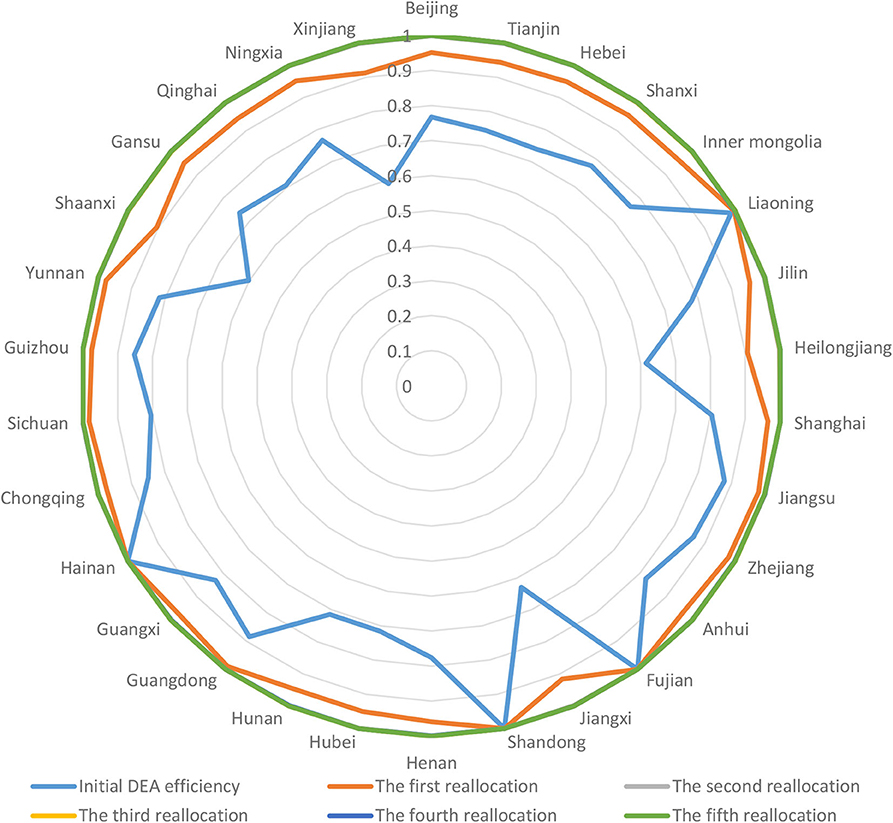
Figure 7. The evolution of the DEA efficiency value.
Figure 8 compares the REC adjusted by the ZSG-DEA model of each province () with the REC calculated based on the OP required by the REC guarantee mechanism ().
Figure 8. Geographical distribution of provincial REC through reallocation. All the provinces are marked on the basis of the increase rate from to . Tibet, Taiwan, Hong Kong, and Macau are not displayed due to the lack of data.
It can be seen that in order to achieve the non-fossil energy target more efficiently, 26 provinces need to increase the consumption of renewable electricity, and four provinces can appropriately reduce the REC quota. Guangdong Province's REC increase the most, which is 63.09 TWh, and it also has the biggest amount of the REC after reallocation, at 265.15 TWh. Xinjiang province experiences the biggest reduction of 10.77 TWh. With the lowest reallocated REC (6.41 TWh), Hainan province has the highest increase rate of 48.33%. The five provinces with the highest increase rate are Hainan (48.33%), Fujian (48.33%), Shandong (48.33%), Liaoning (46.13%), and Guangdong (31.22%). The provinces that are reduced allocation are Xinjiang (−12.55%), Shaanxi (−10.84%), Heilongjiang (−8.92%), and Jiangxi (−6.70%).
By looking deeper at the direction of electricity flow (Figure 9), one may notice that most provinces and autonomous regions that increase the REC significantly are in developed coastal areas and belong to the receiving end of power transmission. In contrast, most of the provinces and regions whose consumption is reduced or increased slightly belong to the supply end of power transmission. This adjustment reflects the principle of equity, also known as “who uses electricity, who bears responsibility.” Slight changes occur mostly in northern China, and the change rate of REC quotas in the central region is smaller than that of the national level (18.24%). Although Hubei, Hunan, and Jiangxi are power receiving areas, their OP settings in the REC guarantee mechanism are inherently high, so the rate of increase is relatively low.
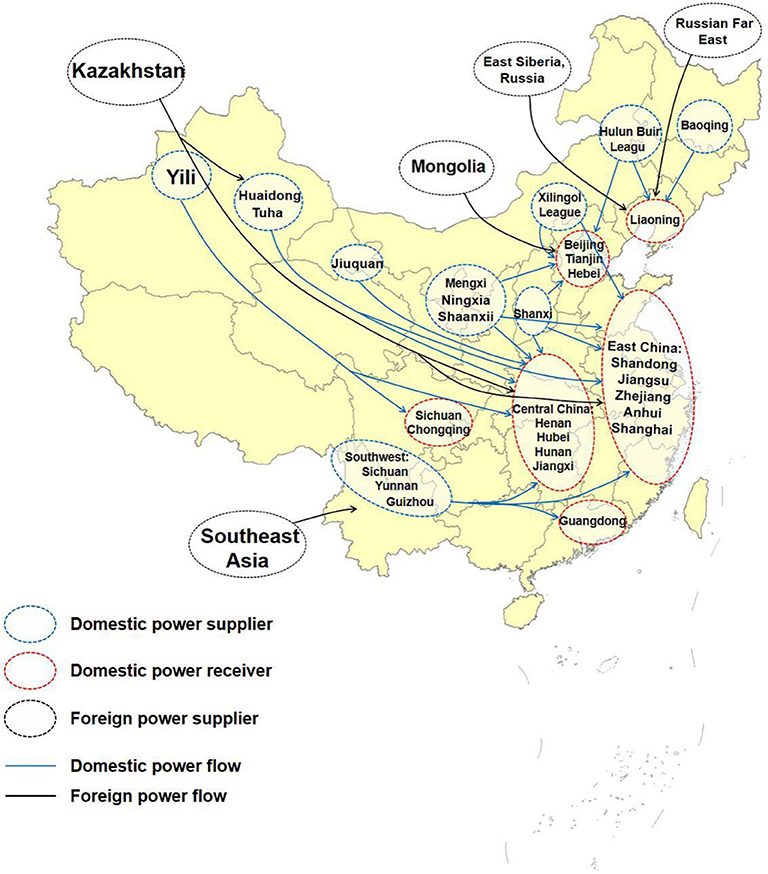
Figure 9. National power transmission.
Table 5 shows the comparison between the OP in the REC guarantee mechanism and the adjusted proportion values. It can be seen that, in order to meet the non-fossil energy target, under the principles of equity, efficiency, and achievability, 26 provinces need to increase the proportion of REC by an average of 5.46%. Ten provinces' increase rates are higher than the average increase rate. Sichuan needs to increase the proportion value the most (18.68%)6, while Xinjiang has the highest proportion to reduce (−6.32%)7. Although Guangdong needs to increase the biggest amount of the REC, the increase in the proportion value is just 9.21% as it has the second highest total electricity consumption.
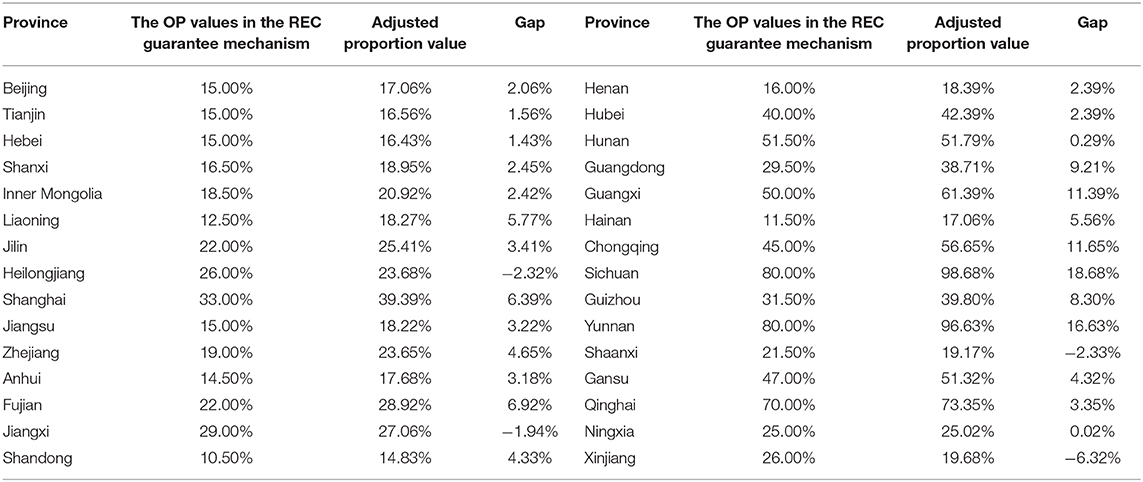
Table 5. The OP values in the REC guarantee mechanism and adjusted proportion values of each province.
Conclusions and Discussion
This article takes the non-fossil energy targets of 2020 and 2030 in China's INDCs as the starting point to discusses the issue of the REC allocation. We formed an analysis framework for renewable electricity consumption allocation, which can provide some references for policy makers. In this framework, the “contribution rate” reflects the quantitative relationship between the renewable electricity consumption and the non-fossil energy target. The higher contribution rate is, the more effective the allocation is. We calculated the overall REC which can realize the non-fossil energy target under nine scenarios. China needs to consume 2292.16–2389.34 TWh renewable electricity to accomplish the 2020 non-fossil energy target, while the REC guarantee mechanism can only reach 1986.97 TWh. In other words, current policy needs to increase the REC by 15.35–20.25% to achieve the non-fossil energy target. Allocation of the overall REC is another important problem. We adjusted the original allocation requested by current policy under the principles of equity, efficiency, and feasibility using a ZSG-DEA model to make sure all provinces reached the DEA frontier. Our empirical results show that to realize the non-fossil energy target under the scenario of economic growth of 6.5% and contribution rate of 90%, 26 provinces need to increase renewable electricity consumption. The general trend of adjusting is that coastal, developed provinces located in receiving end of power transmission should take more responsibility for renewable electricity consumption while policy makers could reduce the obligatory REC quota of some central provinces and provinces at supplying end of power transmission relatively.
The results of this paper not only assist policy makers to scientifically determine the total amount of REC and adjust the REC allocation plans among provinces, but also provide certain insights for future power grid pattern planning. To meet the needs of renewable energy consumption and large-scale transmission of power across regions, it is urgent to scientifically plan the layout of the power grid, strengthen the construction of inter-regional and inter-provincial interconnected power grids. With adjustments of each province's obligatory REC in this paper, the key construction areas of the interconnected power grid can be determined.
To achieve the non-fossil energy targets, we hold the view that the primary problem that needs to be handled with is the consumption of renewable electricity. China has not yet established an national electricity market and there are serious inter-provincial barriers. Based on the interests of GDP and local employment, the province government prefers to use local thermal power rather than accept renewable electricity from other provinces. However, in the wet season, some regions' abundant renewable energy cannot be fully absorbed by the local market alone. There are still many surpluses that can and need to be consumed in a larger market. Many provinces with large scale installed capacity of renewable energy can consume a large proportion of renewable energy for a long time, indicating that technically renewable electricity can meet the daily electricity demand. For example, more than 80% of Yunnan's electricity comes from hydropower (NEA, 2016), Qinghai provinces whose area equivalents to two Japan has been able to use only renewable energy to supply electricity for 15 consecutive days (Xia, 2019). Therefore, if China can accelerate the construction and improvement of the unified national electricity market where provinces can freely allocate electricity, and with the development, and improvement of smart grids, and energy storage technologies, then consumption market of renewable electricity will be expanded. In conclusion, we reckon that China will eventually be able to achieve its non-fossil energy targets of 2020 and 2030.
We have to admit that there are certain limitations of this paper: (1) The assumption of constant growth rate we made while setting parameters for the model and predicting output variables is relatively strong. However, since this article discusses the short-term REC allocation planning, the growth rates of parameters and variables are more certain in the near future, so constant growth rate has little effect on the model's results. (2) The DEA method or ZSG-DEA model itself has some shortcomings. The DEA method emphasizes that the decision-making units are comparable, but the situation in different regions is often different, and this method may overemphasize the technical efficiency and ignore other principles. There are papers are discussing the question of DMU heterogeneity (Belotti and Ilardi, 2018), and we are also working toward this question, but we do not discuss it in this article. (3) This method is only suitable for short-term studies with relatively definite future conditions, not for long-term dynamic growth scenarios.
Data Availability Statement
The datasets generated for this study are available on request to the corresponding author.
Author Contributions
JZ was responsible for the specific work of this paper optimized the structure and tone of this article. RG developed the model, carried out some of the calculation work, and wrote the manuscript. NX and CX contributed to the manuscript.
Funding
The research belongs to the National Governance of Climate Change Risks and Domestic Response to Key Issues Research project. The project number is 2018YFC1509005. It was funded by the National Climate Center with a fund of 2.08 million yuan.
Disclaimer
Frontiers Media SA remains neutral with regard to jurisdictional claims in published maps and institutional affiliations.
Conflict of Interest
The authors declare that the research was conducted in the absence of any commercial or financial relationships that could be construed as a potential conflict of interest.
Acknowledgments
The authors acknowledge the financial support of project on global governance of climate change risks and China's response to key issues (2018YFC1509005). The authors would also like to acknowledge great thanks to reviewers for their valuable comments which largely improve the academic quality of this article.
Footnotes
1. ^China Daily, “The ‘new normal’ means the Chinese economy has entered a new phase that is different from the high-speed growth pattern exhibited in the past. It is a new trend that features more sustainable, mid- to high-speed growth with higher efficiency and lower costs.” http://www.chinadaily.com.cn/opinion/2014-10/10/content_18716671.htm.
2. ^https://www.ndrc.gov.cn/xxgk/zcfb/tz/201905/t20190515_962446.html
3. ^According to the Energy Conversion Standard Coal Reference Coefficient Table of the China Energy Statistics Yearbook, the conversion standard power coefficient of electricity is 0.1229 kg standard coal / kWh.
4. ^http://www.qstheory.cn/dukan/qs/2019-12/15/c_1125346157.htm
5. ^http://www.gov.cn/zhengce/content/2017-01/05/content_5156789.htm
6. ^The predicted total electricity consumption in Yunnan province is relatively small in 2020. Based on equation Proportion= REC/total electricity consumption, the adjustment of consumption results in relatively big changes in proportion value.
7. ^Part of the reason why Xinjiang province has big reduction in consumption is that its historical elastic coefficient is 2.07, resulting in higher volume of total electricity consumption and original allocation (93.35 TWh). Xinjiang's renewable electricity consumption in 2018 is just 5.73 TWh. The proportion value of Xinjiang is reduced by 30.41%, however, the consumption volume is increased by 20.4% to 6.90 TWh compared to 2018, which is rather more reasonable. According to historical data, the electricity consumption elasticity value in Xinjiang has been gradually reducing, with the last 3-years average of 1.34, so we believe the actual total electricity consumption of Xinjiang in 2020 could be much lower than predicted.
References
Anguelov, N., and Dooley, W. F. (2019). Renewable portfolio standards and policy stringency: an assessment of implementation and outcomes. Rev. Policy Res. 36, 195–216. doi: 10.1111/ropr.12322
Banker, R. D., Charnes, A., and Cooper, W. W. (1984). Some models for estimating technical and scale inefficiencies in data envelopment analysis. Manag. Sci. 30, 1078–92. doi: 10.1287/mnsc.30.9.1078
Belotti, F., and Ilardi, G. (2018). Consistent inference in fixed-effects stochastic frontier models. J. Econometr. 202:5. doi: 10.1016/j.jeconom.2017.09.005
Chang, Y., and Li, Y. (2015). Renewable energy and policy options in an integrated ASEAN electricity market: quantitative assessments and policy implications. Energy Policy 85, 39–49. doi: 10.1016/j.enpol.2015.05.011
Charnes, A., Cooper, W. W., and Rhodes, E. (1978). Measuring the efficiency of decision making units. Eur. J. Operat. Res. 2, 429–44. doi: 10.1016/0377-2217(78)90138-8
Chastas, P., Theodosiou, T., Kontoleon, K. J., and Bikas, D. (2018). Normalising and assessing carbon emissions in the building sector: a review on the embodied CO2O emissions of residential buildings. Build. Environ. 130, 212–26. doi: 10.1016/j.buildenv.2017.12.032
Chen, W., and He, Q. (2016). Intersectoral burden sharing of CO 2 mitigation in China in 2020. Mitigat. Adapt. Strategies Glob. Change 21, 1–14. doi: 10.1007/s1027-014-9566-3
Cheng, L., Bai, J., and Jia, D. (2011). Influence of nuclear power on the 15% non-fossil energy target for 2020 and power system. Energy Technol. Econ. 23, 10–3. doi: 10.3969/j.issn.1674-8441.2011.07.003
Cheng, L., Jiang, L., Bai, J., Jia, D., and Xin, S. (2010). Research on developing route to achieve the 15% non-fossil energy target by 2020 in China. China Energy 32:11-14+26.
China Electric Power Planning and Engineering Institute (2013). China Energy Development Report 2012. Beijing: China Electric Power Press.
China Electric Power Planning and Engineering Institute (2014). China Energy Development Report 2013. Beijing: China Electric Power Press.
China Electric Power Planning and Engineering Institute (2015). China Energy Development Report 2014. Beijing: China Electric Power Press.
China Electric Power Planning and Engineering Institute (2016). China Energy Development Report 2015. Beijing: China Electric Power Press.
China Electric Power Planning and Engineering Institute (2017). China Energy Development Report 2016. Beijing: China Electric Power Press.
China Electric Power Planning and Engineering Institute (2018). China Energy Development Report 2017. Beijing: China Electric Power Press.
China Electric Power Planning and Engineering Institute (2019). China Energy Development Report 2018. Beijing: China Electric Power Press.
Deng, J. (1982). Control problems of grey systems. Syst. Control Lett. 1, 288–94. doi: 10.1016/S0S167-6911(82)80025-X
Fang, K., Zhang, Q., Long, Y., Yoshida, Y., Sun, L., Zhang, H., et al. (2019). How can China achieve its intended nationally determined contributions by 2030? A multi-criteria allocation of China's carbon emission allowance. Appl. Energy 241, 380–9. doi: 10.1016/j.apenergy.2019.03.055
Fang, K., Zhang, Q., Ye, R., and Zhou, Y. (2018). Allocating China's carbon emission allowance to the provincial quotas in the context of the Paris Agreement. Acta Scientiae Circumstantiae 38, 1224–34. doi: 10.13671/j.hjkxxb.2017.0402
Gomes, E. G., and Lins, M. P. (2008). Modelling undesirable outputs with zero sum gains data envelopment analysis models. J. Operat. Res. Society 59, 616–23. doi: 10.1057/palgrave.jors.2602384
Hamzacebi, C., and Es, H. A. (2014). Forecasting the annual electricity consumption of Turkey using an optimized grey model. Energy 70, 165–71. doi: 10.1016/j.energy.2014.03.105
Heeter, J., Speer, B., and Glick, M. B. (2019). International Best Practices for Renewable Portfolio Standard (RPS) Policies. Golden, CO: National Renewable Energy Laboratory. Available online at: https://www.nrel.gov/docs/fy19osti72798.pdf
Huang, B., Li, Q., Xie, G., and Wang, Q. (2013). Renewable portfolio standard in Italy and its enlightenment for China. Wind Energy 54–9. doi: 10.3969/j.issn.1674-9219.2013.11.039
Jin, R. (2019). Electricity market is the main direction of future renewable energy consumption. China Power Enterprise Manag. 18–22.
Kwon, T. (2015). Is the renewable portfolio standard an effective energy policy? Early evidence from South Korea. Utilities Policy 36, 46–51. doi: 10.1016/j.jup.2015.09.002
Li, J., and Chen, G. (2008). International experience and China's renewable portfolio standard design. Pacific J. 44–51. doi: 10.14015/j.cnki.10044-8049.2008.10.013
Li, Q. (2019). Consumption and guarantee mechanism promotes high-quality development of renewable energy in China. China Power Enterprise Manag. 23–25.
Lin, T., and Ning, J. (2011). Study on allocation efficiency of carbon emission permit in EUETS based on ZSG—DEA model. J. Quantitat. Tech. Econ. 28, 36–50. doi: 10.13653/j.cnki.jqte.2011.03.002
Linnerud, K., and Simonsen, M. (2017). Swedish-Norwegian tradable green certificates: Scheme design flaws and perceived investment barriers. Energy Policy 106, 560–78. doi: 10.1016/j.enpol.2017.04.012
Lins, M. P. E., Gomes, E. G., Mello João Carlos, C. B., Soares de, M., and Adelino José, R. (2003). Soares de. Olympic ranking based on a zero sum gains DEA model. Eur. J. Operat. Res. 148, 312–22. doi: 10.1016/S0S377-2217(02)006877-2
Liu, J. (2019). China's renewable energy law and policy: a critical review. Renew. Sustain. Energy Rev. 99, 212–9. doi: 10.1016/j.rser.2018.10.007
Liu, Z., Zhang, X., Gao, H., Tang, C., Qi, T., and Zhang, D. (2011). A target disintegration model based on renewable energy potential and energy consumption. Renew. Energy Resourc. 29, 78–83. doi: 10.13941/j.cnki.21-1469/tk.2011.03.017
Liu, Z., Zhang, X., and Zhang, D. (2009). The target decomposition of renewable energy in Europe Union and its inspiration to China′s provincial planning. China Mining Magazine 18, 66–70. doi: 10.3969/j.issn.1004-4051.2009.09.017
Lv, J., Sun, W., Han, D., Zuo, Y., Yang, J., and Liu, P. (2019). Medium and long term electricity forecasting based on GDP-electricity consumption coupling relationship. Power Syst. Clean Energy 35, 1–7. doi: 10.3969/j.issn.1674-3814.2019.01.001
Miao, Z., Geng, Y., and Sheng, J. (2016). Efficient allocation of CO2 emissions in China: a zero sum gains data envelopment model. J. Clean. Prod. 112, 4144–50. doi: 10.1016/j.jclepro.2015.07.035
Miketa, A., and Schrattenholzer, L. (2006). Equity implications of two burden-sharing rules for stabilizing greenhouse-gas concentrations. Energy Policy 34, 877–91. doi: 10.1016/j.enpol.2004.08.050
Mo, J., Duan, H., Fan, Y., and Wang, S. (2018). China's energy and climate targets in the paris agreement: integrated assessment and policy options. Econ. Res. J. 53, 168–81.
Mu, H., Li, L., Li, N., Xue, Z., and Li, L. (2016). Allocation of carbon emission permits among industrial sectors in Liaoning province. Energy Procedia 104, 449–55. doi: 10.1016/j.egypro.2016.12.076
National Development and Reform Commission (2017). 13th five-year plan for renewable energy development (part 1). Solar Energy 5–11. doi: 10.3969/j.issn.1003-0417.2017.02.001
NEA (2016). [In Chinese] Report on the Monitoring and Evaluation of National Renewable Energy and Electricity Development in 2015[EB/OL]. Available online at: http://zfxxgk.nea.gov.cn/auto87/201608/t20160823_2289.htm
NEA (2017). [In Chinese] Report on the Monitoring and Evaluation of National Renewable Energy and Electricity Development in 2016[EB/OL]. Available online at: http://zfxxgk.nea.gov.cn/auto87/201704/t20170418_2773.htm
NEA (2018). [In Chinese] Report on the Monitoring and Evaluation of National Renewable Energy and Electricity Development in 2017[EB/OL]. Available online at: http://zfxxgk.nea.gov.cn/auto87/201805/t20180522_3179.htm
NEA (2019). [In Chinese] Report on the Monitoring and Evaluation of National Renewable Energy and Electricity Development in 2018[EB/OL]. Available online at: http://zfxxgk.nea.gov.cn/auto87/201906/t20190610_3673.htm
Ouyang, C. (2010). Planning ahead: achieving “15% non-fossil energy” by 2020. China Power Enterprise Manag. 16–18. doi: 10.3969/j.issn.1007-3361.2010.10.004
Pan, J., and Zheng, Y. (2009). Responsibility and individual equity for carbon emissions rights. World Econ. Politics 6–16.
Pan, W., Wu, T., and Wang, F. (2015). Study on the efficiency of carbon emission allocation in Chinese industries. Statist. Dec. 142−4. doi: 10.13546/j.cnki.tjyjc.2015.18.039
Pan, X., Teng, F., and Wang, G. (2014). Sharing emission space at an equitable basis: Allocation scheme based on the equal cumulative emission per capita principle. Appl. Energy 113, 1810–8. doi: 10.1016/j.apenergy.2013.07.021
Qi, Y., Lu, J., and Zhu, M. (2018). Wind Curtailment in China and Lessons from the United States. Beijing. Available online at: https://www.brookings.edu/wp-content/uploads/2018/03/wind-curtailment-in-china-and-lessons-from-the-united-states1.pdf
Qian, M., Lu, Z., and Wang, J. (2015). Analysis of carbon emissions allocation in industrial sectors based on ZSG-DEA model. J. Indus. Technol. Econ. 97–104. doi: 10.3969/j.issn.10044-910X00XX.2015.11.012
Raupach, M. R., Davis, S. J., Peters, G. P., Andrew, R. M., Canadell, J. G., Ciais, P., et al. (2014). Sharing a quota on cumulative carbon emissions. Nat. Climate Change 4:873. doi: 10.1038/nclimate2e384
Ringel, M. (2006). Fostering the use of renewable energies in the European Union: the race between feed-in tariffs and green certificates. Renew. Energy 31, 1–17. doi: 10.1016/j.renene.2005.03.015
Shan, B., Xu, M., Zhu, F., and Zhang, C. (2012). China's energy demand scenario analysis in 2030. Energy Procedia 14, 1292–8. doi: 10.1016/j.egypro.2011.12.1091
Siddiqui, A., Tanaka, M., and Chen, Y. (2016). Are targets for renewable portfolio standards too low? The impact of market structure on energy policy. Eur. J. Operat. Res. 250, 328–41. doi: 10.1016/j.ejor.2015.10.063
Sun, Z. R., Zhou, D. Q., Zhou, P., and Miao, Z. (2012). Quota allocation of China's energy conservation based on environmental ZSG-DEA. Syst. Eng. 30, 84–90.
Vaillancourt, K., and Waaub, J-P. (2004). Equity in international greenhouse gases abatement scenarios: a multicriteria approach. Eur. J. Operat. Res. 153, 489–505. doi: 10.1016/S0S377-2217(03)00170-X
Wang, H., Liu, H., He, X., and Zeng, W. (2016). Allocation of carbon emissions right based on the intergenerational equity. China Environ. Sci. 36, 1895–1904. doi: 10.3969/j.issn.1000-6923.2016.06.044
Wang, J., Cai, B., Cao, D., Zhou, Y., and Liu, L. C. (2011). Scenario study on regional allocation of CO2 emissions allowance in China. Acta Scientiae Circumstantiae 31, 680–5. doi: 10.13671/j.hjkxxb.011.04.012
Wang, L., Chen, W., Zhang, H., and Ma, D. (2017). Dynamic equity carbon permit allocation scheme to limit global warming to two degrees. Mitigat. Adapt. Strategies Glob. Change 22, 609–28. doi: 10.1007/s11027-015-9690-8
Wang, S. (2017). Analysis of the status and problems of non-fossil energy power generation in China. Environ. Protect. 45, 52–4. doi: 10.14026/j.cnki.02533-9705.2017.21.010
Wang, X. (2019). Consumption guarantee mechanism escorts renewable energy consumption. Energy 30–33.
Wang, Y., Jia, W., and Bi, Y. (2017). Provincial decomposition of China's 2030 carbon dioxide emission peak target from the perspective of efficiency: Research on the zero sum gains DEA model. Acta Scientiae Circumstantiae 37, 4399–408. doi: 10.13671/j.hjkxxb.2017.0348
Wei, C., Ni, J., and Du, L. (2012). Regional allocation of carbon dioxide abatement in China. China Econ. Rev. 23, 552–65. doi: 10.1016/j.chieco.2011.06.002
Wiser, R., Mai, T., Millstein, D., Barbose, G., Bird, L., Heeter, J., et al. (2017). Assessing the costs and benefits of US renewable portfolio standards. Environ. Res. Lett. 12:94023. doi: 10.1088/17488-9326/aa8a7bd
Wu, H., Cheng, Y., Zhang, N., Zhou, B., Lu, S., and Kang, C. (2016). A study on power carbon emission quota allocation in interprovincial carbon trading mechanism. Power System Technol. 40, 3440–3445. doi: 10.13335/j.1000-3673.pst.2016.11.024
Wu, J., Zhu, Q., and Liang, L. (2016). CO2 emissions and energy intensity reduction allocation over provincial industrial sectors in China. Appl. Energy 166, 282–91. doi: 10.1016/j.apenergy.2016.01.008
Wu, Q., and Huang, W. (2016). Study on the dynamic relationships between energy consumption and economic growth. Energy China 38, 30–32. doi: 10.3969/j.issn.10033-2355.2016.07.005
Wu, R., and He, Y. (2014). Optimal allocation model of renewable energy quota. Electric Power Construct. 35, 147–52. doi: 10.3969/j.issn.1000-7229.2014.06.028
Xiong, S., Tian, Y., Ji, J., and Ma, X. (2017). Allocation of energy consumption among provinces in China: a weighted ZSG-DEA model. Sustainability 9:2115. doi: 10.3390/su9u112115
Xu, W., Tang, Q., Wang, Y., and Dai, S. (2015). Power planning implementation deviation influence on non-fossil energy development goal. Electric Power Construct. 36, 61–5. doi: 10.3969/j.issn.10000-7229.2015.08.010
Xue, J., and Zhang, L. (2013). Comparison of elastic coefficient method and regression analysis method prediction. Shanxi Architecture 39, 199–201. doi: 10.13719/j.cnki.cn1n4-1279/tu.2013.05.071
Yang, B., Liu, C., Su, Y., and Jing, X. (2017). The allocation of carbon intensity reduction target by 2020 among industrial sectors in China. Sustainability 9:148. doi: 10.3390/su9010148
Yang, S., and Wang, T. (2018). Analysis of electricity consumption elasticity coefficient of some countries in ASEAN. Tourism Manag. 1, 18–24. doi: 10.23977/tmte.2018.11004
Ye, B., Jiang, J., Li, C., Miao, L., and Tang, J. (2017). Quantification and driving force analysis of provincial-level carbon emissions in China. Appl. Energy 198, 223–38. doi: 10.1016/j.apenergy.2017.04.063
Yin, H., and Powers, N. (2010). Do state renewable portfolio standards promote in-state renewable generation? Energy Policy 38, 1140–9. doi: 10.1016/j.enpol.2009.10.067
Yu, X. (2013). Research on consumption prospects of non-fossil energy in China. Consumer Econ. 29, 94–97.
Zhao, P. (2019). Research on Power Transmission Direction and Scale of Interconnected Grid Considering Uncertainty. Master. Beijing: North China Electric Power University.
Zhao, Q., Yan, Q., Cui, H., and Zhao, H. (2017). Scenario simulation of the industrial sector carbon dioxide emission reduction effect. Polish J. Environ. Stud. 26:e74403. doi: 10.15244/pjoes/74403
Zhao, R., Min, N., Geng, Y., and He, Y. (2017). Allocation of carbon emissions among industries/sectors: an emissions intensity reduction constrained approach. J. Clean. Prod. 142, 3083–94. doi: 10.1016/j.jclepro.2016.10.159
Zhao, X., Feng, T., Cui, L., and Feng, X. (2014). The barriers and institutional arrangements of the implementation of renewable portfolio standard: a perspective of China. Renew. Sustain. Energy Rev. 30, 371–80. doi: 10.1016/j.rser.2013.10.029
Keywords: Intended Nationally Determined Contributions (INDCs), Zero sum gains-data envelopment analysis (ZSG-DEA), renewable electricity consumption, allocation, top-down model
Citation: Zhang J, Gao R, Xu N and Xie C (2020) How Can China Achieve Its Non-fossil Energy Target? An Effective Allocation of China's Renewable Electricity Consumption Obligation. Front. Energy Res. 8:103. doi: 10.3389/fenrg.2020.00103
Received: 19 January 2020; Accepted: 08 May 2020;
Published: 09 June 2020.
Edited by:
Xunpeng Shi, University of Technology Sydney, AustraliaReviewed by:
Yi Dou, The University of Tokyo, JapanMarco Aiello, University of Stuttgart, Germany
Y. P. Sun, Hubei University of Economics, China
Laura Fiorini, University of Groningen, Netherlands, in Collaboration with Reviewer MA
Copyright © 2020 Zhang, Gao, Xu and Xie. This is an open-access article distributed under the terms of the Creative Commons Attribution License (CC BY). The use, distribution or reproduction in other forums is permitted, provided the original author(s) and the copyright owner(s) are credited and that the original publication in this journal is cited, in accordance with accepted academic practice. No use, distribution or reproduction is permitted which does not comply with these terms.
*Correspondence: Ninghan Xu, eHVuaW5naGFuQHdodS5lZHUuY24=