 Maite Louzao
 Isabel Afán
 María Santos
 Tom Brereton
- 1AZTI, Functioning of Marine Ecosystems, Pasaia, Spain
- 2Centro Oceanográfico de Xixón, Instituto Español de Oceanografía, Gijón, Spain
- 3Laboratorio de SIG y Teledetección, Estación Biológica de Doñana, Consejo Superior de Investigaciones Científicas, Seville, Spain
- 4Marinelife, Bridport, UK
Within the current context of changing ecosystems, many organisms are experiencing phenological changes in the timing of migration. Here, we assessed whether the abundance patterns of two trans-equatorial migrating pelagic seabirds, the great shearwater and the sooty shearwater (Puffinus gravis and Puffinus griseus, respectively), have changed over recent decades in the Bay of Biscay (BoB) in relation to the main drivers shaping their migratory journey: climatic factors and food availability. Specifically, we studied the staging dynamic by estimating dates of arrival and departure, staging duration and abundance during a 16-year temporal window (1995–2010) based on monthly at-sea observations performed onboard a commercial ferry. Climatic effects were studied at two temporal scales: oceanic winds and global oscillations indices (North Atlantic Oscillation–NAO) that represent climate variability at short and long time scales, respectively. Based on oceanic winds, we also estimated a hypothetical cost of flying on a monthly basis considering wind speed and the angle between flight and wind direction. Our results showed that both great and sooty shearwaters were influenced by the large scale NAO index but the shape of the relationship was different, while the sooty shearwater was also influenced by food availability. Thus, each species might rely on different cues before and during their migration to adjust to optimal flying conditions and foraging grounds. Both species shape their arrival in the BoB with periods of potential minimum flying costs, following their migration from the western to the eastern North Atlantic. We foresee that the quantification of flying costs can integrate different processes at the level of migration and provide a wider understanding of the migratory dynamic of pelagic predators within current changing ecosystems.
Introduction
Many organisms are experiencing phenological changes in their life cycles and the alteration of seasonal timing has been an evident change in recent decades (Thackeray et al., 2010). This is especially true for migrating birds as a result of present climate change that have promoted shifts in the timing of migration (Gordo, 2007). Within the marine seascape, the majority of system components are changing rapidly with an increased risk of fundamental and irreversible ecological transformation (Hoegh-Guldberg and Bruno, 2010). Decades of ecological research on marine ecosystems has shown that climatic variables are primary drivers of distribution and dynamic of pelagic organisms (Roessig et al., 2004). In this sense, global climatic indices have received much attention due to their ability to capture a large part of the inter-annual climatic variations over large areas and temporal scales (see review in Stenseth et al., 2002; Gordo, 2007). In particular, the North Atlantic Oscillation (NAO), is linked to large-scale patterns in winter conditions in north-western Europe, and has been found to be correlated with many aspects of the biology of a wide range of marine organisms (Frederiksen et al., 2004).
Oceanic winds are a major component of the seascape that has seldom been considered within the current context of changing ecosystems. Recent studies have evidenced a global increasing trend in wind speed, associated with long-term climatic oscillations (Young et al., 2011). These results have important consequences for highly migratory marine species that depend on wind for traveling and foraging, such as pelagic seabirds (Weimerskirch et al., 2000; Felicísimo et al., 2008). During the non-breeding season, highly migratory seabirds follow prevailing oceanic wind patterns to reduce flight costs on long-distance commutes (Shaffer et al., 2006; Felicísimo et al., 2008). Changes in wind patterns can cause shifts in foraging ranges and travel rates and may ultimately affect breeding performance (Weimerskirch et al., 2012). The trans-equatorial migrations of many species are also driven by highly seasonal food availability, enabling birds to exploit rich summer food supplies at both ends of their distributional range (Hedd et al., 2012; McKnight et al., 2013). Meanwhile, migrating birds move through different marine ecosystems and stop at a few key locations for increasing their refueling opportunities (McKnight et al., 2013), associated with major productivity hotspots such as coastal upwelling areas (Stenhouse et al., 2012; McKnight et al., 2013).
The Bay of Biscay (BoB) is an important migration flyway for Atlantic seabirds during the pre-breeding and post-breeding phases of their annual cycle (Brereton et al., 2003; Arcos et al., 2009). For numerous species, the BoB represents a key feeding area during certain periods of the year when seabirds, as well as other marine top predators, undertake seasonal feeding migrations into the area (Lezama-Ochoa et al., 2010; Stenhouse et al., 2012). There are two relevant shearwater species that perform trans-equatorial migrations that breed in the southern Atlantic Ocean: the great and sooty shearwaters Puffinus gravis and Puffinus griseus, respectively. After breeding, individuals of both species migrate to the productive waters of the western North Atlantic (Gulf of Maine, GoM) where they stay from June to August (Hedd et al., 2012). After this period, they continue the migratory journey toward the eastern North Atlantic following prevailing westerly wind patterns (Hedd et al., 2012). Thus, oceanic winds connect both sectors of the North Atlantic across middle latitudes (Hurrell and Deser, 2010), facilitating the flyway between the GoM and the BoB. Some individuals of both species might enter the BoB and stop there between August and October, before continuing their southward migration to reach their breeding grounds (Hobbs et al., 2003). The staging dynamic of southern shearwaters can vary from year to year, and the role of large- and short- scale climatic indices (e.g., NAO and oceanic winds, respectively) in driving these patterns have not yet been studied.
Here, we aimed to assess whether the abundance patterns of trans-equatorial migrating pelagic seabirds have changed over the past two decades in relation to the main drivers shaping their migratory journey: climatic factors and food availability. Based on long-term systematic at-sea surveys, we studied the annual staging dynamic of great and sooty shearwaters in the BoB by estimating dates of arrival and departure, staging duration and abundance patterns covering a 16-year temporal window (1995–2010). Climatic effects were studied at two different temporal scales: oceanic wind patterns and global oscillations indices (NAO) that represent climate variability at short and long time scales, respectively. In addition, the role of food availability was jointly analyzed by using a unique long-term series of anchovy biomass (AB) in this biogeographic area. Based on oceanic winds, we also estimated the cost of flying on a monthly basis following Louzao et al. (2014). We hypothesized that shearwaters might minimize the cost of flying by adjusting their arrival to the BoB during an optimal temporal window. Combining different long-term physical and biological datasets can provide a comprehensive picture of the effect of changing ecosystems on highly migratory predators.
Materials and Methods
Seabird Observations
Monthly at-sea observations were performed onboard a commercial ferry, the Pride of Bilbao, crossing the English Channel and BoB between July 1995 and August 2010 (Figure 1). Since surveys spatial coverage corresponded to the internal sector of the BoB, we referred to the term BoB to the geographic limits between 6.18° and 0.94° W and 43.33°-50.78° N corresponding to the longitudinal and latitudinal ranges of ferry surveys, respectively. On each trip, effort-based seabird observations were carried out by a team of three experienced volunteer observers, with two observers at a time. A two and a half day ferry trip was performed monthly between the harbors of Portsmouth and Bilbao. Recording was made from a fixed position on the bridge of the ship, at a height of 32 m and speed of 15–22 knots. For each seabird sighting species name and number seen were recorded. At 15–30 min intervals or whenever the ships course changed, a range of variables were measured including the ship's speed and course, and sea/weather variables such as sea state and visibility. Observations periods with sea state higher than Beaufort scale 5 were removed.
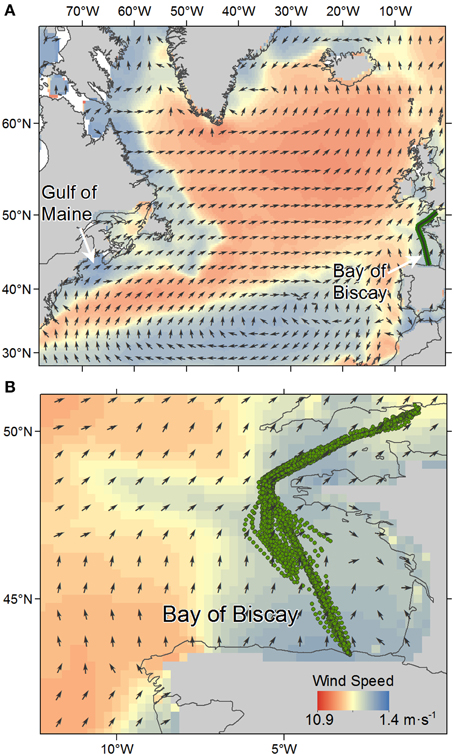
Figure 1. (A) Map of the North Atlantic showing overall mean wind speed for August (1995–2009). Wind speed is graded in color. Arrows show wind direction. The main prevailing wind speed and direction is shown illustrating the facilitated flyway between the Gulf of Maine and the Bay of Biscay (BoB). Green line marks ferry trackline for surveys. (B) Survey map showing the effort during the 16-years study period in the BoB.
Observations were performed over different recorded time periods with a median of 30 min (range: 1–270). In order to compare periods of similar searching effort we selected observation periods ranging between 20 and 40 min. By multiplying the speed and the observation time, we estimated the distance traveled (km). The mean distance traveled per observation period was 17.02 km (range: 6.69–28.12). For this study, we considered the distance traveled as an index of survey effort. When comparing temporal differences in the sampling effort, we did not observe differences among years neither between months and years (Figures S1A,B, respectively). Regardless of the year, survey effort was higher between spring and summer months, whereas survey effort was lower during autumn and winter months. Thus, the observation effort was comparable between years and months.
We then estimated the encounter rates, dividing the number of birds observed by the distance traveled. The encounter rate was used as an index of seabird abundance, thus higher encounter rates were indicative of higher numbers of birds per km traveled. Lower encounter rates were indicative of the opposite pattern.
Climatic Indices and Food Availability
In the case of global climatic indices, the NAO index is estimated from differences in sea level pressure between two distant meteorological stations at Lisbon, Portugal and Stykkisholmur, Iceland (Hurrell and Deser, 2010). Positive NAO values are related to strong westerlies across the middle latitudes of the North Atlantic towards Europe (Hurrell and Deser, 2010). Thus, we expected that positive NAO values would be related to higher abundance of highly migratory shearwaters into the BoB. We used wintertime NAO value (mean value from December to March) since it can leave persistent surface anomalies in the seascape that might significantly influence the marine ecosystems throughout the year (Hurrell and Deser, 2010) (Table 1).
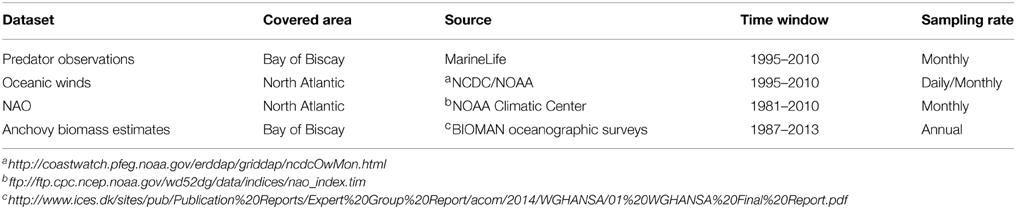
Table 1. Description of the dataset used for understanding the role of climate and food availability on driving decadal abundance patterns of highly migratory marine predators in the Bay of Biscay.
Regarding short-term climatic indices, we analyzed the role of oceanic winds across the North Atlantic (longitude range: 15°–55° W; latitudinal range: 40°–55° N) (see Figure 1, Table 1). We used the Blended Sea Winds containing globally gridded, high resolution ocean surface vector winds on a global 0.25° grid (http://www.ncdc.noaa.gov/oa/rsad/air-sea/seawinds.html). The wind speeds (m s−1) and directions were generated by blending observations from multiple satellites and reanalysis products, respectively. Oceanic wind data was downloaded from the NCDC/NOAA website at http://coastwatch.pfeg.noaa.gov/erddap/griddap/ncdcOwMon.html. Oceanic winds are described using the vector of the wind speed in m s−1 and the direction. Similarly, wind speed can be resolved into two perpendicular components. Zonal u and meridional v winds represent the west-east and north-south direction and are represented by positive values toward the north and east, respectively (more information at http://mst.nerc.ac.uk/wind_vect_convs.html).
Regarding food availability, great and sooty shearwater feed on small pelagic fish (Ronconi et al., 2010). We used a fishery-independent dataset, the biomass index for the European anchovy Engraulis encrasicolus in the BoB, calculated through the daily egg production method as an index of food availability based on oceanographic cruises (Table 1). These cruises have been carried out annually in May at the peak spawning period since 1987, covering the whole spawning area of the anchovy in the BoB (Santos et al., 2011). To ensure that spring Anchovy Biomass (AB) was correlated with anchovy landings during the late summer period, we estimated the non-parametric Spearman-rank correlation coefficient rs between (1) the AB and the historical anchovy landings of May (rs = 0.37, S = 2049.81, P = 0.05), as well as (2) anchovy landings between May and August (rs = 0.60, S = 1287.61, P < 0.001) to ensure the positive underlying biological relationship. Fishing data were extracted from the International Council for the Exploration of the Sea (ICES) reports (Table 1). August was chosen as a representative month of the summer period since it corresponded to the month of first detection of both shearwaters in 46% of the cases, followed by July (27%), September (15%) and October (12%) (see Results). Even the time lag between the biomass estimation (spring) and the study period (late summer), we considered that the AB was a more robust index of small pelagic fish availability than fishing landings in the BoB during the summer period (c.f. Alheit et al., 2014).
Estimation of Flying Costs
We used the flying cost function developed by Louzao et al. (2014) to estimate the cost of traveling across middle latitudes of the North Atlantic. The flying cost function is based on the effect of wind speed w and the angle between flight and wind direction θ based on Weimerskirch et al. (2000), González-Solís et al. (2009). Considering wind speed when estimating flying cots is important for the energy budget during flying activities (González-Solís et al., 2009; Raymond et al., 2010). The flying cost function is expressed by the following equation:
where c is the flying cost (i.e., energy expenditure with arbitrary cost units ranging from 0 to 60), w represents the wind speed (ranging from 0 to 30 m s−1) and θ is the angle between flight and wind direction (ranging from 0° to 180° indicating that birds were flying with tail and head winds, respectively). The intercept at 30 is related to intermediate flying cost units when w and θ are 0° and 90°, respectively (i.e., in the absence of wind and when birds are flying with cross winds; see Figure 1 in Louzao et al., 2014). From this intermediate reference level, energy expenditure decreases when birds are flying from cross winds to tail winds at increasing wind speed. On the contrary, energy expenditure increases when birds fly from cross winds to head winds at increasing wind speed.
Flight costs were estimated monthly using wind speed and direction at the original spatial resolution of 0.25° through a zonal hypothetical flyway across the North Atlantic at the latitude of 45° N from January 1996 to December 2009 (see Figure S2). Monthly wind directions showed that westerlies were the predominant wind direction in this biogeographic area independently of the month of the year and wind speeds were higher during winter months (see Figures S3, S4, respectively). The hypothetical flyway was established based on empirical evidences of southern shearwater migration through the North Atlantic (Hedd et al., 2012). We only focused on the flyway across the North Atlantic between longitudes ranging from 55° to 15° W without considering the departure from the Gulf of Maine (GoM; the main staging area in the Northwest Atlantic) and arrival point to the center of the BoB. The flying cost function was applied to flying activities and, in turn, we assumed that shearwaters were mostly flying from the GoM to the BoB. This assumption is in accordance with empirical evidences of sooty shearwaters that spend a high proportion of the day (78.4 ± 4.2%; 10.1 ± 0.7 hd−1) and over half of the night (58.5 ± 9.1%; 6.4 ± 1.0 h night−1) flying during northward and southward migrations (Hedd et al., 2012). See Figure S5 for an illustrative example of c, w, and θ values for a given month through the hypothetical flyway. We summed the flying cost estimated along the zonal flyway and used it as a measure of flying cost index.
Data Analysis
First, we described the annual timing of highly migratory shearwaters in the BoB by estimating (1) the first month of detection (i.e., month of arrival), (2) the last month of detection (i.e., month of departure), and (3) the staging duration. We tested the relationship between the first month of detection and the staging duration by estimating the Spearman rank correlation coefficient and applying a permutation test to estimate whether correlations were stronger than expected.
Then, we investigated the role of the NAO, oceanic winds and food availability driving the abundance patterns of southern shearwaters entering the BoB during the late summer period (1996–2009) using Generalized Additive Models (GAMs). For each species, the response variable was the number of shearwaters from the first month of detection to September, when all birds that flew to the BoB are assumed to have arrived but when they have not started to migrate south to their breeding grounds (Cuthbert, 2005). Explanatory variables included normalized values of NAO winter index, food availability (AB), as well as the monthly zonal winds u from the previous month of first detection to the previous month of September (see below). We hypothesized that the role of zonal winds would be more critical than wind speeds or meridional winds in facilitating the arrival of shearwaters to the BoB due to the longitudinal flyway across the middle latitudes of the North Atlantic. Collinearity between predictors was checked with the Variation Inflation Factor (cutting point of 5). No variable was removed since VIF was lower than 5 in all cases.
GAMs were carried out using the mgcv package (Wood and Augustin, 2002) and limiting the smoothing splines to a maximum of three degrees of freedom. Models were compared using Akaike's Information Criterion corrected for small sample sizes (AICc) and the model with the lowest AICc value was considered the best compromise between model deviance and model complexity. When models were within 2 points of AICc, they were considered statistically equivalent (Williams et al., 2002). Models were first ordered by their AICc value and among equivalent models the best model was chosen as the one with highest explained deviance. Shearwater abundance was modeled by including the log-transformed distance traveled (i.e., effort in km) as an offset in order to minimize estimation biases due to surveyed effort, following a negative binomial distribution. This model was selected over the Poisson distribution since the AICc value was lower for the negative binomial distribution. The following equation represented the full model for each species:
where A stands for abundance patterns of shearwaters each month between the month of first detection to September i from 1996 to 2009 (n = 26), whereas ε represents the residuals.
Finally, we analyzed the influence of flying costs along the hypothetical zonal flyway driving abundance patterns of southern shearwaters in the BoB over the period January 1996–December 2009. We hypothesized that the abundance of shearwaters (i.e., the encounter rate) for a given month was influenced by the flying cost (FC) estimate from the previous month (t - 1). For great shearwater, this hypothesis was supported by the higher rs between the encounter rate of a given month and the FC of the previous month (rs = 0.16, S = 395681.8, P = 0.074) than the rs between the encounter rate and the FC of the same month (rs = 0.03, S = 339152.3, P = 0.74). A similar correlation pattern was found for sooty shearwater (rs = 0.16, S = 667586.1, P = 0.009 for the encounter rate and FC of the previous month; rs = −0.21, S = 566948.8, P = 0.923 for encounter rate and FC of the same month). This relationship was tested using GAMs and is represented by the following expression:
where A stands for abundance patterns of shearwaters every month i from January 1996 to December 2009 (n = 167), whereas ε represents the residuals. We did not restrict the analysis to any specific period of the year when shearwaters were most likely to occur in the BoB, but tested the direct influence of lower flying cost months (explanatory variable) in facilitating the arrival of a higher number of shearwaters (response variable). Shearwater abundance was modeled by including log-transformed traveled distance (i.e., effort in km) as an offset in order to minimize estimation biases due to surveyed effort, following a negative binomial distribution. GAMs were performed following the procedure previously described and we only compared two candidate models: the null model and the one including the flying costs. The model with the lowest AICc value was considered the best compromise between model deviance and model complexity. All data processing and analysis were performed within the R environment (R Core Team, 2014).
Results
We observed a total of 8630 great shearwaters (GRSH) and 612 sooty shearwaters (SOSH) during 105408 km traveled and 3030 h of observations. Note that no GRSH were detected in 2001 and 2008 (see Figures 2A,B). Overall encounter rates (mean ± SD) for GRSH and SOSH were 0.091 ± 1.728 and 0.006 ± 0.149 birds km−1, respectively. Encounter rate values for both species were higher in 2000 and 2005 across the study period, as well as in 2002 for GRSH and 2009 for SOSH (Figure 2C). We found a non-significant positive correlation between the annual encounter rate of both species (rs = 0.40, S = 272.80, P = 0.156).
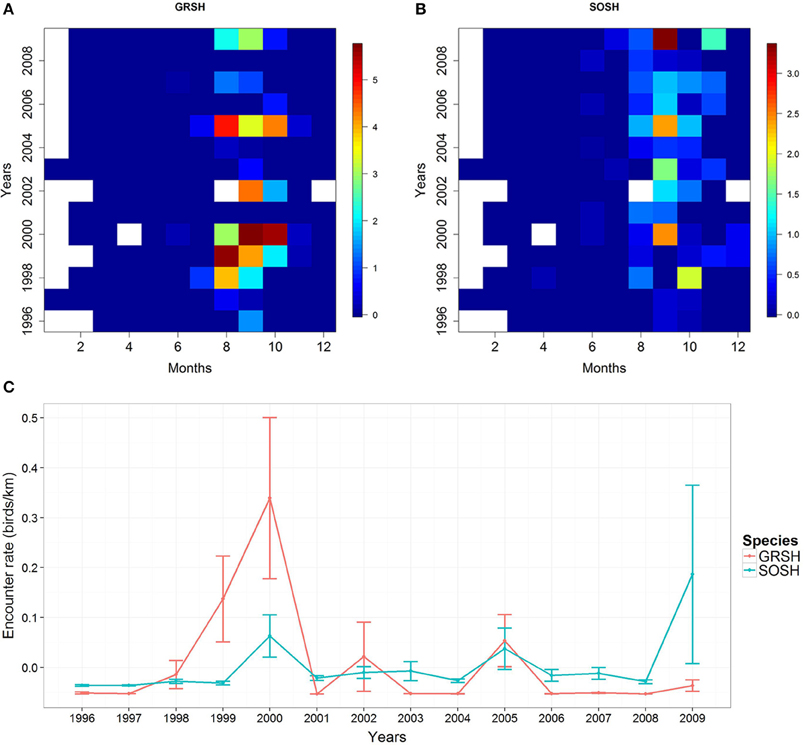
Figure 2. Temporal trends of log-transformed encounter rate (ER, number of birds/traveled km) for (A) great shearwaters (GRSH) (B) sooty shearwaters (SOSH) in the Bay of Biscay and (C) Decadal trends of encounter rates (birds km−1) for both species. Blank values correspond to non-surveyed months. Encounter rates were normalized for visualization purposes.
Both species were mainly present in the BoB from July to November (Figures 2A,B). The timing of arrival and departure ranged from July to October and September to November, respectively (Figures 3A,B). However, observed patterns for SOSH were more regular (above 50% of the first month of arrival was in August, and months of departure were in October and November). The detection months in the BoB varied from 1 to 5 months for GRSH, while detection months were from 2 to 5 months for SOSH (Figure 3C). The first detection month was significantly negatively correlated with the staging duration for both species (rs = −0.88, S = 538.624, P < 0.001 based on a permutation test for GRSH; rs = −0.827, S = 2049.81, P < 0.001 for SOSH; Figure 3D). Therefore, these results indicate that the earlier shearwaters were detected in the BoB, the longer the detection period. Cumulative higher encounter rates (1996–2009) were recorded during the months of August and September for GRSH and September for SOSH (Figures 2A,B). Annual encounter rates for both species varied significantly between years for both species (Kruskal-Wallis test for GRSH H12, 6193 = 237.08, P < 0.001; Kruskal-Wallis test for SOSH H12, 6193 = 72.03, P < 0.001).
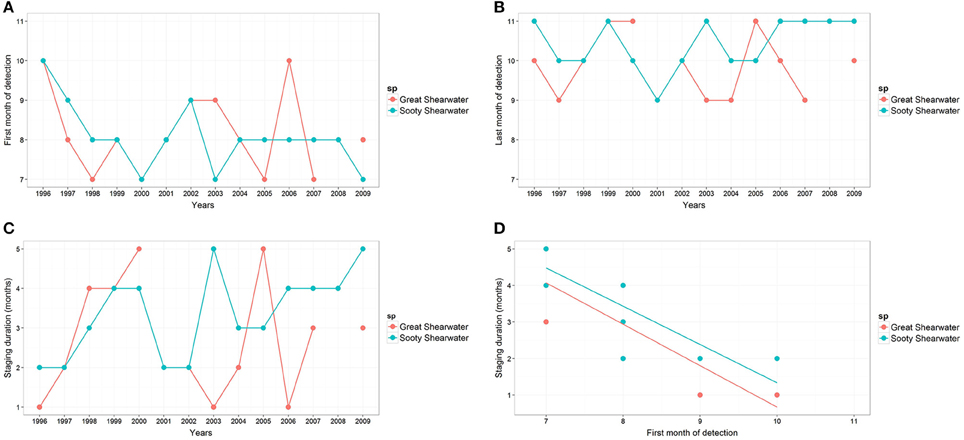
Figure 3. Staging dynamic of transequatorial migrating seabirds in the Bay of Biscay described by (A) the first and (B) last months of detection, (C) staging duration (months) and (D) the relationship between both of them. GRSH, great shearwater; SOSH, sooty shearwater. Note that GRSHs were not detected in 2001 and 2008.
For the time series of global and local environmental drivers, normalized mean values are given in Figure 4 for the study period (1996–2009). Regarding climatic indices, NAO winter (December–March) values showed high inter-annual variability ranged between −0.867 and 0.867, with maximum and minimum values observed in 2000 and 1996, respectively. For local environmental drivers, food availability expressed as AB peaked in 1998 and 2001, with the lowest value in 2005. Wind speed ranged between 6.15 and 9.28 m s−1, whereas zonal and meridional winds ranged 1.23–4.86 m s−1 and −0.42–2.01 m s−1, respectively. In the case of oceanic winds, we were interested in analysing the correlation between zonal winds and both NAO and AB. The zonal wind was only negatively correlated (not statistically significant) with NAO values, whilst no correlation was found between NAO and AB in the case of both species (see Figure S6).
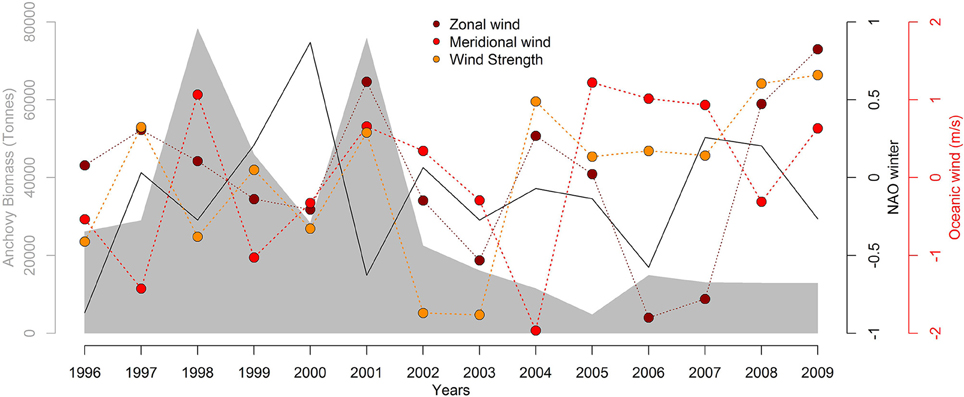
Figure 4. Decadal trends of anchovy biomass estimates (gray shaded area represented in the left y-axis), winter values of the North Atlantic Oscillation index (NAO, solid black line represented in the first right y-axis) and oceanic winds (zonal, meridional, and wind strength indicated by dark blue, blue, and light blue dotted lines, respectively, with values represented in the second right y-axis). Oceanic winds have been normalized by subtracting the mean and dividing by the time series standard deviation. Wind August values are shown only for illustration purposes since it was the most representative month of first summer detection for both great and sooty shearwater species (47% of all cases).
Regarding abundance patterns of these highly migratory shearwaters, the model containing the NAO winter index was chosen as the best model for GRSH apart from the additive effect of AB for SOSH (Table 2). Abundance of GRSH increased with increasing winter NAO values, explaining 17% of the observed abundance variability (Table 2, Figure 5). For SOSH, abundance was higher at intermediate NAO winter values, whilst there was a decreasing effect of AB which explained 64% of observed variability in abundance (Table 2, Figure 5). Our modeling approach did not identify zonal wind as an important factor driving the staging dynamic of migrating shearwaters into the BoB.
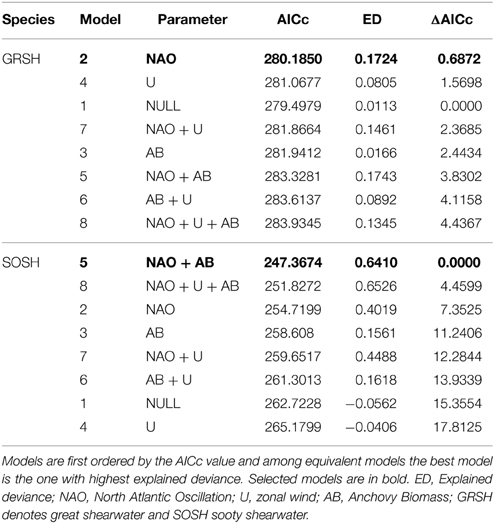
Table 2. Output of Generalized Additive Models showing the ranking of the candidate models based on the corrected Akaike Information Criteria (AICc).
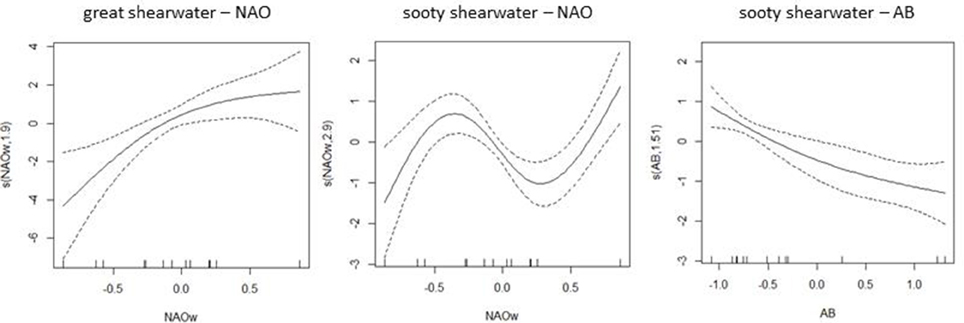
Figure 5. Smooth functions fitted to the best relationships between great and sooty shearwater abundance and environmental variables: NAO winter index (December to March) and less importantly the anchovy biomass estimation (AB). Models were first ordered by the AICc value and among equivalent models the best model was the one with highest explained deviance (see results in Table 2). Dotted areas represent the 95% confidence interval. Tick marks on the horizontal axis show the distribution of observations. The vertical axes describe the smoother term and estimated degrees of freedom.
Potential flying cost estimations during the study period showed that higher costs for crossing the North Atlantic occurred in August (see Figure S7). GAM analysis showed that shearwater monthly abundance was better explained by the potential flying costs of the preceding month rather than the null model in the case of both species (Table 3, Figure 6). With more than 3500 units of flying costs across the North Atlantic, predicted shearwater abundance in the following month decreased progressively in the BoB. In other words, shearwaters tend to arrive in the BoB when potential migration/flying costs across the North Atlantic were lower, associated with lower average wind speeds (Figure 7). These models accounted for the 24.8 and 23.3% of the explained deviance of GRSH and SOSH abundance, respectively.
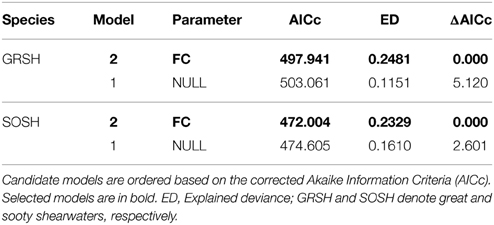
Table 3. Summary of Generalized Additive Models exploring the relationship between monthly abundance patterns and potential flying costs (FC) of the preceding month for great and sooty shearwaters, respectively, from January 1996 to December 2009.
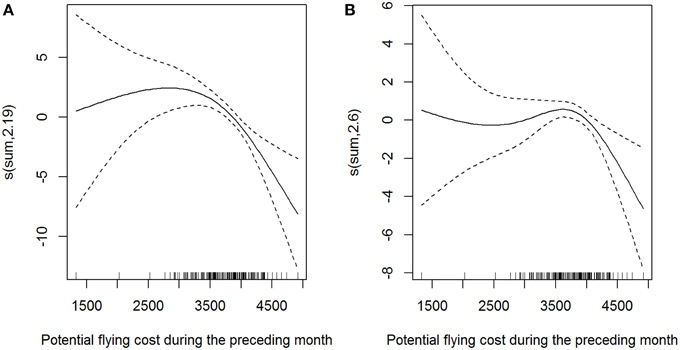
Figure 6. Generalized Additive Model output exploring the relationship between monthly abundance patterns and potential flying costs of the preceding month for (A) great and (B) sooty shearwaters, respectively, from January 1996 to December 2009. Dotted areas represent the 95% confidence interval. Tick marks on the horizontal axis show the distribution of observations. The vertical axes describe the smoother term and estimated degrees of freedom. These models accounted for the 24.8 and 23.3% of the explained deviance of GRSH and SOSH, respectively.
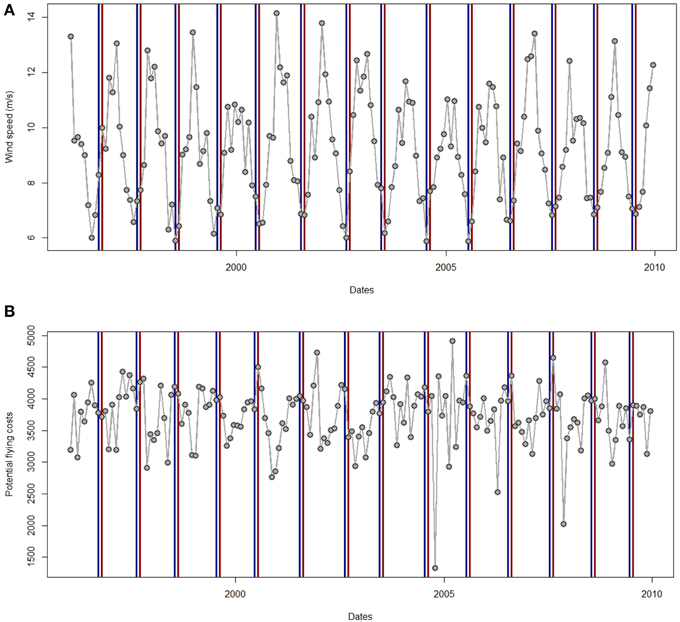
Figure 7. (A) Time series of monthly wind speed and (B) potential flying cost (FC) from January 1996 to December 2009. Blue and red lines represent the month preceding the staging period and the month arriving to the Bay of Biscay for sooty shearwaters since time series are the same for great shearwaters.
Discussion
In this study, we provide new insights into the role of decadal climatic effects driving migratory seabird movements across the North Atlantic. Both shearwater species were influenced by large scale NAO climatic index, but the shape of the relationship was different and the SOSH was also negatively influenced by food availability in the BoB. Abundance of GRSH was higher with increasing winter NAO values while SOSH abundance was higher at intermediate values. Thus, our predictions were partially fulfilled since higher NAO values were related to higher abundance of highly migratory shearwaters. This could be explained by higher NAO values related to stronger westerlies across the middle latitudes of the North Atlantic toward Europe (Hurrell and Deser, 2010) and, in turn, facilitating the arrival of southern shearwaters. The large-scale winter NAO index (December-March) can leave persistent surface anomalies in the seascape that might significantly influence the marine ecosystems throughout the year (Hurrell and Deser, 2010).
In addition, we also observed differences in abundances as well as the timings of arrival and departure: GRSH were more abundant than SOSH but the arrival of the former seemed to be more variable, supported by previous results (Hobbs et al., 2003; Ocio et al., 2011). This could be related to the different shape of the relationship between each species abundance and NAO values. Even if both species might likely rely on different cues during the migration, they shape their arrival in the BoB during periods which minimize flying costs across the two extremes of the North Atlantic. Indirectly, distribution patterns of both species might be related to oceanic winds, since positive NAO values are related to westerly (positive zonal) winds across middle latitudes of the Atlantic (Hurrell and Deser, 2010). Thus, stronger westerly winds might facilitate the arrival of higher numbers of highly migratory shearwaters into the BoB. The indirect effects of oceanic winds might be related to the shorter spatiotemporal variability captured by oceanic winds, while climatic indices integrate environmental information simultaneously over several months.
Great and sooty shearwaters entering the BoB can be detected during a time period of 5 months from July to November. Recent tracking information has shown that southern shearwaters might not approach the BoB during certain years after staging in the GoM from June to August (Welch and Ronconi, pers. commun.). These birds might follow a mid-ocean route in their southward return to the breeding grounds in the South Atlantic (Bourne, 1986). In fact, numbers of southern shearwaters in the northwest Atlantic seem to be higher than in the noreast Atlantic (Bourne, 1986). Therefore, shearwaters might detour to the BoB during certain environmental conditions related to food availability and/or lack of favorable wind conditions (Dias et al., 2012). In addition, another alternative hypothesis was suggested by Bourne (1986) in that most southern shearwaters entering the BoB to feed in upwelling areas might be non- or pre-breeders (Bourne, 1986, but see Romay et al., 2009). In the case of great shearwaters, breeders return synchronously to their burrows in mid-September (Cuthbert, 2005) and, in turn, bird observed in the BoB after this period should be considered as non-breeders.
Since shearwater at-sea observations were restricted to the internal BoB at a monthly temporal scale, our results are limited in precisely describing the timing of migratory flows. Cumulative higher encounter rates were recorded during the months of August and September for GRSH and September for SOSH. Observations from the northernmost headland in Spain (i.e., Estaca de Bares which is an important gateway for Atlantic seabirds, http://www.seawatchingestaca.com/) has shown the apparent existence of different migratory flows for GRSH: a less and more important in September and the first half of November, respectively (Sandoval et al., 2009, 2010). In the case of SOSH, the main migratory flow was identified from mid-September to mid-October (Sandoval et al., 2009). Thus, observations from the internal BoB were unable to detect the migratory flow of GRSH during the first half of November observed in the southwestern sector of the BoB, which might correspond to non-breeding individuals (Bourne, 1986; Cuthbert, 2005).
Surprisingly, we found a negative relationship between the abundance of sooty shearwaters and fish abundance, while no relationship was found between great shearwaters and fish abundance. We expected to obtain (if any) a positive relationship between shearwater and fish abundance and our results could be in part related to the difficulty of identifying the factors influencing the decision of arriving/leaving specific wintering areas during the non-breeding. When studying the joint effects of climate and food abundance during breeding, closely related species such as the Cory's shearwater Calonectris diomedea did show an important combined effect of climate (i.e., NAO) and food availability (wind effects were not included) on the behavior and foraging range (Paiva et al., 2013). Previous winter negative NAO values may cause a decrease in food availability in foraging grounds and force shearwaters to exploit remote areas and consequently show lower reproductive rates (Paiva et al., 2013). Thus, the distribution patterns of breeding adults might be more affected by small-scale environmental conditions around their nesting grounds, while during the non-breeding season they would be more affected by large-scale environmental conditions. This is partially supported by previous studies showing that global climatic effects have an important effect at the long-term population level (e.g., adult survival) (Sandvik et al., 2005; Genovart et al., 2013). These studies highlighted that adult survival is mainly influenced by large scale climatic oscillations and prey availability is generally a worse predictor, though climatic factors could have an indirect effect possibly through the food chain.
Here, we have studied the role of different environmental drivers affecting the decadal abundance patterns of southern hemisphere breeding shearwaters in the BoB. Within the foraging process, environmental drivers are extrinsic factors that constrain decision-making, while internal state (i.e., physiology that drives the organism to fulfill energetic requirements) governs the decision of foraging destinations (i.e., where and when to move, Nathan et al., 2008). Thus, both extrinsic and intrinsic factors play an important role and are intimately interlinked (Owen-Smith et al., 2010). To further advance our knowledge of migration ecology, we foresee that the quantification of energy costs can be a valuable index integrating different processes at the level of migration. By quantifying the energy needed for pelagic birds to move, we will be able to understand how foragers may move across the landscape in order to maximize net energy gain (Louzao et al., 2014). We acknowledge that we have only considered a small portion of the migratory dynamic, but we have provided an energetic understanding of Southern Hemisphere breeding shearwater migratory dynamics in the North Atlantic.
Long-term time series data are crucial for understanding the effects of changing ecosystems on wide-ranging predators, since the first response of animals might be related to changes in foraging traits (e.g., distribution), while demographic effects might be evidenced in the long-term (Weimerskirch et al., 2012). Research efforts studying climate effects have focused more on population-level parameters such as population size, breeding performance and survival rates (Frederiksen et al., 2007). The study of the at-sea distribution of marine predators is more challenging but can be overcome due to the advent of tracking technologies. Therefore, integrative studies combining observations from systematic cruises and tracking devices may be able to provide a comprehensive picture of the effect of changing ecosystems on widely distributed marine predators.
Conflict of Interest Statement
The authors declare that the research was conducted in the absence of any commercial or financial relationships that could be construed as a potential conflict of interest.
Acknowledgments
Thanks to MarineLife observers collecting observations onboard the P&O Ferries Pride of Bilbao, as well as to the company for facilitating this study. Thanks to Sergi Pérez-Jorge, Antonio Sandoval, Pep Arcos, Jacob González-Solís, Unai Cotano, and Guillermo Boyra for fruitful discussions. ML was funded by a Juan de la Cierva (JCI-2010-07639) and a Ramón y Cajal (RYC-2012-09897) postdoctoral contract. This study is a contribution to the CONPELHAB (PCIG09-GA-2011-293774) and CHALLENGES (CTM2013-47032-R) projects. The contribution number is 726 from AZTI.
Supplementary Material
The Supplementary Material for this article can be found online at: http://journal.frontiersin.org/article/10.3389/fevo.2015.00090
References
Alheit, J., Licandro, P., Coombs, S., Garcia, A., Giráldez, A., Santamaría, M. T. G., et al. (2014). Atlantic Multidecadal Oscillation (AMO) modulates dynamics of small pelagic fishes and ecosystem regime shifts in the eastern North and Central Atlantic. J. Mar. Syst. 133, 88–102. doi: 10.1016/j.jmarsys.2014.02.005
Arcos, J. M., Bécares, J., Rodríguez, B., and Ruiz, A. (2009). Áreas Importantes para la Conservación de las Aves Marinas en España. Madrid: Sociedad Española de Ornitología (SEO/BirdLife).
Bourne, W. (1986). Late summer seabird distribution off the west coast of Europe. Irish Birds 3, 175–198.
Brereton, T. M., Weir, C., Hobbs, M., and Williams, A. D. (2003). A low-cost, year-round seabird monitoring programme in the English channel and Bay of Biscay?: preliminary results 1995-2001. Ornis Hungarica 12–13, 105–113.
Cuthbert, R. J. (2005). Breeding biology, chick growth and provisioning of Great Shearwaters (Puffinus gravis) at Gough Island, South Atlantic Ocean. Emu 105, 305–310. doi: 10.1071/MU05036
Dias, M. P., Granadeiro, J. P., and Catry, P. (2012). Do seabirds differ from other migrants in their travel arrangements? On route strategies of Cory's shearwater during its trans-equatorial journey. PLoS ONE 7:e49376. doi: 10.1371/journal.pone.0049376
Felicísimo, A. M., Muñoz, J., and González-Solis, J. (2008). Ocean surface winds drive dynamics of transoceanic aerial movements. PLoS ONE 3:e2928. doi: 10.1371/journal.pone.0002928
Frederiksen, M., Harris, M. P., Daunt, F., Rothery, P., and Wanless, S. (2004). Scale-dependent climate signals drive breeding phenology of three seabird species. Glob. Chang. Biol. 10, 1214–1221. doi: 10.1111/j.1529-8817.2003.00794.x
Frederiksen, M., Mavor, R., and Wanless, S. (2007). Seabirds as environmental indicators: the advantages of combining data sets. Mar. Ecol. Prog. Ser. 352, 205–211. doi: 10.3354/meps07071
Genovart, M., Sanz-Aguilar, A., Fernández-Chacón, A., Igual, J. M., Pradel, R., Forero, M. G., et al. (2013). Contrasting effects of climatic variability on the demography of a trans-equatorial migratory seabird. J. Anim. Ecol. 82, 121–130. doi: 10.1111/j.1365-2656.2012.02015.x
González-Solís, J., Felícisimo, A., Fox, J., Afanasyev, V., Kolbeinsson, Y., and Muñoz, J. (2009). Influence of sea surface winds on shearwater migration detours. Mar. Ecol. Prog. Ser. 391, 221–230. doi: 10.3354/meps08128
Gordo, O. (2007). Why are bird migration dates shifting? A review of weather and climate effects on avian migratory phenology. Clim. Res. 35, 37–58. doi: 10.3354/cr00713
Hedd, A., Montevecchi, W. A., Otley, H., Phillips, R. A., and Fifield, D. A. (2012). Trans-equatorial migration and habitat use by sooty shearwaters Puffinus griseus from the South Atlantic during the nonbreeding season. Mar. Ecol. Prog. Ser. 449, 277–290. doi: 10.3354/meps09538
Hobbs, M. J., Brereton, T., Weir, C., and Williams, A. (2003). Baseline monitoring data on procellariformes (Shearwaters) in the Bay of Biscay. Ornis Hungarica 12–13, 115–125.
Hoegh-Guldberg, O., and Bruno, J. F. (2010). The impact of climate change on the world's marine ecosystems. Science 328, 1523–1528. doi: 10.1126/science.1189930
Hurrell, J. W., and Deser, C. (2010). North Atlantic climate variability: the role of the North Atlantic Oscillation. J. Mar. Syst. 79, 231–244. doi: 10.1016/j.jmarsys.2009.11.002
Lezama-Ochoa, A., Boyra, G., Goñi, N., Arrizabalaga, H., and Bertrand, A. (2010). Investigating relationships between albacore tuna (Thunnus alalunga) CPUE and prey distribution in the Bay of Biscay. Prog. Oceanogr. 86, 105–114. doi: 10.1016/j.pocean.2010.04.006
Louzao, M., Wiegand, T., Bartumeus, F., and Weimerskirch, H. (2014). Coupling instantaneous energy-budget models and behavioural mode analysis to estimate optimal foraging strategy: an example with wandering albatrosses. Mov. Ecol. 2:8. doi: 10.1186/2051-3933-2-8
McKnight, A., Allyn, A. J., Duffy, D. C., and Irons, D. B. (2013). “Stepping stone” pattern in Pacific Arctic tern migration reveals the importance of upwelling areas. Mar. Ecol. Prog. Ser. 491, 253–264. doi: 10.3354/meps10469
Nathan, R., Getz, W. M., Revilla, E., Holyoak, M., Kadmon, R., Saltz, D., et al. (2008). A movement ecology paradigm for unifying organismal movement research. Proc. Natl. Acad. Sci. U.S.A. 105, 19052. doi: 10.1073/pnas.0800375105
Ocio, G., Bermejo, A., and García-Barcelona, S. (2011). “Movimientos de los procelariformes en el Golfo De Vizcaya y Canal de La Mancha,” en Actas del 6° Congreso del GIAM y el Taller Internacional Sobre la Ecología de Paiños y Pardelas en el sur de Europa, Vol. 34, eds X. Valeiras, G. Muñoz, A. Bermejo, J. M. Y. Arcos, and A. M. Paterson (Boletín del Grupo Ibérico de Aves Marinas), 5–14.
Owen-Smith, N., Fryxell, J. M., and Merrill, E. H. (2010). Foraging theory upscaled: the behavioural ecology of herbivore movement. Philos. Trans. R. Soc. Lond. B Biol. Sci. 365, 2267–2278. doi: 10.1098/rstb.2010.0095
Paiva, V. H., Geraldes, P., Marques, V., Rodríguez, R., Garthe, S., and Ramos, J. A. (2013). Effects of environmental variability on different trophic levels of the North Atlantic food web. Mar. Ecol. Prog. Ser. 477, 15–28. doi: 10.3354/meps10180
Raymond, B., Shaffer, S. A., Sokolov, S., Woehler, E. J., Costa, D. P., Einoder, L., et al. (2010). Winds and prey availability determine shearwater foraging distribution in the Southern Ocean. PLoS ONE 5:e10960. doi: 10.1371/journal.pone.0010960
R Core Team. (2014). R: A Language and Environment for Statistical Computing. Vienna: R Foundation for Statistical Computing. Available online at: http://www.R-project.org
Roessig, J. M., Woodley, C. M., Cech, J. J., and Hansen, L. J. (2004). Effects of global climate change on marine and estuarine fishes and fisheries. Rev. Fish Biol. Fish. 14, 251–275. doi: 10.1007/s11160-004-6749-0
Romay, C. D., Ramos, A., Barros, Á., and Bao, R. (2009). “Biological aspects of sex ratio and age at Great Shearwater Puffinus gravis in the Northeast Atlantic,” in Actas del 6° Congreso del GIAM y el Taller internacional sobre la Ecología de Paiños y Pardelas en el sur de Europa, 133–136.
Ronconi, R., Koopman, H., McKinstry, C., Wong, S., and Westgate, A. (2010). Inter-annual variability in diet of non-breeding pelagic seabirds Puffinus spp. at migratory staging areas: evidence from stable isotopes and fatty acids. Mar. Ecol. Prog. Ser. 419, 267–282. doi: 10.3354/meps08860
Sandoval, A., Hevia, R., and Fernández, D. (2009). Boletín de la Estación Ornitológica de Estaca de Bares. Número 1 - Año 2008. Dirección Xeral de Conservación da Natureza, Consellería do Medio Ambiente e Desenvolvemento Sostible da Xunta de Galicia/TERRANOVA Interpretación y Gestión Ambiental.
Sandoval, A., Hevia, R., Fernández, D., and Valderas, A. (2010). Boletín de la Estación Ornitológica de Estaca de Bares. Número 2 - Año 2009. Dirección Xeral de Conservación da Natureza, Consellería do Medio Rural da Xunta de Galicia/TERRANOVA Interpretación y Gestión Ambiental.
Sandvik, H., Erikstad, K. E., Barrett, R. T., and Yoccoz, N. G. (2005). The effect of climate on adult survival in five species of North Atlantic seabirds. J. Anim. Ecol. 74, 817–831. doi: 10.1111/j.1365-2656.2005.00981.x
Santos, M., Uriarte, A., and Ibaibarriaga, L. (2011). Spawning stock biomass estimates of the Bay of Biscay anchovy (Engraulis encrasicolus, L.) in 2010 applying the daily egg production method. Rev. Investig. Mar. 18, 77–91.
Shaffer, S. A., Tremblay, Y., Weimerskirch, H., Scott, D., Thompson, D. R., Sagar, P. M., et al. (2006). Migratory shearwaters integrate oceanic resources across the Pacific Ocean in an endless summer. Proc. Natl. Acad. Sci. U.S.A. 103, 12799–12802. doi: 10.1073/pnas.0603715103
Stenhouse, I. J., Egevang, C., and Phillips, R. A. (2012). Trans-equatorial migration, staging sites and wintering area of Sabine's Gulls Larus sabini in the Atlantic Ocean. Ibis 154, 42–51. doi: 10.1111/j.1474-919X.2011.01180.x
Stenseth, N. C., Mysterud, A., Ottersen, G., Hurrell, J. W., Chan, K. S., and Lima, M. (2002). Ecological effects of climate fluctuations. Science 297, 1292–1296. doi: 10.1126/science.1071281
Thackeray, S. J., Sparks, T. H., Frederiksen, M., Burthe, S., Bacon, P. J., Bell, J. R., et al. (2010). Trophic level asynchrony in rates of phenological change for marine, freshwater and terrestrial environments. Glob. Chang. Biol. 16, 3304–3313. doi: 10.1111/j.1365-2486.2010.02165.x
Weimerskirch, H., Guionnet, T., Martin, J., Shaffer, S. A., and Costa, D. P. (2000). Fast and fuel efficient? Optimal use of wind by flying albatrosses. Proc. R. Soc. B Biol. Sci. 267, 1869–1874. doi: 10.1098/rspb.2000.1223
Weimerskirch, H., Louzao, M., de Grissac, S., and Delord, K. (2012). Changes in wind pattern alter albatross distribution and life-history traits. Science 335, 211–214. doi: 10.1126/science.1210270
Williams, B. K., Nichols, J. D., and Conroy, M. J. (2002). Analysis and Management of Animal Populations: Modeling, Estimation, and Decision Making. San Diego, CA: Academic Press.
Wood, S. N., and Augustin, N. H. (2002). GAMs with integrated model selection using penalized regression splines and applications to environmental modelling. Ecol. Modell. 157, 157–177. doi: 10.1016/S0304-3800(02)00193-X
Keywords: oceanic winds, North Atlantic Oscillation, energetic ecology, trans-equatorial migration, pelagic seabird, food availability
Citation: Louzao M, Afán I, Santos M and Brereton T (2015) The role of climate and food availability on driving decadal abundance patterns of highly migratory pelagic predators in the Bay of Biscay. Front. Ecol. Evol. 3:90. doi: 10.3389/fevo.2015.00090
Received: 15 December 2014; Accepted: 17 July 2015;
Published: 18 August 2015.
Edited by:
Morten Frederiksen, Aarhus University, DenmarkReviewed by:
Morten Frederiksen, Aarhus University, DenmarkVitor H. Paiva, Universidade de Coimbra, Portugal
Jerome Fort, University of La Rochelle, France
Copyright © 2015 Louzao, Afán, Santos and Brereton. This is an open-access article distributed under the terms of the Creative Commons Attribution License (CC BY). The use, distribution or reproduction in other forums is permitted, provided the original author(s) or licensor are credited and that the original publication in this journal is cited, in accordance with accepted academic practice. No use, distribution or reproduction is permitted which does not comply with these terms.
*Correspondence: Maite Louzao, AZTI, Functioning of Marine Ecosystems, Herrera Kaia, Portualdea z/g, 20110 Pasaia, Spain,bWFpdGUubG91emFvQGdtYWlsLmNvbQ==