 Pei-Ju Chen
 Hiroko Awata
 Atsuko Matsushita
 En-Cheng Yang
 Kentaro Arikawa
- 1Department of Evolutionary Studies of Biosystems, SOKENDAI (The Graduate University for Advanced Studies), Hayama, Japan
- 2Department of Entomology, National Taiwan University, Taipei, Taiwan
Butterfly eyes are furnished with a variety of photoreceptors of different spectral sensitivities often in species-specific manner. We have conducted an extensive comparative study to address the question of how their spectrally complex retinas evolved. Here we investigated the structure and function of the eye of the common bluebottle butterfly (Graphium sarpedon), using electrophysiological, anatomical, and molecular approaches. Intracellular electrophysiology revealed that the eye contains photoreceptors of 15 distinct spectral sensitivities. These can be divided into six spectral receptor classes: ultraviolet—(UV), violet— (V), blue—(B), blue–green—(BG), green—(G), and red—(R) sensitive. The B, G, and R classes respectively contain three, four, and five subclasses. Fifteen is the record number of spectral receptors so far reported in a single insect eye. We localized these receptors by injecting dye into individual photoreceptors after recording their spectral sensitivities. We thus found that four of them are confined to the dorsal region, eight to the ventral, and three exist throughout the eye; the ventral eye region is spectrally richer than the dorsal region. We also identified mRNAs encoding visual pigment opsins of one ultraviolet, one blue, and three long wavelength-absorbing types. Localization of these mRNAs by in situ hybridization revealed that the dorsal photoreceptors each express a single opsin mRNA, but more than half of the ventral photoreceptors coexpress two or three L opsin mRNAs. This expression pattern well explains the spectral organization of the Graphium compound eye.
Introduction
Butterflies and moths often have sophisticated color vision (Kelber and Pfaff, 1999; Kinoshita et al., 1999; Kelber et al., 2002). Their color vision appears to have evolved from an ancestral trichromatic system based on the ultraviolet-, blue-, and green-sensitive photoreceptors (Menzel and Backhaus, 1989; Peitsch et al., 1992; Lin, 1993; Skorupski and Chittka, 2010; Blackiston et al., 2011). The system subsequently elaborated by adding photoreceptors of various spectral sensitivities, most likely by positive selection of duplicated visual pigment opsins (Briscoe et al., 2010). Recent studies indicate that the suite of photoreceptor sensitivities varies extensively between butterfly species. For example, the Japanese yellow swallowtail, Papilio xuthus (tribe Papilionini, family Papilionidae), has six classes of spectral receptors, which are of the ultraviolet (UV), violet (V), blue (B), green (G), red (R), and broadband (BB) classes (Arikawa, 2003), while the small white butterfly, Pieris rapae, has UV, V, B, G, R, and dark red (DR) receptors. The spectral sensitivities are even sexually dimorphic in some cases: the V receptors of P. rapae exist only in females, and the males instead have double-peaked B receptors (Arikawa et al., 2005).
The richest variety of spectral receptors reported to date in the animal kingdom is found in the eyes of reef-dwelling stomatopods or mantis shrimps, which have up to 16 classes of receptors (Cronin, 2006). Until now, the golden birdwing, Troides aeacus (Troidini, Papilionidae) held the record among insects, with nine classes (Chen et al., 2013). Why is the spectral organization of eyes so different? Are these animals hexa-, nona-, or even hexadeca-chromatic? What is the mechanism underlying their color vision? To address such questions, we have adopted a comparative approach.
Graphium is a large genus common in Australasian regions. They generally have large compound eyes, fly very fast and frequently visit puddles as well as colorful flowers, indicating their high performance vision. The common bluebottle, Graphium sarpedon (Leptocercini, Papilionidae) has wings with a conspicuous mid-band with blue–green colored patches. The physics of the wing coloration has been extensively studied, and have been found to be quite complicated where angle-dependent iridescence is involved because of a unique type of flattened scales (Stavenga et al., 2010). The elaborate wing coloration must be crucial for visual signaling but information about their vision is limited (Eguchi et al., 1982). Here we studied the spectral organization of their compound eyes, and to our surprise, we found photoreceptors of at least 15 different spectral sensitivities in their eyes. We confirmed the validity of the finding by localizing this extensive collection of photoreceptor classes in the retina.
Materials and Methods
Animals
Adult common bluebottle butterflies G. sarpedon nipponum were collected around Sokendai, Kanagawa, Japan. The butterflies were fed daily with sucrose solution and were used for experiments within 3 days of capture. We here present the results of males only, because it was difficult to obtain enough number of females for the study. We used about 200 male individuals in total.
To identify mRNAs encoding visual pigment opsins, we used the eyes of 10 papilionid species including G. sarpedon. The other nine species were Luehdorfia japonica and Luehdorfia puziloi (gifts from Mr. Isao Nihira), Sericinus montela (from Prof. Yoshiomi Kato), Atrophaneura alcinous and Papilio machaon (collected around Sokendai), Pachliopta aristolochiae, (collected in Okinawa), Graphium macleyanum and Papilio anactus (collected in Canberra Australia), and T. aeacus formosanus (obtained from individuals after the completion of electrophysiological experiments reported in Chen et al., 2013).
Electrophysiology and Dye Injection
Photoreceptor spectral sensitivities were determined by intracellular electrophysiology. A butterfly whose wings and legs had been removed was mounted on a stage. A chlorinated silver wire was inserted into the stump of an antenna as the reference electrode. A hole covering about 10–20 facets was made in the dorsal region of the eye, in order to insert the recording microelectrode. The eye was then positioned at the center of a Cardan arm perimeter device, inside a Faraday cage.
A glass microelectrode filled with 10 mM Alexa fluor 568 (excitation/emission at 578/603 nm) dissolved in 1 M KCl or 4% lucifer yellow CH (excitation/emission at 428/536 nm), with resistance about 60–100 MΩ, was inserted into the retina. The stimulus light was provided by a 500 W xenon arc lamp through one of 22 narrow-band interference filters at 20 nm intervals from 300 to 740 nm. The light was guided through a quartz optical fiber creating a light source of about 1.56° diameter from the animal's perspective. The fiber was mounted on the perimeter device and positioned on the optical axis of the ommatidium containing the cell being penetrated. Photoreceptor spectral responses were recorded by applying a series of equiquantal monochromatic flashes sweeping from short to long wavelength and back again. Flashes lasted 30 ms and were separated by 1 s intervals. Polarization responses were also recorded at the wavelength that gave the maximal response, by rotating a UV-transparent polarization filter in front of the fiber: 0° was defined as the direction of the animal's dorso-ventral axis. Then the response–light intensity (V–log I) function was recorded over a 4 log unit intensity range at the peak wavelength. Only when the maximal response was over 30 mV in amplitude was the recording accepted. The recorded V–log I data were fitted to the Naka-Rushton function: V/Vmax = In/(In + Kn), where I is the stimulus intensity, V is the response amplitude, Vmax is the maximum response amplitude, K is the stimulus intensity eliciting 50% of Vmax, and n is the exponential slope. The V–log I function was used to convert the V-values measured in the spectral series into photon numbers required to elicit the responses. The normalized reciprocal of the relative photon numbers then yielded the spectral and polarization sensitivities. Following the intracellular recording, fluorescing dye was injected into the photoreceptor by applying negative DC current of 2–3 nA for about 5 min.
Anatomy
The ommatidium containing the dye-injected receptor was identified in vivo using an epi-fluorescence microscope (BX-60, Olympus) under green (for Alexa fluor) or blue-violet (for lucifer yellow) excitation. The ommatidial autofluorescence was also observed under ultraviolet excitation to localize the ommatidium containing the marked photoreceptor in the array of fluorescing ommatidia.
After taking pictures under ultraviolet excitation, the eyes were isolated and fixed in 4.0% paraformaldehyde in 0.1 M sodium cacodylate buffer (CB, pH 7.4) at room temperature for 30 min. After being dehydrated in an acetone series, the eyes were infiltrated with propylene oxide, and then embedded in Quetol 812 resin (Nisshin EM, Tokyo Japan). The eyes were sectioned at a thickness of 10 μm using a rotary microtome. The sections were first inspected under either green (for Alexa fluor) or blue-violet excitation (for lucifer yellow) to localize the marked photoreceptor within the ommatidium, and subsequently, regular transmission illumination was used to identify the color of the pigment clusters in the ommatidium containing the marked cell. The electrophysiological data were accepted only when a single photoreceptor was marked in this preparation.
To reveal the ultrastructure of the rhabdom, the eyes were prefixed in 2.5% glutaraldehyde and 2.0% paraformaldehyde in 0.1 M CB at 4°C overnight. The eyes were then post-fixed with 2.0% OsO4 in 0.1 M CB for 2 h at room temperature, block stained with 2% UrAc in 50% ethanol for 1 h, dehydrated in ethanol series, infiltrated, and embedded in Spurr's resin. Ultrathin sections were double-stained with uranyl acetate and lead citrate, and observed in a transmission electron microscope (H7650, Hitachi, Tokyo).
Identification and Localization of Opsin mRNAs
The eyes of 10 species of butterflies (see Section Animals) were isolated and prepared for poly-A RNA extraction using QuickPrep Micro mRNA Purification Kit (GE Healthcare, Chalfont St Giles, UK). The extracted poly-A RNA was used to obtain cDNA fragments encoding visual pigment opsins by RT-PCR using degenerate primers based on consensus sequences of lepidopteran opsins. The amplified opsin cDNA fragments were purified using Quantum Prep Freeze'N Squeeze DNA Gel Extraction Spin Columns (Bio-Rad, Hercules, CA, USA) and then cloned using TOPO TA Cloning Kit Dual Promoter (Invitrogen, Carlsbad, CA, USA). The clones were sequenced using BigDye Terminator v1.1 Cycle Sequencing Kit and ABI 3130xl Genetic Analyzer (Applied Biosystems, Foster City, CA, USA). The complete cDNA sequences were determined by 5′- and 3′-RACE methods.
Complete nucleotide sequences of the coding region were aligned with other butterfly opsin cDNA sequences using ClustalW (http://www.megasoftware.net/) with opsins of Manduca sexta (Sphingidae, Lepidoptera) as the outgroup. Transmembrane domains were predicted by the TMHMM version 2.0 program (http://www.cbs.dtu.dk/services/TMHMM/). Phylogenetic trees based on the nucleotide sequences were reconstructed using Bayesian inference methods (BI) coupled with a Markov chain Monte Carlo algorithm executed in MrBayes 3.1.2 (http://mrbayes.csit.fsu.edu/), and also by using the maximum likelihood method (ML) executed in PhyML 3.0 with the General Term- Reversible (GTR) substitution model (http://atgc.lirmm.fr/phyml/). The resulting dendrograms were virtually identical, and the ones made using the BI method are shown in Figure 2. The reliabilities of the phylogenetic trees were tested using posterior probabilities based on 500,000 replicate analyses (for BI) or 1000 bootstrap replicates (for ML).
For localizing the opsin mRNAs in the Graphium retina by in situ hybridization, isolated eyes were immersed in 4% paraformaldehyde in 0.1 M phosphate buffer (PB, pH 7.2) and then microwave-irradiated for 5 s six times (total 30 s). After further incubation in the fixative for 20 min at 4°C, the eyes were dehydrated in ethanol series followed by 100% terpineol, and infiltrated with xylene. The eyes were then embedded in Paraplast (Sigma-Aldrich, St Louis, MO) and sectioned at 8–10 μm thickness. Serial sections mounted on a slide were deparaffinized with xylene and rehydrated through an ethanol series backwards. The rehydrated sections were treated for 4 min with proteinase K at 37°C and then for 10 min with 0.25% acetic acid with 0.1% triethanolamine at room temperature.
Probes for in situ hybridization were designed to hybridize to approximately 200 bases of the mRNAs at the non-coding region downstream of the 3′ terminus. Corresponding cDNA regions were first subcloned into pCRII-TOPO vector, and digoxigenin (DIG)-labeled cRNAs were then generated using a DIG-RNA labeling kit (Boehringer Mannheim). The absence of cross hybridization was confirmed by dot blot analysis. Sections were dehydrated in ethanol and dried at 57°C for 1 h, and were then treated with hybridization solution containing 0.5 μg ml−1 cRNA probe at 65°C overnight. The probes were visualized by anti-DIG immunohistochemistry (DIG nucleic acid detection kit, Boehringer Mannheim).
Results
Ommatidial Heterogeneity
Light and electron microscopic histology reveals that G. sarpedon ommatidia each contain nine photoreceptor cells, R1–9. Four of them, R1–4, are the distal photoreceptors, contributing their microvilli to the distal tier of the rhabdom. The proximal tier of the rhabdom is composed of the microvilli of the proximal photoreceptors, R5–8. R9 is the basal photoreceptor, adding some microvilli at the base of the rhabdom (Figure 1). The entire length of an ommatidium from the corneal surface to the basement membrane is about 900 μm in the frontal region of the eye (where the retina is thickest).
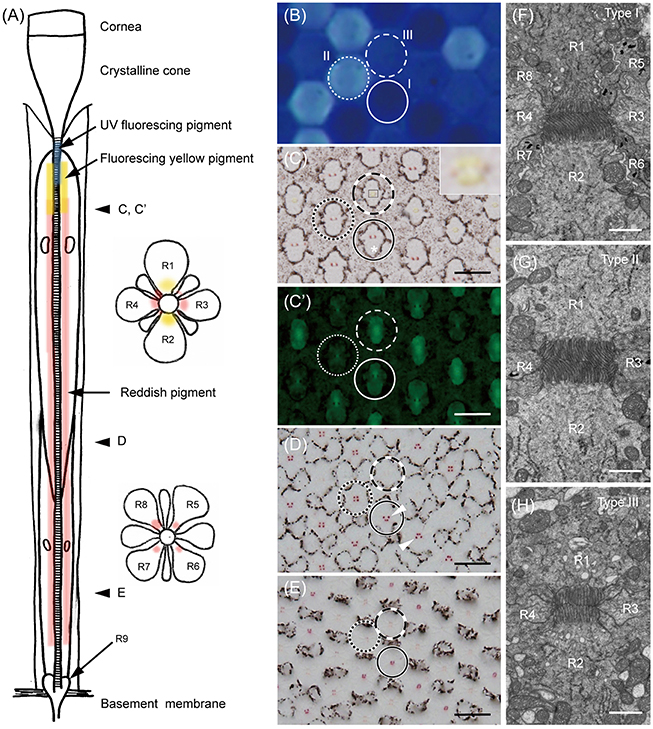
Figure 1. The ommatidia of Graphium sarpedon. (A) Schematic drawing of an ommatidium in longitudinal (left) and transverse (right) views. R1–9; photoreceptor cells. (B) Fluorescence micrograph of intact eye under UV epi-illumination showing three types of ommatidia emitting no (type I, solid circle), strong (type II, dotted circle), and weak (type III, dashed circle) fluorescence. (C) Light micrograph of a transverse section, about 220 μm from the corneal surface, of the eye region shown in B. Asterisk shows the position of the cell body of R2. Type III ommatidia have yellowish pigment around the rhabdom in R1–2 (the region marked with a rectangle is enlarged in the inset), which fluoresces under blue-violet excitation (C'), in addition to reddish perirhabdomal pigment in R3–4. (D–E) The same specimen sectioned at about 300 μm (D) and 400 μm (E) depths, showing the pigmentation in the proximal tier. Type III ommatidia have pale-red pigments around the rhabdom in R5–8, while other ommatidia have red pigments. (F–H) Electron micrographs of rhabdoms of type I (F), II (G), and III (H) ommatidia in the distal tier. Scale bar 20 μm in (C–E), 1 μm in (F–H).
We can divide ommatidia into three types (I, II, and III) according to the intensity of ultraviolet-induced autofluorescence in intact eyes (Figure 1B): the fluorescence is either undetectable (type I), strong (type II), or weak (type III). This fluorescence is only observed in ommatidia of the ventral eye region. The dorsal region has no fluorescence, unlike in P. xuthus and T. aeacus, where the cornea fluoresces dorsally (Arikawa et al., 1999a; Chen et al., 2013).
Figures 1C–E are serial transverse sections of the eye region shown in Figure 1B. Here the ommatidial heterogeneity is clear from characteristic pigmentation around the rhabdom (Figures 1C–E). Distally, the non-fluorescing (type I) and strongly fluorescing (type II) ommatidia contain red pigment in R3 and R4, while the weakly fluorescing (type III) ommatidia have pale red pigment there and have yellow pigment in R1 and R2. The distribution of yellow pigment is restricted to the distal-most region extending about 120 μm from the proximal tip of the crystalline cone (Figure 1C). The yellow pigment emits green fluorescence under blue-violet excitation (Figure 1C'). Around 200 μm proximal to Figure 1C, red pigment appears in R5–8 of type I and II ommatidia as four clusters, arranged in trapezoidal and square configurations, respectively (Figure 1D). As they continue proximally, the pigment clusters become smaller, and the pigment in type II ommatidia disappears almost completely (Figure 1E).
The ommatidial heterogeneity is also apparent in the rhabdom structure, especially in its distal tier. Electron microscopy reveals that the cross section of the rhabdom of type I ommatidia is trapezoidal because the rhabdomere of R1 is smaller than that of R2. The microvilli of R1 are straight and parallel to the dorso-ventral axis (defined as vertical), but those of R2 are curved, suggesting that the cell has reduced polarization sensitivity. Here the cell body of R2 (asterisk in Figure 1C) is larger than that of R1 (see Figure 1C, solid circle), but more proximally, the cell body as well as the rhabdomere of R1 becomes larger, and the arrangement of the pigment clusters in R5–8 becomes trapezoidal with the dorsal side longer (Figure 1D, solid circle). R1 and R2 appear in the opposite (mirror-symmetric) arrangement in other ommatidia (Figure 1D, arrowheads). The rhabdom of type II is rectangular in shape (Figure 1G) whereas, that of type III is square (Figure 1H).
We counted the number of each type of ommatidium in 45 fluorescent pictures of the ventral eye region of 39 individuals, and also in 21 transverse sections of 19 individuals. The ratio of type I, II, and III is 42.3% (4614 among 10,914 ommatidia in total), 9.7% (1060), and 48.0% (5240) (Table 1).
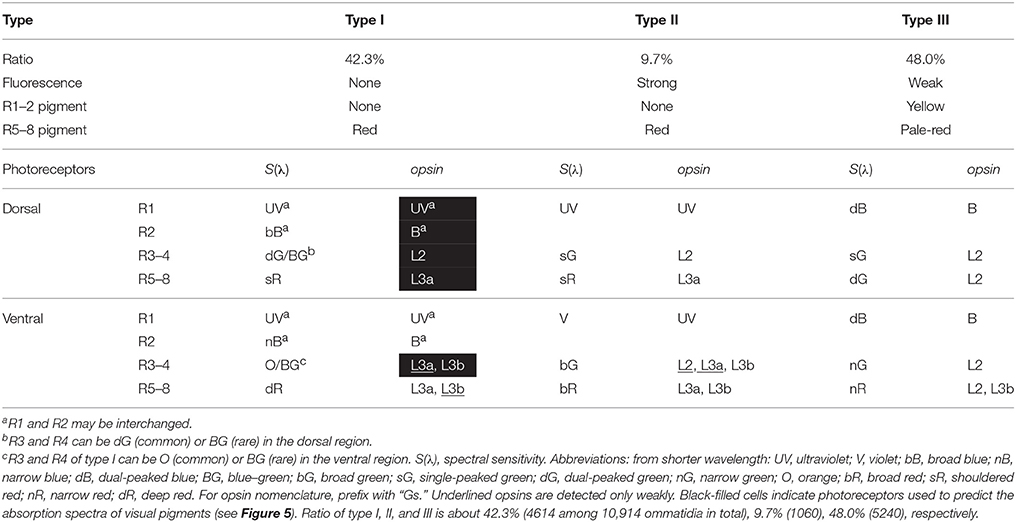
Table 1. Summary of the characteristics of three types of ommatidia in the compound eye of Graphium sarpedon.
Phylogeny of Graphium sarpedon Opsins
Figure 2 shows the phylogenetic relationships between butterfly opsins, with those of the tobacco hawkmoth, Manduca sexta (Sphingidae, Lepidoptera) as the outgroup. We identified five opsin mRNAs in the eye of G. sarpedon: one in the UV clade (Figure 2A), one in the B clade (Figure 2B) and three in the L clade (Figure 2C). We hereafter refer to the opsins in the UV and B clade as GsUV (G. sarpedon UV) and GsB, respectively. One of three L opsins clusters with Papilio L2, and two others cluster with Papilio L3: we therefore, refer to them as GsL2, GsL3a, and GsL3b.
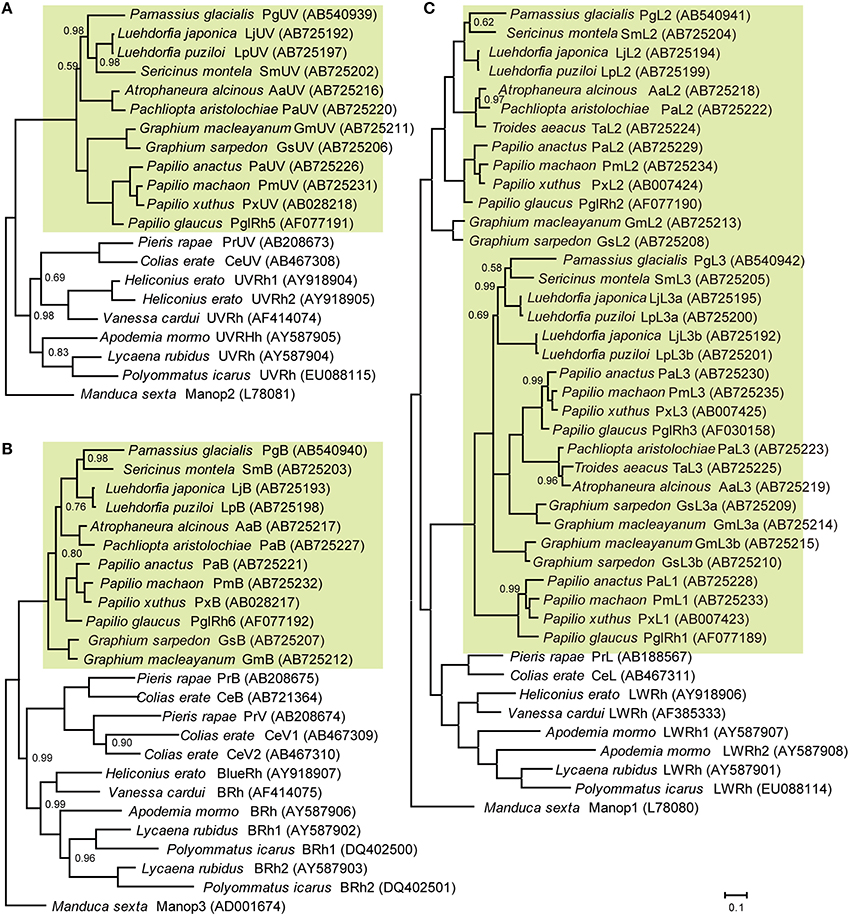
Figure 2. Phylogeny of butterfly visual pigment opsins constructed according to Bayesian inference methods (BI). Green background indicates opsins of papilionid species. Numbers at the nodes represent probabilities based on 500,000 replicate analyses; where omitted, the probability is 1.00. (A) Ultraviolet-absorbing type. (B) Blue-absorbing type. (C) Long wavelength-absorbing type. Data accession numbers are shown on the right side of opsins in parentheses.
Figure 2 includes newly identified opsins from nine other papilionid species of four tribes: tribe Leptocircini (G. macleyanum), tribe Papilionini (P. anactus, P. machaon), tribe Parnassiinae (L. japonica, L. puziloi, S. montela), and tribe Troidini (A. alcinous, P. aristolochiae, T. aeacus). L opsins of Papilionidae form three clusters, L1, L2, and L3 (Figure 2C). L1 opsins are found only in the genus Papilio, while L2 and L3 are found in other tribes as well. We found that L3 opsins are further duplicated in the genera Graphium and Luehdorfia.
Opsin mRNAs in Photoreceptors
We localized the opsin mRNAs in the retina of G. sarpedon by in situ hybridization (Figure 3).
Figure 3. In situ hybridization of five opsins of Graphium sarpedon (A–E, longitudinal sections; F–U, transverse sections). The sections were labeled with probes specific to the GsUV (A,F,N), GsB (B,G,O), GsL2 (C,H,K,P,S), GsL3a (D,I,L,Q,T), or GsL3b (E,J,M,R,U) mRNAs. Two sets of serial sections through the dorsal (F–M) and ventral regions (N–U) show the existence of three types of ommatidia in both regions. Ommatidial types are indicated by solid (type I), dotted (type II), and dashed circles (type III). R, retina; L, lamina; M, medulla; BM, basement membrane.
The micrographs in Figures 3A–E show serial dorso-ventral sections of one eye labeled with different probes. The labeling indicates that GsUV and GsB mRNA are expressed across the entire retina but only in the distal tier (Figures 3A,B). The labeling with the probes for L opsin mRNAs exhibits clear dorso-ventral regionalization (Figures 3C–E).
The distribution pattern of GsUV and GsB mRNA in transverse sections confirms the existence of three ommatidial types. Figures 3F,G are consecutive sections in the distal tier of the dorsal eye region, labeled with the GsUV and GsB probes, respectively. These opsin mRNAs are expressed in two distal photoreceptors, R1 and R2, in three combinations: one GsUV-positive and another GsB-positive (type I, solid circle), both positive for GsUV (type II, dashed circle), or both GsB-positive (type III, dotted circle). We do not observe coexpression of these mRNAs. The same pattern is seen in the ventral region (Figures 3N, O).
The L opsin mRNAs exist in the other two distal photoreceptors, R3 and R4, and in the four proximal photoreceptors, R5–8. The labeling of R9 basal photoreceptors could not be reliably established because of their small size. The expression pattern of L opsin mRNAs is rather simple in the dorsal region (Figures 3H–M), following the “one photoreceptor–one opsin” principle. The GsL2 probe labels R3 and R4 in all ommatidia (Figure 3H) and R5–8 in type III ommatidia (Figure 3K). The GsL3a probe labels R5–8 of type I and II ommatidia in the dorsal region (Figure 3L). The faintly labeled structures in Figure 3I are the distal extensions of R5–8 photoreceptors (see Figure 1F). Type I and II ommatidia express three L opsins in the identical pattern, so they cannot be discriminated in the in situ hybridization preparations (Figure 3H–M).
The labeling pattern is complex in the ventral region, as most R3–8 photoreceptors coexpress two opsin mRNAs. For example, R3 and R4 of ventral type I ommatidia express GsL3a weakly (Figure 3Q) and GsL3b strongly (Figure 3R). R5–8 of type I express GsL3a strongly (Figure 3T) and GsL3b weakly (Figure 3U). Table 1 summarizes the results.
Spectral Sensitivity of Photoreceptors
We measured the spectral sensitivities of 355 photoreceptors in the eye of G. sarpedon and successfully localized 110 of these in the retina.
Figure 4 shows three examples of labeled photoreceptors. Figure 4A is a broad blue (bB) receptor peaking at 460 nm (row i, see also Figure 5). The polarization sensitivity (row ii), peaking at 0°, indicates the cell has microvilli aligned parallel to the dorso-ventral axis (Figure 1). Rows iii and iv show in vivo fluorescence pictures of the eye under green and UV excitations, respectively. The red-fluorescing ommatidium (row iii) contains the Alexa fluor-injected bB receptor and this ommatidium is in the dorsal region where no fluorescence is detected under UV (row iv). Rows v and vi show sections containing the labeled photoreceptor under green excitation (row v) and normal transmission illumination (row vi). The set of pictures allows us to unambiguously conclude that the recorded bB receptor is R1 of a dorsal type I ommatidium. Similarly the broad red (bR) receptor in Figure 4B is R5 of a strongly-fluorescing type II ommatidium in the ventral region. The narrow green (nG) receptor (Figure 4C) is R4 of a weakly-fluorescing type III ommatidium in the ventral region. Polarization sensitivities (row ii) reflect the orientation of microvilli and therefore, provide another line of evidence to identify photoreceptors within the ommatidium (Bandai et al., 1992; Lin, 1993). We provide similar examples for all other receptor classes in the Supplementary Figures.
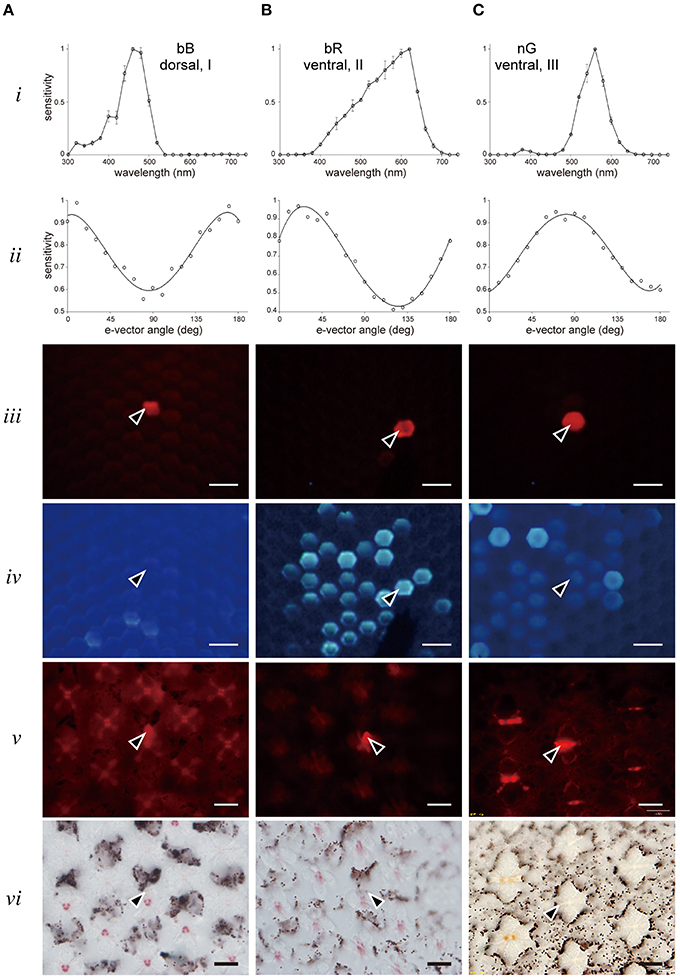
Figure 4. Examples of recorded and localized photoreceptors. (A) A bB receptor in a dorsal type I ommatidium. (B) A bR receptor in a ventral type II ommatidium. (C) A nG receptor in a ventral type III ommatidium. Top two rows show the spectral sensitivity (row i) and polarization sensitivity (row ii). Rows iii and iv show the correlation of Alexa fluor-injected receptor observed under green excitation (row iii) with fluorescence ommatidia observed under UV excitation (row iv). Rows v and vi show the same section of stained photoreceptor (arrowhead) in the ommatidial array observed under green excitation (row v) and normal transmission illumination (row vi). Scale bar 20 μm.
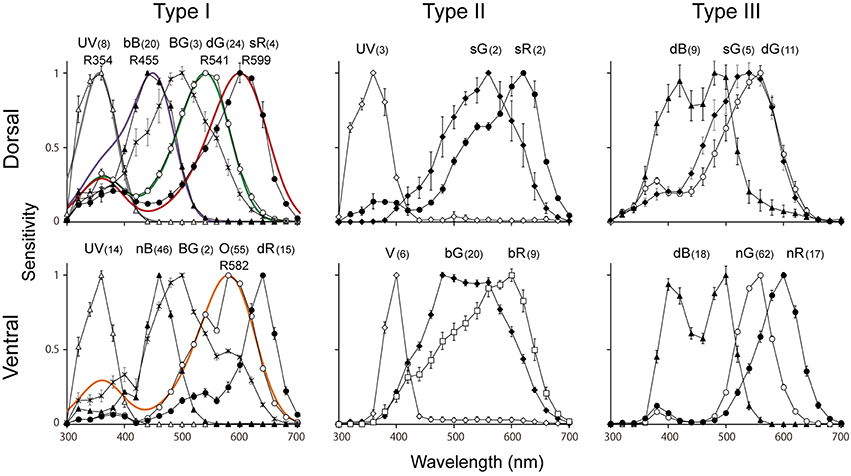
Figure 5. Average spectral sensitivities of photoreceptors (mean ± standard errors) in each type of ommatidium in the male Graphium sarpedon retina. Note that the UV, dB, BG, dG, sG, sR appear more than once in graphs. Numbers appearing with photoreceptor types indicate number of recorded cells that were successfully stained. Colored curves in type I graphs indicate the predicted absorption spectra of visual pigments peaking at 354 nm (R354, GsUV), R455 (GsB), R541 (GsL2), R599 (GsL3a), and R582 (GsL3b).
Figure 5 shows the spectral sensitivities grouped according to the localization results. We categorize the photoreceptors into six classes; ultraviolet (UV), violet (V), blue (B), blue–green (BG), green (G), and red (R). The B class can be further divided into three subclasses: broad blue (bB), narrow blue (nB) and dual-peaked blue (dB) receptors. The G class contains four subclasses: single-peaked green (sG), dual-peaked green (dG), narrow green (nG), and broad green (bG) receptors. The R class contains five subclasses: orange (O), shouldered red (sR), narrow red (nR), broad red (bR), and deep red (dR) receptors. To our surprise, we have identified 15 distinct spectral sensitivities in total, which is the largest number among insects studied so far. The bB, dG, sG, and sR receptors are found exclusively in the dorsal region, whereas UV, BG and dB are found both in the dorsal and ventral regions. The other eight sensitivities, V, nB, bG, nG, O, bR, nR, and dR, are found only in the ventral region.
Visual Pigment Absorption Spectra and Photoreceptor Spectral Sensitivities
By correlating the photoreceptor spectral sensitivities with the in situ hybridization results, we can predict the absorption spectra of the visual pigments. Type I ommatidia of the dorsal region are particularly useful in this regard, because of the simple pattern of opsin expression and the absence of UV-induced fluorescence. We can infer the absorbance spectra of GsUV, GsB, GsL2, and GsL3a from the spectral sensitivities of the UV, bB, dG, and sR receptors, respectively, because these receptors exclusively express their respective opsins. Unfortunately, there are no photoreceptors that exclusively express GsL3b. However, the O receptor is the most appropriate choice to estimate this opsin's absorbance, as it only weakly co-expresses GsL3a, and is located in the distal tier where the self-screening effect is minimal (Table 1).
Smooth colored lines in Figure 5 are the predicted absorption spectra of the visual pigments determined by least-squares fitting to a template (Stavenga et al., 1993). We thus, conclude that GsUV is a visual pigment absorbing maximally at 354 nm (R354). Similarly, GsB, GsL2, GsL3b, and GsL3a are R455, R541, R582, and R599, respectively. A pioneering microspectrophotometry suggested that nine species of butterflies, including P. rapae, have visual pigments absorbing maximally at around 610 nm (Bernard, 1979). However, this may have to be revisited because recent studies have revealed that the long wavelength-absorbing visual pigment of P. rapae is R563 (Wakakuwa et al., 2004). To our knowledge, 599 nm is the longest absorption peak wavelength among insect visual pigments so far identified.
Discussion
Butterflies typically have a rich variety of spectral receptors in their compound eyes (Briscoe, 2008). We found 15 distinct photoreceptor types in the eye of G. sarpedon, which is a record among all insects studied so far. Stomatopod crustaceans, which have up to 16 spectral classes of receptors in their eyes (Cronin, 2006), have been considered to be exceptional, but our finding of an almost equal level of spectral richness in a butterfly challenges this view.
Origin of Spectral Sensitivities
As shown in Figure 5, the spectral sensitivities of UV, bB, dG, O, and sR receptors fit reasonably well to the visual pigment absorption spectra of GsUV, GsB, GsL2, GsL3b, and GsL3a, respectively. The other spectral sensitivities can be explained by the modification of the aforementioned absorption spectra by a number of optical effects known to occur in butterfly photoreceptors. These include filtering by fluorescent pigments (Arikawa et al., 1999a), perirhabdomeral pigments (Arikawa et al., 1999b), lateral filtering between rhabdomeres of different spectral receptors sharing a single rhabdom (Snyder et al., 1973), and optical waveguide effects (Stavenga and Arikawa, 2011).
For example, the narrow-band V receptor peaking at 400 nm in the strongly-fluorescing ventral type II ommatidia arises from the combination of R354 (GsUV) and the UV-absorbing fluorescent pigment (Arikawa et al., 1999a). Even in the weakly-fluorescing ventral type III ommatidia the UV sensitivity of all photoreceptors is reduced, indicating the influence of the UV-fluorescent pigment. The dR receptors in type I ommatidia peak at 640 nm despite mainly expressing R599 (GsL3a). This narrowing and shifting of the sensitivity curve toward longer wavelength can be attributed to the filtering effect of red perirhabdomal pigments, which is particularly prominent in pierid species (Stavenga and Arikawa, 2011). The dB receptors in the yellow-pigmented type III ommatidia express R455 (GsB), but exhibit a trough around 450 nm. The yellow pigment emits fluorescence under blue-violet excitation (Figure 1C'), which indicates that its absorption wavelength is around 450 nm. Thus, the trough is probably caused by the absorption effect of this pigment.
The photoreceptors co-expressing two visual pigments are more difficult to account for. We extensively manipulated the relative proportions of R541 (GsL2), R582 (GsL3b), and R599 (GsL3a) in our attempt to reproduce the spectral sensitivities of the bG and bR receptors in ventral type II ommatidia, and also tried incorporating various pigment filtering effects. However, we were unable to obtain satisfactory fits to our data.
The BG receptors, which peak around 500 nm and have a long tail extending toward the long wavelength region, also cannot be explained by the identified visual pigments. However, their spectral sensitivity can be reproduced if we assume the existence of another visual pigment peaking at 480 nm, R480. Interestingly, the spectral sensitivities of both bG and bR receptors could also be well reproduced by incorporating the putative R480 together with the other L opsins. The existence of R480 is yet to be confirmed by molecular biology, however.
The enigmatic BG photoreceptor class is extremely rare; we only found a few clearly labeled examples, both of which were R3/4 of type I ommatidia. This is puzzling, because R3/4 in type I ommatidia are usually dG (dorsal) or O (ventral) receptors. The existence of BG receptors raises the possibility that “type I” ommatidia actually comprise two subtly distinct subtypes that appear around the transitional area between the dorsal and ventral regions (see Table 1).
Evolution of Opsins and Dorso-Ventral Specialization
We identified opsins from ten papilionid species including G. sarpedon (Figure 2). L opsins are highly diverse in the lineage of Papilionidae. They are divided into three clades: L1, L2, and L3. The branching pattern suggests that in the papilionid lineage the ancestral L opsin duplicated, with one copy becoming the present L2 and the other duplicating once again to become L1 and L3. L1 opsins are restricted to the tribe Papilionini, and at least in P. xuthus and P. glaucus there are no photoreceptors that exclusively express their L1 orthologs (Kitamoto et al., 1998; Briscoe, 2008); rather, L1 is always coexpressed with L2. On the other hand, L2 and L3 exist in all tribes. Graphium and Luehdorfia species have undergone a further duplication of L3. These multiple L opsins probably serve to enrich the spectral sensitivities of long wavelength receptors in Papilionidae, because L2 (and L1) opsins are supposedly of the protein part of green-absorbing visual pigment, and L3 opsins are of red-absorbing visual pigment (Arikawa et al., 1999b; Figure 5).
In situ hybridization of L1 opsin mRNAs reveals clear dorso-ventral specialization (Table 1, Figure 3). The expression pattern of opsin mRNAs in the dorsal region is simple, basically following the “one receptor–one visual pigment” principle, while the ventral region is more complex. A wider range of spectral sensitivities—especially in the longer wavelengths—is found in the ventral region due to the co-expression of multiple visual pigments and various spectral filtering effects (Figure 5). Increased spectral richness in the ventral region is a common feature of not only butterflies (Stavenga et al., 2001) but also dragonflies (Futahashi et al., 2015). This is probably an adaptation for detecting colored objects against a green foliage background. G. sarpedon fly rapidly in woodland, looking downwards to locate mates, flowers to feed on, and puddles to take salt (Beck et al., 1999). They are strongly attracted to individuals of the same and/or closely related species that are sitting on the ground, with the result that they often form large flocks on wetland.
Color Vision and Number of Spectral Receptors
Do G. sarpedon use all 15 spectral receptors for seeing colors, i.e., is their vision pentadecachromatic? This has to be checked by behavioral experiments, but it is rather unlikely. We previously measured the wavelength discrimination ability of foraging P. xuthus and found that they can discriminate lights whose wavelength difference is as small as 1–2 nm in three distinct wavelength regions. Their eyes are furnished with at least six classes of spectral receptors, and we predicted which receptors are involved in wavelength discrimination using the receptor-noise limited color opponency model (Vorobyev and Osorio, 1998). We concluded that color vision in P. xuthus is tetrachromatic and based on the UV, B, G, and R receptors (Koshitaka et al., 2008). The excluded receptors, V and BB, are probably used for some other visual functions, such as for detecting particular signals or low intensity light.
Vertebrates and insects are phylogenetically far apart, but their color vision systems have been considered to be somewhat similar based on the “conventional” spectral opponency principle (Backhaus et al., 1998). We humans use an RGB trichromatic system to discriminate colors in the wavelength range from 400 to 700 nm (Barlow, 1982; Maloney, 1986; Cronin et al., 2014). The visual system of P. xuthus has added an UV channel, for expanding the visible light range into the ultraviolet region down to 300 nm. The minimum discriminable wavelength difference is about 1 nm both in humans and P. xuthus, which may be due to the fact that both systems share the conventional principle.
On the other hand, mantis shrimps that have 12–16 distinct spectral receptor classes have therefore, been assumed to discriminate colors better than any other animals. But in fact, their wavelength discrimination ability is surprisingly poor: they can barely distinguish lights whose wavelengths differ by more than 15 nm (Thoen et al., 2014). In mantis shrimps, nearly all the spectral receptor classes are confined to a region of the eye called the mid-band, containing only six rows of ommatidia. Mantis shrimps see colors by scanning the environment with these “one dimensional color scanners.” This scanning principle is strikingly different from what we see in “conventional” color vision systems such as those of humans and butterflies (Marshall and Arikawa, 2014).
The arrangement of spectral receptors in G. sarpedon is similar to that of P. xuthus: three types of spectrally heterogeneous ommatidia are randomly distributed, at least locally, in the hexagonal array. Therefore, the color vision system of G. sarpedon is most likely a conventional one, meaning that four spectral channels should be sufficient to perceive colors over the range from 300 to 700 nm.
This raises an obvious question: if only four receptor classes are needed for color vision, then why did the other 11 evolve? The answer is unknown, but it may be the case that several of the receptor classes are tuned to detect specific stimuli of particularly high ecological importance. One hypothetical example is the ability of detecting colors of quickly moving targets. Flying males often chase other flying objects including conspecifics. A unique feature of G. sarpedon eye is the spectral variability of R3 and R4 photoreceptors in the distal tier (BG, bG, dG, nG, sG, and O, see Table 1), which are all green sensitive and fastest in P. xuthus (Kawasaki et al., 2015). The fast R3–4 G receptors of P. xuthus contribute to the chromatic motion detection system with the spectrally variable R5–8 proximal photoreceptors (Stewart et al., 2015). The spectral variety of R3–4 receptors in G. sarpedon would enhance the chromatic property of motion vision, which may be crucial for discriminating fast-flying conspecifics by the complex wing colors (Stavenga et al., 2010).
Author Contributions
P-JC, E-CY, and KA designed the research. P-JC performed electrophysiology and light microscopic histology. HA and AM respectively performed molecular biology and electron microscopy. P-JC and KA wrote the manuscript, and all authors read, commented, and approved the final version of the manuscript.
Conflict of Interest Statement
The authors declare that the research was conducted in the absence of any commercial or financial relationships that could be construed as a potential conflict of interest.
Acknowledgments
We thank Dr. Finlay Stewart for extensive discussion and editing the English. We also thank Prof. Yoshiomi Kato for providing Sericinus montela and Mr. Isao Nihira for providing L. japonica and L. puziloi. This work was supported by the fellowship from the Interchange Association Japan to P-JC, the JSPS KAKENHI for Scientific Research A (#26251036) to KA, the NARO grant for SIP “Technologies for creating next-generation agriculture, forestry and fisheries” to KA, and the Aim of the Top University Plan of NTU (10R2002506) to P-JC and E-CY.
Supplementary Material
The Supplementary Material for this article can be found online at: http://journal.frontiersin.org/article/10.3389/fevo.2016.00018
Supplementary Data Sheets. Alignment of deduced amino acid sequences of visual pigments from 10 papilionid species identified in this study. Accession numbers are shown in Figure 2.
Supplementary Figures. Examples of localized photoreceptors, arranged according to eye regions (dorsal, A–K; ventral, L–V) and the position in the ommatidia. (A–D) R1–2 of dorsal ommatidia (E–H), R3–4 of dorsal ommatidia, (I–K) R5–8 of dorsal ommatidia, (L–O) R1–2 of ventral ommatidia, (P–S) R3–4 of ventral ommatidia, (T–V) R5–8 of ventral ommatidia. For details, see legends of Figures 4, 5. Abbreviations of spectral sensitivities: UV, ultraviolet; V, violet; bB, broad blue; nB, narrow blue; dB, dual-peaked blue; BG, blue–green; sG, single-peaked green; dG, dual-peaked green; nG, narrow green; bG, broad green; O, orange; sR, shouldered red; nR, narrow red; bR, broad red; dR, deep red.
References
Arikawa, K. (2003). Spectral organization of the eye of a butterfly, Papilio. J. Comp. Physiol. A 189, 791–800. doi: 10.1007/s00359-003-0454-7
Arikawa, K., Mizuno, S., Scholten, D. G., Kinoshita, M., Seki, T., Kitamoto, J., et al. (1999a). An ultraviolet absorbing pigment causes a narrow-band violet receptor and a single-peaked green receptor in the eye of the butterfly Papilio. Vision Res. 39, 1–8. doi: 10.1016/S0042-6989(98)00070-4
Arikawa, K., Scholten, D. G. W., Kinoshita, M., and Stavenga, D. G. (1999b). Tuning of photoreceptor spectral sensitivities by red and yellow pigments in the butterfly Papilio xuthus. Zool. Sci. 16, 17–24. doi: 10.2108/zsj.16.17
Arikawa, K., Wakakuwa, M., Qiu, X., Kurasawa, M., and Stavenga, D. G. (2005). Sexual dimorphism of short-wavelength photoreceptors in the Small White butterfly, Pieris rapae crucivora. J. Neurosci. 25, 5935–5942. doi: 10.1523/JNEUROSCI.1364-05.2005
Backhaus, W. G. K., Kliegl, R., and Werner, J. S. (1998). Color Vision: Perspectives from Different Disciplines. Berlin; New York, NY: Walter de Gruyter.
Bandai, K., Arikawa, K., and Eguchi, E. (1992). Localization of spectral receptors in the ommatidium of butterfly compound eye determined by polarization sensitivity. J. Comp. Physiol. A 171, 289–297. doi: 10.1007/BF00223959
Barlow, H. B. (1982). What causes trichromacy? A theoretical analysis using comb-filtered spectra. Vision Res. 635–643. doi: 10.1016/0042-6989(82)90099-2
Beck, J., MuÈhlenberg, E., and Fiedler, K. (1999). Mud-puddling behavior in tropical butterflies: in search of proteins or minerals? Oecologia 119, 140–148. doi: 10.1007/s004420050770
Bernard, G. D. (1979). Red-absorbing visual pigment of butterflies. Science 203, 1125–1127. doi: 10.1126/science.203.4385.1125
Blackiston, D., Briscoe, A. D., and Weiss, M. R. (2011). Color vision and learning in the monarch butterfly, Danaus plexippus (Nymphalidae). J. Exp. Biol. 214, 509–520. doi: 10.1242/jeb.048728
Briscoe, A. D. (2008). Reconstructing the ancestral butterfly eye: focus on the opsins. J. Exp. Biol. 211, 1805–1813. doi: 10.1242/jeb.013045
Briscoe, A. D., Bybee, S. M., Bernard, G. D., Yuan, F., Sison-Mangus, M. P., Reed, R. D., et al. (2010). Positive selection of a duplicated UV-sensitive visual pigment coincides with wing pigment evolution in Heliconius butterflies. Proc. Natl. Acad. Sci. U.S.A. 107, 3628–3633. doi: 10.1073/pnas.0910085107
Chen, P.-J., Arikawa, K., and Yang, E.-C. (2013). Diversity of the photoreceptors and spectral opponency in the compound eye of the Golden Birdwing, Troides aeacus formosanus. PLoS ONE 8:e62240. doi: 10.1371/journal.pone.0062240
Cronin, T. W., Johnsen, S., Marshall, N. J., and Warrant, E. J. (2014). Visual Ecology. Princeton, NJ; Oxford: Princeton University Press.
Eguchi, E., Watanabe, K., Hariyama, T., and Yamamoto, K. (1982). A comparison of electrophysiologically determined spectral responses in 35 species of lepidoptera. J. Insect Physiol. 28, 675–682. doi: 10.1016/0022-1910(82)90145-7
Futahashi, R., Kawahara-Miki, R., Kinoshita, M., Yoshitake, K., Yajima, S., Arikawa, K., et al. (2015). Extraordinary diversity of visual opsin genes in dragonflies. Proc. Natl. Acad. Sci. USA 112, E1247–W1256. doi: 10.1073/pnas.1424670112
Kawasaki, M., Kinoshita, M., Weckstrom, M., and Arikawa, K. (2015). Difference in dynamic properties of photoreceptors in a butterfly, Papilio xuthus: possible segregation of motion and color processing. J. Comp. Physiol. A Neuroethol. Sens. Neural. Behav. Physiol. 201, 1115–1123. doi: 10.1007/s00359-015-1039-y
Kelber, A., Balkenius, A., and Warrant, E. J. (2002). Scotopic colour vision in nocturnal hawkmoths. Nature 419, 922–925. doi: 10.1038/nature01065
Kelber, A., and Pfaff, M. (1999). True colour vision in the orchard butterfly, Papilio aegeus. Naturwissenschaften 86, 221–224. doi: 10.1007/s001140050601
Kinoshita, M., Shimada, N., and Arikawa, K. (1999). Colour vision of the foraging swallowtail butterfly Papilio xuthus. J. Exp. Biol. 202, 95–102.
Kitamoto, J., Sakamoto, K., Ozaki, K., Mishina, Y., and Arikawa, K. (1998). Two visual pigments in a single photoreceptor cell: identification and histological localization of three mRNAs encoding visual pigment opsins in the retina of the butterfly Papilio xuthus. J. Exp. Biol. 201, 1255–1261.
Koshitaka, H., Kinoshita, M., Vorobyev, M., and Arikawa, K. (2008). Tetrachromacy in a butterfly that has eight varieties of spectral receptors. Proc. R. Soc. 275, 947–954. doi: 10.1098/rspb.2007.1614
Lin, J. T. (1993). Identification of photoreceptor locations in the compound eye of Coccinella septempunctata Linnaeus (Coleoptera, Coccinellidae). J. Insect Physiol. 39, 555–562. doi: 10.1016/0022-1910(93)90037-R
Maloney, L. T. (1986). Evaluation of linear models of surface spectral reflectance with small numbers of parameters. J. Opt. Soc. Am. A 3, 1673–1683. doi: 10.1364/JOSAA.3.001673
Marshall, J., and Arikawa, K. (2014). Unconventional colour vision. Curr. Biol. 24, R1150–R1154. doi: 10.1016/j.cub.2014.10.025
Menzel, R., and Backhaus, W. (1989). “Color vision in honey bees: phenomena and physiological mechanisms,” in Facets of Vision, eds D. G. Stavenga and R. C. Hardie (Berlin; Heidelberg; New York, NY; London; Paris; Tokyo: Springer-Verlag), 281–297.
Peitsch, D., Fietz, A., Hertel, H., Desouza, J., Ventura, D. F., and Menzel, R. (1992). The spectral input systems of hymenopteran insects and their receptor-based colour vision. J. Comp. Physiol. A 170, 23–40. doi: 10.1007/BF00190398
Skorupski, P., and Chittka, L. (2010). Photoreceptor spectral sensitivity in the bumblebee, Bombus impatiens (Hymenoptera: Apidae). PLoS ONE 5:e12049. doi: 10.1371/journal.pone.0012049
Snyder, A. W., Menzel, R., and Laughlin, S. B. (1973). Structure and function of the fused rhabdom. J. Comp. Physiol. A 87, 99–135. doi: 10.1007/BF01352157
Stavenga, D. G., and Arikawa, K. (2011). Photoreceptor spectral sensitivities of the Small White butterfly Pieris rapae crucivora interpreted with optical modeling. J. Comp. Physiol. A 197, 373–385. doi: 10.1007/s00359-010-0622-5
Stavenga, D. G., Giraldo, M. A., and Leertouwer, H. L. (2010). Butterfly wing colors: glass scales of Graphium sarpedon cause polarized iridescence and enhance blue/green pigment coloration of the wing membrane. J. Exp. Biol. 213, 1731–1739. doi: 10.1242/jeb.041434
Stavenga, D. G., Kinoshita, M., Yang, E. C., and Arikawa, K. (2001). Retinal regionalization and heterogeneity of butterfly eyes. Naturwissenschaften 88, 477–481. doi: 10.1007/s001140100268
Stavenga, D. G., Smits, R. P., and Hoenders, B. J. (1993). Simple exponential functions describing the absorbance bands of visual pigment spectra. Vision Res. 33, 1011–1017. doi: 10.1016/0042-6989(93)90237-Q
Stewart, F. J., Kinoshita, M., and Arikawa, K. (2015). The butterfly Papilio xuthus detects visual motion using chromatic contrast. Biol. Lett. 11, 20150687. doi: 10.1098/rsbl.2015.0687
Thoen, H. H., How, M. J., Chiou, T. H., and Marshall, J. (2014). A different form of color vision in mantis shrimp. Science 343, 411–413. doi: 10.1126/science.1245824
Vorobyev, M., and Osorio, D. (1998). Receptor noise as a determinant of colour thresholds. Proc. R. Soc. 265, 351–358. doi: 10.1098/rspb.1998.0302
Keywords: insect, color vision, compound eye, photoreceptor, spectral sensitivity, visual pigment, opsin, Papilionidae
Citation: Chen P-J, Awata H, Matsushita A, Yang E-C and Arikawa K (2016) Extreme Spectral Richness in the Eye of the Common Bluebottle Butterfly, Graphium sarpedon. Front. Ecol. Evol. 4:18. doi: 10.3389/fevo.2016.00018
Received: 05 December 2015; Accepted: 18 February 2016;
Published: 08 March 2016.
Edited by:
Wayne Iwan Lee Davies, University of Western Australia, AustraliaReviewed by:
Yuri Ogawa, The University of Western Australia, AustraliaDoekele G. Stavenga, University of Groningen, Netherlands
Seth M. Bybee, Brigham Young University, USA
Copyright © 2016 Chen, Awata, Matsushita, Yang and Arikawa. This is an open-access article distributed under the terms of the Creative Commons Attribution License (CC BY). The use, distribution or reproduction in other forums is permitted, provided the original author(s) or licensor are credited and that the original publication in this journal is cited, in accordance with accepted academic practice. No use, distribution or reproduction is permitted which does not comply with these terms.
*Correspondence: Kentaro Arikawa, YXJpa2F3YUBzb2tlbi5hYy5qcA==