 Harmen P. Hendriksma
 Amy L. Toth
 Sharoni Shafir
- 1B. Triwaks Bee Research Center, Department of Entomology, The Robert H. Smith Faculty of Agriculture, Food and Environment, The Hebrew University of Jerusalem, Rehovot, Israel
- 2Department of Ecology, Evolution and Organismal Biology, Iowa State University, Ames, IA, United States
- 3Department of Entomology, Iowa State University, Ames, IA, United States
Foraging decisions of social animals occur in the context of social groups, and thus may be subject to considerations of not only an individual's nutritional state and nutrient input, but those of the social group in which they live. In eusocial insects, which live in colonies containing workers that forage for food that is mostly consumed by others, foraging decisions that reflect colony needs may also be considered at both the colony and individual level. If colony energy balance is perturbed, is the counteracting response occurring on the group level (a change in division of labor) or on the individual level (a change in individual foraging choices)? To address this, colony and individual level foraging behaviors were observed in two species of eusocial bees: the highly social honey bee Apis mellifera and the primitively eusocial bumble bee Bombus terrestris. After manipulations of protein (P) and carbohydrate (C) stores in colonies of both species, there were changes in multiple different behavioral responses including colony level (number of foragers, allocation to nectar and pollen foraging, nutrient mass foraged) and individual level (P and C concentration preference and loading during foraging). These results suggest both honey bee and bumble bee colonies balance nutrient needs through a combination of both colony level shifts in foraging allocation, as well as slight modulation of individual nutrient preferences. This study also uncovered colony level differences between the two bee species; honey bees balanced P intake while bumble bees balanced C intake. These patterns may reflect differences in life history traits such as perenniality and hoarding, traits that are developed in more highly social species. Overall, this study highlights the importance of considering both group and individual level behavioral responses in foraging decisions in social animals.
Introduction
What to eat? Where to forage, and for how long? Decision making in the context of food-searching behavior can be a complex process, involving multiple sensory modalities, specific forms of learning and memory, and integration of multiple different sources of external environmental and internal physiological information. Optimal foraging theory (OFT) makes predictions about the types of decisions individual animals make in order to minimize energy expenditure and maximize their own nutrient intake, some of which have been supported by studies in a variety of animal taxa (Pyke, 1984; Sih and Christensen, 2001). However, OFT has been heavily criticized for ignoring life history traits, because foraging may occur in contexts outside of satisfying the immediate needs of individuals, e.g., parental care and food hoarding (Pierce and Ollason, 1987).
Foraging decisions take on an even greater level of complexity in considering social animals, especially highly social species in which inclusive fitness and group benefits are important considerations (Galef and Giraldeau, 2001; Kay, 2002). Eusocial insects, with a reproductive division of labor that includes a non-reproducing worker caste such as ants and honey bees, represent an extreme case in which foragers are often highly specialized on food-collecting behavior (Wilson, 1971). However, this food collection is often divorced from their own individual nutritional needs, and collected food is often not directly consumed, but instead shared to serve the nutritional needs of the colony. An extreme example is the Myrmecocystus honey ant, in which a specialized caste of individuals serves as living food receptacles (Burgett and Young, 1974), storing huge amounts of sweet plant secretions in their crops, but not consuming or digesting the vast majority of this food to fuel their own physiological needs.
Eusocial insects evolved from solitary species in which individuals needed to respond to their own internal physiological cues in order to feed themselves to fuel personal reproductive opportunities (Ament et al., 2010). During the evolution of sociality, there must have also been a transition from foraging decision making based on individual needs to decisions based on needs of the social group (Behmer, 2009b; Boomsma and Gawne, 2018). Across the diversity of extant insect species found today, there are highly eusocial species, in which colonies are very large and individual workers rarely reproduce, as well as primitively eusocial species, in which colonies are smaller and individual workers retain some reproductive capacity (Wilson, 1971). Thus, it may be possible to uncover differences in how social insects with different forms of sociality balance individual vs. colony level foraging decisions. If colony energy balance is perturbed, is the counteracting response occurring on the group level (a change in division of labor) or on the individual level (a change in individual foraging choices)? And do these responses differ in species with different levels of sociality? We aimed to address this knowledge gap by studying behavioral responses of two bee species with different forms of social organization.
Within the well-studied bee subfamily Apinae, Apis mellifera honey bees are a classic example of a highly eusocial species with task-specialized workers (Johnson, 2010), while Bombus terrestris bumble bees have smaller colonies with more behaviorally flexible workers (Crall et al., 2018). A. mellifera live in perennial, food-hoarding colonies consisting of tens of thousands of female workers, most of which will never lay an egg during the course of a normal colony cycle (Winston, 1991). Honey bee foragers are known to be highly specialized on collecting pollen, nectar, or non-food substances such as water or propolis (Page and Fondrk, 1995). On the contrary, B. terrestris colonies are annual, with small pollen and nectar stores, and as colonies decline in autumn, workers engage in dominance contests and several will lay unfertilized eggs (Goulson, 2010). Although larger workers tend to forage, while smaller workers tend to care for brood, individual foragers are not highly specialized as in honey bees (Goulson et al., 2002; Crall et al., 2018). Furthermore, bumble bees have only a relatively simple foraging communication system compared to the honey bees' sophisticated dance language (Dornhaus and Chittka, 2001). Colony-level decision making, such as colony allocation of foragers for pollen or for nectar, have also been extensively studied in both honey bees and bumble bees (Cartar, 1992; Seeley, 1995; Hagbery and Nieh, 2012; Leonhardt and Blüthgen, 2012; Konzmann and Lunau, 2014; Vaudo et al., 2014; Ruedenauer et al., 2015). Individual decision making during foraging trips has also been extensively studied in honey bees and bumble bees, providing important tests of OFT predictions (Heinrich, 1983; Hodges, 1985; Wells and Wells, 1986; Lihoreau et al., 2012; Katz and Naug, 2015). However, to our knowledge, few studies have considered both individual and colony level responses concurrently (Schulz et al., 1998).
As a guiding framework for this study, we utilized the geometric framework for nutritional balancing of protein (P) and carbohydrate (C) needs, as developed from studies in solitary insects (Lee et al., 2002; Behmer, 2009a; Raubenheimer et al., 2009). The geometric framework predicts that food choices for key macronutrients such as P and C will scale geometrically along an optimal ratio that supports individual reproductive fitness. The geometric framework can also be extended to whole colonies (Behmer, 2009b; Dussutour and Simpson, 2009; Lihoreau et al., 2014). This study extends findings of P to C balancing of isolated caged cohorts of honey bees (Altaye et al., 2010; Pirk et al., 2010; Paoli et al., 2014a,b) and bumble bees (Stabler et al., 2015) to the whole colony level.
We altered P and C inputs into colonies of both bee species and examined how this affected (1) colony allocation of foragers to P and C biased feeding stations, and (2) individual preferences (as inferred by choice of and food loading at different feeding stations) given a range of P and of C concentrations. We hypothesized that both honey bees and bumble bees would adjust colony division of labor and allocate more foragers to P and/or C depending on colony needs. Individual preferences were predicted to be skewed toward higher P and C concentrations for foragers from colonies more severely deprived of P or C, respectively, in order to address short-term colony needs rather than long-term optimal foraging. We further predicted, due to differences in level of sociality and food hoarding, that bumble bees would show stronger individual foraging responses to nutrient balance, whereas individual honey bee would be more fixed in response to colony nutrient shifts.
Materials and Methods
Honey Bee Colony Preparations
Twenty-four honey bee colonies (A. mellifera ligustica) were standardized in nucleus hive boxes with ~5,000 workers, a brood nest in 3 center frames and honey stores in 2 side frames (i.e., 5 frames total). This colony size represented an active growth phase of the colony life cycle (i.e., not senescing or reproducing) (Johnson, 2010). After standardization (October 9, 2014), all colonies were relocated for a period of 3 weeks to a location 4.2 km away, to avoid bees drifting back to former hive locations and restore balance between workers, brood, and stores.
One day preceding honey bee experiments, each colony was randomly assigned one of three pollen treatments: pollen deficit (P–), pollen control (P), or pollen surplus (P+). Eight colonies were given an empty comb in the middle of the brood nest, while any pollen cells in those colonies were sealed off using molten wax (treatment P–). Sealing away pollen is alike a natural sealing behavior by honey bees, called capping or entombing (vanEngelsdorp et al., 2009). Eight colonies were controls, which underwent no manipulation (treatment P). Eight other colonies were manipulated by introducing a comb fully filled with pollen in the middle of the brood nest (treatment P+). These pollen combs had been made by filling pre-weighed empty drawn combs with mixed pollen pellets. The pellets were compacted into the cells by worker bees in a large colony for 1 day. Subsequently each comb was reweighed (mean 581 g added pellets ± 29.7 SE; n = 8), and kept refrigerated until use.
In order to introduce either an empty comb (P–) or full comb (P+) in the brood nest, one of the side combs with honey was taken out. The honey removal was regarded as a manipulation of the level of carbohydrate nutrition (treatment C–). Thus, the design allowed assessing in-hive manipulation of both P (levels: less, normal, and more) and C (levels: less and normal) stores (Table 1).
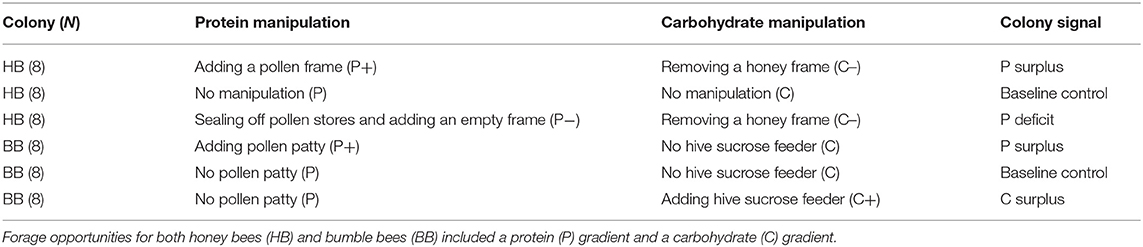
Table 1. Experimental manipulations applied to colonies.
Bumble Bee Colony Preparations
Twenty-four bumble bee colonies of European buff-tailed bumble bees (B. terrestris) were obtained from a commercial breeder (Biobee, Sde Eliyahu, Israel). They were prepared on December 1st, and delivered December 3rd, 2014. This colony size represented an active growth phase of the colony life cycle, as no drones or gynes were being reared yet. The colonies were killed after the experiment to minimize the chance of pathogens spreading into native bee populations (Aizen et al., 2018). Subsequent metrics were collected on colony workers, brood and food (pollen and nectar) storage (Supplement 1).
Standard in-hive sucrose feeders (2 L; 50% w/v sucrose solution) and in-hive pollen patties (50 g; 90% pollen with 10% sucrose solution) were removed from eight bumble bee colony boxes. These colonies were baseline control colonies that needed to forage for both protein (P; pollen diet) and carbohydrate (C; sucrose solution) according to a normal need (P:C ratio). Eight additional colonies were left with their supplied in-hive pollen patties (P+), but not sucrose feeders (C). An additional eight colonies retained the in-hive sucrose feeders (C+) but not the pollen patties (P). Thus, the design allowed for colony manipulation of both P diet (levels: normal and more) and C diet (levels: normal and more) (Table 1).
Honey Bee and Bumble Bee Colony Manipulation Differences
Because the experiment involved two different bee taxa with innate differences in pollen and nectar storage characteristics, exactly parallel colony manipulations were not possible. Honey bee colonies store a multi-day buffer of pollen within combs to safeguard nurse bee provisioning. Nurse bees digest pollen to produce a jelly to feed larvae (Wright et al., 2018). In contrast, bumble bees collect pollen for prompt brood cell provisioning as their larvae eat the pollen directly (Stabler et al., 2015). This disparity is reflected by experimental manipulations to include treatment levels of less, normal, and more in-hive P as treatments for honey bees, whereas bumble bees only included treatment levels normal and more in-hive P, because removing pollen from bumble bee colonies was not feasible. Secondly, honey bee colonies store large quantities of honey while bumble bees maintain a relatively small number of honey pots. As compared to honey bee combs, bumble bee honey pots are more difficult to manipulate. Therefore, carbohydrate stores were manipulated in honey bee colonies by removing a honey comb (C–) but in bumble bee colonies by adding a sucrose feeder (C+), while a baseline colony state (C) was present for both species (Table 1). Colony treatments can be summarized as P+C–, PC, and P–C– for honey bees, and P+C, PC, and PC+ for bumble bees.
Experimental Site and Setup
Experiments were conducted at the Joseph Marguleas Experimental Farm of the Faculty of Agriculture, Food and Environment at the Hebrew University of Jerusalem in Rehovot (31°54′16.02″N, 34°47′50.09″E). Twenty-four tunnel cages of 2 × 3 × 2 m (length × width × height) with a gauze cover of 1.3 mm mesh were used. Every colony had access to a water bucket with cork floats and a feeding arena consisting of two platforms covered with 50 × 50 cm white paper sheets, to present each colony five pollen and five sucrose feeders. Spatial bias on bee choice (e.g., due to the distance to the hive entrance or the direction of the sun) was countered using different permutations of diet placement. In addition, spatial bias effects were mitigated by turning feeding arenas 90°, after recording bee visitation every hour (see section Data on Bee Visits, Collected Diet Weights and Overall Colony Activity).
Data Collection Days
Honey bee colonies were placed into the tents on November 4, after sunset. After 4 days the experiment was ended, with a total exposure to diet feeders per colony of 19:15 h, a mean 4:45 h per day (November 5, 6, 7, and 8). The bumble bee colonies were tested a month later, placed into the tents December 4, at sunset. The bumble bee experiment was ended after 20 of 24 bumble bee colonies had showed foraging activity at the feeding arena (≥1 bee). The bumble bee colonies showed negligible activity over the first 5 days (excluded), which included 2 days with rain and cold temperatures. Exposure to diet feeders per bumble bee colony during the following days was 26:00 h, a mean 5:15 h per day (December 10, 11, 12, 13, and 14). The diurnal average temperature was 2.8°C warmer during the honey bee experiment, as compared to the bumble bee experiment (Supplement 1; t = 2.60, p = 0.04*), yet the day-time high temperatures were favorable for colonies to forage, and were not found to differ between the honey bee and bumble bee trial (24.2°C on average; t = 2.02, df = 7, p = 0.08).
Sugar Solution Feeders
Colonies were housed in tunnels and were provided with feeders (external to colonies) containing sugar solutions in five 1 L square plastic containers, holding 400 g solution per feeder. Each solution had a square bubble-wrap float on top as a platform for bees to land and drink. Solutions were kept ad libitum and refreshed every day or second day (closing feeders with lids overnight). By dissolving sugar in water, five solutions in a concentration gradient of 16.5, 18.5, 20.5, 22.5, 24.5% (w/w) sucrose were made, verified by refractometry. This range represented nectar concentrations at our apiary during the month of November, being 20.7 % ± 1.6 SEM (n = 22 sampled nectar foragers) (Tamar Drezner-Levy, unpublished data, 2003).
Pollen Powder Feeders
Colonies were provided with feeders (external to colonies) containing 100 g pollen diet batches, offered in five 13 cm ∅ petri dishes (20 g diet per dish). These amounts were refreshed every day or second day (closing the dishes overnight), provided ad libitum to assure there was no limitation on choice options. Each diet contained 70% pulverized bee-collected pollen pellets mix with a 30% mix of different tapioca to casein ratios (10:0, 9:1, 8:2, 7:3, or 6:4). Casein use is common for manipulating protein levels in test diets (Pirk et al., 2010; Corby-Harris et al., 2018). Tapioca flour was used as a filler to create dilutions of the casein protein (Hendriksma and Shafir, 2016).
The three diet components (tapioca, casein, and pollen) were mixed in a table top blender and the resulting diets were passed through a honey-sieve and kept refrigerated until use. The tapioca was purchased as alimentary flour (Duchan, Gan Shmuel, Israel). The casein (C7078, Sigma, Missouri, USA) was first pulverized in a ball grinder (Pulverisette 6, Fritsch GmbH, Idar-Oberstein, Germany), applying 7 balls in 2 cycles of 3 min at 300 rpm for batches of 80 g casein. The pollen had been collected using traps on local honey bee hives during the year and kept frozen at −20°C. These mixed floral pollen pellets (5.9 kg) had been homogenized with an industrial blender.
Protein Analyses of All Pollen Diets and Dietary Components
To study colony macro-nutrient intake in the geometric framework of nutrition, the absolute foraged amounts of protein (P) and carbohydrate (C) were quantified. Dietary protein concentrations were assessed by Kjeldahl nitrogen analysis (Foss Tecator Kjeltec Auto Sampler System 1035 Analyzer, Hillerød, Denmark). Samples of 200 mg were oxidized by H2SO4 with catalysts Se and CuSO4 at 400°C. N-amines that had been converted into (NH4)2SO4 were hereafter titrated with HCl to indicate the quantity of nitrogen. The % crude protein (w/w) was calculated as %N multiplied with a conversion factor of 6.25 (Roulston and Cane, 2000), or 6.38 for casein (Sigma product specification sheet).
Separate diet batches were made for the honey bee and bumble bee trials, using the same pollen pellets mix, but using different casein and tapioca batches, which may have accounted for the slight differences (1.9% on average) in protein content. Final pollen diets contained 17.3, 18.1, 19.9, 22.3, and 24.6% protein in the honey bee trial, and 14.5 16.4, 19.0, 22.2, and 21.8% protein in the bumble bee trial. All samples were measured in duplicate.
Data on Bee Visits, Collected Diet Weights, and Overall Colony Activity
Bees collecting pollen or sucrose were counted by means of digital photography at approximate hourly intervals. The amount of collected diet was measured to the nearest 0.01 g pollen and 1 g sucrose solution. All feeders were weighed before and after colony exposure. Data from non-foraging colonies (0–2 total recorded visits) indicated a daily mean 1.5% desiccation of pollen diet and 2.8% evaporation of sucrose solutions, for which forage weight data at active colonies were corrected.
Absence of foraging was considered a proxy for colony inactivity. Colonies were considered inactive if over the full course of the experiment ≤7 foragers were counted on the feeding arena. Colonies that were inactive for sucrose collection (N = 12) had a mean 0.02 ± 0.01 SE sucrose foragers counted per observation, and collected a mean 0.00 gh−1 ± 0.16 SE sucrose solution, i.e., not significantly different from zero (one-sample t-test; t = 0.0, p = 1.0). Colonies inactive in pollen collection (N = 28) had a mean 0.09 ± 0.02 SE pollen foragers, and collected mean 0.01 gh−1 ± 0.02 SE pollen diet, also not significantly different from zero (one-sample t-test; t = 0.69, p = 0.49).
For all active colonies, relative collection of diet weight was calculated by dividing the sum of collected weights per concentration level, on the total weight collected. In addition, an index of foraging load was calculated per concentration level, by dividing the weight of diet collected per hour by the average count of bees on the diet (unit: gh−1·bee−1). Assuming that the length of time a bee spent on a feeder is proportional to the amount of food she collected and the probability of her being captured in the photograph census, the loading indexes are proxies to diet concentration-specific nectar crop loads and corbicular pollen loads, respectively. Individual bee identities were not recorded, however our data can still provide insights into individual foraging decisions. Foragers could choose to differentially spend their foraging time across different feeders, thus their choice, the relative amounts of food removed, and also the food loads may serve as proxies for individual bee motivation regarding the different nutrient concentrations in the offered diets.
P:C Ratio of Diet Uptake by Active Colonies
P:C ratios of colonies were calculated by dividing grams of P uptake by C uptake. Inactive colonies were excluded (≤7 foragers or ≤0 g diet collected). P intake was the sum of collected pollen diet weights times the %P. The C intake of colonies was the sum of collected pollen diet weights times the %C in the pollen diet, plus the collected sucrose solution weights times %C in the solution. We assumed pollen pellets to contain 50% w/w C (Nicolson, 2011), which includes pollen starch (0–22%; Roulston and Buchmann, 2000), pollen sugars (9.6%; Speranza et al., 1997), and the nectar sugars added by foragers while pelleting the pollen (Bertoncelj et al., 2018). Casein (product specification sheet, Sigma) and tapioca flour (food label, Duchan) were considered to contain 0 and 99.8%C, respectively. The five pollen diets were thus calculated to contain 64.2, 61.3, 58.4, 55.5, and 52.6%C, respectively.
Statistics
Analyses were performed with JMP 13.1 Pro statistical software.
Colony Activity
The number of active vs. inactive honey bee and bumble bee colonies was compared by Fisher Exact Tests regarding pollen foraging, sucrose foraging, and overall foraging activity (Table 1).
Bee Counts
Generalized Linear Models (GLM) were fitted by maximum likelihood with an exponential distribution and reciprocal link function, to analyze treatment effects on forager counts. Pollen forager counts were analyzed on protein treatment effects (3 levels P–/P/P+ for honey bees; 2 levels P/P+ for bumble bees), and nectar forager counts on carbohydrate treatment effects (2 levels C–/C for honey bees; 2 levels C/C+ for bumble bees). Model fit was assessed by a Pearson χ2 test for overdispersion. Final p-value approximations were based on Wald tests.
Allocation of Foragers Among Diets, Treatments, and Bee Types
The percentage pollen foragers on the total number of foragers was taken as measure of relative forager allocation. Allocation (arcsine square root transformed % data) as response variable was analyzed by 1-way ANOVA, with treatment as independent variable (3 levels), for honey bees and bumble bees separately. Post-hoc comparisons were performed by Tukey honest significant difference (HSD) tests. Relative forager allocations of honey bee and bumble bee colonies were compared under the PC treatment (i.e., in the baseline colonies) with bee type as independent variable (2 levels).
P:C Ratio
The intake of protein and carbohydrate by colonies was described, per treatment, as a P to C ratio. For the baseline colonies (PC treatment), P:C ratios per colony were compared among bee types (2 levels) with a 1-way ANOVA on ranks (Kruskal–Wallis test). The non-baseline colony treatments (2 levels) were compared for honey bees and bumble bees separately.
Dose Response Effects on Diet Collection, and Carrying Loads
Relative collected diet weights and forage load indices were compared by ANCOVA, for honey bee and bumble bee separately, with independent variables diet concentration (continuous variable) and treatment (3 levels). Significant interactions would indicate that concentration dependent choices of bees differed due to colony manipulations. For the baseline colonies (PC treatment), relative weights and load indices were compared with the independent variables diet concentration (continuous variable), and bee type (2 levels). Here an interaction would show different choice responses for honey bees and bumble bees, regarding dietary P or C concentrations. Non-significant interactions (p ≥ 0.05) were removed from models. As proportionalized data are on average identical between groups (p = 1.0), the covariable (i.e., treatment or bee type) was also removed from the model in cases in which the interaction was not significant.
Results
Honey Bee Colony Level Balancing the Uptake of P and C
A total 5,149 honey bee visits to diets were recorded. Altogether, honey bee colonies (N = 24) collected 493 g pollen diet and 15.7 Kg sucrose solution (ratio 1:32). The colonies were significantly more active with respect to sucrose collection as compared to pollen collection (Fisher Exact p < 0.001). Counts of pollen foragers indicated a difference by protein manipulation (Figure 1A; N = 12, χ2 = 13.1, df = 2, p = 0.001). Pollen foragers were significantly more active under the P- treatment, as compared to the treatments P (χ2 = 5.27, df = 1, p = 0.02) and P+ (χ2 = 10.6, df = 1, p = 0.001). Counts of pollen foragers did not differ between the P and P+ treated colonies (χ2 = 2.53, df = 1, p = 0.11). Nectar forager counts did not differ between colonies depending on C treatment (comparing C vs. C–, Figure 1A; χ2 = 2.55, df = 1, p = 0.11).
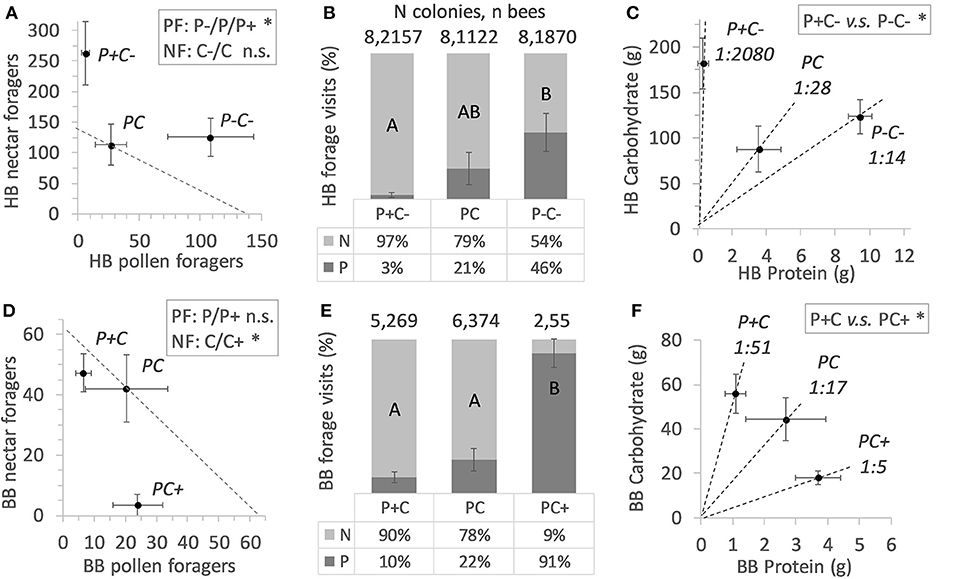
Figure 1. Colony level effects of in-hive nutrient manipulations. Nectar forager (NF) counts and pollen forager (PF) counts are shown in (A) for honey bees (HB) and in (D) for bumble bees (BB), under conditions of increased or decreased protein (P) or carbohydrate (C) food stores. Mean active colony values of forager counts ± SE error bars are shown, with dotted diagonals indicating the mean forager number counted at baseline colonies. Statistical significance is indicated with an asterisk (*). Foraging allocation to nectar (N) and pollen (P) is shown in (B,E) (mean % values ± SE error bars) with significant treatment effects indicated by different lettering (post hoc Tukey HSD). Colony level P:C ratios are indicated in (C,F) with dotted lines illustrating the mean Protein to Carbohydrate intake ± SE error bars per treatment. Post hoc statistical significances are indicated with an asterisk (*).
Under conditions of pollen excess and carbohydrate reduction (P+C–), honey bees shifted toward a C biased foraging division of labor, with higher numbers of foragers for sucrose (Table 2). Also, the relative forager allocation comparison indicated treatment effects [Figure 1B; N = 24, F(2, 21) = 4.33, p = 0.027], with the lowest pollen forage counts in the P+ treatment. These colonies showed a relatively high sucrose foraging allocation (Figure 1B; 97% nectar vs. 3% pollen foraging bouts, illustrated by their remarkable 1/2080 P:C intake ratio (Figure 1C). For the reverse treatment of pollen deprivation and carbohydrate reduction (P–C–), honey bees shifted their task allocation to collecting pollen (Table 2). Almost half the colony foraged for pollen (Figure 1B; 46% pollen vs. 56% sucrose) with an overall P to C intake shifted to 1:14 (Figure 1C). The P:C ratios of the non-baseline treated honey bee colonies differed significantly [P+C– vs. P–C+; F(1, 14) = 8.09, p = 0.013].
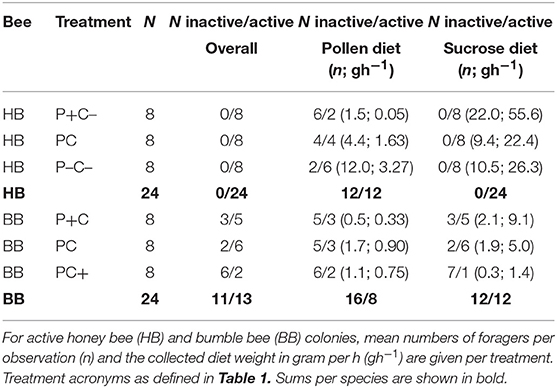
Table 2. Active vs. inactive colony numbers.
Bumble Bee Colony Level Balancing the Uptake of P and C
A total 714 bumble bee visits to diets were recorded. Altogether, bumble bee colonies (N = 24) collected a total of 155 g pollen diet and 2.0 Kg sucrose solution (ratio 1:13). For bumble bee colonies, the activities for collecting sucrose and pollen did not significantly differ (Table 2; N = 12 vs. N = 8, Fisher Exact p = 0.38) (Table 2). Pollen forager counts indicated no difference between the P and P+ manipulation (Figure 1D; N = 8, χ2 = 3.56, df = 1, p = 0.06), yet nectar forager counts were significantly lower in the C+ treatment compared to the C treatment (Figure 1D; N = 12, χ2 = 8.32, df = 1, p = 0.004).
Bumble bee colonies (N = 13) showed significant treatment effects on foraging allocation [Figure 1E; F(2, 10) = 14.2, p = 0.001]. Notably, the PC+ treated colonies showed significantly lower allocation of workers to the collection of sucrose, compared to the other 2 treatments (Figure 1E; 9% foraging for sucrose vs. 91% for pollen). The P+C colonies had the lowest P:C ratio, i.e., 1:51, which contrasted the reverse treatment P+C, where colonies had an intake of 1:5 PC+ ratio (Figure 1F). The P:C ratios of the non-baseline colonies differed significantly from one another [P+C vs. PC+; F(1, 5) = 675.8, p < 0.001].
Colony Level Differences Between Bee Species
Large differences between and within bee species were observed regarding colony activity (Table 2). Honey bee colonies were more likely to be active than bumble bee colonies (overall foraging 24 > 13 colonies, respectively, Fisher Exact p < 0.001; sucrose foraging 24 > 12 colonies, respectively, Fisher Exact p < 0.001; pollen foraging 12 ≈ 8 colonies, respectively, Fisher Exact p = 0.38). At the colony level, honey bees but not bumble bees balanced their pollen foraging in response to colony needs and in contrast, bumble bees but not honey bees balanced their sucrose foraging (Figures 1A,D). PC treatment (baseline colonies) revealed that the allocation of 21.1% pollen foragers for honey bee colonies (N = 8) did not differ from the 21.9% pollen forager allocation for bumble bee colonies (N = 6) [central bars Figures 1B,E; F(1, 12) = 0.05, p = 0.83]. Both bee species baseline colonies did not differ in their protein to carbohydrate intake ratio, with P:C ratios of 1:28 vs. 1:17, respectively [Figures 1C,F; F(1, 11) = 0.09, p = 0.77].
Individual Honey Bee Responses to P and C Nutrient Needs
Overall, honey bees collected 23 times more sucrose of the highest concentration as compared to the lowest concentration (42.0 vs. 1.8%, respectively), demonstrating a highly significant preference for higher C concentrations [Figures 2A–C, concentration; F(1, 109) = 205.5, p < 0.001]. Bees in the pollen supplemented hives (P+C–) showed a less pronounced preference compared to the other two treatments, namely 7 times more sucrose solution collection of the highest concentration as compared to the lowest concentration, with this difference illustrated by a shallower slope [Figure 2A vs. Figure 2B,C; slope interaction F(2, 109) = 3.69, p = 0.028]. The sucrose forage loads were also significantly higher when bees were visiting higher C feeders [concentration; F(1, 111) = 46.1, p < 0.001] (Figures 2G–I). Foragers did not show a concentration dependent effect on loading in response to colony P and C manipulations, i.e., similar slopes in the three treatment groups [Figures 2G–I; slope interaction F(2, 109) = 2.94, p = 0.057]. The loading of sucrose solution was not affected by colony manipulations [treatment; F(2, 111) = 1.61, p = 0.20].
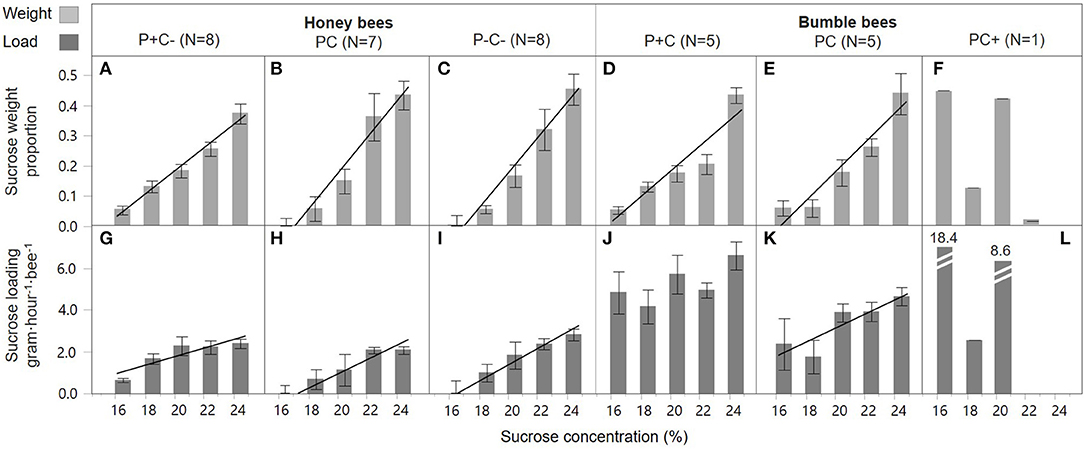
Figure 2. Honey bee and bumble bee preference during sucrose collection. With the sucrose diet carbohydrate concentration in percent on the x-axis, relative sucrose collection by individual bees is shown as weight proportions on the y-axis (A–F), and sucrose loading on the y-axis (G–L). Trendlines indicate dose-response significance per treatment, involving protein (P) and carbohydrate (C) manipulations, within honey bee colonies (left side) and bumble bee colonies (right side).
P concentration preference by honey bee foragers differed by colony treatment [slope interaction; F(2, 49) = 6.31, p = 0.004]. In the PC and P–C– treated colonies, foragers preferred collecting pollen diets with lower P (casein) content [Figures 3B,C; F(1, 18) = 64.2, p < 0.001 and F(1, 23) = 77.47, p < 0.001, respectively]. This negative P preference was significantly stronger in the PC treatment as compared to the P–C– treatment [slope interaction; F(1, 41) = 18.1, p < 0.001]. There was no indication of a negative P preference in the P+C– colonies [Figure 3A; F(1, 8) = 0.17, p = 0.69]. In contrast, there was no effect of treatment on pollen loading under different concentrations [Figures 3G–I; slope interaction F(2, 47) = 0.50, p = 0.61]. In general, pollen loading by honey bees was not affected by protein concentration [F(1, 49) = 0.14, p = 0.71]. Pollen load did differ per P+C–, PC, and P–C– treatment [F(2, 49) = 7.56, p = 0.001], with baseline colony foragers (PC Figure 3H) showing a higher loading as compared to pollen supplemented colony foragers (P+C– Figure 3G).
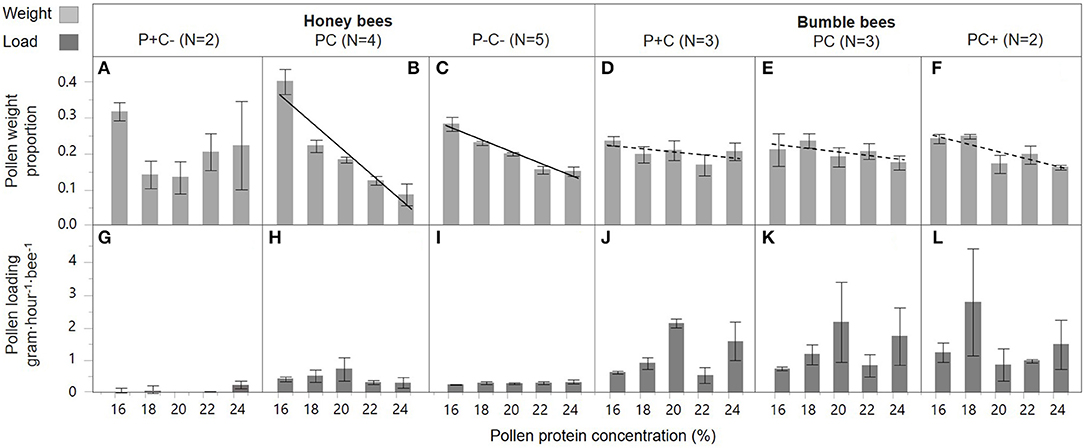
Figure 3. Honey bee and bumble bee preference during pollen collection. With the pollen diet protein concentration in percent on the x-axis, relative pollen collection by individual bees is shown as weight proportions on the y-axis (A–F), and pollen loading on the y-axis (G–L). Trendlines indicate dose-response significance per treatment, involving protein (P) and carbohydrate (C) manipulations, within honey bee colonies (left side) and bumble bee colonies (right side). The striped trend lines indicate a significant dose-response for bumble bees in general, albeit this effect was insignificant for the treatment groups individually.
Individual Bumble Bee Responses to P and C Nutrient Needs
Bumble bee foragers in the PC+ treatment did not favor high C concentrations [Figure 2F; F(1, 3) = 3.55, p = 0.16]. This was in significant contrast [slope interaction; F(2, 49) = 19.5, p < 0.001] with foragers of P+C and PC treated colonies, which did show a significant preference for higher sucrose concentrations [Figure 2D,E; F(1, 23) = 68.6, p < 0.001 and F(1, 23) = 48.3, p < 0.001, respectively] and collected proportionally 8 times more sucrose of the highest concentration as compared to the lowest concentration. Bumble bee foraging loads differed in C dose-responses [slope interaction F(2, 45) = 15.6, p < 0.001]. Under the PC treatment, foragers increased their crop loading with higher C concentration [Figure 2K; F(1, 21) = 7.56, p = 0.012], yet no such pattern was present at the P+C and PC+ treated colonies [Figures 2J,L; F(1, 22) = 3.18, p = 0.09 and F(1, 2) = 2.87, p = 0.23, respectively]. Individuals collected lighter loads under treatment PC, as compared to treatments P+C and PC+ [Figures 2J–L; F(2, 45) = 7.40, p = 0.002, post-hoc A B A]. These data suggest the addition of pollen patties motivated the bees to collect greater sucrose loads (Figure 2J), which may relate to increased brood production activity, motivating a higher fuel intake (Supplement 1). Notably, when giving sucrose solution to bumble bees within their hive, foragers loaded mostly at the least concentrated solution (i.e., 18.4 gh−1·visit−1), suggesting the foragers may have shifted to water collection behavior (Figure 2L).
Bumble bees, over all treatments considered, showed a significant preference for collecting diets with lower protein concentrations [Figures 3D–F; F(1, 31) = 7.93, p = 0.008]. This preference, however, was not affected by colony P or C manipulations [slope interaction; F(2, 34) = 0.62, p = 0.54 and treatment F(2, 34) = 0.00, p = 1.00]. There was also no effect of treatment on forager pollen loads [Figures 3J–L, slope interaction; F(2, 31) = 0.59, p = 0.56]. Bumble bee pollen loading was not affected by protein concentration [F(1, 33) = 0.60, p = 0.44], and forage loads did not differ in response to colony P and C treatment [Figures 3J–L; F(2, 33) = 0.25, p = 0.78].
Individual Response Differences Between Bee Species
A direct comparison was made for honey bee and bumble bee colonies only for the single treatment in which they experienced the same condition, that of baseline treatment PC (Table 2). Both species preferred to collect more sucrose solution of higher C concentrations [Figures 2B,E; F(1, 58) = 104.6, p < 0.001], and this effect was similar between the species [slope interaction; F(1, 56) = 1.07, p = 0.31, and bee type F(2, 34) = 0.00, p = 1.00]. Honey bee and bumble bee individuals increased loading with higher sucrose concentrations [F(1, 55) = 21.2, p < 0.001], with no difference between species in their concentration response [slope interaction; F(1, 54) = 0.00, p = 0.96]. Bumble bee foragers showed 3x higher sucrose loading as compared to honey bee foragers [bee type; F(1, 55) = 27.2, p < 0.001].
Honey bee and bumble bee foragers both preferred collecting pollen diets with lower protein concentration [Figures 3B,E; F(1, 31) = 41.9, p < 0.001], yet this preference was stronger for honey bees as compared to bumble bees [Figures 3B,E, slope interaction; F(1, 31) = 24.0, p < 0.001]. There was also 3x higher pollen loading by bumble bee foragers as compared to honey bee foragers [bee type; F(1, 32) = 8.24, p = 0.007]. A difference in protein dose-response on loading was not found between the species [slope interaction; F(1, 31) = 0.96, p = 0.33], and loading was not found affected by protein concentrations [F(1, 32) = 0.28, p = 0.60].
Discussion
In this study, two very different eusocial bee species were investigated (A. mellifera honey bees and B. terrestris bumble bees) in responses to shifts in their colony carbohydrate and protein stores. In the baseline P to C treatment, the ratio of P to C foragers and P:C forage collected were strikingly similar between the two species, with close to 80% C foraging allocation (Figures 1B,E) and roughly comparable P:C ratios collected (Figures 1C,F). Overall, the results support the original hypothesis that both bee species would shift the division of labor to counteract shifts in colony nutrient balance.
For example, both honey bee and bumble bee colonies with perturbed P:C balance made adaptive shifts in the P:C ratio of the collected forage (Figures 1C,F). Thus, the division of labor shifts for both species had an impact on the actual mass nutrients taken in by foragers. Overall, these data reveal that both species have the ability to shift colony level foraging efforts to balance protein and carbohydrate nutrient intake.
There were also some key differences between species in their specific responses to colony energy balance (summarized in Table 3). Both honey bee and bumble bee colonies shifted the number of foragers and percent of foraging visits (Figures 1A,B,D,E) in response to nutrient manipulations. However, the shifts were significant only for P shifted treatments in honey bees, and significant only for C shifted treatments in bumble bees. These data suggest honey bees are more responsive to P needs, whereas bumble bees are more responsive to C needs. This is in agreement with the known high sensitivity of honey bee colonies to colony pollen needs (Camazine, 1993), and also in agreement with previously published carbohydrate responses in three other bumble bee species (Cartar, 1992). The different dynamics between bee species are consistent with their different life histories. Perennial honey bee colonies, which are keenly tuned toward hoarding large amounts of honey needed for overwintering survival, are expected to always allocate foragers to collect nectar, while more finely modulating pollen collection in response to colony stores and current brood needs (Keller et al., 2005). Annual bumble bee colonies, which do not store large amounts of honey for overwintering, should reduce allocation of nectar foragers once sufficient carbohydrate stores have been reached, but always allocate foragers to collect pollen to support maximum brood production (Cartar, 1992).
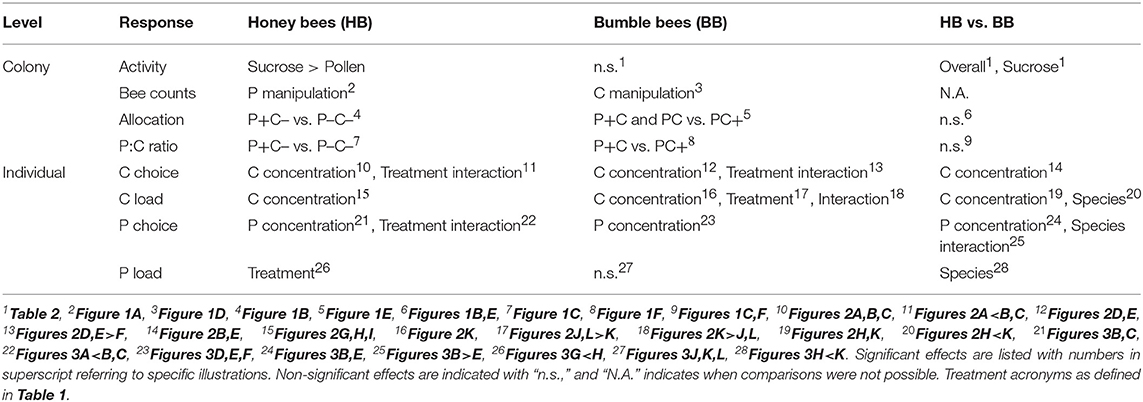
Table 3. Summary of effects by treatment, diet concentration, bee species, and interactions.
In general, individual bee preferences were predicted to be skewed toward higher nutrient concentrations during foraging. In line with this prediction, foragers of both species generally preferred the higher sucrose concentration feeders (Figure 2, top row). An underlying key question was if foragers changed in concentration preference under conditions of colony deprivation as compared to satiation. Both bee species were found to shift individual responses when colony nutrient levels were manipulated. For honey bees, sucrose preference was dampened in colonies supplemented with pollen. This shift toward acceptance of lower concentrations may have been caused by a sensory modulation depending on the nutritional state of the individual bee (Figure 2A). However, a shift in pollen vs. nectar forager allocation could also be the cause. It is likely that among the observed 97% nectar collectors there were some bees with a predisposition to collect pollen (Figure 1B). Pollen foragers have lower sucrose sensitivity thresholds (Pankiw and Page, 2000; Scheiner et al., 2001; Pankiw, 2003; Drezner-Levy et al., 2009). Hence, the nutritional state of colonies could have shifted forager allocation, and with that the average sensory modality for sucrose preference.
Bumble bee foragers were also found to prefer higher sucrose concentrations, with the exception of the sucrose supplemented treatment (Figure 2F). Here, foragers showed a remarkable shift in preference toward low sucrose concentrations. With an in-hive feeder containing 50% w/v sucrose, foragers may have shifted toward collecting forage with high water content, even in the presence of supplemental water feeders at the experimental arena (Figure S2).
Foragers of both species generally loaded with more sucrose from higher concentration feeders (Figure 2, bottom row). Load increase with sucrose concentration is consistent with the findings of Núñez (1966) and the descriptive model of Varjú and Núñez (1991), in which sucrose concentration is a main determinant of crop loads. However, for honey bees, patterns of loading in response to sucrose concentration did not differ across colony nutrient balance treatments (Figures 2G–I). This suggests that, despite changing colony needs, individual bees maintain behaviors that optimize C energy intake (Schmid-Hempel et al., 1985; Kacelnik et al., 1986; Schmid-Hempel, 1987; Varjú and Núñez, 1991; Afik and Shafir, 2007). In contrast to the honey bee finding, bumble bees showed significant colony nutrient treatment effects on mean sucrose loads (Figures 2J–L). Unlike honey bee foragers which are all the same size, bumble bees vary greatly in size within a colony (Figure S2), with foragers being on average larger than nest bees (Goulson et al., 2002). One explanation for why mean bumble bee crop loads were significantly lower in the PC treatment (Figure 2K), as compared to the other treatments, is that the total number of foragers was greatest in the PC treatment. Because of a high forage demand for both pollen and nectar (Figure 1D), this may have induced additional recruitment of foragers, including the physically smaller bumble bees. Another explanation is that nutritional depletion caused mortality of forager bees (Supplement 1), which may have (again) induced the recruitment of smaller individuals with lower crop loads (Hagbery and Nieh, 2012). In fact, whereas bumble bee foragers are biased toward the larger individuals, when foragers are depleted by induced mortality, the probability of nest bees to switch to foraging is independent of their size (Crall et al., 2018).
Individual level responses to protein forage differed drastically from those of carbohydrate forage. Although individual forager preferences were predicted to be skewed toward higher P nutrient concentrations, instead foragers showed an aversion to high protein concentrations (Figure 3; top row). Why did bees avoid higher protein concentration? The pollen content (70%) was constant for all diets, thus the effect can be attributed to the casein or tapioca in the diet. Either bees found casein aversive, or bees were attracted to tapioca. When tapioca is imbibed it may evoke preference because the starch is hydrolyzed into sugar by α-amylase, an enzyme produced in honey bee salivary glands (Wright et al., 2018). The sweetness may subsequently act as a reward and evoke preference. Fat content may be another explanation why bees may have an aversion for casein. Technical grade casein from bovine milk has some fat content (C7078, Sigma) and Hendriksma and Shafir (2016; supplement within) found higher dietary fat contents to negatively affect diet preference of bees.
Despite the aversive nature of high protein concentrations, honey bee foragers showed modulation of individual responsiveness to protein based on colony nutrient balance. In baseline colonies foragers showed the most pronounced negative concentration preference, while foragers of pollen supplemented colonies were relatively indiscriminate. This suggests that satiated honey bees lost nutrient discrimination and/or preference (Figure 3A).
Pollen loads (Figure 3 bottom row) were heavier for the overall larger bumble bees relative to honey bees, as also found under natural conditions (Minahan and Brunet, 2018). In honey bees, there was a significant treatment effect, with pollen supplemented colonies showing reduced loading compared to baseline. Thus, honey bees do appear to modulate their P foraging responses in response to colony energy balance shifts. Bumble bees showed less pronounced aversion for pollen diet protein content, and there were no significant treatment effects (Figures 3D–F), and the same was true for pollen loading (Figures 3J,K,L). This suggests that bumble bees are less responsive to dietary protein concentration, and/or that they forage with a hardwired preference baseline which is not affected by differential colony needs.
It is important to note that observed shifts in individual-level responses (Table 3) may not truly represent individuals altering behavior; rather they may represent alterations in the allocation of foragers that differ in size and/or in threshold sensitivity to nutrient stimuli. Future experiments following individual bees before and after colony nutrient shifts are necessary to disentangle whether the observed differences represent direct individual shifts vs. shifts in colony allocation of individuals with differing nutrient preferences. In addition, future study into individual and colony responses for colonies in different phases of the colony life cycle would complement current results, as forager responses may alter when colonies prepare for reproduction or reach the end of the season (Pankiw and Page, 1999; Johnson, 2010).
Returning to the original hypotheses, this study presents evidence to support the hypothesis that both highly eusocial and primitively eusocial bees balance colony nutrient needs by shifting division of labor for foraging. Although bumble bees are not as highly social as honey bees, the fact that they have passed the “superorganism threshold” by some definitions (because they have permanent morphological castes; Boomsma and Gawne, 2018), indicates that colony-level decision making is well developed even in “simpler” social insect societies. Based on differences in the level of sociality between honey bees and bumble bees, we also predicted stronger individual level responses in bumble bees compared to honey bees. Contrary to this prediction, we found evidence for shifts in individual level nutrient responsiveness (especially with respect to carbohydrate preference and loading) for both species. Instead of being related to differences in sociality, differences between species in their specific responses (summarized in Table 3) instead may be related to differences in colony life history traits (such as level of food hoarding, form of brood provisioning, etc.). Thus, we urge a stronger consideration of life history traits such as parental care, hoarding, and seasonality, in considerations of foraging decisions and in the context of OFT.
Author Contributions
The study design, data collection and data analyses were performed by HH. The manuscript was written by HH, AT, and SS.
Conflict of Interest Statement
The authors declare that the research was conducted in the absence of any commercial or financial relationships that could be construed as a potential conflict of interest.
Acknowledgments
We are thankful to the Biotechnology & Biological Sciences Research Council (BBSRC), Natural Environment Research Council (NERC), the Wellcome Trust, Department for Environment, Food & Rural Affairs (Defra), and the Scottish Government under the Insect Pollinators Initiative (grant no: BB/ I000968/1), and the United States Department of Agriculture - National Institute of Food and Agriculture (grant no: 2016-07965) for funding, and to Prof. Dr. Amos Nussinovitch and Zahi Rabinovitz for casein preparation, Sameer Mabjeesh for protein analyses, and Haim Kalev for colony placement in his pomegranate orchard.
Supplementary Material
The Supplementary Material for this article can be found online at: https://www.frontiersin.org/articles/10.3389/fevo.2019.00177/full#supplementary-material
References
Afik, O., and Shafir, S. (2007). Effect of ambient temperature on crop loading in the honey bee, Apis mellifera (Hymenoptera: Apidae). Entomol. Gen. 29, 135–148. doi: 10.1127/entom.gen/29/2007/135
Aizen, M. A., Smith-Ramírez, C., Morales, C. L., Vieli, L., Sáez, A., Barahona-Segovia, R. M., et al. (2018). Coordinated global species-importation policies are needed to reduce serious invasions globally: the case of alien bumble bees in South America. J. Appl. Ecol. 56, 100–106. doi: 10.1111/1365-2664.13121
Altaye, S. Z., Pirk, C. W., Crewe, R. M., and Nicolson, S. W. (2010). Convergence of carbohydrate-biased intake targets in caged worker honeybees fed different protein sources. J. Exp. Biol. 213, 3311–3318. doi: 10.1242/jeb.046953
Ament, S. A., Wang, Y., and Robinson, G. E. (2010). Nutritional regulation of division of labor in honey bees: toward a systems biology perspective. Wiley Interdiscip. Rev. Syst. Biol. Med. 2, 566–576. doi: 10.1002/wsbm.73
Behmer, S. T. (2009a). Insect herbivore nutrient regulation. Annu. Rev. Entomol. 54, 165–187. doi: 10.1146/annurev.ento.54.110807.090537
Behmer, S. T. (2009b). Animal behaviour: feeding the superorganism. Curr. Biol. 19, R366–R368. doi: 10.1016/j.cub.2009.03.033
Bertoncelj, J., Polak, T., Pucihar, T., Lilek, N., Kandolf Borovšak, A., and Korošec, M. (2018). Carbohydrate composition of Slovenian bee pollens. Int. J. Food Sci. Technol. 53, 1880–1888. doi: 10.1111/ijfs.13773
Boomsma, J. J., and Gawne, R. (2018). Superorganismality and caste differentiation as points of no return: how the major evolutionary transitions were lost in translation. Biol. Rev. 93, 28–54. doi: 10.1111/brv.12330
Burgett, D. M., and Young, R. G. (1974). Lipid storage by honey ant repletes. Ann. Entomol. Soc. Am. 67, 743–744. doi: 10.1093/aesa/67.5.743
Camazine, S. (1993). The regulation of pollen foraging by honey bees - how foragers assess the colony need for pollen. Behav. Ecol. Sociobiol. 32, 265–272. doi: 10.1007/BF00166516
Cartar, R. V. (1992). Adjustment of foraging effort and task switching in energy-manipulated wild bumblebee colonies. Anim. Behav. 44, 75–87. doi: 10.1016/S0003-3472(05)80757-2
Corby-Harris, V., Snyder, L., Meador, C., and Ayotte, T. (2018). Honey bee (Apis mellifera) nurses do not consume pollens based on their nutritional quality. PLoS ONE 13:e0191050. doi: 10.1371/journal.pone.0191050
Crall, J. D., Gravish, N., Mountcastle, A. M., Kocher, S. D., Oppenheimer, R. L., Pierce, N. E., et al. (2018). Spatial fidelity of workers predicts collective response to disturbance in a social insect. Nat. Commun. 9:1201. doi: 10.1038/s41467-018-03561-w
Dornhaus, A., and Chittka, L. (2001). Food alert in bumblebees (Bombus terrestris): possible mechanisms and evolutionary implications. Behav. Ecol. Sociobiol. 50, 570–576. doi: 10.1007/s002650100395
Drezner-Levy, T., Smith, B., and Shafir, S. (2009). The effect of foraging specialization on various learning tasks in the honey bee (Apis mellifera). Behav. Ecol. Sociobiol. 64, 135–148. doi: 10.1007/s00265-009-0829-z
Dussutour, A., and Simpson, S. J. (2009). Communal nutrition in ants. Curr. Biol. 19, 740–744. doi: 10.1016/j.cub.2009.03.015
Galef, B. G. Jr., and Giraldeau, L.A. (2001). Social influences on foraging in vertebrates: causal mechanisms and adaptive functions. Anim. Behav. 61, 3–15. doi: 10.1006/anbe.2000.1557
Goulson, D. (2010). Bumblebees: Behaviour, Ecology, and Conservation. New York, NY: Oxford University Press.
Goulson, D., Peat, J., Stout, J. C., Tucker, J., Darvill, B., Derwent, L. C., et al. (2002). Can alloethism in workers of the bumblebee, Bombus terrestris, be explained in terms of foraging efficiency? Anim. Behav. 64, 123–130. doi: 10.1006/anbe.2002.3041
Hagbery, J., and Nieh, J. C. (2012). Individual lifetime pollen and nectar foraging preferences in bumble bees. Naturwissenschaften 99, 821–832. doi: 10.1007/s00114-012-0964-7
Heinrich, B. (1983). Do bumblebees forage optimally, and does it matter? Am. Zool. 23, 273–281. doi: 10.1093/icb/23.2.273
Hendriksma, H. P., and Shafir, S. (2016). Honey bee foragers balance colony nutritional deficiencies. Behav. Ecol. Sociobiol. 70, 509–517. doi: 10.1007/s00265-016-2067-5
Hodges, C. M. (1985). Bumble bee foraging: the threshold departure rule. Ecology 66, 179–187. doi: 10.2307/1941318
Johnson, B. R. (2010). Division of labor in honeybees: form, function, and proximate mechanisms. Behav. Ecol. Sociobiol. 64, 305–316. doi: 10.1007/s00265-009-0874-7
Kacelnik, A., Houston, A. I., and Schmid-Hempel, P. (1986). Central-place foraging in honey bees: the effect of travel time and nectar flow on crop filling. Behav. Ecol. Sociobiol. 19, 19–24. doi: 10.1007/BF00303838
Katz, K., and Naug, D. (2015). Energetic state regulates the exploration-exploitation trade-off in honeybees. Behav. Ecol. 26, 1045–1050. doi: 10.1093/beheco/arv045
Kay, A. (2002). Applying optimal foraging theory to assess nutrient availability ratios for ants. Ecology 83, 1935–1944. doi: 10.1890/0012-9658(2002)083[1935:AOFTTA]2.0.CO;2
Keller, I., Fluri, P., and Imdorf, A. (2005). Pollen nutrition and colony development in honey bees—Part II. Bee World 86, 27–34. doi: 10.1080/0005772X.2005.11099650
Konzmann, S., and Lunau, K. (2014). Divergent rules for pollen and nectar foraging bumblebees – a laboratory study with artificial flowers offering diluted nectar substitute and pollen surrogate. PLoS ONE 9:e91900. doi: 10.1371/journal.pone.0091900
Lee, K. P., Behmer, S. T., Simpson, S. J., and Raubenheimer, D. (2002). A geometric analysis of nutrient regulation in the generalist caterpillar Spodoptera littoralis (Boisduval). J. Insect Physiol. 48, 655–665. doi: 10.1016/S0022-1910(02)00088-4
Leonhardt, S., and Blüthgen, N. (2012). The same, but different, pollen foraging in honeybee and bumblebee colonies. Apidologie 43, 449–464. doi: 10.1007/s13592-011-0112-y
Lihoreau, M., Buhl, J., Charleston, M. A., Sword, G. A., Raubenheimer, D., and Simpson, S. J. (2014). Modelling nutrition across organizational levels, from individuals to superorganisms. J. Insect Physiol. 69, 2–11. doi: 10.1016/j.jinsphys.2014.03.004
Lihoreau, M., Chittka, L., Le Comber, S. C., and Raine, N. E. (2012). Bees do not use nearest-neighbour rules for optimization of multi-location routes. Biol. Lett. 8, 13–16. doi: 10.1098/rsbl.2011.0661
Minahan, D. F., and Brunet, J. (2018). Strong interspecific differences in foraging activity observed between honey bees and bumble bees using miniaturized radio frequency identification (RFID). Front. Ecol. Evol. 6:156. doi: 10.3389/fevo.2018.00156
Nicolson, S. W. (2011). Bee food: the chemistry and nutritional value of nectar, pollen and mixtures of the two. Afr. Zool. 46, 197–204. doi: 10.1080/15627020.2011.11407495
Núñez, J. A. (1966). Quantitative Beziehungen zwischen den Eigenschaften von Futterquellen und Verhalten von Sammelbienen. Z. Vergl. Physiol. 53, 142–164.
Page, R. E. Jr., and Fondrk, M. K. (1995). The effects of colony-level selection on the social organization of honey bee (Apis mellifera L.) colonies: colony-level components of pollen hoarding. Behav. Ecol. Sociobiol. 36, 135–144. doi: 10.1007/BF00170718
Pankiw, T. (2003). Directional change in a suite of foraging behaviors in tropical and temperate evolved honey bees (Apis mellifera L.). Behav. Ecol. Sociobiol. 54, 458–464. doi: 10.1007/s00265-003-0640-1
Pankiw, T., and Page, R. E. Jr. (1999). The effect of genotype, age, sex, and caste on response thresholds to sucrose and foraging behavior of honey bees (Apis mellifera L.). J. Comp. Physiol. A 185, 207–213. doi: 10.1007/s003590050379
Pankiw, T., and Page, R. E. Jr. (2000). Response thresholds to sucrose predict foraging division of labor in honeybees. Behav. Ecol. Sociobiol. 47, 265–267. doi: 10.1007/s002650050664
Paoli, P. P., Donley, D., Stabler, D., Saseendranath, A., Nicolson, S. W., Simpson, S. J., et al. (2014a). Nutritional balance of essential amino acids and carbohydrates of the adult worker honeybee depends on age. Amino Acids 46, 1449–1458. doi: 10.1007/s00726-014-1706-2
Paoli, P. P., Wakeling, L. A., Wright, G. A., and Ford, D. (2014b). The dietary proportion of essential amino acids and Sir2 influence lifespan in the honeybee. Age 36:9649. doi: 10.1007/s11357-014-9649-9
Pierce, G. J., and Ollason, J. G. (1987). Eight reasons why optimal foraging theory is a complete waste of time. Oikos 49, 111–118. doi: 10.2307/3565560
Pirk, C. W. W., Boodhoo, C., Human, H., and Nicolson, S. (2010). The importance of protein type and protein to carbohydrate ratio for survival and ovarian activation of caged honeybees (Apis mellifera scutellata). Apidologie 41, 62–72. doi: 10.1051/apido/2009055
Pyke, G. H. (1984). Optimal foraging theory: a critical review. Annu. Rev. Ecol. Syst. 15, 523–575. doi: 10.1146/annurev.es.15.110184.002515
Raubenheimer, D., Simpson, S. J., and Mayntz, D. (2009). Nutrition, ecology and nutritional ecology: toward an integrated framework. Funct. Ecol. 23, 4–16. doi: 10.1111/j.1365-2435.2009.01522.x
Roulston, T. H., and Buchmann, S. L. (2000). A phylogenetic reconsideration of the pollen starch - 676 pollination correlation. Evol. Ecol. Res. 2, 627–643. Available online at: http://www.evolutionary-ecology.com/issues/v02n05/ggar1186.pdf
Roulston, T. H., and Cane, J. H. (2000). Pollen nutritional content and digestibility for animals. Plant Syst. Evol. 222, 187–209. doi: 10.1007/978-3-7091-6306-1_10
Ruedenauer, F. A., Spaethe, J., and Leonhardt, S. D. (2015). How to know which food is good for you: bumblebees use taste to discriminate between different concentrations of food differing in nutrient content. J. Exp. Biol. 218, 2233–2240. doi: 10.1242/jeb.118554
Scheiner, R., Page, R. E. Jr., and Erber, J. (2001). The effects of genotype, foraging role, and sucrose responsiveness on the tactile learning performance of honey bees (Apis mellifera). Neurobiol. Learn. Mem. 76, 138–150. doi: 10.1006/nlme.2000.3996
Schmid-Hempel, P. (1987). Efficient nectar-collecting by honeybees I. Economic models. J. Anim. Ecol. 56, 209–218. doi: 10.2307/4810
Schmid-Hempel, P., Kacelnik, A., and Houston, A. I. (1985). Honeybees maximize efficiency by not filling their crop. Behav. Ecol. Sociobiol. 17, 61–66. doi: 10.1007/BF00299430
Schulz, D. J., Huang, Z. Y., and Robinson, G. E. (1998). Effects of colony food shortage on behavioral development in honey bees. Behav. Ecol. Sociobiol. 42, 295–303. doi: 10.1007/s002650050442
Seeley, T. D. (1995). The Wisdom of the Hive: the Social Physiology of Honey Bee Colonies. Cambridge, MA: Harvard University Press.
Sih, A., and Christensen, B. (2001). Optimal diet theory: when does it work, and when and why does it fail? Anim. Behav. 61, 379–390. doi: 10.1006/anbe.2000.1592
Speranza, A., Calzoni, G. L., and Pacini, E. (1997). Occurrence of mono- or disaccharides and polysaccharide reservesin mature pollen grains. Sex. Plant Reprod. 10, 110–115. doi: 10.1007/s004970050076
Stabler, D., Paoli, P. P., Nicolson, S. W., and Wright, G. A. (2015). Nutrient balancing of the adult worker bumblebee (Bombus terrestris) depends on the dietary source of essential amino acids. J. Exp. Biol. 218, 793–802. doi: 10.1242/jeb.114249
vanEngelsdorp, D., Evans, J. D., Donovall, L., Mullin, C., Frazier, M., Frazier, J., et al. (2009). “Entombed pollen”: a new condition in honey bee colonies associated with increased risk of colony mortality. J. Invertebr. Pathol. 101, 147–149. doi: 10.1016/j.jip.2009.03.008
Varjú, D., and Núñez, J. (1991). What do foraging honeybees optimize? J. Comp. Physiol. A 169, 729–736. doi: 10.1007/BF00194901
Vaudo, A. D., Patch, H. M., Mortensen, D. A., Grozinger, C. M., and Tooker, J. F. (2014). Bumble bees exhibit daily behavioral patterns in pollen foraging. Arthropod. Plant Interact. 8, 273–283. doi: 10.1007/s11829-014-9312-5
Wells, H., and Wells, P. H. (1986). Optimal diet, minimal uncertainty and individual constancy in the foraging of honey bees, Apis mellifera. J. Anim. Ecol. 55, 881–891. doi: 10.2307/4422
Keywords: Apis mellifera, Bombus terrestris, intake target, nutritional homeostasis, p:c ratio, pollen, nectar, foraging
Citation: Hendriksma HP, Toth AL and Shafir S (2019) Individual and Colony Level Foraging Decisions of Bumble Bees and Honey Bees in Relation to Balancing of Nutrient Needs. Front. Ecol. Evol. 7:177. doi: 10.3389/fevo.2019.00177
Received: 09 January 2019; Accepted: 02 May 2019;
Published: 21 May 2019.
Edited by:
James P. Curley, University of Texas at Austin, United StatesReviewed by:
Brian R. Johnson, University of California, Davis, United StatesJose A. Masero, University of Extremadura, Spain
Copyright © 2019 Hendriksma, Toth and Shafir. This is an open-access article distributed under the terms of the Creative Commons Attribution License (CC BY). The use, distribution or reproduction in other forums is permitted, provided the original author(s) and the copyright owner(s) are credited and that the original publication in this journal is cited, in accordance with accepted academic practice. No use, distribution or reproduction is permitted which does not comply with these terms.
*Correspondence: Harmen P. Hendriksma, aGFybWVuaGVuZHJpa3NtYUBnbWFpbC5jb20=