 John H. Boyle
 Dino Martins2,3
 Naomi E. Pierce
- 1Department of Organismic and Evolutionary Biology, Museum of Comparative Zoology, Harvard University, Cambridge, MA, United States
- 2Mpala Research Centre, Nanyuki, Kenya
- 3Turkana Basin Institute, Stony Brook University, Stony Brook, NY, United States
- 4East African Herbarium, Botany Department, National Museums of Kenya, Nairobi, Kenya
The association between the African ant plant, Vachellia drepanolobium, and the ants that inhabit it has provided insight into the boundaries between mutualism and parasitism, the response of symbioses to environmental perturbations, and the ecology of species coexistence. We use a landscape genomics approach at sites sampled throughout the range of this system in Kenya to investigate the demographics and genetic structure of the different partners in the association. We find that different species of ant associates of V. drepanolobium show striking differences in their spatial distribution throughout Kenya, and these differences are only partly correlated with abiotic factors. A comparison of the population structure of the host plant and its three obligately arboreal ant symbionts, Crematogaster mimosae, Crematogaster nigriceps, and Tetraponera penzigi, shows that the ants exhibit somewhat similar patterns of structure throughout each of their respective ranges, but that this does not correlate in any clear way with the respective genetic structure of the populations of their host plants. A lack of evidence for local coadaptation in this system suggests that all partners have evolved to cope with a wide variety of biotic and abiotic conditions.
Introduction
Few fields have benefited from the increasing ease of DNA sequencing as much as phylogeography, the study of the geographic distribution of genetic lineages (Beheregaray, 2008; Edwards et al., 2015). Phylogeography has typically focused on the characteristics of a single species, and the phylogeography of species interactions, particularly tight-knit symbioses, is lagging behind. The population genetic dynamics of both partners in a symbiosis have been assessed in relatively few systems, primarily in macrobe-microbe interactions. In such symbioses, a wide range of possible outcomes has been described: population structures may be broadly congruent, as in a fungus-beetle symbiosis (Roe et al., 2011) or certain kinds of lichen associations (Werth and Scheidegger, 2012; Widmer et al., 2012). Such congruence may signal specialized coevolution and reciprocal adaptation of populations of hosts and their respective symbionts, or may have other explanations, such as shared vicariance events (discussed in Segraves, 2010) or co-dispersal. On the other hand, some population studies of symbiosis reveal distinct population structures between host and symbiont, as in a cnidarian-dinoflagellate mutualism (Thornhill et al., 2013), a lichen host that showed less population structure than its algal symbiont (Werth and Sork, 2010), or in the leaf-cutter ant-fungus interaction, a situation in which many host ant species associate with a single fungal symbiont (Mikheyev et al., 2006). Similar variation is also seen in the few studies of symbioses between two macroorganisms. In the ant-plant systems Leonardoxa africana (Léotard et al., 2009) or Barteria fistulosa (Blatrix et al., 2017), population genetic structure was largely congruent, while Yucca brevifolia showed more population divergence than its symbiont moths (Smith et al., 2011).
A particularly interesting system in which to study the phylogeography of both host and symbiont is the Whistling Thorn acacia, Vachellia drepanolobium (formerly referred to as Acacia drepanolobium). This tree and its several species of resident ants comprise a well-studied symbiosis that dominates savannahs throughout its range in East Africa. The ants nest only in the hollow, swollen-thorn domatia of this Vachellia species, and they receive extrafloral nectar from the host tree. In return, the ants typically attack other organisms that browse on or venture onto the trees, thereby deterring herbivores and potential enemies (Hocking, 1970; Madden and Young, 1992). This system has been well-studied in Laikipia County, Kenya in many different respects: as ants of different species compete to occupy V. drepanolobium domatia, the system has been used to investigate possible mechanisms of species coexistence (e.g., Stanton et al., 2002; Palmer, 2004; Boyle et al., 2017). Work at the Mpala Research Centre, a field station in Laikipia, has described how ant succession over the life span of the trees results in a characteristic pattern: the average size of the trees occupied by each species follows a competitive hierarchy in which species that are the best interspecific competitors tend to occupy the largest trees, and so on, down to the least competitive species on the smallest trees (Young et al., 1997; Palmer et al., 2010). The density of V. drepanolobium trees may also matter: Stanton et al. (1999) found that C. nigriceps prunes its host tree to grow away from trees within a few meters that were occupied by different colonies (possibly to avoid their branches growing together, which could allow other, competitively dominant species easy access to the C. nigriceps colony's host tree).
Associated ant species vary in the benefits they provide to the tree as well as the costs they impose, and analyses of their interactions with their host plants at that site have yielded insights into the boundaries between parasitism and mutualism (e.g., Martins, 2010; Palmer et al., 2010; Stanton and Palmer, 2011). For instance, two species of ant provide relatively poor defense from predators (Palmer and Brody, 2007), while a third provides good defense against herbivory, but also prunes reproductive structures (Stanton et al., 1999). The final ant species defends the tree from herbivores and does not sterilize it, but may impose more subtle costs on the tree by maintaining colony sizes that have a large number of workers, which is suboptimal from the tree's perspective (Palmer and Brody, 2013).
While the system is well-described in Laikipia, Kenya, V. drepanolobium is found across East Africa, from Tanzania in the south, to Uganda in the west and southern Ethiopia in the north, although it is most abundant across the savannahs of Tanzania and Kenya, where it is largely restricted to black cotton soils. A phylogeographic survey of the V. drepanolobium system will allow us to place the research at Laikipia into a larger ecological and evolutionary context. Here we present a demographic survey of the system across central and southern Kenya, alongside a population genomic study of V. drepanolobium and its three obligately phytoecious (i.e., tree-dwelling) ant inhabitants, Crematogaster mimosae, C. nigriceps, and Tetraponera penzigi.
In this study, we aim to address three sets of questions:
First, are the demographics of V. drepanolobium and its ant symbionts similar across the system's range or not? This will tell us whether or not the dynamics described in the literature from Laikipia can be applied throughout the range.
Second, to what extent is there gene flow through the Kenyan landscape in each species, and are the population genetic structures of the tree congruent with those of its symbionts? This has been the case in other ant-plant systems, but because the tree and its ant symbionts disperse separately (at least over short ranges; the landscape scale dynamics of patch colonization in this system are unknown), some areas may represent geographic barriers to some partners but not others. The ant symbionts vary in their fine-scale colonization ability (Stanton et al., 2002); are these differences recapitulated at the landscape level?
Third, do any or all partners show phylogeographic associations with their local environments, both abiotic (i.e., temperature, rainfall) and biotic (i.e., the presence or absence of certain species or genotypes)? For instance, because individual trees will host several different ant species over their lifetimes (Palmer et al., 2010), the tree may be less sensitive to biotic conditions than it is to abiotic ones. Such particular associations could be generated by local adaptation, for instance.
Answering these questions will be important for understanding symbiosis more generally, especially non-pairwise, multi-partner symbioses. Symbioses between species often, as in this case, involve the asymmetrical exchange of different goods and services, and are typically not geographically homogenous (Stanton, 2003; Thompson, 2005). Gene flow across a geographically heterogenous landscape could result in local maladaption of migrant genotypes, potentially promoting lower dispersal, plastic developmental or behavioral strategies, or both. However, our practical understanding of the consequences of this complexity on population structure and gene flow is still lagging. Here we address this question by investigating the phylogeography of V. drepanolobium and its three common, obligate ant associates.
Materials and Methods
Site Survey
Between 2013 and 2016, we surveyed V. drepanolobium and its ant associates at 10 sites in Kenya (Table 1; Figure 1). These sites included five in the highlands east of the Great Rift Valley and five in or around the Rift itself. The Rift Valley is a central feature of Kenyan geography. The Eastern Rift Valley runs through the middle of Kenya, from Lake Turkana in the north to the Tanzanian border in the south. Its formation began approximately 20 million years ago as the African tectonic plate began to split apart, a process that continues to this day (Chorowicz, 2005). The difference in elevation between the relatively low-lying sites in the Rift and the highlands sites outside the Rift can be as much as a kilometer (Table 1), and the valley is separated from the highlands by a steep escarpment. The Rift Valley thus may be a barrier to gene flow in organisms including plants (Omondi et al., 2010; Ruiz Guajardo et al., 2010), insects (Lehmann et al., 1999) and vertebrates (Arctander et al., 1999; Ahlering et al., 2012).
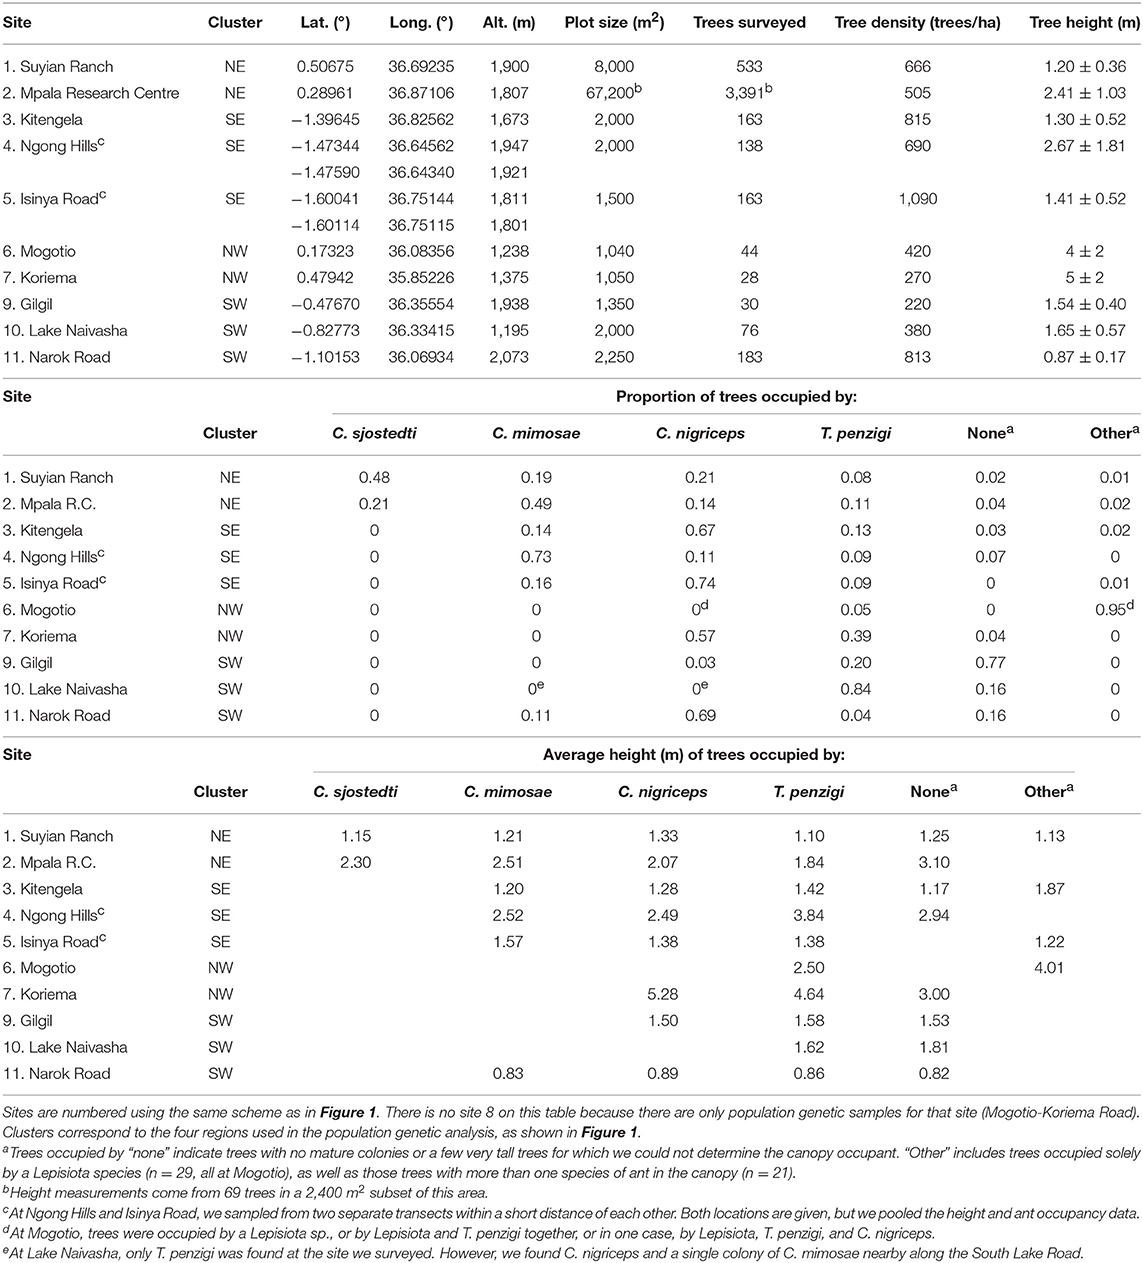
Table 1. Demography of the V. drepanolobium-ant association varies throughout Kenya (survey data collected 2013–2016).
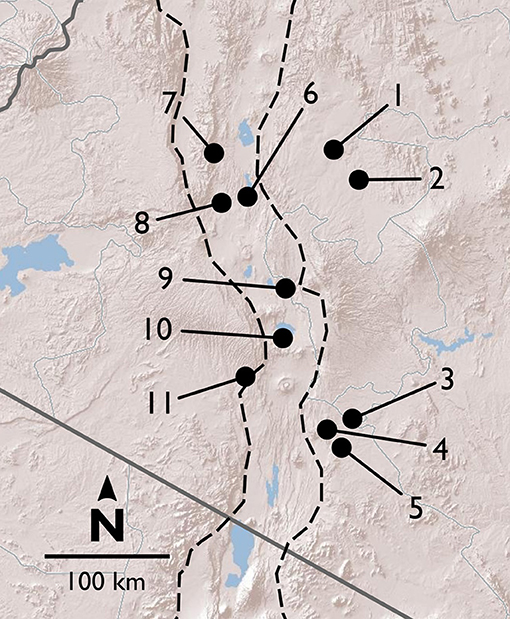
Figure 1. Map of field sites in and around the Rift Valley in central and southern Kenya (Rift shown by dashed lines). Terrain image: Esri (2009).
Northern highlands east of the Rift:
1. Suyian Ranch.
2. Mpala Research Centre.
Southern highlands east of the Rift:
3. Kitengela.
4. Ngong Hills.
5. Isinya Road.
In and around the Rift: North.
6. Mogotio.
7. Koriema.
8. Mogotio-Koriema Road (population genetic samples only).
In and around the Rift: South.
9. Gilgil.
10. Lake Naivasha.
11. Narok Road (no population genetic samples).
At most of the sites, we surveyed a transect at least 0.15 ha in area, measuring every tree ≥ 1.0 cm diameter at 0.5 m above the ground. At Koriema and Gilgil, the patch of undisturbed habitat containing V. drepanolobium was smaller than this, so we surveyed every V. drepanolobium tree in these locations and then calculated the area they occupied. Within these transects, we recorded the height off the ground of the highest point in the canopy, the stem diameter at 0.5 m above the ground, and ant occupant of each tree. Ants were easily distinguished from each other due to their body shape and coloration. At the site at Mpala Research Centre, we surveyed 6.7 ha of the Mpala CTFS-ForestGeo plot (Anderson-Teixeira et al., 2015) for tree number and ant occupant, and a 0.24 ha subset of that area for ant occupant, and for tree number, height, and diameter. When the canopies of two trees were entangled, we counted this as a single tree for the purpose of measuring V. drepanolobium density, as ants could move freely between them without having to leave the canopy; in these cases, and when a single tree had multiple stems 0.5 m above the ground, we recorded the diameter of the single largest stem, and the height of the tallest point in the combined canopy.
As we have a single time point for each site, we are unable to measure directly interspecific dynamics such as the competitive hierarchy among the ants. However, we were able to analyze an indirect measurement, namely, the average height of trees occupied by each species, which correlates with the competitive hierarchy at Mpala (Palmer et al., 2010).
Collections
Between 2012 and 2014, mainly at the sites described above, we collected tissue from V. drepanolobium and its three primary ant associates, C. mimosae, C. nigriceps, and T. penzigi. These sites included five sites in the highlands east of the Rift Valley and five in, or adjacent to, the Rift (we were not able to include a sixth Rift site, Narok, in the population genomic analysis because we surveyed this site after the other sites, in 2016, but we include the demographics for this site; for sample sizes see Table 2; File S1). We did not include a fourth ant associate, Crematogaster sjostedti, in our population genetic study because we found it on V. drepanolobium trees only in Laikipia, at two adjacent sites, Suyian Ranch and Mpala Research Centre. V. drepanolobium leaf samples were dried and stored in desiccant, while workers of each species of ant were collected into 95–100% ethanol or into a buffered salt solution. C. mimosae and C. nigriceps colonies have been reported to spread across multiple trees (average colony size: 4.5 and 2.5 trees, respectively, at Mpala, Palmer et al., 2010). Wherever possible, we collected workers of the same species from trees at least 5 m apart. This reduces, although it does not eliminate, the possibility of collecting multiple samples from a single colony spread across multiple trees.
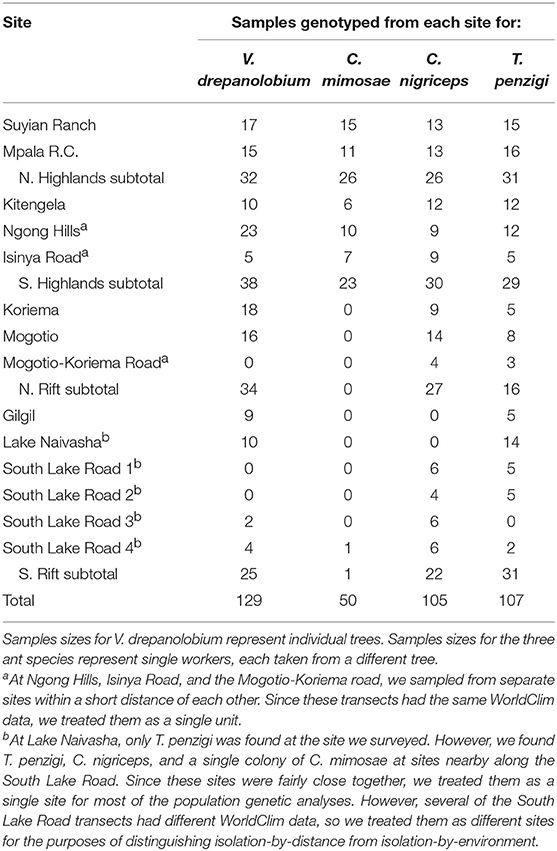
Table 2. Sample sizes for population genomic analyses.
DNA Extraction and Sequencing
Throughout our DNA extraction and sequencing protocols, we followed the manufacturer's recommended protocols except where modified below.
We extracted DNA from individuals using an AutoGenprep 965 Tissue/ES Cell DNA Extraction Kit (AutoGen). For V. drepanolobium, we extracted DNA from a few leaflets for each individual. For the ant species, we considered ants collected from different trees to be members of different colonies, and extracted from a single worker per colony. We used the AutoGenprep Mouse Tail protocol for animal tissue. For extractions of V. drepanolobium gDNA, we modified this to lyse the cell walls by performing the lysis step using the CTAB buffer of Cullings (1992), to which was added 5 μL/mL β-mercaptoethanol. Genomic DNA was stored at −20°C before use. The amount of genomic DNA was then increased by whole genome amplification, using Multiple Displacement Amplification via the REPLI-g mini kit (Qiagen) in 15 or 20 μL reactions.
We used the double-digest restriction-site associated DNA sequencing (RADseq) protocol of Peterson et al. (2012), but modified their protocol in the following ways: we started with an (amplified) genomic DNA mass of 150 ng, which we then digested with restriction enzymes chosen to provide hundreds to thousands of markers in each species. We used EcoRI-HF and BfaI (for the ants) or EcoRI-HF and MspI (for V. drepanolobium) (New England Biolabs). Bead cleanups throughout the protocol were performed with a MagNA bead solution which we made following the description of Rohland and Reich (2012). For bead cleanups, we added 1.5X volume of MagNA beads, but otherwise followed the protocol provided with Agencourt AMPure beads. We used the 48 inline indices for EcoRI described in the Sequences-S1 spreadsheet in the supplement of Peterson et al. (2012). We chose a range of 264–336 bp for the size selection step, which we performed using 2% ethidium bromide cassettes on a Sage Science Pippin Prep machine. The final PCR was set for 10 cycles.
These libraries were then sequenced in 100 bp, single-end reads on an Illumina HiSeq 2000 and 2500 at the Harvard University Bauer Core Facility.
DNA Sequence Alignment and Base-Calling
To demultiplex the Illumina libraries, as well as to align reads across worker ants and call single nucleotide polymorphisms (SNPs), we used the program Stacks version 1.21 (Catchen et al., 2011, 2013). For software analyses, we used the default parameters except where described. Reads were demultiplexed using the process_radtags function of Stacks, rescuing barcodes and RAD-tags, and disabling checking if the RAD site was intact.
We quality filtered reads using the FASTX-Toolkit version 0.0.13 (http://hannonlab.cshl.edu/fastx_toolkit/). For each read, the first seven basepairs, including the EcoRI-HF restriction site and two often-low-quality bases, were removed using the fastx_trimmer tool. The trimmed reads were then quality-filtered using the fastq_quality_filter tool, removing any reads with a quality score of <25 at more than 2% of bases.
We then aligned all reads for all individuals within each species using the denovo_map.pl script of Stacks, allowing 2 mismatches between loci when processing a single individual, and 2 mismatches when building the catalog. We also explored several other values for these parameters; the values given above gave the best combination of a larger number of alleles without large increases in heterozygosity which could indicate that different loci were being improperly combined (see File S2 for details). To build the final matrix of SNPs, we culled individuals for which sequencing had failed or had produced too low coverage to be useful, removing roughly a third of the individuals of each species. We called SNPs using the populations program of Stacks. We adjusted the stacks “-r” parameter to produce a similar number of markers (around 1,000) within each species, but with variable amounts of missing data for each species. The -r parameter defines what proportion of the individuals within a species must have sequences for a give SNP for that SNP to be included in the data set. We filtered out sites with an unusually high heterozygosity (i.e., over 0.6), required a minimum minor allele frequency of 0.02, and outputted only a single, randomly-selected SNP per RADseq fragment. Although individuals varied in the degree to which they had missing data, individuals with high and low amounts of missing data were distributed fairly evenly across sites (File S3).
We also explored the effects of missing data on our results by producing two additional SNP data sets: In one, the “r” parameter was kept constant at 0.6 across all species, producing a variable number of SNPs for each species, but similar amounts of missing data. We used the same individuals as in the first data set. In the final data set, we used a subset of the individuals from the first two data sets, and included SNPs only if they were found in 100% of individuals within each species. This produced a matrix with no missing data. The following analyses were also performed using the additional two data sets. The results for these additional data sets were congruent with the original data set, and are presented in File S3.
Genetic Clustering Analysis
We performed a genetic clustering analysis using Admixture 1.3.0 (Alexander et al., 2009), using PGDSpider 2.1.1.5 (Lischer and Excoffier, 2012) and Plink 1.07 (Purcell et al., 2007) to reformat data for Admixture. We first determined the appropriate number of genetic clusters within each species using the cross-validation procedure implemented in Admixture (Alexander and Lange, 2011), performing 5-fold cross-validation, considering possible cluster sizes from 1 to 10, and selecting the cluster size with the lowest cross-validation error. We then used Admixture to calculate the ancestry fractions of each cluster for each individual.
For V. drepanolobium, we tested whether trees assigned to a particular genetic cluster were more commonly occupied by colonies of a particular ant species: although trees at Mpala are occupied by multiple species over the course of their lifespans (Palmer et al., 2010), this is not necessarily the case across the range. We assigned each individual tree to a single genetic cluster according to which cluster provided the majority fraction of ancestry, and treated the nearby Lake Naivasha and South Lake Road sites as a single location. For each genetic cluster, we performed a multinomial exact goodness of fit test to determine whether the distribution of ant occupants within each genetic cluster was different from expected. To determine the expected ant-occupancy frequencies for each of the tree's genetic clusters, we averaged the frequency of each ant species at the sites at which that cluster was found, weighting each site by the number of trees from that cluster that were present there. We considered only those sites where trees from multiple genetic clusters coexisted, and we tested association with four categories of ant occupant: C. mimosae, C. nigriceps, T. penzigi, and trees empty or occupied by different species. When the expected value was zero for one of these species of ant occupant, we dropped that species from the test. We performed all exact tests using the xmulti function from the XNomial package (Engels, 2015) in R version 3.5.2 (R Core Team, 2018).
Co-inertia Analysis
We used Co-inertia Analysis (Dolédec and Chessel, 1994; Dray et al., 2003) implemented in ade4 1.7-13 (Chessel et al., 2004; Dray and Dufour, 2007; Dray et al., 2007; Bougeard and Dray, 2018) to compare the structure of our SNP data sets across species. We first performed a Principle Components Analysis (PCA) on the SNP data for each species individually. Inputs for each PCA were the allele frequencies for each sampling sites, scaled to a mean of 0 and a standard deviation of 1, with missing data replaced by the mean allele frequency, and retaining the first three axes. We then performed a co-inertia analysis between the two PCAs for each pair of species, calculating the RV coefficient, a multivariate analog to R2, and its significance using the randtest() function with 10,000 permutations. When two species were found in different sampling sites, we first subset the allele frequency tables to include only those sites held in common across the two species (before scaling and replacement of missing data).
Analysis of Molecular Variance (AMOVA)
We divided the 10 sites into four populations based on a combination of their geographic proximity and their similarity in genetic clustering as found by Admixture. As shown in Figure 1, these corresponded to northern and southern populations in and around the Rift, and northern and southern populations in the highlands east of the Rift. These four geographic regions capture the genetic clustering in the ant species extremely well (Figure 5). While V. drepanolobium shows somewhat less genetic structure, we used the same set of populations to allow for direct comparisons with its ant symbionts. For C. mimosae, only a single colony was found in any of the Rift sites; we included this colony in the southern highlands population with which it clustered.
We used an AMOVA to compare how much genetic variation was partitioned by the four geography-based populations (FCT) vs. how much population-level variation was partitioned by the collection sites within each population (FSC). We used Arlequin 3.5.2.2 (Excoffier and Lischer, 2010) to perform locus-by-locus AMOVAs, after first translating Stacks' genepop-format output files into Arlequin format using PGDSpider 2.0.9.0 in combination with a custom perl script. All such scripts used in this study are available on Dryad. Since we analyzed several data sets with varying degrees of missing data, we set Arlequin's internal missing-data threshold to 1 (i.e., to include all loci with any data). We calculated the average FSC and FCT across all loci, as well as whether each measure is significantly greater than zero, as determined with 10,000 permutations.
Population Statistics
We used Stacks to calculate observed and expected heterozygosity as well as θ (estimated as π). We calculated these values individually for each population, using the entire fragment for each locus identified above. We used Arlequin to calculate pairwise FST between each population.
Isolation by Distance and Environment
We then asked whether geographic structure was associated with environmental differences among sites, which might suggest local adaptation to abiotic conditions. To distinguish between isolation by environment and isolation by distance, we used the Multiple Matrix Regression with Randomization approach of Wang (2013a), as implemented in R by the MMRR function (Wang, 2013b), testing significance with 10,000 permutations. We characterized the environment using the bioclimatic variables for each site from the WorldClim database at 10 degree-min precision (Hijmans et al., 2005). In the case of the Lake Naivasha site, specimens were collected from five nearby locations along the South Lake Road, which differed in their WorldClim variables. We therefore treated them as separate sites for this analysis, despite their relative geographic proximity. Since the WorldClim variables are highly intercorrelated, we then performed a principle components analysis on these variables, after first scaling them to have a mean of 0 and standard deviation of 1. We categorized the environment of each site as its position on the first two principle components axes. Environmental distance was then estimated as the Euclidian distance between each site along these two axes. Geographic distances between each site were calculated using the distGeo function from the geosphere package (Hijmans, 2017). Genetic distances between each site were calculated using Nei's distance, as implemented by the dist.genpop function of adegenet 2.1.1 (Jombart, 2008; Jombart and Ahmed, 2011). All three distance matrices (genetic, geographic, and environmental) were first scaled to have a mean of 0 and standard deviation of 1.
Results
Site Survey
The sites surveyed varied substantially along several axes (Table 1, Figure 2): tree density varied about 5-fold, from 220 V. drepanolobium trees per hectare at Gilgil to a maximum of 1,090 at the Isinya Road site; trees generally grew more densely in the eastern highlands than in the sites within the Rift. At most sites the average height was 1–3 m, but at Koriema and Mogotio in the northwestern part of its range, V. drepanolobium trees averaged 4–5 m, and grew up to 10 m in height.
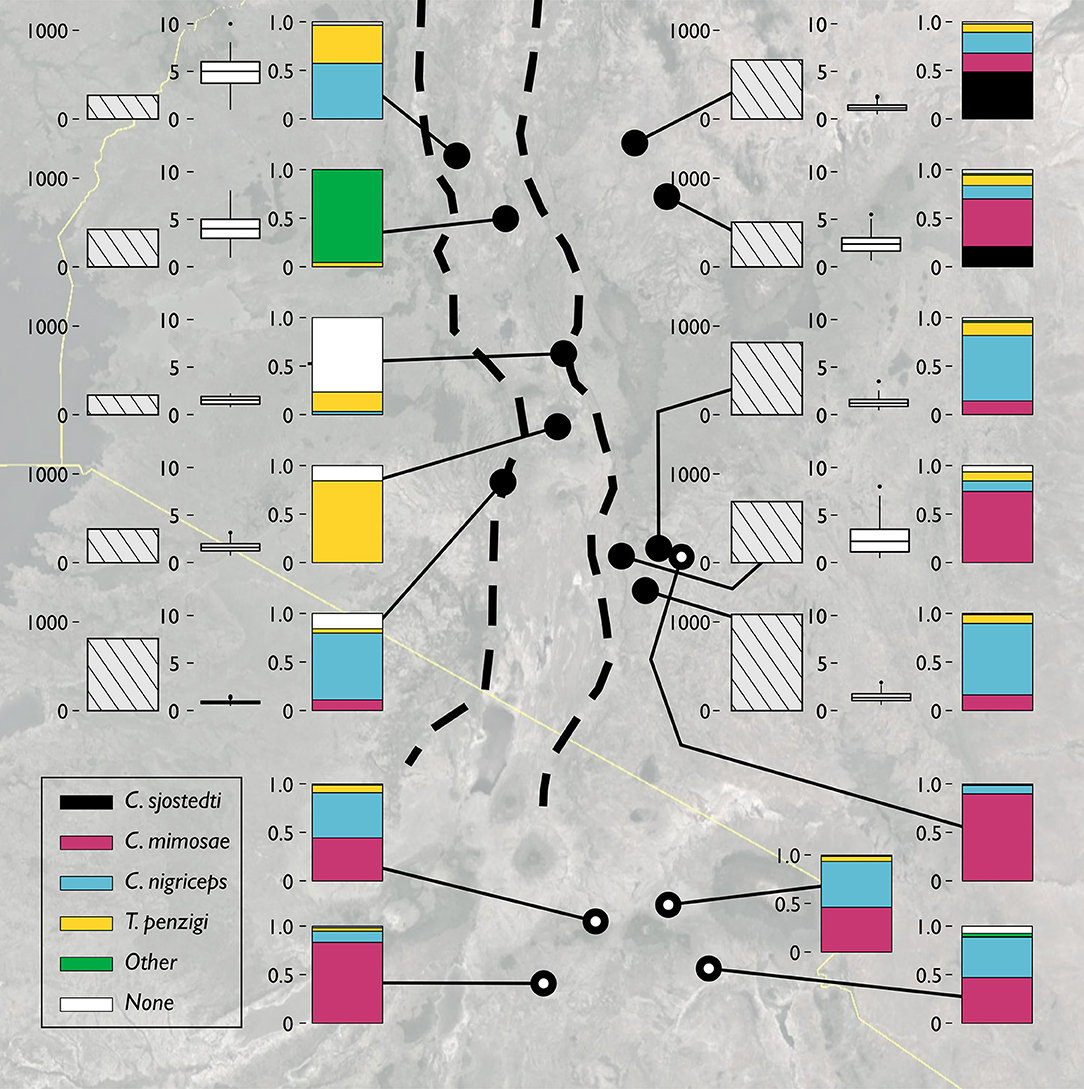
Figure 2. The V. drepanolobium ant-plant symbiosis varies across Kenya. Three plots summarize the characteristics of each site. The leftmost bar shows tree density, in trees/hectare. The middle box and whisker plot shows the distribution of tree heights (in meters) at each site. The rightmost bar shows the proportions of those trees occupied by each species of ant. “Other” indicated trees occupied by another species of ant, e.g., Lepisiota sp at Mogotio, or by more than one species of ant. “None” indicates that no colony appeared to occupy the tree. Sites marked by hollow circles are from Hocking (1970). Map image: Google, Landsat/Copernicus, US Dept. of State Geographer, Data SIO, NOAA, U.S.Navy, NGA, GEBCO.
Likewise, there was substantial variation in ant communities among sites (Figure 2). C. sjostedti was only found on V. drepanolobium trees in the northeastern sites of Suyian and Mpala. C. mimosae was more widespread, but commonly found only in the Eastern Highlands sites. In and around the Rift, C. mimosae was found rarely at Narok, and outside of that site, only a single colony was found, near the Lake Naivasha site. C. nigriceps and T. penzigi, however, were found at every location throughout the studied range. Furthermore, which ant was numerically dominant varied as well: for all four ant species, there was at least one site at which that species occupied more trees than did any other ant species.
This was also the case for which ant species occupied the largest trees; depending on the site, three different ant species occupied trees of the largest average sizes (Figure 3).
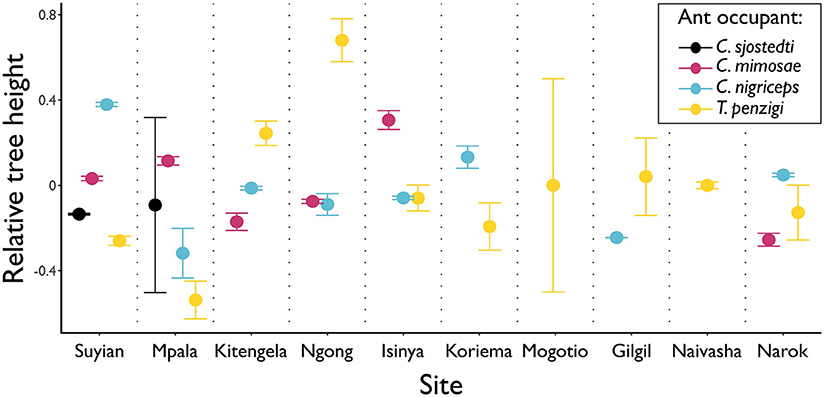
Figure 3. Different ants occupy the tallest trees at different sites. Points show the average height of the trees occupied by each ant species, at each height. Tree heights were standardized within sites (considering trees occupied by one of the four main ant symbionts) to have a mean of 0 and standard deviation of 1. Whiskers show standard error. Only T. penzigi was found at each of the ten sites measured. Three different ant species occupy the tallest trees at one or more sites: T. penzigi at five of the ten sites at which it is present (although other species are not present at all five sites); C. nigriceps at three of the eight sites at which it is present; C. mimosae at two of six sites.
DNA Sequence Alignment and Base-Calling
We successfully genotyped individuals of each species at between 1,027 and 1,122 loci (Tables 2,3).
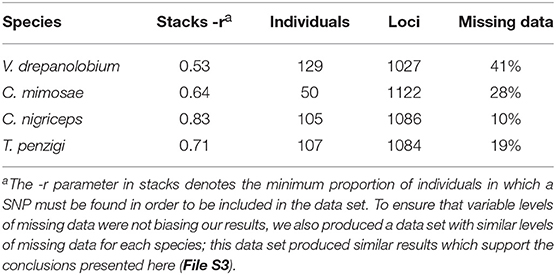
Table 3. Results of RADseq sequencing and base-calling.
Genetic Clustering Analysis
For V. drepanolobium, the identified genetic clusters were weakly correlated with geography (Figure 5). Clustering shows separation between the sites in the Northern Rift and the sites in the Northern Highlands, with the individuals in the Northern Highlands having almost all their ancestry from one cluster, and all of the individuals from the Northern Rift having ancestry from a second cluster. However, in the Southern Highlands and Southern Rift sites, individuals with ancestry from both clusters could be found even at the same site.
The ant species show a pattern that is quite different from that seen in their host tree: genetic clustering has a stronger association with geography in each case. Within each ant species, each of the four geographic areas (or two for C. mimosae) is dominated by a single cluster that is uncommon outside that region. The exception to this is T. penzigi, where the individuals from the Ngong Hills have ancestry both from the cluster that dominates the Southern Rift site, and the cluster that dominates the other Southern Highlands sites. Finally, the sole C. mimosae individual sequenced from the Rift (at Lake Naivasha) clustered with the individuals from the Southern Highlands sites.
We found no evidence that trees assigned to different genetic clusters were associated with particular ant occupants (multinomial exact tests, p > 0.1 for all).
Analysis of Molecular Variance
As shown in Table 4, AMOVA tests revealed significant genetic variation partitioned both among our geographic populations (FCT), and also among sites within those populations (FSC). This was true for all species. The species also varied in the magnitude of genetic variation partitioned among sites and populations. For V. drepanolobium and C. mimosae, both species have roughly similar FSC and FCT values. However, for C. nigriceps and T. penzigi, FCT values were much higher than FSC values. This suggests that a greater proportion of total genetic variation is partitioned by large-scale geography in the latter two species than in the former two species. In addition, the absolute value of FSC was quite high for T. penzigi, suggesting that both inter-population variation and intra-population variation are important in this species.
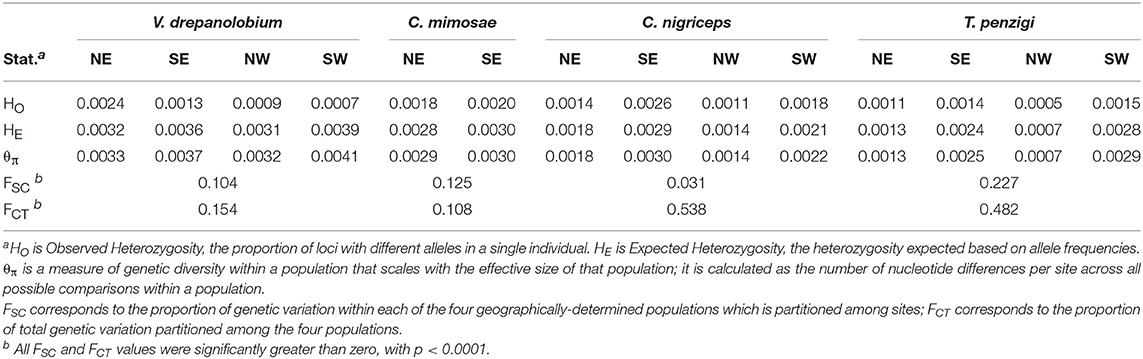
Table 4. Population genetic summary statistics for each species.
Population Statistics
V. drepanolobium populations generally have values of θ similar to those of the ants (Figure 4), while the estimates for FST for V. drepanolobium were relatively low compared to those of its ant associates (Tables 4, 5). Most of the structure in V. drepanolobium populations was between the Northern Rift (NW) population and the other three populations; FST values between the other three populations were much lower (Table 5).
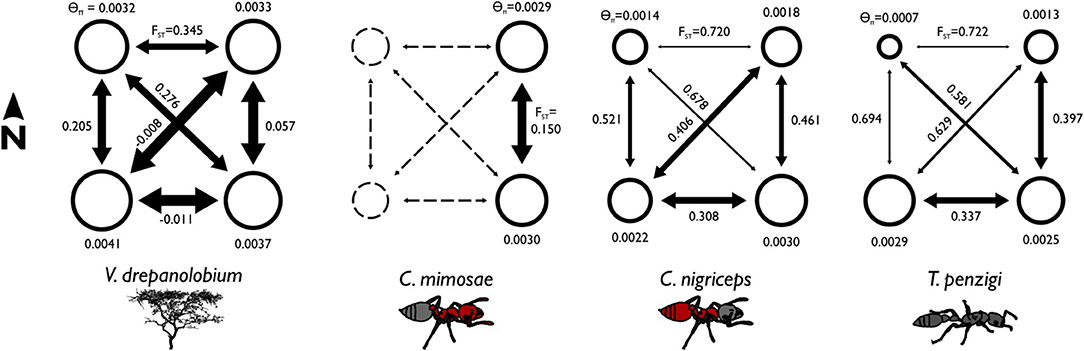
Figure 4. Summary statistics show differences in the population structure of the different species. The area of each circle is proportional to the θπ value for each population, where θπ is a measure of genetic diversity within populations that scales with effective population size. The arrows are scaled inversely to FST: FST values closer to zero indicate greater gene flow between populations. θ values are similar across species, but FST values are lower for V. drepanolobium and C. mimosae, showing high gene flow. FST corresponds to the proportion of total genetic variation seen in the two populations that is partitioned between them. Negative values result from how FST values are averaged across multiple loci; they may be read as effectively zero.
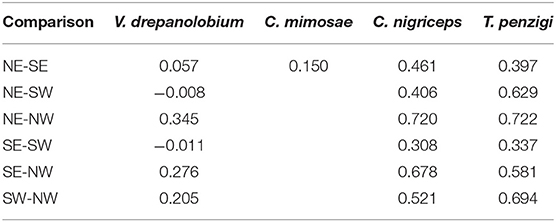
Table 5. Pairwise FST between populations for each species.
Among the ants, C. mimosae spreads the least widely across the area studied, as it is only commonly found in the Eastern Highlands sites. However, it shows much less population structure between the two Eastern Highlands sites (FST = 0.15) than do the other two ants (FST = 0.461 and 0.396; Table 5).
Co-inertia analyses found significant similarities in genetic structure between C. mimosae and C. nigriceps (RV = 1, p < 0.01) and C. nigriceps and T. penzigi (RV = 0.89, p < 0.001). The genetic structure of C. mimosae and T. penzigi was quite similar, but not significantly so (RV = 0.89, p = 0.05). The genetic structure of V. drepanolobium was not significantly similar to that of any of the ants (vs C. mimosae: RV = 0.86, p = 0.6; vs. C. nigriceps: RV = 0.57, p = 0.9; vs. T. penzigi: RV = 0.45, p = 0.5).
Isolation by Distance and Environment
For both V. drepanolobium and C. mimosae, MMRR tests found no evidence of isolation by distance or isolation by environment (V. drepanolobium IBD: p = 0.06, IBE: p = 0.3; C. mimosae IBD: p = 0.2, IBE: p = 0.9). In the case of C. nigriceps, we found evidence of both isolation by distance (p < 0.01) and isolation by environment (p < 0.05), with similar effect sizes (regression coefficient for geographic distances: 0.50; for environmental distances: 0.35). For T. penzigi, we found evidence of isolation by distance (p < 0.01, regression coefficient 0.44), but no evidence of isolation by environment (p = 0.1).
Discussion
The V. drepanolobium system shows considerable variability across its range in central and southern Kenya. Much of this variation comes from comparing the sites in the Eastern Highlands to the sites in the Rift Valley, where the tree is less common, patches are smaller and sparser, and tree heights vary greatly. However, there is substantial variation even among the eastern highlands sites, where densities, average heights, and tree biomass vary by a factor of 2 or more. Nor is the variability confined to the plant; the different ant species show equally broad differences. In particular, the four ant species found at Mpala are commonly found together only in Laikipia; we did not find C. sjostedti outside of Laikipia, and we found C. mimosae only rarely outside of the Eastern Highlands (although it is also found at lower elevations in Tanzania: Hocking, 1970). Interestingly, C. nigriceps and T. penzigi are known at Mpala to be the best able to found new colonies on empty trees, in part because their colonies produce larger numbers of alate foundress queens (Stanton et al., 2002); this relative overproduction of new foundresses may also allow them to disperse to areas like the Rift Valley that are difficult for C. sjostedti or C. mimosae to reach. Additionally variation can be found when comparing sites with similar sets of ant symbionts: among our five highlands sites, numerical dominance varied, with the plurality, or even majority of trees being occupied by any one of C. sjostedti, C. mimosae, or C. nigriceps, depending on the site.
The demographic variation we found across sites in Kenya agrees with what Hocking (1970) described in his demographic survey of four sites in Tanzania and one in Kenya (Figure 2). He also found substantial difference across sites, with two of his sites dominated by C. mimosae, and three sites split about evenly between C. mimosae and C. nigriceps. His study and this study, combined, cover the bulk of the range in which V. drepanolobium is commonly found, and show that inter-site variation is the norm for this system.
No work has been published on the competitive interactions of these ants outside of Mpala: we investigated tree size as a proxy for competitive dominance, since the two are correlated at Mpala (Palmer et al., 2010). At our site at Mpala, we found a pattern roughly similar to previous work that showed that average tree heights followed the competitive hierarchy (Figure 3; cf Palmer et al., 2010), except that C. mimosae occupied larger trees than the more competitive C. sjostedti. In this case, however, the standard error of the mean for C. sjostedti was quite large (Figure 3), so the true population mean for that species may easily have been greater than that of trees occupied C. mimosae. Moreover, competitive dynamics are known to vary even within Mpala (Palmer, 2004), so this may be a result of our survey taking place in a different year and a different location within Mpala than the previous surveys.
We did not find, however, that a similar pattern was maintained across all sites. At many sites, the largest trees were occupied by less competitively dominant ants: at the Ngong Hills, for instance, the largest trees were occupied by T. penzigi, while at Kitengela, the relationship between tree height and ant competitiveness was entirely reversed from the pattern at Mpala. These patterns may indicate that, just as the competitive hierarchy varies from site to site at Mpala, it also varies widely across the landscape. It may instead be the case that the competitive hierarchy at the other sites follows the canonical hierarchy, but that what constitutes a valuable tree varies across sites. For example, C. sjostedti and C. mimosae might occupy the most valuable trees, which at Mpala are the largest trees, but at other locations are medium-sized ones. Either case strongly suggests that the dynamics of interspecific competition among the ants is context dependent and varies strikingly across the landscape.
This wide variation across Kenya in the demography of different symbiotic partners is also seen in the genetic analyses. The estimates for FST for V. drepanolobium were low relative to those of the ants (Tables 4, 5), suggesting fewer barriers to gene flow for the tree than for its ant associates. Most of the structure in V. drepanolobium populations was between the Northern Rift population and the other three populations; FST values between the other three populations were much lower.
The Rift Valley plays an important role in the genetics of other African acacias (Omondi et al., 2010; Ruiz Guajardo et al., 2010), and it may explain the low levels of gene flow between the Northern Rift population and the two highland populations for V. drepanolobium, C. nigriceps, and T. penzigi. However, the Rift as a barrier to gene flow does not explain the high FST between the two Rift sites in V. drepanolobium, nor the relatively low FST between the Southern Rift and the highlands regions in V. drepanolobium, C. nigriceps, and T. penzigi. This suggests that the barrier effect of the Rift may vary across its length, or possibly that the Rift does not constitute a strong barrier to gene flow for this system, and some other feature of the landscape separates the Northern Rift population from the other three.
Population structure varied widely between V. drepanolobium and its ant associates. Although all of the species showed substantial population structuring, V. drepanolobium had less structure than did its ant inhabitants: genetic clusters were spread across several different regions in Kenya (Figure 5), and many sites had individuals with ancestry from multiple clusters, producing relatively low values of FST. These clusters were not associated with particular ant inhabitants, and the overall pattern differed from the patterns observed for each of the different ant species, which exhibited much stronger geographic structuring. Most genetic clusters for the ant species were commonly found only in a single region of Kenya, and comprised almost all of the individuals within that region, leading to relatively high FST values. The results of our co-inertia analyses confirm that the population genetic structure of the tree does not strongly resemble that of the ants. The high levels of population structure in the ants may be due to their status as obligate associates of V. drepanolobium. Our four major populations are separated by regions in which the black cotton soils favored by V. drepanolobium are rare. V. drepanolobium can be found outside of black cotton soils at a low frequency, although they are apparently common enough to allow gene flow from one plant population to another. However, they may be sufficiently rare that ant foundresses have difficulty finding them in the landscape, and must compete for these rare “stepping stone” trees with foundresses of other species, decreasing the rate of gene flow within each ant species.
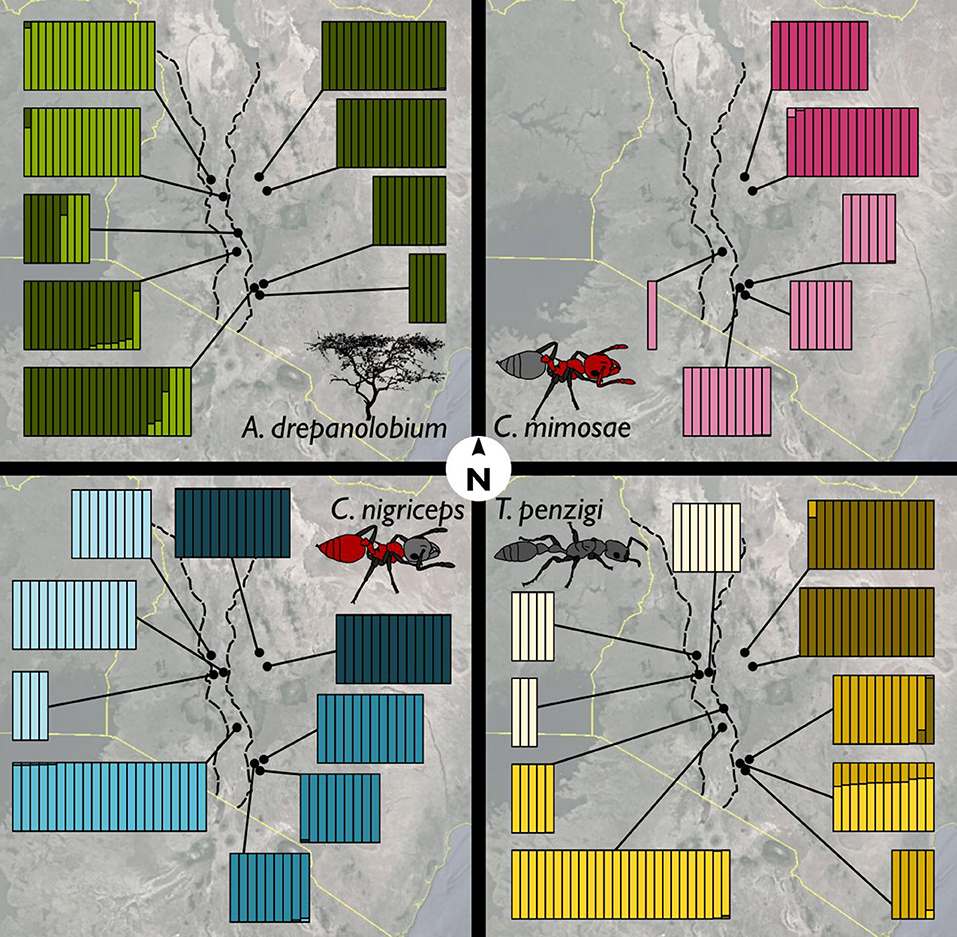
Figure 5. Ants showed more population genetic structuring than did V. drepanolobium. Facets show the Admixture results for (clockwise from upper left) V. drepanolobium, C. mimosae, T. penzigi, and C. nigriceps. Each vertical bar represents an individual tree or ant colony, and is divided up into different colors according to its estimated ancestry proportion of each genetic cluster. The number of genetic clusters for each species was determined via the Admixture cross-validation procedure. Map image: Google, Landsat/Copernicus, US Dept. of State Geographer, Data SIO, NOAA, U.S. Navy, NGA, GEBCO.
Among the ants, co-inertia analysis and summary statistics suggested that C. nigriceps and T. penzigi have roughly similar population structures, and are both somewhat different from C. mimosae. C. mimosae spreads the least widely across the area studied, as it is only commonly found in the Eastern Highlands sites. However, it shows much less population structure between the two Eastern Highlands sites (FST = 0.15; Table 5) than do the other two ants (FST = 0.461 and 0.396), suggesting that the Eastern Highlands region poses lower barriers to gene flow for C. mimosae than it does for C. nigriceps and T. penzigi (although co-inertia analysis suggests that population structure in the Eastern Highlands region is similar between C. mimosae and C. nigriceps, even if the barriers that produce that structure are lower for C. mimosae). We still do not have a clear understanding of which characteristics of each ant make them stronger or weaker long-distance dispersers over various parts of the Kenyan landscape.
The species also vary in terms of which populations contain the most diversity. In V. drepanolobium and C. mimosae, diversity values (θπ) are roughly similar among the different populations within each species; however, in C. nigriceps and T. penzigi, the southern populations have higher diversity values than the northern populations, possibly because they are larger, or they may experience gene flow from the Tanzanian populations to the south which we were unable to sample. θ values should be compared across species with caution, however, since θ is a product of effective population size multiplied by four times the mutation rate, which is unknown for the three ant species in question, or eight times the mutation rate for V. drepanolobium, which is tetraploid (Bukhari, 1997).
Variation in the population genetics of partners in a symbiosis is not unknown, especially in macrobe-microbe mutualisms (Werth and Sork, 2010; Thornhill et al., 2013), but little evidence along these lines has been gathered for ant-plants or other macrosymbioses. In contrast to our results, Léotard et al. (2009) found congruent genetic signatures for the ant plant Leonoardoxa africana ssp. africana and its two ant symbionts, the defensive mutualist Petalomyrmex phylax and the non-defending Cataulacus mckeyi. Likewise, Blatrix et al. (2017) found largely congruent patterns between the ant plant Barteria fistulosa and its symbiont, Tetraponera aethiops. Blatrix et al. (2017) found that population structure was weaker in the ants than in the trees, whereas we found that population structure was stronger in the ants than in the trees. Clearly much work remains to determine whether any general patterns exist, but our results here suggest that the wide diversity of patterns seen in macrobe-microbe mutualisms (e.g., lichens) is also seen in larger scale symbioses, like ant-plants.
The genetic structure of the V. drepanolobium system is particularly interesting because of how demographically heterogeneous the symbiosis is across its range: if gene flow were limited through this region, we might expect populations at each location to be adapted to the unique local conditions; while if gene flow were widespread, we would predict adaptations that allow plasticity in the face of a variety of possible conditions. In this case, we found little evidence that the genetic structure of V. drepanolobium and/or its associated ants is associated with local environmental differences. Only for C. nigriceps did we find significant isolation-by-environment, suggesting that this ant species may be more locally adapted to environmental conditions than are the other species. It will be interesting to explore further to see which environmental conditions particular populations of C. nigriceps are adapted to. We also found little evidence of local coadaptation by partners of the symbiosis at each site. We discount this possibility for several reasons: first, the genetic clusters of the tree are not associated with particular ant species. Second, the genetic clusters of the tree are not distributed in the same pattern as the genetic clusters of the ants. This is perhaps not surprising, since individual trees (representing different lineages) of V. drepanolobium at Mpala have been well documented to interact with multiple different lineages of each ant species over the course of its lifetime (Palmer et al., 2010), reducing the opportunity for specialized coevolution between particular lineages of V. drepanolobium and its symbiotic ants. Furthermore, we find that different populations of V. drepanolobium include sites with extremely different ant composition. For instance, the sites at Suyian, Mpala, and Kitengela are dominated by a single genetic cluster of V. drepanolobium. However, each of these sites is dominated by a different ant species, and not all of the sites have the same ant species present. In light of this lack of local adaptation, it seems likely that all the partners in the symbiosis have experienced a wide array of different conditions at different places and times.
Many interspecific associations show variation across their geographic range and across different ecological conditions (Bronstein, 1994; Thompson, 2005), and the V. drepanolobium symbiosis appears to be an example of this kind of geographic mosaic. In light of the data presented here, it is clear that the dynamics of this association vary broadly across the Kenyan landscape. For instance, T. penzigi does not defend trees against large herbivores at Mpala (Palmer and Brody, 2007) or Kitengela (Martins, 2010); if this is true in the Rift as well, then V. drepanolobium at sites like Gilgil or Lake Naivasha, where T. penzigi dominates, are largely undefended against vertebrate herbivores. Likewise, if the competitive hierarchy is the same throughout the range, then C. nigriceps is a subordinate ant in the eastern part of the study area, but the dominant ant at sites in the Rift where C. sjostedti and C. mimosae are rare or absent. This discovery is the more striking because the V. drepanolobium system has been so well studied, producing many high-impact studies over the course of several decades (e.g., Stanton et al., 1999; Palmer et al., 2008, 2010). If such a system can contain cryptic ecological variation across its range, then this is likely the case in other, as well-studied, model systems. This is particularly important for evolutionary studies: if we are to calculate the costs and benefits to an organism of particular traits, we must understand not only the current, local environment, but also the full range of environments experienced by that organism's lineage. Systems like V. drepanolobium, where well-mixed subpopulations experience a wide variety of local conditions, force us to study the system across a number of different sites if we are to understand fully its ecological and evolutionary dynamics.
Author Contributions
JB, DM, and MP conceived the experiments. JB, DM, PM, and NP collected specimens, site data, and provided logistical support in the field. JB performed the DNA sequencing and analyses. JB and NP wrote the paper with the input of DM and PM.
Funding
Mind, Brain, Behavior Interfaculty Initiative Student Award. National Science Foundation SES-0750480. Putnam Expeditionary Fund of the Museum of Comparative Zoology, Harvard University. FQEB grant RFP-12-06 from the National Philanthropic Trust. Smith Family Fellowship, Department of Organismic and Evolutionary Biology, Harvard University.
Conflict of Interest Statement
The authors declare that the research was conducted in the absence of any commercial or financial relationships that could be construed as a potential conflict of interest.
Acknowledgments
We thank the many people who helped with fieldwork, especially Katie Berry, Ezekiel Chebii, Richard Childers, Stephen Gitau, Francis Irinye, Isaack Leting, Thomas Mojong, Julianne Pelaez, and Lori Shapiro. Many people showed us hospitality in Kenya, but particularly Anne Powys and Gilfrid Powys at the Suyian Ranch, Nani Croze and Eric Krystall at Kitengela, and the staff at the Mpala Research Centre. The RADseq technique, and much bioinformatic advice, were generously provided by Brant Peterson, Jesse Weber, and Hopi Hoekstra. Advice and support in the laboratory came from Ian Butler, Rachel Hawkins, Julianne Pelaez, Lukas Rieppel, and Maggie Starvish in the Pierce lab; and from Christian Daly, Claire Reardon, and Jennifer Couget at the Harvard Bauer Core Facility. Many of the computations in this paper were run on the Odyssey cluster supported by the FAS Division of Science, Research Computing Group at Harvard University, and in part using computing facilities at the College of William and Mary which were provided by contributions from the Nation Science Foundation, the Commonwealth of Virginia Equipment Trust Fund, and the Office of Naval Research. We are also thankful for advice on bioinformatics and analyses from Bruno de Medeiros, Seth Donoughe, Sarah Kocher, Chris Baker, David Haig, Brian Farrell, and Scott Edwards; and to Noah Whiteman and several reviewers for their comments on the manuscript. We dedicate this paper to the memory of our friend, Gilfrid Powys, who generously made his land available to us and supported our work in numerous ways throughout the duration of this research. He will be greatly missed.
Data Accessibility
The sequences used in this project are available on the NCBI SRA. V. drepanolobium sequences may be found at bioproject PRJNA544717. Sequences for the ants may be found at bioprojects PRJNA544720 and PRJNA414448. Data files and scripts used in these analyses may be found on Dryad (doi: 10.5061/dryad.sd370k0).
Supplementary Material
The Supplementary Material for this article can be found online at: https://www.frontiersin.org/articles/10.3389/fevo.2019.00206/full#supplementary-material
References
Ahlering, M. A., Eggert, L. S., Western, D., Estes, A., Munishi, L., Fleischer, R., et al. (2012). Identifying source populations and genetic structures for savannah elephants in human-dominated landscapes and protected areas in the kenya-tanzania borderlands. PLoS ONE 7:e52288. doi: 10.1371/journal.pone.0052288
Alexander, D. H., and Lange, K. (2011). Enhancements to the ADMIXTURE algorithm for individual ancestry estimation. BMC Bioinform. 12:246. doi: 10.1186/1471-2105-12-246
Alexander, D. H., Novembre, J., and Lange, K. (2009). Fast model-based estimation of ancestry in unrelated individuals. Genome Res. 19, 1655–1644. doi: 10.1101/gr.094052.109
Anderson-Teixeira, K. J., Davies, S. J., Bennett, A. C., Gonzalez-Akre, E. B., Muller-Landau, H. C., Wright, S. J., et al. (2015). CTFS-ForestGEO: a worldwide network monitoring forests in an era of global change. Glob. Chang. Biol. 21, 528–549. doi: 10.1111/gcb.12712
Arctander, P., Johansen, C., and Coutellec-Vreto, M. A. (1999). Phylogeography of three closely related African bovids (tribe Alcelaphini). Mol. Biol. Evol. 16, 1724–1739. doi: 10.1093/oxfordjournals.molbev.a026085
Beheregaray, L. B. (2008). Twenty years of phylogeography: the state of the field and the challenges for the Southern hemisphere. Mol. Ecol. 17, 3754–3774. doi: 10.1111/j.1365-294X.2008.03857.x
Blatrix, R., Peccoud, J., Born, C., Piatscheck, F., Benoit, L., Sauve, M., et al. (2017). Comparative analysis of spatial genetic structure in an ant-plant symbiosis reveals a tension zone and highlights speciation processes in tropical Africa. J. Biogeogr. 44, 1856–1868. doi: 10.1111/jbi.12972
Bougeard, S., and Dray, S. (2018). Supervised multiblock analysis in R with the ade4 package. J. Stat. Softw. 86, 1–17. doi: 10.18637/jss.v086.i01
Boyle, J. H., Martins, D. J., Pelaez, J., Musili, P. M., Kibet, S., Ndung'u, S. K., et al. (2017). Polygyny does not explain the superior competitive ability of dominant ant associates in the African ant-plant, Acacia (Vachellia) drepanolobium. Ecol. Evol. 8, 1441–1450. doi: 10.1002/ece3.3752
Bronstein, J. L. (1994). Conditional outcomes in mutualistic interactions. Trends Ecol. Evol. 9, 214–217. doi: 10.1016/0169-5347(94)90246-1
Bukhari, Y. M. (1997). Nuclear DNA amounts in Acacia and Prosopis (Mimosaceae) and their evolutionary implications. Hereditas, 126, 45–51.
Catchen, J., Hohenlohe, P. A., Bassham, S., Amores, A., and Cresko, W. A. (2013). Stacks: an analysis tool set for population genomics. Mol. Ecol. 22, 3124–3140. doi: 10.1111/mec.12354
Catchen, J. M., Amores, A., Hohenlohe, P., Cresko, W., and Postlethwait, J. H. (2011). Stacks: building and genotyping Loci De Novo from short-read sequences. G3 Genes Genom. Genet. 1, 171–182. doi: 10.1534/g3.111.000240
Chessel, D., Dufour, A. B., and Thioulouse, J. (2004). The ade4 package – I: One-table methods. R News 4, 5–10.
Chorowicz, J. (2005). The East African rift system. J. Afr. Earth Sci. 43, 379–410. doi: 10.1016/j.jafrearsci.2005.07.019
Cullings, K. W. (1992). Design and testing of a plant-specific PCR primer for ecological and evolutionary studies. Mol. Ecol. 1, 233–240. doi: 10.1111/j.1365-294X.1992.tb00182.x
Dolédec, S., and Chessel, D. (1994). Co-inertia analysis: an alternative method for studying species-environment relationships. Freshwater Biol. 31, 277–294 doi: 10.1111/j.1365-2427.1994.tb01741.x
Dray, S., Chessel, D., and Thioulouse, J. (2003). Co-inertia analysis and the linking of ecological data tables. Ecology 84, 3078–3089. doi: 10.1890/03-0178
Dray, S., and Dufour, A.-B. (2007). The ade4 package: implementing the duality diagram for ecologists. J. Stat. Softw. 22, 1–20. doi: 10.18637/jss.v022.i04
Dray, S., Dufour, A. B., and Chessel, D. (2007). The ade4 package — II: two-table and K-table methods. R News 7, 47–52.
Edwards, S. V., Shultz, A. J., and Campbell-Staton, S. C. (2015). Next-generation sequencing and the expanding domain of phylogeography. Folia Zool. 64, 187–206. doi: 10.25225/fozo.v64.i3.a2.2015
Engels, B. (2015). XNomial: Exact Goodness-of-Fit Test for Multinomial Data with Fixed Probabilities. R package version 1.0.4. Available online at: https://CRAN.R-project.org/package=XNomial (accessed April 9, 2019).
Esri (2009). World Shaded Relief [basemap]. Scale Not Given. https://www.arcgis.com/home/item.html?id=9c5370d0b54f4de1b48a3792d7377ff2 (accessed March 6, 2018).
Excoffier, L., and Lischer, H. E. L. (2010). Arlequin suite ver 3.5: a new series of programs to perform population genetics analyses under Linux and Windows. Mol. Ecol. Res. 10, 564–567. doi: 10.1111/j.1755-0998.2010.02847.x
Hijmans, R. J. (2017). Geosphere: Spherical Trigonometry. R package version 1.5-7. CRAN.R-project.org/package = geosphere
Hijmans, R. J., Cameron, S. E., Parra, J. L., Jones, P. G., and Jarvis, A. (2005). Very high resolution interpolated climate surfaces for global land areas. Int. J. Climatol. 25, 1965–1978. doi: 10.1002/joc.1276
Hocking, B. (1970). Insect associations with the swollen thorn acacias. Trans. R. Ent. Soc. London 122, 211–255. doi: 10.1111/j.1365-2311.1970.tb00532.x
Jombart, T. (2008). adegenet: a R package for the multivariate analysis of genetic markers. Bioinformatics 24, 1403–1405. doi: 10.1093/bioinformatics/btn129
Jombart, T., and Ahmed, I. (2011). adegenet 1.3-1: new tools for the analysis of genome-wide SNP data. Bioinformatics 27, 3070–3071. doi: 10.1093/bioinformatics/btr521
Lehmann, T., Hawley, W. A., Grebert, H., Danga, M., Atieli, F., and Collins, F. H. (1999). The rift valley complex as a barrier to gene flow for Anopheles gambiae in Kenya. J. Hered. 90, 613–621. doi: 10.1093/jhered/90.6.613
Léotard, G., Debout, G., Dalecky, A., Guillot, S., Guame, L., McKey, D., et al. (2009). Range expansion drives dispersal evolution in an equatorial three-species symbiosis. PLoS ONE 4:e5377. doi: 10.1371/journal.pone.0005377
Lischer, H. E. L., and Excoffier, L. (2012). PGDSpider: an automated data conversion tool for connecting population genetics and genomics programs. Bioinformatics 28, 298–299. doi: 10.1093/bioinformatics/btr642
Madden, D., and Young, T. P. (1992). Symbiotic ants as an alternative defense against giraffe herbivory in spinescent Acacia drepanolobium. Oecol. 91, 235–238. doi: 10.1007/BF00317789
Martins, D. J. (2010). Not all ants are equal: obligate acacia ants provide different levels of protection against mega-herbivores. Afr. J. Ecol. 48, 1115–1122. doi: 10.1111/j.1365-2028.2010.01226.x
Mikheyev, A. S., Mueller, U. G., and Abbot, P. (2006). Cryptic sex and many-to-one coevolution in the fungus-growing ant symbiosis. Proc. Natl. Acad. Sci. U.S.A. 103, 10702–10706. doi: 10.1073/pnas.0601441103
Omondi, S. F., Kireger, E., Dangasuk, O. G., Chikamai, B., Odee, D. W., Cavers, S., et al. (2010). Genetic diversity and population structure of Acacia senegal (L) willd in Kenya. Trop. Plant Biol. 3, 59–70. doi: 10.1007/s12042-009-9037-2
Palmer, T. M. (2004). Wars of attrition: colony size determines competitive outcomes in a guild of African acacia ants. Anim. Behav. 68, 993–1004. doi: 10.1016/j.anbehav.2004.02.005
Palmer, T. M., and Brody, A. K. (2007). Mutualism as reciprocal exploitation: African plant-ants defend foliar but not reproductive structures. Ecology 88, 3004–3011. doi: 10.1890/07-0133.1
Palmer, T. M., and Brody, A. K. (2013). Enough is enough: the effects of symbiotic ant abundance on herbivory, growth, and reproduction in an African acacia. Ecology 94, 683–691. doi: 10.1890/12-1413.1
Palmer, T. M., Doak, D. F., Stanton, M. L., Bronstein, J. L., Kiers, E. T., Young, T. P., et al. (2010). Synergy of multiple partners, including freeloaders, increases host fitness in a multispecies mutualism. Proc. Natl. Acad. Sci. U.S.A. 107, 17234–17239. doi: 10.1073/pnas.1006872107
Palmer, T. M., Stanton, M. L., Young, T. P., Goheen, J. R., Pringle, R. M., and Karban, R. (2008). Breakdown of an ant-plant mutualism follows the loss of large herbivores from an African Savanna. Science 319, 192–195. doi: 10.1126/science.1151579
Peterson, B. K., Weber, J. N., Kay, E. H., Fisher, H. S., and Hoekstra, H. E. (2012). Double digest RADseq: an inexpensive method for De Novo SNP discovery and genotyping in model and non-model species. PLoS ONE 7:e37135. doi: 10.1371/journal.pone.0037135
Purcell, S., Neale, B., Todd-Brown, K., Thomas, L., Ferreira, M. A. R., Bender, D., et al. (2007). PLINK: a tool set for whole-genome association and population-based linkage analyses. Am. J. Hum. Genet. 81, 559–575. doi: 10.1086/519795
R Core Team (2018). R: A Language and Environment for Statistical Computing. Vienna, Austria. Available online at: http://www.R-project.org (accessed March 5, 2019).
Roe, A. D., Rice, A. V., Coltman, D. W., Cooke, J. E. K., and Sperling, F. A. H. (2011). Comparative phylogeography, genetic differentiation and contrasting reproductive modes in three fungal symbionts of a multipartite bark beetle symbiosis. Mol. Ecol. 20, 584–600. doi: 10.1111/j.1365-294X.2010.04953.x
Rohland, N., and Reich, D. (2012). Cost-effective, high-throughput DNA sequencing libraries for multiplexed target capture. Genome Res. 22, 939–946. doi: 10.1101/gr.128124.111
Ruiz Guajardo, J. C., Schnabel, A., Ennos, R., Preuss, S., Otero-Arnaiz, A., and Stone, G. (2010). Landscape genetics of the key African acacia species Senegalia mellifera (Vahl)–the importance of the Kenyan rift valley. Mol. Ecol. 19, 5126–5139. doi: 10.1111/j.1365-294X.2010.04833.x
Segraves, K. A. (2010). Branching out with coevolutionary trees. Evol. Edu. Outreach. 3, 62–70. doi: 10.1007/s12052-009-0199-z
Smith, C. I., Tank, S., Godsoe, W., Levenick, J., Strand, E., Esque, T., et al. (2011). Comparative phylogeography of a coevolved community: concerted population expansions in joshua trees and four yucca moths. PloS ONE 6:e25628. doi: 10.1371/journal.pone.0025628
Stanton, M. L. (2003). Interacting guilds: moving beyond the pairwise perspective on mutualisms. Am. Nat. 162, S10–S23. doi: 10.1086/378646
Stanton, M. L., and Palmer, T. M. (2011). The high cost of mutualism: effects of four species of East African ant symbionts of their myrmecophyte host tree. Ecology 92, 1073–1082. doi: 10.1890/i0012-9658-92-5-1073
Stanton, M. L., Palmer, T. M., and Young, T. P. (2002). Competition-colonization trade-offs in a guild of African acacia-ants. Ecol. Monogr. 72, 347–363. doi: 10.1890/0012-9615(2002)072[0347:CCTOIA]2.0.CO;2
Stanton, M. L., Palmer, T. M., Young, T. P., Evans, A., and Turner, M. L. (1999). Sterilization and canopy modification of a swollen thorn acacia tree by a plant-ant. Nature 401, 578–581. doi: 10.1038/44119
Thompson, J. N. (2005). The Geographical Mosaic of Coevolution. Chicago, IL: The University of Chicago Press.
Thornhill, D. J., Xiang, Y., Pettay, D. T., Zhong, M., and Santos, S. R. (2013). Population genetic data of a model symbiotic cnidarian system reveal remarkable symbiotic specificity and vectored introductions across ocean basins. Mol. Ecol. 22, 4499–4515. doi: 10.1111/mec.12416
Wang, I. J. (2013a). Examining the full effects of landscape heterogeneity on spatial genetic variation: a multiple matrix regression approach for quantifying geographic and ecological isolation. Evol. 67, 3403–3411. doi: 10.1111/evo.12134
Wang, I. J. (2013b). Data from: examining the full effects of landscape heterogeneity on spatial genetic variation: a multiple matrix regression approach for quantifying geographic and ecological isolation. Dryad Digit. Repos. 67, 3403–3411. doi: 10.5061/dryad.kt71r
Werth, S., and Scheidegger, C. (2012). Congruent genetic structure in the lichen-forming fungus Lobaria pulmonaria and Its Green-Algal Photobiont. Mol. Plant Microbe Interact. 25, 220–230. doi: 10.1094/MPMI-03-11-0081
Werth, S., and Sork, V. L. (2010). Identity and genetic structure of the photobiont of the epiphytic lichen Ramalina menziesii on three oak species in southern California. Am. J. Bot. 97, 821–830. doi: 10.3732/ajb.0900276
Widmer, I., Dal Grande, F., Excoffier, L., Holderegger, R., Keller, C., Mikryukov, V. S., et al. (2012). European phylogeography of the epiphytic lichen fungus Lobaria pulmonaria and its green algal symbiont. Mol. Ecol. 21, 5827–5844. doi: 10.1111/mec.12051
Keywords: Acacia drepanobium, Vachellia drepanolobium, landscape genomics, population genetics, RADseq, coadaptation
Citation: Boyle JH, Martins D, Musili PM and Pierce NE (2019) Population Genomics and Demographic Sampling of the Ant-Plant Vachellia drepanolobium and Its Symbiotic Ants From Sites Across Its Range in East Africa. Front. Ecol. Evol. 7:206. doi: 10.3389/fevo.2019.00206
Received: 14 November 2018; Accepted: 20 May 2019;
Published: 07 June 2019.
Edited by:
Melanie April Murphy, University of Wyoming, United StatesReviewed by:
Yessica Rico, Instituto de Ecología (INECOL), MexicoSevan Suni, University of San Francisco, United States
Copyright © 2019 Boyle, Martins, Musili and Pierce. This is an open-access article distributed under the terms of the Creative Commons Attribution License (CC BY). The use, distribution or reproduction in other forums is permitted, provided the original author(s) and the copyright owner(s) are credited and that the original publication in this journal is cited, in accordance with accepted academic practice. No use, distribution or reproduction is permitted which does not comply with these terms.
*Correspondence: John H. Boyle, amhib3lsZUB3bS5lZHU=; Naomi E. Pierce, bnBpZXJjZUBvZWIuaGFydmFyZC5lZHU=
†Present Address: John H. Boyle, Department of Biology, The College of William and Mary, Williamsburg, VA, United States