 Orley R. Taylor Jr.1*
 James P. Lovett2
 David L. Gibo3
 Emily L. Weiser4
 Wayne E. Thogmartin4
 Darius J. Semmens5
 James E. Diffendorfer5
 John M. Pleasants6
 Samuel D. Pecoraro7
 Ralph Grundel7
- 1Department of Ecology and Evolutionary Biology, University of Kansas, Lawrence, KS, United States
- 2Monarch Watch, Kansas Biological Survey, University of Kansas, Lawrence, KS, United States
- 3Department of Biology, University of Toronto, Mississauga, ON, Canada
- 4U.S. Geological Survey, Upper Midwest Environmental Sciences Center, La Crosse, WI, United States
- 5U.S. Geological Survey, Geosciences and Environmental Change Science Center, Denver, CO, United States
- 6Department of Ecology, Evolution and Organismal Biology, Iowa State University, Ames, IA, United States
- 7U.S. Geological Survey, Great Lakes Science Center, Chesterton, IN, United States
A basic question concerning the monarch butterflies' fall migration is which monarchs succeed in reaching overwintering sites in Mexico, which fail—and why. We document the timing and pace of the fall migration, ask whether the sun's position in the sky is associated with the pace of the migration, and ask whether timing affects success in completing the migration. Using data from the Monarch Watch tagging program, we explore whether the fall monarch migration is associated with the daily maximum vertical angle of the sun above the horizon (Sun Angle at Solar Noon, SASN) or whether other processes are more likely to explain the pace of the migration. From 1998 to 2015, more than 1.38 million monarchs were tagged and 13,824 (1%) were recovered in Mexico. The pace of migration was relatively slow early in the migration but increased in late September and declined again later in October as the migrating monarchs approached lower latitudes. This slow-fast-slow pacing in the fall migration is consistent with monarchs reaching latitudes with the same SASN, day after day, as they move south to their overwintering sites. The observed pacing pattern and overall movement rates are also consistent with monarchs migrating at a pace determined by interactions among SASN, temperature, and daylength. The results suggest monarchs successfully reaching the Monarch Butterfly Biosphere Reserve (MBBR) migrate within a “migration window” with an SASN of about 57° at the leading edge of the migration and 46° at the trailing edge. Ninety percent of the tags recovered in Mexico were from monarchs tagged within this window. Migrants reaching locations along the migration route with SASN outside this migration window may be considered early or late migrants. We noted several years with low overwintering abundance of monarchs, 2004 and 2011–2014, with high percentages of late migrants. This observation suggests a possible effect of migration timing on population size. The migration window defined by SASN can serve as a framework against which to establish the influence of environmental factors on the size, geographic distribution, and timing of past and future fall migrations.
Introduction
The eastern North American migratory population of monarch butterflies (Danaus plexippus) can migrate more than 4,000 km in late summer and early fall from breeding areas encompassing hundreds of millions of hectares across the eastern U.S. and Canada to reach Mexican overwintering sites comprising fewer than 20 hectares (Brower, 1997). The migration begins in early August at northerly latitudes and ends in Mexico as the last monarchs reach overwintering sites by early December. The migration has a leading and trailing edge with new recruits joining the migration as it progresses southward. Although we have learned much about how monarchs navigate during the migration (Reppert and de Roode, 2018), we do not understand what factors determine the pace of the migration and how migration timing may affect monarch survival during the migration. Pace here refers to the distance advanced per day and timing refers to the date at which a monarch was recorded within the migration.
To address these questions, we use data from the long-term monarch tagging program created by Monarch Watch (MW) to explore whether the fall migration from the eastern U.S. and Canada to Mexico is an orderly and predictable process, possibly associated with the daily maximum vertical angle of the sun above the horizon (Sun Angle at Solar Noon, SASN). Although there are many possible cues for monarch migration initiation and pacing, solar cues, weather effects, and daylength may be related to changes in monarch physiology and behavior that initiate and affect the pace of the migration south to Mexico (Barker and Herman, 1976; Reppert and de Roode, 2018). Here we compare the pacing of the migration determined from MW tagging records to the pace that might be associated with monarchs following spatial and temporal variation in temperature, daylength, and SASN across latitudes.
The arrival of the monarch migration at each latitude is characterized by directional flight with a distinct heading or bearing, not of just one individual, but of many monarchs (Perez et al., 1997). These arrivals overlap with the last reproductive monarchs of the previous generation and the emergence (eclosion) of new monarchs. Monarchs can be abundant before the migration begins, especially at the more northerly latitudes. Prolonged emergence of new monarchs that are the product of late-season reproduction can result in the presence of new monarchs late in the migration or even after the migration has progressed beyond a specific location. As a result of these dynamics, monarchs are typically present for 60–80 days at each latitude during the fall as shown by tagging records (Monarch Watch unpubl. data). The migration itself is more limited. It is typically about 28 days from the arrival of the leading edge of the migration to the last detection of directional flight for a specific location but can be shorter at more northerly latitudes or when migrations are delayed significantly by weather. For example, while monarchs may be abundant from 1 August through 10 October at 40° N, both dates can shift if temperatures are either below or above long-term averages during the early stages of the migration. There is little movement when temperatures are below 10°C or above 30°C.
Changes associated with the apparent path of the sun across the sky affect daily and seasonal patterns of behavior for many animal groups, including insects, crustaceans, amphibians, reptiles, mammals, and birds (Duangphakdee et al., 2009; Dingle, 2014; Lebhardt and Ronacher, 2014; Vogt et al., 2014; Mason, 2017; Warren et al., 2019). Cues from the sun, photoperiod and light polarization, for example, are processed along with other environmental characteristics, such as magnetic fields (Dreyer et al., 2018), weather, and biological time-keeping mechanisms to determine migration phenology by a variety of species (Helm et al., 2013; Åkesson and Bianco, 2017; Muheim et al., 2018). In monarchs, an internal circadian timekeeper is combined with a sense of the sun's horizontal (azimuthal) position into a time-compensated sun compass that helps maintain a consistent bearing during the migration (Perez et al., 1997; Mouritsen and Frost, 2002; Reppert and de Roode, 2018). This compass may work by sensing the angle of polarization of sunlight (e-vector) and may be supplemented by other modalities such as a magnetic compass or geomagnetic map sense that could enable navigation to the overwintering locations in central Mexico (Reppert and de Roode, 2018). The e-vector that the monarch perceives is related to the sun's vertical angle above the horizon, illustrating that the monarch's integration of information from solar signals can incorporate the sun's vertical position above the horizon as well as the sun's horizontal position (Heinze and Reppert, 2011). Temperature, photoperiod, and milkweed and nectar plant quality interact to change monarch reproductive status at the end of the breeding season, a change that typically precedes initiation of the southward migration to Mexico (Barker and Herman, 1976; Goehring and Oberhauser, 2002; Pocius, 2014). The solar signals may influence the physiological processes affecting migration by, for example, modulating release of juvenile hormone (Zhan et al., 2011).
Prior to the start of the tagging program initiated by Monarch Watch in 1992 and the Journey North monarch observation program (Howard and Davis, 2015), we lacked detailed information on the spatial and temporal dynamics of the monarch migration. It was generally known that most of the fall migrants were seen in September in the north and in October in the south, with initial arrival at overwintering locations in Mexico roughly coinciding with the Day of the Dead (2 November) (Brower, 1995). At that time, many assumed that migration pacing was mainly driven by weather.
Given the predominant north–south direction of the monarch migration and the documented ability of the monarch to sense a variety of solar cues and use them for navigation (Mouritsen and Frost, 2002), it is reasonable to consider whether solar characteristics related to latitude might play a role in the initiation and pacing of the monarch migration. Sun Angle at Solar Noon (SASN) is the sun's maximum daily vertical angle above the horizon occurring daily halfway between sunrise and sunset. Because SASN changes in a set manner through the fall season, being affected by date and latitude, it is a candidate for being a solar cue that might affect timing and pace of the fall monarch migration. Indeed, there are precedents for insects sensing and using sun angle to regulate daily activity patterns—for example, sun angle helps maintain daily activity patterns in honey bees and absconding behavior in Apis florea (Duangphakdee et al., 2009).
Taylor and Gibo formulated an hypothesis that monarch arrival at different latitudes during migration was related to sun angle. This hypothesis was formalized in a life cycle model (Feddema et al., 2004) and predicted timing of monarch arrival at different latitudes during both the spring and fall migrations as a function of sun angle. Taylor and Gibo observed that the leading edge of the early southward migration was associated with an SASN value of about 57°. For example, MW observers in Winnipeg, one of the most northerly MW tagging locations, often first reported southward flying monarchs in early August, shortly after SASN reached 57°. Monarchs typically arrived at the Monarch Butterfly Biosphere Reserve (MBBR) in the last days of October, again as the SASN value reached 57°. These observations suggest that SASN might be a cue for initiation of significant migration events throughout the yearly life cycle of the monarch butterfly and may affect the pace of the fall migration.
The sun angle hypothesis is based on MW observations that have not yet been systematically analyzed. So here we quantify MW data to assess whether tagging observations are consistent with a role for SASN in determining the initiation and pace of the southward migration to the MBBR.
We examine whether the pacing of the monarch migration, as derived from MW tagging data, is consistent with monarchs following a specific SASN or range of SASN values and, if such a relationship occurs, whether there are alternative pacing mechanisms that might be more strongly related. We specifically examine whether the migration pace might alternatively be set by monarchs following certain minimum temperatures on their way south to Mexico or whether the pace might be set by monarchs moving at a constant velocity during daylight hours. Thus, we compare rates of monarch movement derived from MW data to rates of movement we might expect if monarchs moved south to maintain a constant SASN as they reach lower latitudes, to maintain a minimum daily temperature, or to maintain a constant flight velocity during daylight hours. We refer to these three alternatives as the SASN, Temperature, and Velocity Scenarios.
To assess whether the pace of the monarch fall migration is related to the SASN, Temperature, or Velocity Scenarios, we use the location and date of tagging of >1.3 million monarchs tagged in the eastern U.S. and Canada to define the migration pace. We also examine dates and SASN values associated with tagging locations of >13,000 monarchs that were tagged in the eastern U.S. and Canada and recovered in Mexico. We use these recovery data to describe how the SASN at the time and place of tagging is related to the likelihood of a monarch's tag being recovered in Mexico to describe how migration timing might relate to overwintering population size.
Methods
The Monarch Watch Program and Tagging Protocol
The Monarch Watch Tagging Program1 began in 1992 with recruitment of volunteers to tag monarch butterflies during the fall migration season in the Midwestern U.S. The program quickly grew to include taggers covering the entire range of the monarch population east of the Rocky Mountains in the U.S. and Canada. Monarch Watch provides participants with handling and tagging instructions and guidelines for expected passage of the migration at each latitude. Volunteers tag monarchs from early August through mid-November. The 9-mm circular tags are applied to the discal cell on the underside of a hindwing, a location close to the center of gravity of the butterfly. Tags weigh 9–10 mg or about 2% the mass of a 500-mg monarch. Low recovery rates of tagged monarchs in Mexico in the early years of this program led to the development of uniquely-coded, weather-resistant tags in 1997. This newer tagging system, and a program to pay residents from the Monarch Butterfly Biosphere Reserve (MBBR) and nearby locations in Mexico for recovered tags, led to a higher tag recovery rate.
Tag Recovery
Monarchs usually begin arriving at the MBBR in the last days of October. Conspicuous colonies form by mid-November. Tags from some of the monarchs tagged in the U.S. and Canada are recovered in the MBBR. Most of the recovered tags are from dead monarchs found beneath the colonies by guides and ejido members. Because the ratio of untagged to tagged monarchs is likely >20,000:1 (Taylor, pers. obs.), search time to find a tag can be many hours. It is likely that most recovered tags are “discovered” rather than the result of active searches. To reward recovery efforts, representatives of Monarch Watch buy recovered tags from guides and residents in late winter each year. Because residents with tags often do not connect with Monarch Watch representatives each year, it can take 3–4 years to acquire most of the recovered tags from one tagging season. Monarch Watch acquires tags from all overwintering sanctuaries, especially El Rosario, the site that typically has the largest colony. Below, “recovered” or “recoveries” refers to tagged monarchs that successfully arrived at the MBBR in Mexico and whose tags were found.
The number of tags recovered in the MBBR differs among sites and years. The number tagged in the U.S. and Canada, overall size of the population, size of specific colonies and survival during the migration and through winter likely contribute to tag recovery rates. Other site characteristics that might affect recovery include understory density, accessibility of colonies, movement of the colonies during the winter season, increases in overwintering mortality, turnover in guides and economic conditions that motivate searching for tags.
Data Preparation
Taggers recorded the location, date, and sex of each butterfly tagged. Starting in 2004, participants were asked to record whether the butterflies were wild-caught or reared then tagged and released. Prior to 2004 the rearing status was less consistently reported. Some analyses in this paper are limited to data from wild-caught monarchs from 2004 to 2015 due to the possibility that recovery rates for these monarchs differ from those for reared monarchs (Steffy, 2015). Because some taggers each year failed to return their data, both the number of monarchs recorded as tagged and recovered each year is an underestimate.
Tagging locations were recorded as site names, usually a city or municipality, or occasionally a local landmark, such as a park. To affix consistent latitudes and longitudes to these location names, we geocoded all records. For each tagging, we associated sanctioned names from the Geographic Names Information System (GNIS) database of place names2 plus ZIP codes (U.S.) and postal codes (Canada) provided by taggers. We geocoded both by place name and by ZIP code/postal code whenever possible and compared results. Discrepancies of >50 km between place name-determined and ZIP code-/postal code-determined latitudes and longitudes were reexamined individually to determine a reasonable geocoded latitude and longitude. This geocoding process should identify tagging locations to within 50 km of the actual tagging location and usually much closer. The data set analyzed here includes 8,389 tagging locations with unique latitude and longitude.
As noted, the Sun Angle at Solar Noon (SASN) (Woolf, 1968) is the sun's vertical angle above the horizon, calculated at solar noon, and is the time of day when the sun is at its highest point in the sky (Figure 1). SASN varies by date and latitude. We calculated the SASN associated with the date and location where each monarch was tagged using the maptools and insol packages in R (Corripio, 2014; Bivand and Lewin-Koh, 2018; R Core Team, 2018) and formulae3. These tagging locations may not be at or near the monarch's natal origin since tagged monarchs may have migrated into an area prior to tagging. At a given latitude, SASN declines during the fall migration, as illustrated in Figure 1. This decline is related to seasonal changes in the tilt, or declination, of the earth toward the sun, with the rate of change in the tilt speeding up then slowing down during the timeframe of the fall migration. On a given day-of-the-year, SASN increases with decreasing latitude.
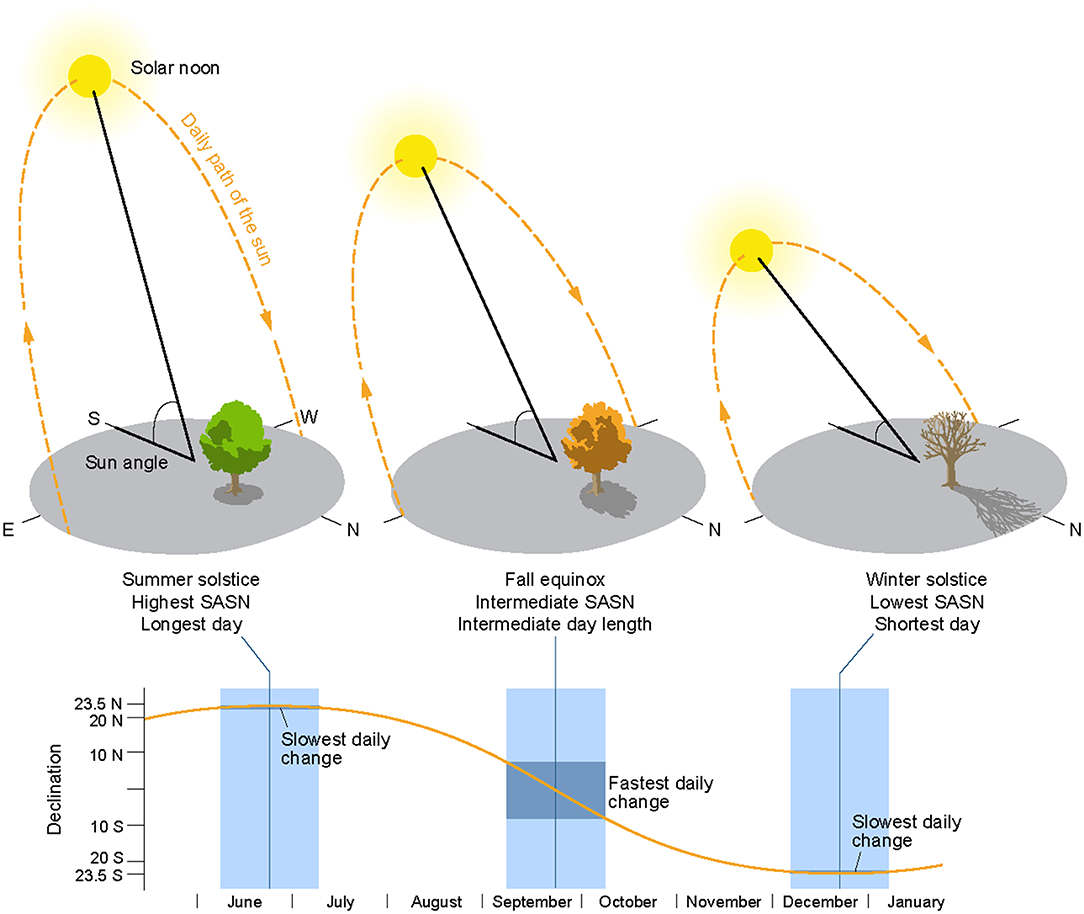
Figure 1. Sun angle at solar noon (SASN). SASN is the vertical angle of the sun above the horizon at the daily midpoint between sunrise and sunset (solar noon) as the sun traverses the sky from east to west. SASN is affected by the earth's tilt toward the sun (declination) and the latitude of observation. The graphs illustrate how declination changes during the fall migration—a slow, then fast, then slow rate of day-to-day change.
The tagging region for the eastern monarch population was the U.S. and Canada east of the Rocky Mountains (Brower, 1995)4. Taggers were instructed to tag monarchs from early August to mid-November, which we considered to be the migration period. Based on long-term observations of monarch migrations and the probabilities of reaching Mexico if tagged at a specific time and latitude, we set early and late latitude-specific dates for tagging that eliminated ~2.3% of tagged monarchs from the analysis. The early line is set from 1 August at 50° N latitude to 1 September at 25° N and the late line from 31 October at 50° N to 15 November at 25° N. Finally, we did not eliminate south Florida from the analyses, although the southernmost Florida population is considered to be largely non-migratory (Brower, 1995).
Scenarios for Predicting Monarch Movement Rates
We measured rates of movement (° latitude day−1) from the breeding grounds to the MBBR by examining how latitude of tagging changed with date. For this calculation of observed movement rates, we selected wild-caught monarchs tagged between 2004 and 2015 whose tags were eventually recovered in the MBBR. We also examined three possible scenarios that might help explain the observed movement rates and thereby the pace of the migration—monarchs following a constant SASN, following maximum temperatures, and daily movement distances proportional to daylength. Temperature affects monarch migration speed (Knight et al., 2019). Daylength affects patterns of migration across many types of insects (Denlinger et al., 2017). Although other environmental cues might be sensed and reacted to during migration, temperature and daylength are good candidates for comparing effects on migration pace with SASN. For each of the three scenarios, we predicted daily movement rates, as degrees of latitude moved per day. We compared these predicted rates to day-to-day changes in latitude of tagging.
Specifically, we estimated how daily monarch movement distances would differ if monarchs moved: (1) daily distances that would result in maintaining a constant SASN each day during the fall migration (SASN Scenario), (2) at a daily rate that would allow monarchs to experience daily maximum temperatures of 20, 25, or 30°C, based on historical temperatures (Temperature Scenario), or (3) at a constant hourly velocity during 70% of the daylight hours (Velocity Scenario). To compare the outcomes of these different movement patterns, we examined potential movement along a selected migratory pathway. The MBBR is located at ~19.5° N and 100.3° W. To maintain a constant pathway, we estimated daily movement rates for a hypothetical monarch as it moved from southern Canada (ca. 49.34° N, 100.3° W) due south along longitude 100.3° W to the MBBR, a 3,300-km migration path. However, because tagging was not conducted in Mexico, comparisons to the three explanatory hypotheses stopped near the U.S.–Mexico border, ca. 26–29° N latitude.
We compared the predicted migration rates from the three scenarios to observed movement rates along the selected migratory pathway. The observed rate of movement was calculated for wild-caught monarchs tagged between 2004 and 2015 within 10° of longitude of the 100.3° W longitude line. For each day of the year (DOY), within each year, we calculated a mean daily latitude of tagging, if at least five tagging observations were available. We then calculated a mean tagging latitude for that DOY, by averaging the yearly means across years, if at least 5 yearly means were available to be averaged. Finally, we calculated the observed rate of movement, in ° latitude day−1, by subtracting the mean latitude on a given DOY from the mean latitude on the previous DOY.
For the constant SASN scenario, we calculated two variants, one maintaining a constant 57.01° SASN starting on 7 August 2019 and the second route maintaining a 48.49° SASN starting on 2 September 2019. These two SASN values were selected to represent high (early in the migration) and average SASN values, respectively, observed in the tagging data. During the fall migration season, at a given latitude, earlier calendar dates have higher SASN. We calculated the latitude a monarch would have to reach every 5 days to maintain a constant daily SASN during this hypothetical migration. The constant SASN scenario might be thought of as a monarch reaching a latitude daily at which the sun is at a specified SASN, such as 57.01°.
For movement rate as a function of temperature (Temperature Scenario), we divided the 3,300-km route into 10 equal sections and moved the hypothetical monarch along the route to place it at the start of each section on a date during which the historical mean daily high temperature was 20, 25, or 30°C. We selected this target range for daily temperatures to represent temperatures that would be high enough during the day to be compatible with flight and with maintenance of reproductive diapause (oligopause) by females (Kammer, 1970; Pocius, 2014). Although monarchs can fly on sunny days with temperatures as low as 13°C (Masters et al., 1988), we set the target temperature for this hypothetical journey on the high end of the possible temperature range for flight under the assumption that higher temperatures are energetically advantageous. However, since monarchs frequently use thermals to gain altitude while conserving energy, temperatures at ground level can be misleading (Gibo, 1981). For each of the section-starting locations, we examined historical temperature data5 to find the date during the migration period for which the historical mean daily maximum temperature first hit 20, 25, or 30°C. Beyond latitude 26.13° N (Salinas Victoria, Nuevo Leon, Mexico), the beginning of the eighth section, daily maximum temperatures are similar across the year (e.g., August–December daily maximum range ~21–26°C at San Luis Potosi, Mexico, at the start of the ninth section). Because of this lack of variation, we extended this examination of effects of daily temperature on migration pace only from 49.34° N to 26.13° N, instead of all the way to 19.5° N at the MBBR.
For the velocity and daylength test (Velocity Scenario), our hypothetical monarch began migrating on 7 August 2019, flying at velocities of 3–15 km h−1, comparable to flight speeds documented in published and unpublished studies (Howard and Davis, 2015). As the monarch moved down the route, we calculated the minutes of daylight (sunset minus sunrise times) available at the monarch's new location and date. We assumed 70% of daylight hours were available for flying, with the rest devoted to activities such as resting and feeding. The product of the available daylight hours multiplied by flight speed then predicted the endpoint of each day's progress down the migration path.
Using geographic origins of monarchs based on an analysis of carbon and hydrogen isotopes, Wassenaar and Hobson (1998) concluded that origins of monarchs were similar among all colonies. To determine whether recovered tags represented a similar pattern, we asked how recoveries from monarchs tagged at 1-day events at one location (Lawrence, Kansas), those tagged at one location over the season for many years (Cannon Falls, Minnesota), all taggings from Iowa, and all other taggings, were distributed across the three major colony sites (El Rosario, Sierra Chincua, and Cerro Pelon) from which recoveries were obtained.
Statistical analyses were performed in R (R Core Team, 2018), including analyses of variance (ANOVA), contingency table analysis, and linear regression (Tabachnick and Fidell, 2001; Fox and Bouchet-Valat, 2019). To describe the relationship between day of year and mean latitude of tagging, we used multivariate adaptive regression spline analysis (Milborrow, 2019). This flexible regression technique models non-linear relationships by breaking a curvilinear relationship into multiple line segments, each with its own slope. We modeled other non-linear relationships, approximated by Gaussian and exponential decay curves, using SigmaPlot software (Systat Software Inc, 2008). We used root mean square error (RMSE) to quantify the difference between observed rates of movement and rates predicted by the different movement scenarios on a given day (Cort and Kenji, 2005). We compared how much variation in observed movement rates might be accounted for by the three movement scenarios (constant SASN, Temperature, Velocity) by regressing daily movement rates predicted by the scenarios on observed movement rates. We assessed the strength of relationships between the scenarios, and their interactions, and the observed rates in several ways. First, we calculated standardized regression coefficients (β) to compare relative effects of the three scenario movement rates on the observed movement rates (Tabachnick and Fidell, 2001). Second, we calculated squared semi-partial correlations (η2) that indicate how much overall fit (R2) is reduced if an independent variable, or an interaction between independent variables, is deleted from the regression (Tabachnick and Fidell, 2001).
We examine possible effects of migration timing on overwintering population size in the MBBR. The World Wildlife Fund in Mexico6 measures the area (ha) of the MBBR with substantial presence of overwintering monarchs as an index of overwintering monarch abundance. We use that area coverage as a measure of monarch abundance in the MBBR.
Results
Tagging Effort/Success and Relationship of Numbers Tagged to Monarch Abundance
Between 1998 and 2015, Monarch Watch volunteers tagged and reported on 1,385,518 adult monarchs across the U.S. and Canada east of the Rocky Mountains between 1 August and 15 November within the bounds of early and late date and latitude lines described in Methods. Of this number, 13,824 (1.00%) tags were retrieved from the MBBR and nearby locations and are termed recovered tags or simply “recoveries” or “recovered.” The remaining 99% are termed “not-recovered” or “non-recovered.” The proportion of tagged butterflies that reached the overwintering colonies but were not recovered is not known, so non-recovered tags represent both monarchs that failed to complete migration and those that successfully migrated but were not recovered at the MBBR.
From 1998 to 2015, monarchs were tagged at 8,389 unique locations (Figure 2). The abundance of monarchs, weather during the migration, the number and distribution of taggers, and tagging efforts likely affect the number of monarchs tagged. The yearly number of wild-caught monarchs tagged between 2004 and 2015 was significantly correlated (r = 0.85, n = 12, p = 0.0004) with the annual measure of hectares of trees covered with monarch clusters in the MBBR7. This result suggests that monarch abundance was a determinant of tagging numbers and that the late summer monarch population was correlated with the size of the overwintering population.
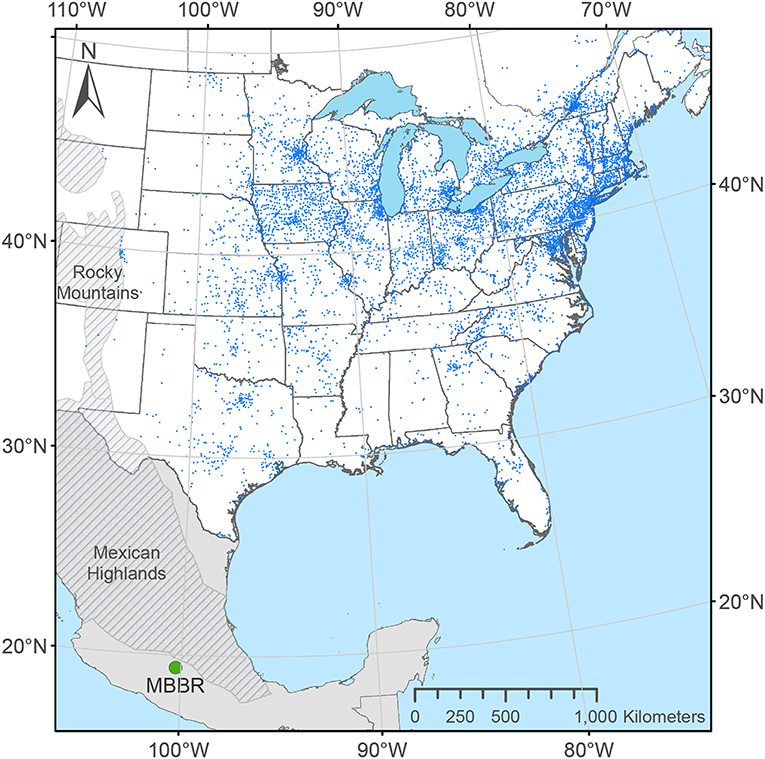
Figure 2. Distribution of 8,389 unique locations where monarch butterflies were tagged east of the Rocky Mountains in the U.S. and Canada through the Monarch Watch program from 1998 to 2015. Each dot represents a unique location determined from geocoding place names of tagging effort provided by Monarch Watch volunteers.
Recoveries of butterflies tagged at different origin locales (Cannon Falls, Minnesota; Lawrence, Kansas; Iowa; and all other U.S. and Canada locations) were distributed similarly among the three major overwintering colony sites in Mexico—El Rosario, Sierra Chincua, and Cerro Pelon (Table 1). Although the distribution of recoveries differed among these four origin locales (X2 = 27.7, df = 9, p = 0.001), about 80% of the recoveries from each of the four tagging origins were recovered in El Rosario while 7–12% were recovered from Sierra Chincua and Cerro Pelon.
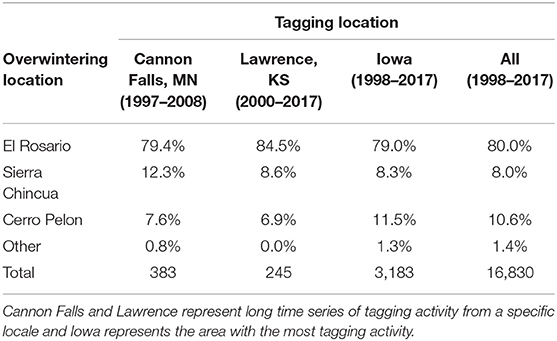
Table 1. Examples of distribution of recovered tags among locations in the Monarch Butterfly Biosphere Reserve (MBBR) representing season-long records for Cannon Falls, Minnesota, 1-day events in Lawrence, Kansas, the entire record for Iowa and for all recoveries between 1998 and 2017.
Comparison of Migration Pacing Predicted by Three Scenarios to Observed Migration Pacing
The Observed Pace of the Monarch Migration
To assess the pace of the fall migration, we calculated how mean daily latitude of tagging changed between consecutive days-of-year (DOY) (Figure 3). Because tagging data were available only in the U.S. and Canada, the pace is illustrated only as far as the U.S.–Mexico border region. The multivariate adaptive regression spline describing the relationship between mean latitude and day of the year indicated that the migration pace across latitudes was slow (0.155° day−1) from DOY 229 to 261 (17 August−18 September), increased to 0.220° day−1 for DOY 262–269 (9 September−19 September), increased further to 0.426° day−1 for DOY 270–285 (27 September−12 October), then slowed to 0.152° day−1 for DOY 286–296 (13 October−27 October). We term these rates the observed rates of daily movement. The final rate estimate (0.152° day−1) may be artefactually lowered by the southern limits of tagging (U.S.–Mexico border, ca. 26°–29° N latitude) since monarchs present below this latitude on a given day will not be available for tagging, pushing the mean latitude estimates higher. These rates correspond to ~17.2, 24.4, 47.3, and 16.9 km moved day−1, for the four DOY intervals assuming 111 km per degree of latitude, which represents the typical perpendicular distance between degrees of latitude.
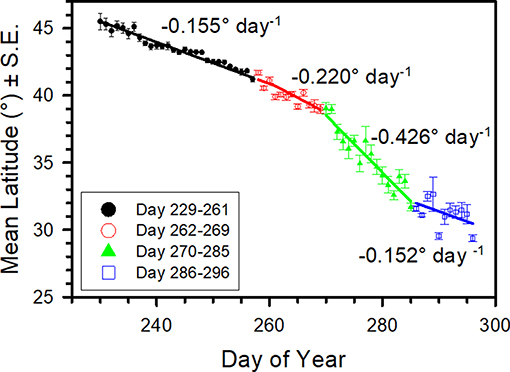
Figure 3. Mean daily latitude (°) (±S.E.) of tagging location vs. tagging day-of-year for wild-caught monarchs whose tags were eventually recovered in the Monarch Butterfly Biosphere Reserve (MBBR). Data are from 2004 to 2015 and between longitude 90–102° W. Line represents multivariate adaptive regression splines curve. Daily movement rates in ° latitude day−1 are shown for each segment of the curve.
Migration Pacing to Maintain Constant SASN, Temperature, and Velocity
Estimates of migration pacing were determined for three pacing scenarios along the 100.3° W longitude line from 49.34° N latitude to the MBBR (19.56° N latitude). Figure 4A shows the curve describing daily movement distances to maintain constant SASN vs. DOY. Two example migration situations are illustrated, a departure from 49.34° N latitude on 7 August to maintain a constant 57.01° SASN and a departure on 2 September to maintain a constant 48.49°. The daily pace needed to maintain constant SASN increases from early August until the beginning of October, peaking at about 0.39° latitude day−1 (43 km day−1) on day 274 (1 October), then decreases.
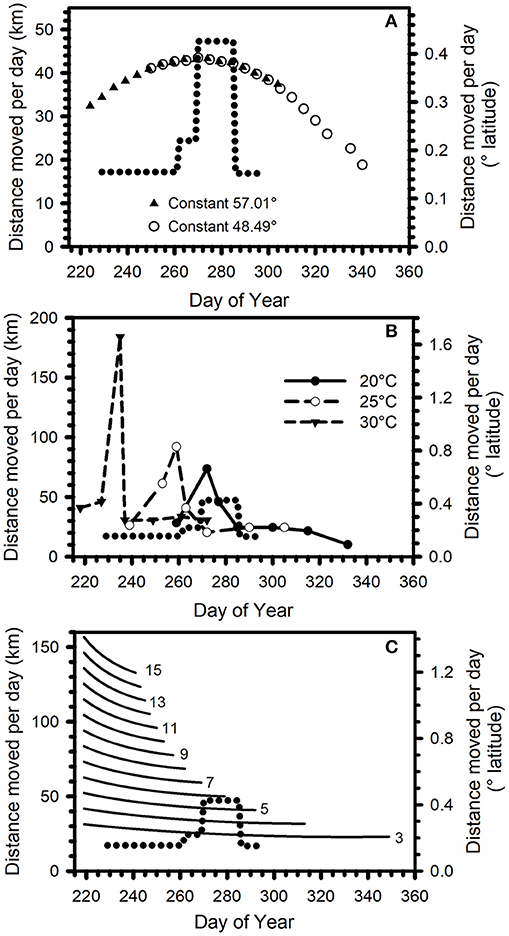
Figure 4. (A) Daily movement distance (km) or daily degrees of latitude traversed to maintain a constant 57.01° SASN (triangles) (7 August departure) and a constant 48.49° SASN (open circles) (2 September departure) on a 3,300-km migration from 49.34° N to ~19.5° N latitude along longitude 100.3° W. (B) Daily movement distance (km) or daily degrees of latitude traversed to reach locations on the first day the historical mean daily maximum temperature is 20°C (filled circles), 25°C (open circles), 30°C (filled triangles) on a 2,947-km migration from 49.34° N to 22.82° N latitude along longitude 100.3° W. (C) Daily movement distance (km) or daily degrees of latitude traversed predicted for monarchs flying at constant flight speed for 70% of the daylight hours. Shown for 7 August on a 3,300-km migration along longitude 100.3° W from 49.34° N to ~19.5° N latitude. Number next to each line represent hourly flight speeds (km h−1) (lines are in 1-km h−1 increments, every other line numbered). On each graph, dotted curve represents the daily movement rates derived from day-over-day changes in mean Monarch Watch tagging latitudes between days-of-year 229–296 as shown in Figure 3.
For the two constant SASN examples, departure on 7 August following an SASN of 57.01° requires 80 days to reach the MBBR, while a 2 September departure following 48.49° SASN takes 83 days. In each example, the pace initially increases then declines. As departure becomes later, the proportion of the trip with declining pace increases. These calculations indicate that in a constant SASN scenario, the date of reaching any latitude is predictable based on the latitude and date of tagging.
Longitude of origin will affect the distance moved per day to maintain a constant SASN. The due-south course along longitude 100.3° W represents the shortest traverse of latitudes to the MBBR. A monarch originating from longitudes east or west of 100.3° W would need to fly further per day to reach lower latitudes associated the rate of change in SASN (Table 2). The origins to the east or west of 100.3° W would not alter the general shape of Figure 4A but would increase the daily distances (i.e., magnify the Y-axis) needed to maintain the constant SASN pace.
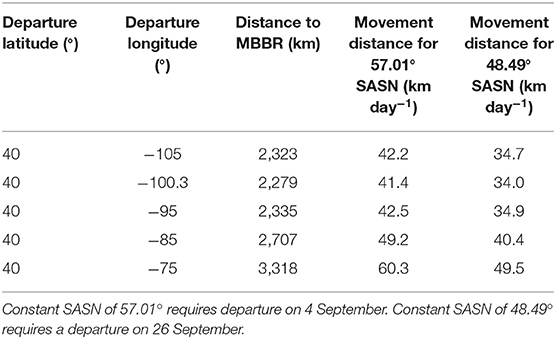
Table 2. Average daily movement distance (km day−1) needed to maintain a constant Sun Angle at Solar Noon (SASN) when leaving from different longitudes but from a constant latitude (40°) on the journey to the Monarch Butterfly Biosphere Reserve (MBBR) in Mexico.
The constant Temperature Scenario tracked daily maximum temperatures of 20, 25, or 30°C and predicted daily movement distances that initially increased, then decreased (Figure 4B). Root mean square error (RMSE) between the daily movement rate predicted by the Temperature Scenario and by the MW data was lowest, among the three Temperature Scenarios, for the 20°C scenario. For all three temperatures, there was an initial increase in daily rate of movement, a decline in movement rate, and then a period of slow daily movement.
Finally, we described migration pacing determined by daylength and flight speed. In this constant Velocity Scenario, daily movement distances gradually declined with DOY, regardless of flight speed (Figure 4C). The 3-km h−1 hourly velocity produced the lowest RMSE between the observed movement rate and the constant velocity among velocities from 3 to 15 km h−1.
RSME values of other scenario options that exceeded those of the closest fit options are not shown. Table 3 shows the regression equations predicting daily movement rates (° latitude day−1), between DOY 229 and 296, for the three scenarios.
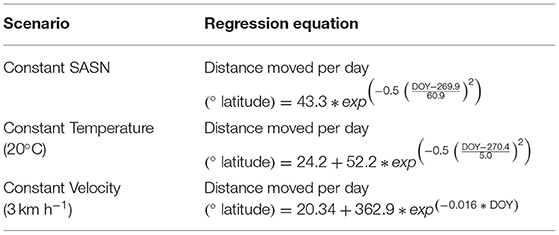
Table 3. Non-linear regression equations predicting distance monarchs would move per day, between DOY 229 and 296 (17 August–23 October), for three pacing scenarios.
Comparison of Observed Migration Pacing to Pacing Predicted by Constant SASN, Temperature, and Velocity Scenarios
The observed migration pacing to the U.S.–Mexico border between DOY 229 and 296 (17 August−23 October) increased until approximately DOY 285 then decreased (Figure 3). The constant SASN and constant 20°C Temperature Scenarios both predicted an initially increasing migration pace, followed by a decline (Figures 4A,B). The fastest pace predicted in the scenarios overlapped the DOY with the fastest observed pace. The pattern of the constant Velocity Scenario, steady decline, did not match the observed pacing pattern of increasing then decreasing pace (Figure 4C).
For each DOY between 229 and 296, mean location (° latitude) was calculated for each of the three scenarios, based on the equations in Table 3, and compared to observed mean tagging latitude on that DOY (Figure 5). Cumulatively, the SASN scenario predicted arrival to the lower latitudes earlier than the constant Temperature or Velocity Scenarios and earlier than the observed data predict. For example, the SASN model predicted monarchs arriving at ~30° N at a time that the MW observations suggested the mean latitude of the taggings to be between 36 and 38° N (Figure 5). Thus, the cumulative pacing predicted by following constant SASN was faster than for constant Temperature or Velocity and faster than observed. RMSE for the difference in daily movement distances predicted by the three scenarios compared to rates calculated from the MW observations was lowest for the constant Velocity and similar between constant SASN and constant Temperature Scenarios (Table 4). This suggests best overall fit between daily movement distances predicted by the Velocity Scenario and observed from the MW data. Nonetheless, RMSE was similar for the three scenarios, suggesting similar fits for all scenarios.
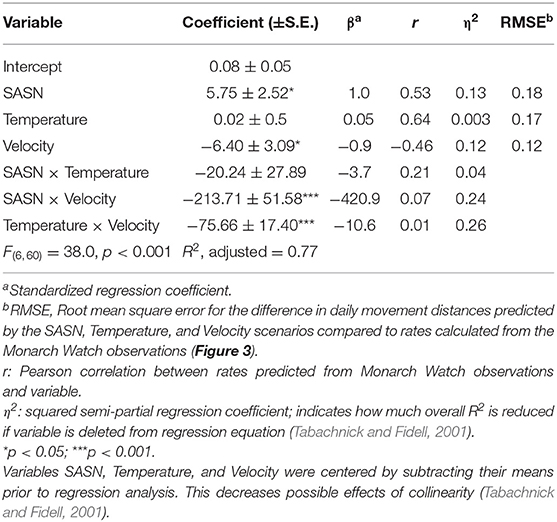
Table 4. Regression of daily movement distances (°latitude) predicted by maintaining constant SASN, constant daily maximum temperature (20°C), and constant velocity (3 km h−1) during 70% of daylight hours on daily movement distances predicted from Monarch Watch tagging data 2004–2015.
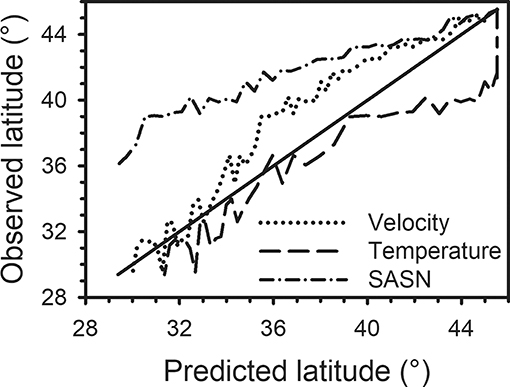
Figure 5. For each day-of-year between 229 and 296, mean location (° latitude) was calculated for each of three movement scenarios (constant SASN, Velocity, Temperature) (Predicted latitude) and graphed against observed mean tagging latitude on that day-of-year (Observed latitude). Solid line represents when predicted mean latitude and observed mean latitude were equal. On a given day-of-year, results above the solid line indicate that the predicted mean latitude was lower (i.e., further south) than observed and results below the solid line indicate the predicted latitude was greater (i.e., further north) than observed. Predicted mean latitude was based on a 2,947-km migration from 49.34° N to 22.82° N latitude along longitude 100.3° W.
Considered together in a linear regression analysis, the three scenarios accounted for 77% of the variation in the movement rates observed from the MW data (Table 4). Based on the absolute value of the standardized regression coefficients, the movement distances predicted by constant SASN and Velocity had the greatest effect on the observed movement distances and the interaction between SASN and Velocity was the interaction with the greatest effect. Based on squared semi-partial correlations, the overall fit between the scenario predictions and the observed rates of movement was most affected, in order, by the interaction between the Velocity and Temperature movement rates, the interaction between Velocity and SASN movement rates, by SASN movement rates, and by Velocity movement rates. The Temperature × Velocity interaction and the SASN × Velocity interaction accounted for 0.26 and 0.24, respectively, of the total model R2 of 0.77. SASN and Velocity individually accounted for 0.13 and 0.12 of the total model R2.
Sun Angle Differences Between Monarchs Recovered and Not Recovered at the MBBR
Recovered tags represent a subset of all monarchs tagged within the two-dimensional space defined by latitude and DOY (Figure 6). SASN values at latitude and DOY of tagging for monarchs that are recovered in Mexico were a subset of SASN values of monarchs whose tags were not recovered (Figure 7). Tags that were not recovered included monarchs that arrived at the MBBR and individuals that did not make it to the MBBR.
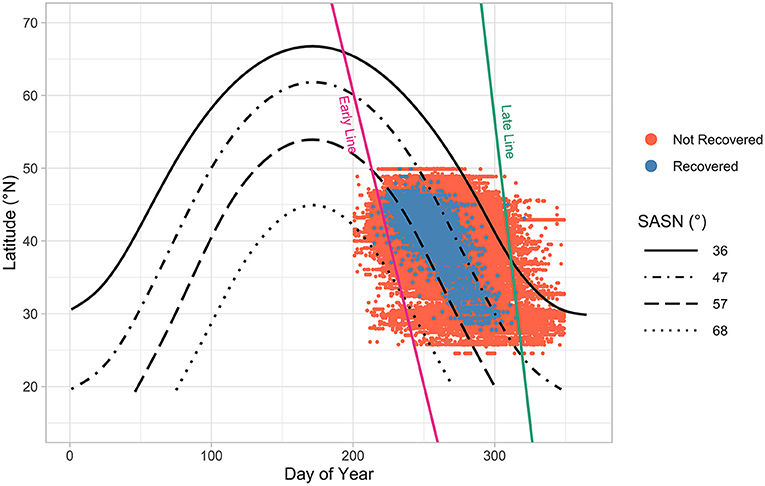
Figure 6. Distribution of tagging locations of monarchs, which extends beyond Monarch Watch's official tagging timeframe, by latitude and day-of-year (DOY 200–350, 19 July to 16 December, n = 1,411,214). Isoclines illustrate approximate limit of monarchs recovered (blue dots) (57°–47°) and not-recovered (red dots) (68°–36°) in the MBBR. Pink and green lines represent authors' estimates of the demarcation dates and locations separating monarchs that are migrating to Mexico from those that are of the previous breeding generation (left of the pink line), and butterflies with little chance of reaching the MBBR (right of the green line). Pink (early) line stretches from 1 August at 50°N latitude to 1 September at 25°N. Green (late) line stretches from 31 October at 50°N to 15 November at 25°N. Note the handful of recovered butterflies tagged left of the pink line-they may represent recently emerged monarchs tagged while “staging” before the start of the migration. Also note two recoveries to the right of the green line and the 36° SASN isocline-both may be the result of tag code or other errors, since each was tagged in November > 30 days after the last recovery for their respective latitudes. Analyses were limited to the area between the pink and green lines (n = 1,385,518).
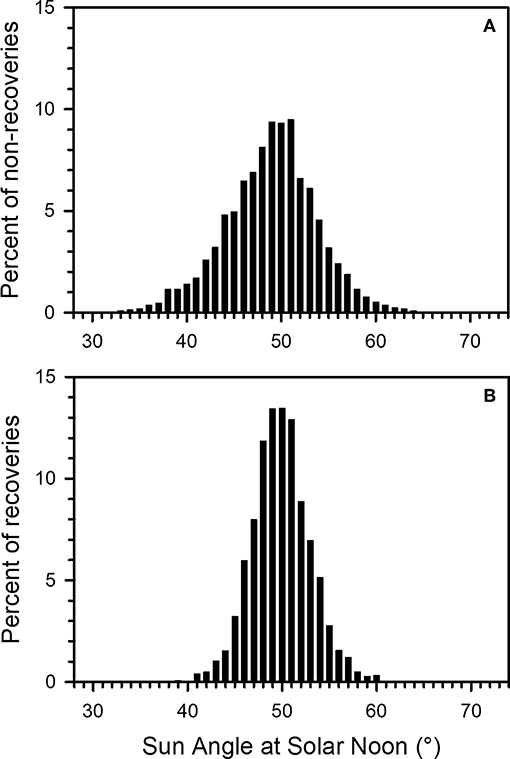
Figure 7. Distribution of Sun Angle at Solar Noon (SASN) at time of tagging for monarch tags (A) not recovered in Mexico and (B) recovered in Mexico, for wild-caught monarchs from 2004 to 2015. Y-axis is percentage of total not-recovered or recovered tags.
No recoveries occurred among monarchs with associated SASN on the day of tagging between 26.64 and 35.56° (n = 7,728, 0.56% of total tagged between 1998 and 2015) or between 64.89 and 72.25° SASN (n = 1,807, 0.13% of total). No individuals with SASN lower than 26.64° or higher than 72.25° occurred in the data set. While tagged butterflies may have been present but not detected at the MBBR, the failure to recover any tags from monarchs tagged with high (>64.89°; early migrants) and low (<35.56°; late migrants) SASN values suggests that monarchs tagged at those SASN values were unlikely to successfully complete the migration.
For the tagged wild-caught monarchs between 2004 and 2015, 90% of the SASN distribution (5th to 95th quantiles) was within the interval 40.9°–58.5° overall and within 46.0°–56.8° for recoveries. This result suggests that a SASN window of ~46°–57° at the DOY and location of tagging may be associated with successful arrival of migrating monarchs at the MBBR.
For wild-caught monarchs tagged between 2004 and 2015, a mean of 0.88% ± 0.70 (standard deviation, s.d.) (range 0.12–2.48%) of non-recoveries had SASN values greater than the maximum SASN value of recoveries and 4.81% ± 4.99 (s.d.) (range 0.18–18.78%) of non-recoveries had SASN values less than the minimum SASN value of recoveries within a year. Thus, about 0.88% of individuals that were not recovered were tagged at high SASN, or relatively early in the migration season, while about 4.81% were tagged at low SASN, or relatively late in the migration. This result suggests that more late migrants than early migrants were associated with SASN values outside of the range associated with monarchs that completed the migration to the MBBR.
Possible Effects of Migration Timing on Monarch Abundance in the MBBR
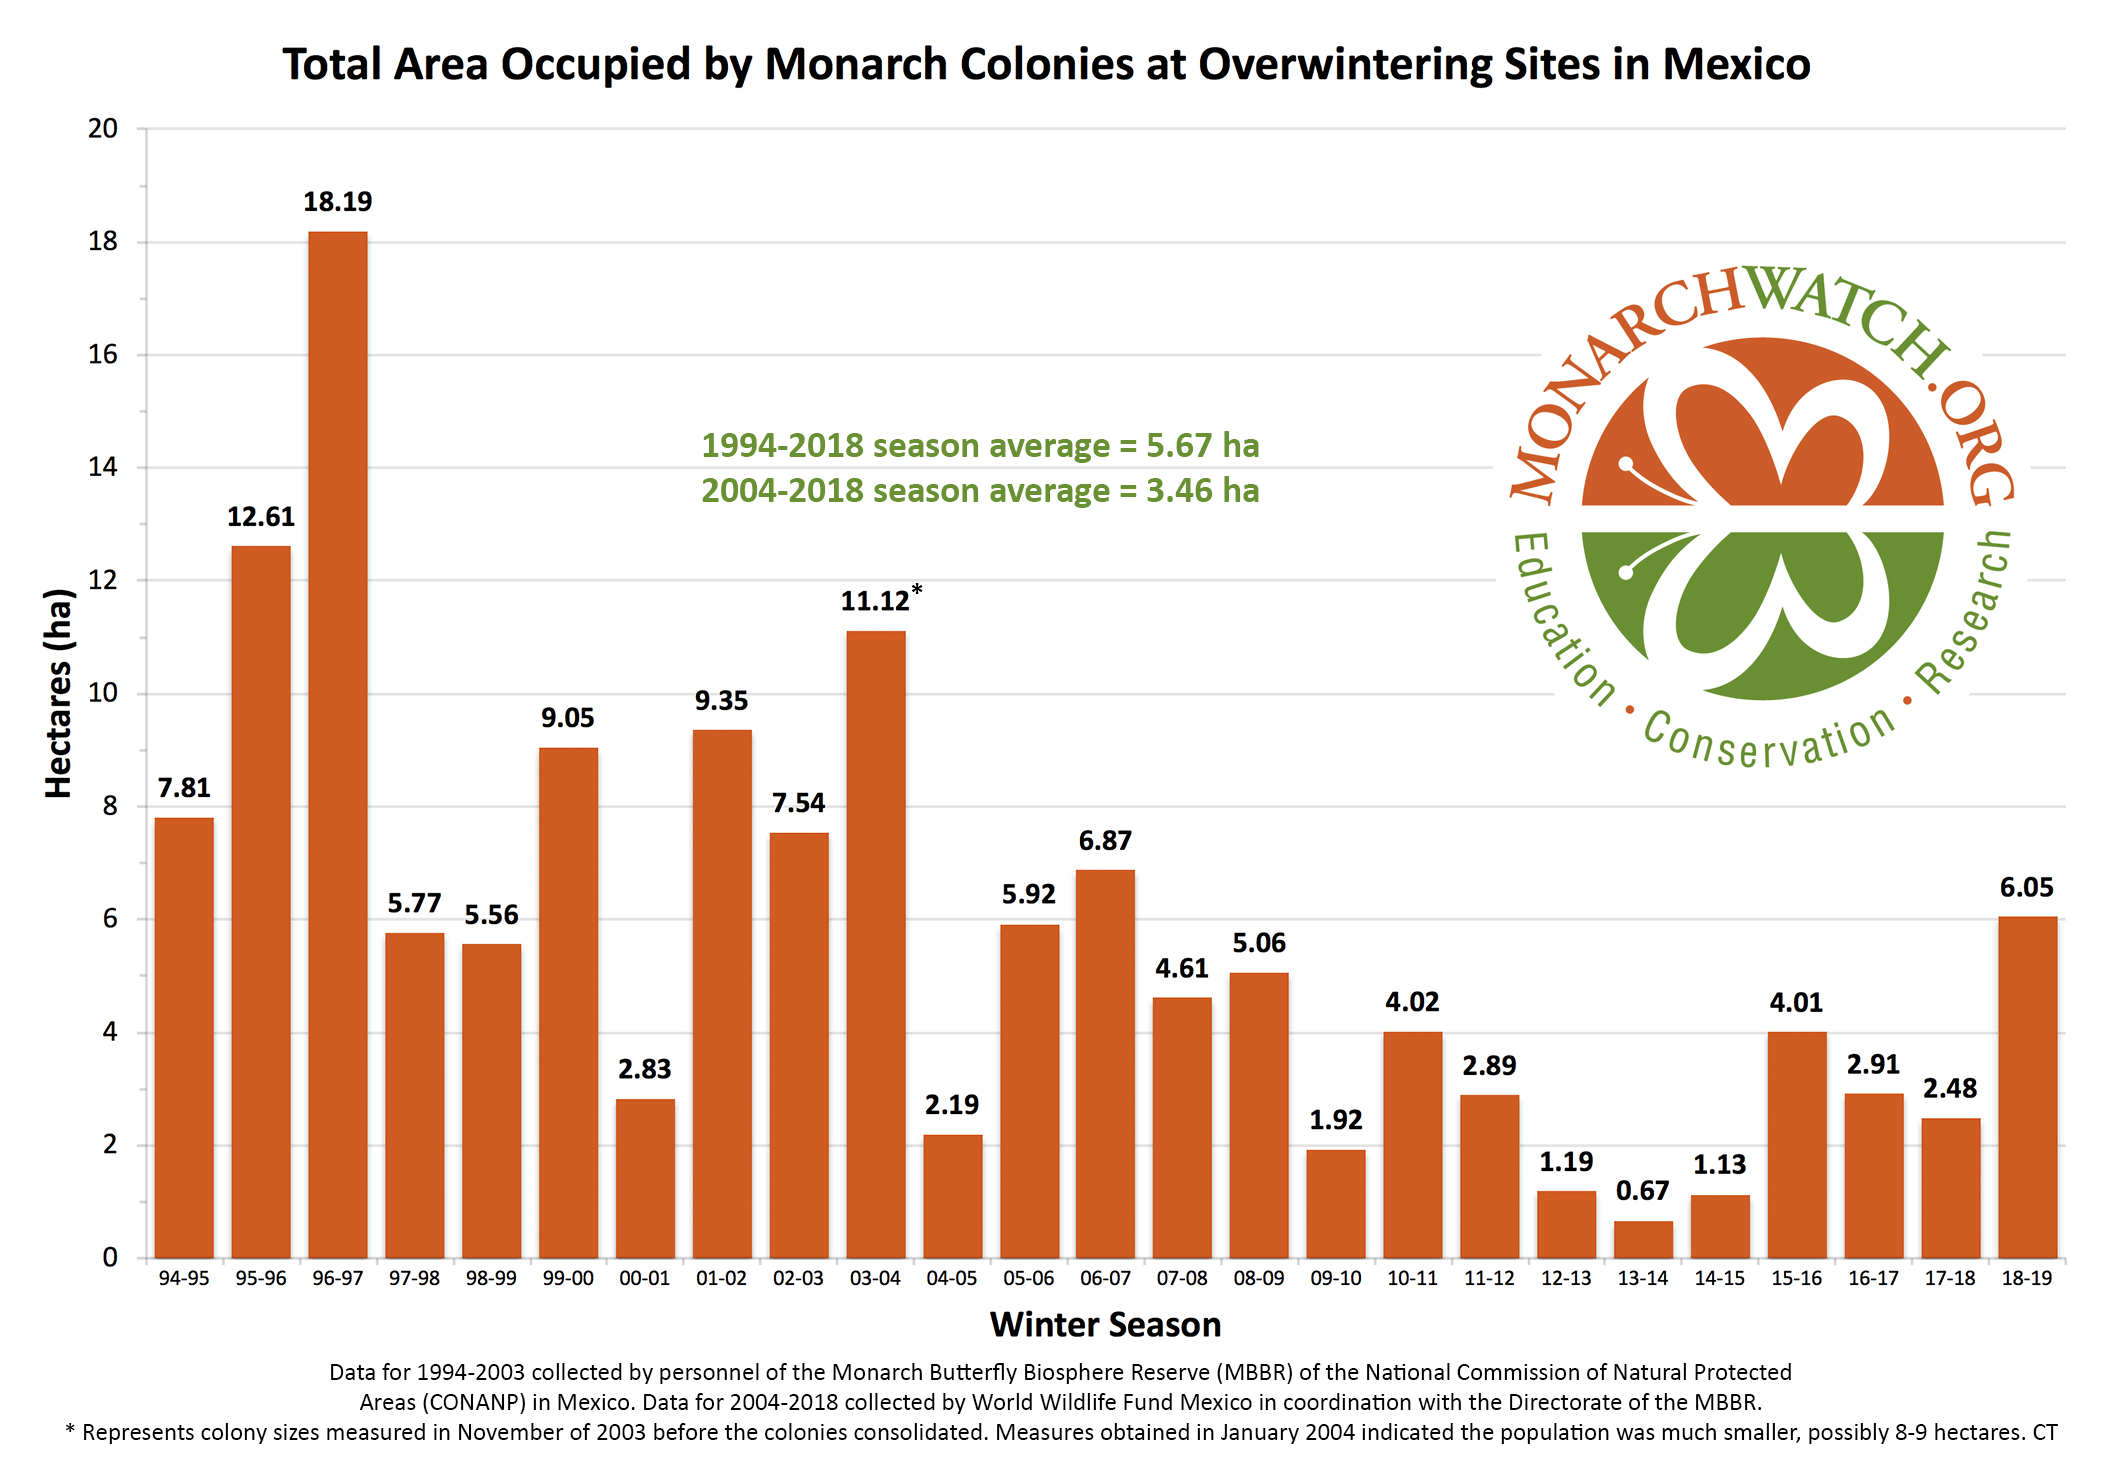
We examined whether overwintering abundance of monarchs in the MBBR, measured as area (ha) of the MBBR with substantial presence of monarchs, was related to timing of the fall migration. The years 2004 and 2011–2014 exhibited relatively high percentages of late migrants based on tagging data (Figure 8). Since late migrants have low recovery rates, these late migrations may have been associated with higher mortality during migration and thus accounted for the relatively low area cover of monarchs measured at the MBBR in those years [2004 (2.19), 2012 (1.19), 2013 (0.67), and 2014 (1.13)]. Those years represent four of the five lowest hectares of overwinter coverage recorded between 1994 and 2018, the years of data available at the time of this analysis.
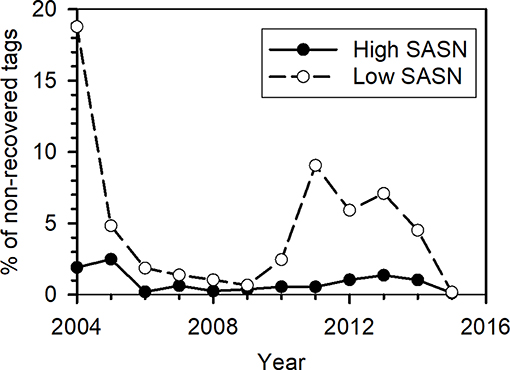
Figure 8. Percentage of not-recovered tagged monarchs for which the Sun Angle at Solar Noon (SASN) was less than the minimum (open circles) or greater than the maximum (filled circles) SASN of recovered tagged monarchs.
Mean SASN at tagging did not change significantly over the study period [F(1, 16) = 1.544, p = 0.23] and runs of values above and below the mean value of SASN were randomly distributed [Wald–Wolfowitz runs test (Caeiro and Mateus, 2014), Z = 0.97, p = 0.33], suggesting the lack of a pattern of high and low SASN values across years (Figure 9).
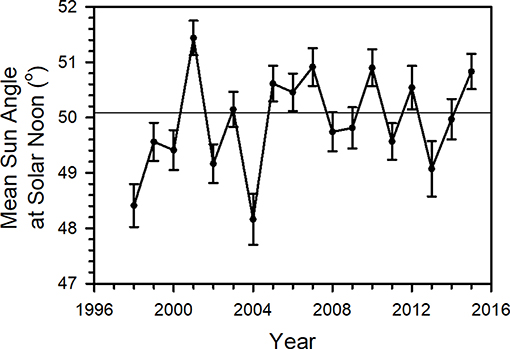
Figure 9. Mean Sun Angle at Solar Noon (SASN) (°) (±95% confidence interval) by year for all data, wild-caught and reared tagged between 1998 and 2015 in the Monarch Watch program. Horizontal line represents mean of yearly means.
Discussion
Can Following a Constant Sun Angle Predict the Pace of Monarch Fall Migration?
From August through October, the overall pace of the migration, as derived from Monarch Watch (MW) tagging data, can be characterized as slow-fast-slow, or increasing in the first part of this period then decreasing as the monarchs progress southward from northern latitudes to the Texas–Mexico border. This pacing is consistent with analyses of the day-to-day progression southward of fall monarch roosts reported to Journey North (JN) (Howard and Davis, 2015). JN roost data were analyzed for four 20-day periods from 10 August to 27 October. Those data indicated a slow migration advance in the first half of the migration period followed by faster roost advances in late September–early October. In the fourth 20-day time interval (8–27 October), which incorporates migration in Mexico, the mean rate of travel declined, but the value was not significantly different from the previous time interval (Howard and Davis, 2015). More data are needed to document pacing in this final section of the monarch migration, but the concordance between the MW and JN analyses supports a pattern of an initially slow migration pace that speeds up in the approach to south Texas and then slows down.
Taylor and Gibo (Feddema et al., 2004) hypothesized that migrating monarchs use solar cues for timing the initiation of the migration and for maintaining a migration pace. They suggested that the sun angle, the vertical angle of the sun above the horizon at the daily high point might be that solar cue because they observed that the migration pace varies by day-of-year and latitude and sun angle varies by day-of-year and latitude. We tested this sun angle hypothesis by comparing the pace of migration that would be associated with monarchs maintaining a constant daily sun angle at solar noon (SASN) to the pace derived from MW tagging data. Solar noon is the midpoint between sunrise and sunset and is when the sun is at its highest daily angle. We compared the observed pacing to the predicted pacing associated with three scenarios—monarchs maintaining a constant SASN, moving to maintain a daily maximum temperature of at least 20°C, or flying at a constant 3 km h−1 for diminishing hours of daylight per day.
Among the three migration pacing scenarios tested, the pattern of pacing increase and decrease and the peak value of daily movement distances from the SASN scenario matched well with the MW observations (Figure 4A). While the pacing pattern associated with SASN was similar to that observed from MW data, the pace predicted by SASN was overall faster than observed. The difference between the SASN and observed scenarios was mainly because the slow parts of the slow-fast-slow cycle in the SASN scenario were faster than observed. We calculated regression models that estimated how well all three scenarios accounted for variation in observed pacing. The results suggest pacing predicted from the three scenarios can account for about 77% of the variation in the observed pacing and that movement rates from the SASN and Velocity Scenarios and their interaction, plus interaction between Velocity and Temperature, accounted for most of that explained variation. Therefore, the pattern of pacing predicted by following a constant SASN, and the variation in observed pacing accounted for by following SASN, are consistent with the SASN playing a role in determining migration pacing. However, if following SASN is, in fact, an important determinant of the migration pacing, it likely interacts with other factors, such as temperature and daylength in determining the observed pacing pattern. No one of the three scenarios provided the best match with the observed pattern and overall rate of pacing but together accounted for much of the variation in pacing.
Movement distances per day for a monarch traveling at a pace to maintain a constant SASN should peak around 1 October and then slow down (Figure 4A). Predicting population pacing based on millions of monarchs potentially advancing at a rate associated with the rate of change in SASN will require further analysis, especially mechanistic analyses of monarch response to SASN.
Is Timing of the Migration Related to Overwintering Monarch Abundance?
SASN can be used as a metric that describes migration timing. Because SASN is determined by latitude and time of year, it combines these two parameters when considering how late in the migration period an event occurs. For instance, asking whether a butterfly tagged on 1 October is early or late in a typical fall migration period is not simply answered—it may be late if tagged in Canada or early if tagged in Texas. However, characterizing a tagging event or migration observation as occurring on a day and location when SASN equals 57° indicates that event occurred relatively early in the migration period, whether it is associated with initiation of migration in Canada or completion of migration upon arrival at the MBBR.
SASN values associated with monarch taggings suggest there is a temporal window across latitudes linked to successful completion of the migration to the MBBR. Ninety percent of the tags recovered in the MBBR were associated with SASN between 46.0 and 56.8° at the date and location of tagging, representing a “migration window” of SASN within which successfully completing the migration is more likely. In years with relatively high percentages of monarchs tagged at low SASN, representing late migrants, the overwintering population size in Mexico was generally low. This observation suggests a possible relationship between late migration and failure to complete the migration. A decline in migration success for later migrants has been shown in tagging records reported by Steffy (2015). A temporally and spatially defined migration window likely exists in many migratory insects, although temporally the window is often small (Bauer et al., 2011). Documenting migration windows across the animal kingdom can be critical to recognizing important changes in migration phenology that can affect survivorship during and after migration due to factors such as climate change (Cotton, 2003; Kelly et al., 2016).
The SASN-defined migration window can serve as a template that allows us to compare the relative pace of migrations among years and the pace of the migrations within specific regions. In addition, we can use the distribution of tagged butterflies across the range of SASN values, and mean SASN values, to characterize an entire migration, or regional parts of the migration, as fast or slow, early or late. We can then look for factors such as temperatures during the migration, summer temperatures and late recolonizations of the northern breeding area that may explain these differences. Although there was no significant indication in the current analysis that mean SASN values exhibited an upward or downward trend through time, a shift in the mean values to lower SASN values might occur with increasing summer and fall temperatures.
As noted, the percentage of monarchs migrating outside of the migration window of 56.8°–46.0°, if substantial, could affect monarch overwintering abundance. Monarchs tagged late in the season (low SASN) yield few tag recoveries. Although the percentages of early and late (high and low SASN, respectively) migrants varied by year, late migrants were more common than early. The percentages of late migrants were high in 2004 and 2011–2014, all years with low area coverage of monarchs overwintering in the MBBR8. Many factors may have led to these late migrations. For example, the summer of 2004 was the coldest during this period, 2012 was the earliest recorded spring over much of the monarch's eastern breeding range (Ault et al., 2013) and was followed by high summer temperatures and low precipitation. These weather patterns likely reduced monarch breeding success. The 7-month drought in Texas in 2011 may have affected monarchs completing the migration to the MBBR or surviving once there. Since extreme weather conditions in each of these years likely influenced population growth and may have, in part, led to the lateness of these migrations, linking the tagging and migration success data to population growth and physical factors should lead to a richer understanding of monarch population dynamics.
Although we present analyses that the migration timing and success are associated with the pace predicted from SASN values, it is unknown whether SASN itself determines the observed relationship between SASN and the migration pacing documented by the MW data. Monarchs could be responding to other celestial cues such as e-vectors, light intensity, or specific azimuths. It appears that the migration starts for individual butterflies when the SASN declines to about 57°, but what of butterflies that eclose later, when the SASN is 47°? These butterflies migrate, but to what stimulus are they responding and how might that stimulus be related to SASN? Again, we have much to learn about how monarchs successfully reach the overwintering sites in Mexico.
Although one of our scenarios showed that it might be possible for a monarch to maintain a reasonable pace if tracking declining SASN along longitude 100.3° W (the longitude of the MBBR), the longitude from which a butterfly starts will affect the daily pace needed to maintain a constant SASN. The further east, or west, the starting longitude is from 100.3° W, the further a monarch will have to advance daily to reach the latitude needed to maintain a constant SASN. This consideration gives rise to another question. Do monarchs originating east of 100.3° W, or later in the migration, fly longer each day to “catch up” with the pace of the changing fall conditions? Understanding the role seasonal events have on population growth and timing of both the emergence of the last generation and temperatures favoring the migration during the fall will be required to determine the dynamics that result in migratory success. Future analyses of the Monarch Watch data should help with that understanding.
While the results illustrate that we can learn much from the tagging data, these data have their limitations. Some of these limitations affect particular measures and interpretations relevant to the monarch migration; others are problems common to most citizen science projects (Brown and Williams, 2019). Although tags failing to adhere to monarch wings and effects of handling while tagging are thought to be minimal, both values could affect the results by increasing mortality during the migration and perhaps during the winter period. Lost tags could result in an underestimate of how many monarchs reach the overwintering sites. Tagging done early in the migration are more likely to apply tags to monarchs that are not yet migrating potentially leading to underestimates of recovery percentages for high SASN situations. While number of butterflies tagged can be used as a population index throughout the range, these measures are likely to result in underestimates of population size simply due to the distribution of taggers, the size of the population, weather events that limit tagging and times available to tag during the week and on weekends. For example, some areas that produce many monarchs are quite large. Low tagging rates in these areas, such as the eastern Dakotas and western Minnesota, are likely to produce underestimates of the population and number of monarchs reaching the overwintering sites in Mexico. Despite these limitations, the long time series represented by the tagging data, the geographic scope of the tagging, and the ability to associate these data with both demographic and weather patterns will continue to yield insights relevant to the dynamics of the monarch population.
Summary
The pace of monarch migration determined from Monarch Watch tagging data is initially slow at the northernmost latitudes, faster at mid-latitudes, and slows again at more southerly latitudes. That pacing pattern is similar to what would be expected for an individual monarch that maintained a constant Sun Angle at Solar Noon (SASN) throughout its migration. Whether a causal relationship exists between SASN and monarchs is not known and requires further study; however, SASN is associated with migratory success, since 90% of the recovered tags across all latitudes were tagged within a migration window defined by SASN values of 56.8°–46.0°. Years in which high proportions of monarchs were tagged after SASN reached 46.0° exhibited low overwintering numbers, suggesting negative population consequences of late migration. Diverse factors, including SASN, temperature, and daylength, likely combine to determine the pace of each monarch migration.
The migration window defined by SASN can be viewed as a template, a means of standardizing the observations among and within years, that will allow us to assess the influence of factors such as temperatures during the summer and fall, the temporal distribution of migrants and the pace of the migration. Our ability to define a migration window and describe those factors that influence the pace of the fall migration will improve our understanding of how survival during the migration affects overwintering monarch abundance.
Data Availability Statement
The datasets for this manuscript are not publicly available pending addition of additional years and further initial analyses. Requests to access the datasets should be directed to OT (Y2hpcEBrdS5lZHU=).
Author Contributions
OT created the Monarch Watch Program. JL and OT oversaw data acquisition and input. SP, JL, OT, and RG contributed to data preparation and quality control. OT, JL, DG, EW, WT, DS, JD, JP, SP, and RG contributed to the conception and design of the study and preparation of the manuscript. RG wrote the first draft of the manuscript. OT provided a major revision. RG combined co-authors' comments into the final version. All authors contributed to manuscript revision and read and approved the submitted version.
Funding
Donations to Monarch Watch were used to pay for recovered tags in Mexico. Funding from the U.S. Geological Survey Ecosystems Mission Area helped support preparation of the Monarch Watch data from 2017 to 2019, while funding from the U.S. Geological Survey Land Change Science program supported contributions from DS and JD.
Conflict of Interest
The authors declare that the research was conducted in the absence of any commercial or financial relationships that could be construed as a potential conflict of interest.
Acknowledgments
Millions of monarch butterflies do not get tagged and thousands recovered without the effort of thousands of people across eastern North America since 1992, all of whom we acknowledge and thank. We are indebted to Ann Ryan, Diane Pruden, Debbie Jackson, Gail Morris, Trecia Neal, Carol Pasternak, Janis Lentz, Sarah Schmidt, Dana Wilfong, Cathy Walters, Alfonso Alonso, Carole Jordan, Diane Seaborn-Brown, Veronica Prida, David Kust and family, and many others who helped purchase and recover tags at the overwintering sites in Mexico. We are most appreciative of the numerous donors who have contributed to the tag recovery fund over the years. Many staff members and students assisted with data management in Kansas over the last two decades and we have been aided by many data entry volunteers. We are indebted to the guides and ejido residents who diligently recovered and saved each recovered tag. We thank Jeremy Havens and Tammy Patterson for help with figures. Any use of trade, firm, or product names are for descriptive purposes only and do not imply endorsement by the U.S. Government.
Footnotes
1. ^https://monarchwatch.org/tagging
2. ^https://geonames.usgs.gov/
3. ^https://www.esrl.noaa.gov/gmd/grad/solcalc/NOAA_Solar_Calculations_dayxls. A formula for calculating sun angle (from https://www.itacanet.org/the-sun-as-a-source-of-energy/part-3-calculating-solar-angles/) is:
Where α is the sun angle, δ is the sun's declination angle which mainly varies by day of year, ∅ is the latitude, ω is the hour angle which equals zero at solar noon.
4. ^Determined from U.S. Geological Survey shapefile available at: https://water.usgs.gov/GIS/metadata/usgswrd/XML/physio.xml but with modifications to follow the Rio Grande River in the south.
5. ^https://usclimatedata.com for U.S. locations, https://weatherspark.com for Mexico locations.
References
Åkesson, S., and Bianco, G. (2017). Route simulations, compass mechanisms and long-distance migration flights in birds. J. Compar. Physiol. A Neuroethol. Sens. Neural Behav. Physiol. 203, 475–490. doi: 10.1007/s00359-017-1171-y
Ault, T. R., Henebry, G. M., de Beurs, K. M., Schwartz, M. D., Betancourt, J. L., and Moore, D. (2013). The false spring of 2012, earliest in North American record. EOS Trans. Am. Geophys. Union 94, 181–182. doi: 10.1002/2013EO200001
Barker, J. F., and Herman, W. S. (1976). Effect of photoperiod and temperature on reproduction of the monarch butterfly, Danaus plexippus. J. Insect Physiol. 22, 1565–1568. doi: 10.1016/0022-1910(76)90046-9
Bauer, S., Nolet, B. A., Giske, J., Chapman, J. W., Åkesson, S., Hedenström, A., et al. (2011). “Cues and decision rules in animal migration,” in Animal Migration: A Synthesis, eds. E. J. Milner-Gulland, J. M. Fryxell, and A. R. E. Sinclair (Oxford: Oxford University Press, 68–87.
Bivand, R., and Lewin-Koh, N. (2018). maptools: Tools for Handling Spatial Objects. R package version 0.9-4. Available online at: https://CRAN.R-project.org/package=maptools
Brower, L. P. (1995). Understanding and misunderstanding the migration of the monarch butterfly (Nymphalidae) in North America: 1857-1995. J. Lepidopterists Soc. 49, 304–385.
Brower, L. P. (1997). “Biological necessities for monarch butterfly overwintering in relation to the Oyamel forest ecosystem in Mexico,” in North American Conference on the Monarch Butterfly (Morelia: Commission for Environmental Cooperation).
Brown, E. D., and Williams, B. K. (2019). The potential for citizen science to produce reliable and useful information in ecology. Conserv. Biol. 33, 561–569. doi: 10.1111/cobi.13223
Caeiro, F., and Mateus, A. (2014). randtests: Testing Randomness in R. R package version 1.0. Available online at: https://CRAN.R-project.org/package=randtests
Corripio, J. G. (2014). insol: Solar Radiation. R package version 1.1.1. Available online at: https://CRAN.R-project.org/package=insol
Cort, J. W., and Kenji, M. (2005). Advantages of the mean absolute error (MAE) over the root mean square error (RMSE) in assessing average model performance. Clim. Res. 30, 79–82. doi: 10.3354/cr030079
Cotton, P. (2003). Avian migration phenology and global climate change. Proc. Natl. Acad. Sci. U.S.A. 100, 12219–12222. doi: 10.1073/pnas.1930548100
Denlinger, D. L., Hahn, D. A., Merlin, C., Holzapfel, C. M., and Bradshaw, W. E. (2017). Keeping time without a spine: what can the insect clock teach us about seasonal adaptation? Philos. Trans. R. Soc. Lond. Ser. B Biol. Sci. 372:20160257. doi: 10.1098/rstb.2016.0257
Dingle, H. (2014). Migration: The Biology of Life on the Move. Oxford; New York, NY: Oxford University Press.
Dreyer, D., Frost, B., Mouritsen, H., Günther, A., Green, K., Whitehouse, M., et al. (2018). The Earth's magnetic field and visual landmarks steer migratory flight behavior in the nocturnal Australian Bogong Moth. Curr. Biol. 28, 2160–2166.e2165. doi: 10.1016/j.cub.2018.05.030
Duangphakdee, O., Radloff, S. E., Pirk, C. W., and Hepburn, R. (2009). Sun angle time windows for absconding by the dwarf honeybee, Apis florea. J. Insect Physiol. 55, 1009–1012. doi: 10.1016/j.jinsphys.2009.07.006
Feddema, J., Shields, J., Taylor, O. R. Jr., and Bennett, D. A. (2004). “Simulating the development and migration of the monarch butterfly,” in The Monarch Butterfly: Biology and Conservation, eds K. S. Oberhauser and M. J. Solensky (Ithaca: Cornell University Press, 229–240.
Fox, J., and Bouchet-Valat, M. (2019). Rcmdr: R Commander. R package version 2.5-2. Available online at: https://CRAN.R-project.org/package=Rcmdr
Gibo, D. L. (1981). Altitudes attained by migrating monarch butterflies, Danaus p. plexippus (Lepidoptera: Danaidae), as reported by glider pilots. Can. J. Zool. 59, 571–572. doi: 10.1139/z81-084
Goehring, L., and Oberhauser, K. S. (2002). Effects of photoperiod, temperature, and host plant age on induction of reproductive diapause and development time in Danaus plexippus. Ecol. Entomol. 27, 674–685. doi: 10.1046/j.1365-2311.2002.00454.x
Heinze, S., and Reppert, S. M. (2011). Sun compass integration of skylight cues in migratory monarch butterflies. Neuron 69, 345–358. doi: 10.1016/j.neuron.2010.12.025
Helm, B., Ben-Shlomo, R., Sheriff, M. J., Hut, R. A., Foster, R., Barnes, B. M., et al. (2013). Annual rhythms that underlie phenology: biological time-keeping meets environmental change. Proc. R. Soc. B Biol. Sci. 280:20130016. doi: 10.1098/rspb.2013.0016
Howard, E., and Davis, A. K. (2015). “Tracking the fall migration of eastern monarchs with Journey North sightings: new findings about the pace of fall migration,” in Monarchs in a Changing World: Biology and Conservation of an Iconic Butterfly, eds. K. S. Oberhauser, K. R. Nail, and S. Altizer (Ithaca, NY: Cornell University Press, 207–214.
Kammer, A. E. (1970). Thoracic temperature, shivering, and flight in the monarch butterfly, Danaus plexippus (L.). Zeitsch. Vergleich. Physiol. 68, 334–344. doi: 10.1007/BF00298260
Kelly, J. F., Horton, K. G., Stepanian, P. M., de Beurs, K. M., Fagin, T., Bridge, E. S., et al. (2016). Novel measures of continental-scale avian migration phenology related to proximate environmental cues. Ecosphere 7:e01434. doi: 10.1002/ecs2.1434
Knight, S. M., Pitman, G. M., Flockhart, D. T. T., and Norris, D. R. (2019). Radio-tracking reveals how wind and temperature influence the pace of daytime insect migration. Biol. Lett. 15:20190327. doi: 10.1098/rsbl.2019.0327
Lebhardt, F., and Ronacher, B. (2014). Interactions of the polarization and the sun compass in path integration of desert ants. J. Compar. Physiol. A 200, 711–720. doi: 10.1007/s00359-013-0871-1
Mason, N. A. (2017). Effects of wind, ambient temperature and sun position on damselfly flight activity and perch orientation. Anim. Behav. 124, 175–181. doi: 10.1016/j.anbehav.2016.12.025
Masters, A. R., Malcolm, S. B., and Brower, L. P. (1988). Monarch butterfly (Danaus plexippus) thermoregulatory behavior and adaptations for overwintering in Mexico. Ecology 69, 458–467. doi: 10.2307/1940444
Milborrow, S. (2019). earth: Multivariate Adaptive Regression Splines. Derived From mda:Mars by Trevor Hastie and Rob Tibshirani. Uses Alan Miller's Fortran Utilities With Thomas Lumley's Leaps Wrapper. Available online at: R package version 5.1.1, https://CRAN.R-project.org/package=earth
Mouritsen, H., and Frost, B. J. (2002). Virtual migration in tethered flying monarch butterflies reveals their orientation mechanisms. Proc. Natl. Acad. Sci. U.S.A. 99, 10162–10166. doi: 10.1073/pnas.152137299
Muheim, R., Schmaljohann, H., and Alerstam, T. (2018). Feasibility of sun and magnetic compass mechanisms in avian long-distance migration. Mov. Ecol. 6:8. doi: 10.1186/s40462-018-0126-4
Perez, S. M., Taylor, O. R., and Jander, R. (1997). A sun compass in monarch butterflies. Nature 387:29. doi: 10.1038/387029a0
Pocius, V. M. (2014). A Re-examination of Reproductive Arrest in the Monarch Butterfly, Danaus plexippus. Lawrence, KS: University of Kansas.
R Core Team (2018). R: A Language and Environment for Statistical Computing. Vienna: R Foundation for Statistical Computing. Available online at: http://www.R-project.org/
Reppert, S. M., and de Roode, J. C. (2018). Demystifying monarch butterfly migration. Curr. Biol. 28, R1009–R1022. doi: 10.1016/j.cub.2018.02.067
Steffy, G. (2015). Trends observed in fall migrant monarch butterflies (Lepidoptera: Nymphalidae) east of the Appalachian Mountains at an inland stopover in southern Pennsylvania over an eighteen year period. Ann. Entomol. Soc. Am. 108, 718–728. doi: 10.1093/aesa/sav046
Systat Software Inc (2008). SigmaPlot v 11.2. San Jose, CA. Available online at: https://systatsoftware.com
Tabachnick, B. G., and Fidell, L. S. (2001). Using Multivariate Statistics. Boston: Allyn and Bacon.
Vogt, J. T., Wallet, B., and Freeland, T. B. (2014). Imported fire ant (Hymenoptera: Formicidae) mound shape characteristics along a north–south gradient. Environ. Entomol. 37, 198–205. doi: 10.1603/0046-225X(2008)37[198:IFAHFM]2.0.CO;2
Warren, T. L., Giraldo, Y. M., and Dickinson, M. H. (2019). Celestial navigation in Drosophila. J. Exp. Biol. 222(Suppl 1):jeb186148. doi: 10.1242/jeb.186148
Wassenaar, L. I., and Hobson, K. A. (1998). Natal origins of migratory monarch butterflies at wintering colonies in Mexico: new isotopic evidence. Proc. Natl. Acad. Sci. U.S.A. 95, 15436–15439. doi: 10.1073/pnas.95.26.15436
Woolf, H. M. (1968). On the Computation of Solar Elevation Angles and the Determination of Sunrise and Sunset Times. NASA technical memorandum, X-1646 (Washington, DC).
Keywords: Danaus plexippus, migration, monarch butterfly, Monarch Watch, phenology, sun angle
Citation: Taylor OR Jr, Lovett JP, Gibo DL, Weiser EL, Thogmartin WE, Semmens DJ, Diffendorfer JE, Pleasants JM, Pecoraro SD and Grundel R (2019) Is the Timing, Pace, and Success of the Monarch Migration Associated With Sun Angle? Front. Ecol. Evol. 7:442. doi: 10.3389/fevo.2019.00442
Received: 11 April 2019; Accepted: 30 October 2019;
Published: 10 December 2019.
Edited by:
Jason Chapman, University of Exeter, United KingdomReviewed by:
Jacobus De Roode, Emory University, United StatesStephen Baillie Malcolm, Western Michigan University, United States
Copyright © 2019 At least a portion of this work is authored by Ralph Grundel, Samuel Pecoraro, Emily Weiser, Jay Diffendorfer, Darius Semmens, and Wayne Thogmartin on behalf of the U.S. Government and, as regards Dr. Grundel, Mr. Pecoraro, Dr. Weiser, Dr. Diffendorfer, Dr. Semmens, Dr. Thogmartin and the U.S. Government, is not subject to copyright protection in the United States. Foreign and other copyrights may apply. This is an open-access article distributed under the terms of the Creative Commons Attribution License (CC BY). The use, distribution or reproduction in other forums is permitted, provided the original author(s) and the copyright owner(s) are credited and that the original publication in this journal is cited, in accordance with accepted academic practice. No use, distribution or reproduction is permitted which does not comply with these terms.
*Correspondence: Orley R. Taylor Jr., Y2hpcEBrdS5lZHU=