 Zakaria Kehel1*
 Miguel Sanchez-Garcia1
 Adil El Baouchi1
 Hafid Aberkane1
 Athanasios Tsivelikas1
 Chen Charles2
 Ahmed Amri1
- 1Biodiversity and Crop Improvement Program, International Center for Agricultural Research in the Dry Areas, Rabat, Morocco
- 2Biochemistry and Molecular Biology, Oklahoma State University, Stillwater, OK, United States
Seed traits of bread wheat, including the seed size that is considered to be associated with early vigor of the crop and end-use quality, are valuable to farmers and breeders. In this study, a collection of 789 bread wheat landraces, held in-trust at the genebank of the International Center for Agricultural Research in the Dry Areas (ICARDA) were scanned for seed morphometric traits using GrainScan. Diversity analysis using the 12k DartSeq SNP markers revealed that these accessions can be grouped into five distinct clusters. To evaluate the performance for early selection from genebank accessions, we examined the accuracy of genomic selection models with genomic relationship that these landraces accounted for. Based on cross-validations, prediction accuracies for seed traits ranged from 0.64 for seed perimeter to 0.74 for seed width. The variability of prediction accuracies across random validations averaged at 0.14, with a range from 0.12 to 0.18, suggesting stable predictability and reproducible results even with a collection of much greater genetic diversity from genebank accessions. Adding the climatic relationship matrix between accessions based on passport information improved the predictive ability by 8%. Our results on seed traits demonstrated the capacity for estimating important agronomic phenotypes for genebank accessions directly based on genomic information, further advocating the advance in genomic technologies for identifying parental germplasm as potential donors of beneficial alleles for introgression.
Introduction
Wheat is one of the most important cultivated food crops, and its cultivation goes back some 11,000–10,000 years ago (Nesbitt, 2002; Zohary et al., 2012). Wheat has been the fundamental staple food for the majority of human civilizations in Europe, West Asia, and North Africa (Curtis et al., 2002) because of its crucial nutritional value and its significant contribution to daily energy intake. Wheat is very diverse and widely adaptable (Levandi et al., 2014), and its gene pool is rich in genes that can be used to improve resistance/tolerance to biotic and abiotic stresses and micronutrient availability. However, to secure an efficient continuum between the conservation and the use of genetic resources, wheat accessions need to be well-characterized and evaluated for a range of traits. The study of this phenotypic diversity will result in better use in breeding programs.
The major obstacle to enhance the use of genebank material is the lack of adequate characterization and evaluation data, and thus, the inability to adequately respond to inquiries for these accessions that directly meet the needs of the users. Several methods of linking traits to a genebank accession have been reviewed (Anglin et al., 2018) including phenotyping of large or random samples, core and mini core collections, the focused identification of the germplasm strategy (FIGS) and Generation Challenge Program subsets and use of molecular techniques and genome wide association studies (GWAS). FIGS is a useful approach developed at the International Center for Agricultural Research in the Dry Area (ICARDA) to identify subset of accessions with a high probability of containing specific target traits based on the ecogeographical information of the sites where the populations were collected (Mackay and Street, 2004). Success in FIGS has been seen in the identification for sources of resistance to Sunn pest in wheat in Syria (El Bouhssini et al., 2009), and for Russian wheat aphid in bread wheat (El Bouhssini et al., 2011) and further in the identification of the traits related to abiotic stresses, such as drought adaptation in Vicia faba L. (Khazaei et al., 2013). FIGS, however, has not been used to study quantitative traits such as phenology and morphology.
Grain weight is one of the main wheat yield components, and grain size and shape have a direct impact on wheat market value. While flour is extracted from the endosperm, the inner part of the grain, and therefore spherical grains tend to produce more flour per kilogram of grain milled due to the lower surface/volume ratio (Evers et al., 1990). Also, the grain size was found to be associated with various characteristics of flour, such as protein quality and hydrolytic enzyme activity, which in turn determine baking quality and end-use suitability (Evers, 2000). Grain size in wheat is associated with seedling emergence and development, primarily through the influence on the rates of expansion of the first two leaves (Aparicio et al., 2002). Furthermore, grain weight has been associated with grain yield in a number of diverse environments of contemporaneous varietal panels (Lopes et al., 2012). In addition, research has found higher grain weight plays an important role in the robust establishment of bread wheat seedlings subjected to salinity stress (Grieve and Francois, 1992).
Previous studies have found larger grain size and shape variation in bread wheat landraces and old hexaploid species as compared to the tetraploid Triticum species (Gegas et al., 2010). This large variation has, however, decreased in modern germplasm, suggesting a breeding-related bottleneck on grain shape variability (Gegas et al., 2010). This bottleneck can be one of the reasons of the low (Austin et al., 1989; Brancourt-Hulmel et al., 2003; Sanchez-Garcia et al., 2013) or even negative (Siddique et al., 1989; Royo et al., 2007) contribution of grain size to wheat genetic gains in several countries. There is an urgent need to overcome this bottleneck by bringing novel diversity from genebanks to breeding programs.
Recent and rapid advancements in high throughput genotyping have greatly aided plant science through characterizing genetic diversity, genome-wide association studies, and genomic selection (GS). GS, as predictive analytics, uses genome-wide markers to predict genomic breeding values. GS has been widely applied to elite wheat germplasm (de los Campos et al., 2009, 2010; Crossa et al., 2010; González-Camacho et al., 2012; Heslot et al., 2012; Pérez-Rodríguez et al., 2012; López-Cruz et al., 2015; Hu et al., 2019). However, very few studies that evaluated the performance of GS with the inclusion of new diversity from genebanks can be found in the literature including Thinopyrum intermedium (Zhang et al., 2016), wheat landraces for rust resistance (Daetwyler et al., 2014; Pasam et al., 2017), mineral contents (Manickavelu et al., 2017), and heat and drought stress adaptation (Crossa et al., 2016).
Following the above, the objectives of this study were: (1) to examine the genomic prediction accuracy within a set of ICARDA bread wheat genebank collection for seed morphometric traits, (2) to study the effect of including a non-additive similarity matrix based on passport data, and (3) to study the effect of accounting for population structure in genomic prediction models.
Materials and Methods
Landraces, Grain Color, and Morphology
Seven hundred eighty-nine (789) bread wheat landraces were randomly selected from the 4000 landraces grown at the ICARDA Marchouch station (33°36′ N 6°42′ W, 390 m a.s.l.) located in central Morocco during the cropping season 2016–2017 for the purpose of regeneration and characterization of accessions of genebank. Landraces are planted in a non-designed trial with two rows plot of 2 m long each. Best practices for the regeneration of wheat genetic resources were applied including supplemental irrigations and applying pesticides to control major diseases and pests to allow for good growing conditions and full expression of seed traits. Most accessions originated from North Africa, Middle East, and southeast Asia with a majority from Pakistan, Turkey and Morocco (Complete list can be found in Supplementary Data Sheet 1).
Random samples of 250–400 grains were obtained from the harvest of every plot and were scanned using a flatbed scanner (CanoScan LiDE 220; Canon). The images collected were analyzed using Grainscan software (Whan et al., 2014) and the morphological characteristics of every grain in every image obtained. Grain characteristics include the grain area (mm2), perimeter (mm), grain length (mm), and width (mm). Additionally, Grainscan software produce for every grain analyzed an output of color channel intensity analogous to the standardized CIELAB colourspace (Whan et al., 2014). The color channels from GrainScan (ColCha1, ColCha2, and ColCha3) are considered therefore to be proxies for L∗, which represents the lightness of the color; a∗, which represent green or magenta; and b∗, representing blue or yellow, respectively.
Genotypic Characterization and Diversity of Wheat Landraces
A high-throughput genotyping method using DArTseqTM technology was employed to generate genomic profile of the germplasm at the Genetic Analysis Service for Agriculture (SAGA) facility at the International Center for Maize and Wheat Improvement (CIMMYT) in Mexico. DArTseq raw data were filtered according to markers criterion; minor allele frequency > 5% and missing data ≤ 20%. This resulted in a total of 12,472 Dartseq markers that were used in this study. Diversity analysis was performed using a discriminate analysis of principal component (DAPC) as described by Jombart et al. (2010) and principal component analysis (PCA) using R Core Team (2016).
Environmental Similarity Between Wheat Landraces
To characterize the environmental diversity and make an environmental similarity matrix based on passport data between bread wheat landraces, we collected datasets for a total of 36 potential drivers of crop diversity, including 35 climate variables and altitude (Supplementary Table 1). The climatic variables include the 19 bioclimatic variables from the WorldClim version 2 database (Fick and Hijmans, 2017), freely available at http://www.worldclim.org, and downloadable at 2.5 arc-min spatial resolution. Additional 16 climate variables were downloaded at the same spatial resolution from the Environmental Rasters for Ecological Modeling (ENVIREM) database (Title and Bemmels, 2018). These 35 variables (19 from WorldClim and 16 from ENVIREM) allow for a robust characterization of the climate signature of landraces and wild relatives (Braunisch et al., 2013; Title and Bemmels, 2018). The variables were scaled, and an Euclidian distance was computed, resulting into an environmental similarity matrix between landraces based on passport information.
Statistical Analysis
Genomic best linear unbiased prediction (G-BLUP) was used to perform genome wide predictions. We used a genomic relationship matrix between landraces using marker information defining covariance based on observed similarity at the genomic level as described by VanRaden (2007). This model captures a large additive genetic variance by accounting for genomic information and increases the heritability and prediction accuracy. Genomic heritability (h2) was computed as the ratio between the genetic variance due to markers over the sum of the genetic variance plus the error variance. We have used for all models, as a more appropriate way, the complete dataset to estimate variance components (additive and residuals) and hence the genomic heritability.
Population structure might affect the estimation of heritability and the prediction accuracy in a genome wide prediction framework (Gou et al., 2014). To evaluate the impact of population structure in the performance of genomic prediction, we evaluated the following models:
(1) null model where no population structure was accounted for;
(2) accounting for population structure using discrete population resulting from DAPC with K number of subpopulations equal to 2 which is the first level of genetic separation (grp2);
(3) accounting for population structure using discrete population resulting from DAPC with K optimal number of subpopulations;
(4) accounting for population structure using 5 eigen vectors PC1 to PC5 resulting from PCA analysis. We have removed the population structure effect due to stratified populations using the population proxies (two discrete groups resulting from DAPC and PC1–PC5) as fixed effects in our models (Daetwyler et al., 2015). In addition, and to reduce the effect of population structure on the genomic prediction accuracy, we have also run predictions for separate subpopulations using groups resulted from DAPC analysis for K number of populations equal to 2.
Genomic predictions only consider the additive effects using the observed relationship between individuals using markers. It has been suggested that the estimation of non-additive effect can improve prediction accuracy (Varona et al., 2018). In this study, resemblance between landraces using environmental data from the site of the landrace’s origin was used as a non-additive term, alone or in combination with the additive matrix, in the G-BLUP mixed model to account for the non-genetic effect.
To evaluate prediction model performance, cross-validation (CV30) where 30% of landraces were included in the validation set while the remaining 70% of landraces formed the training set, was employed. The process was repeated randomly 50 times. The prediction accuracy of a model was assessed using the Pearson correlation between genomic predictions and BLUP from the model using the full dataset.
All the above analyses were performed using a single stage analysis, where raw data from a single seed was used directly in the prediction models. Outliers were identified as data points with studentized residuals superior to 3.5 and removed from the final analysis. Models were fitted in ASReml v3.0-1 (Butler et al., 2009) for R v3.3.1 (R Core Team, 2016).
Results
In this study, seven (7) seed traits were captured to determine grain shape, size and color for wheat landraces. The genomic heritability (Table 1) of the traits under this study ranged from moderate 0.47 for grain area and perimeter to high 0.78 for one of the color channels (ColCha1). As expected, large variation was found within the landraces used in this study (Table 1); the grain width showed less variability (range of 1 mm) than grain length with a range of 2 mm; and, grain area and perimeter ranged from 12 to 19.2 mm2 and 17 to 22.3 mm, respectively.
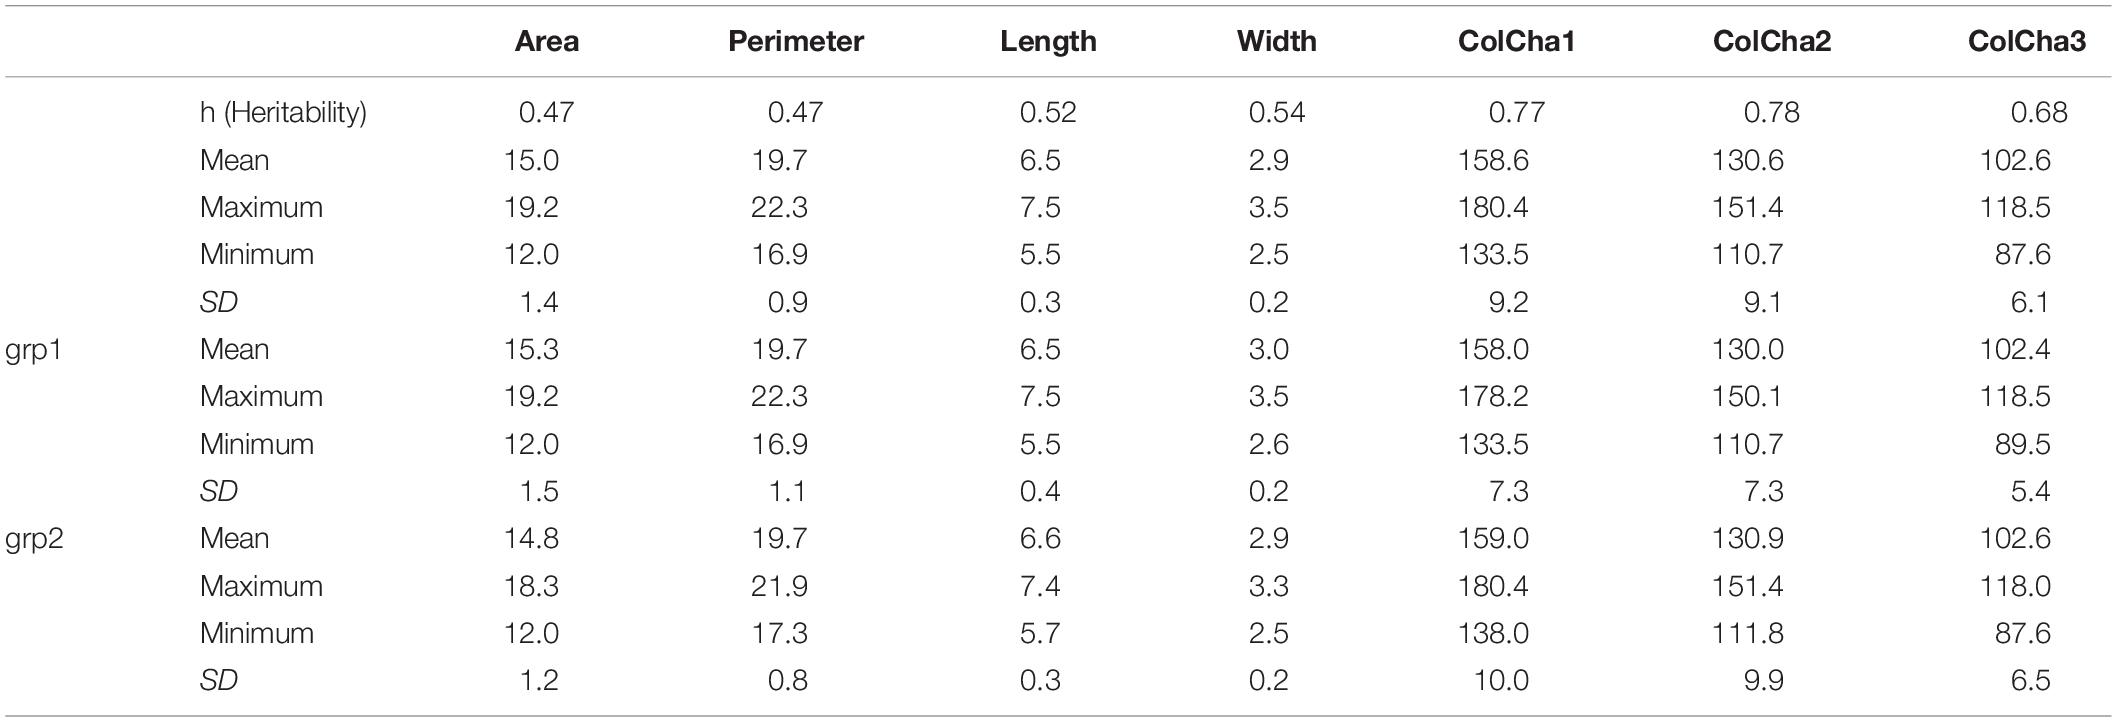
Table 1. Summary statistics and genomic heritability for grain characteristics for the entire set collection and per subpopulation when K = 2 (grp1 and grp2) of the bread wheat landraces.
For diversity analysis, PCA showed that the first five (5) eigen values explained 80% of the genetic variance. The set of landraces used in this study exhibited population structure as shown by plotting first versus second principal component (Figure 1). This structure was mainly due to the country of origin as landraces from the same country were clustered together. DAPC proposed K = 5 as the optimal number of subpopulations as it presented the lowest Bayesian Criterion index value. Increasing K to more than five did not identify any further clear genetic group. The first level of separation K = 2 has clearly distinguished between landraces from Pakistan and Turkey and landraces from the other countries. However, when K was set to 5, the landraces were correctly classified into their agro-ecologies (Figure 2). The first subpopulation (red) is composed of landraces collected from hot environments, mainly from Pakistan, Egypt, and Oman. The second subpopulation (green) comprised of landraces collected in winter areas from Turkey. The third subpopulation (light blue) mostly made of landraces from Mediterranean environments and the spring type, whereas the fourth subpopulation (dark blue) composed of landraces collected in favorable Mediterranean environments. Finally, the last and fifth subpopulation (black) is the smallest one with 37 landraces originated mainly from North Africa and most probably are genetically similar to the beard wheat landraces from Southern Europe. The assignment of the wheat landraces to subpopulations for K = 2, 3, 4, and 5 can be found in the Supplementary Table: list of accessions.csv.
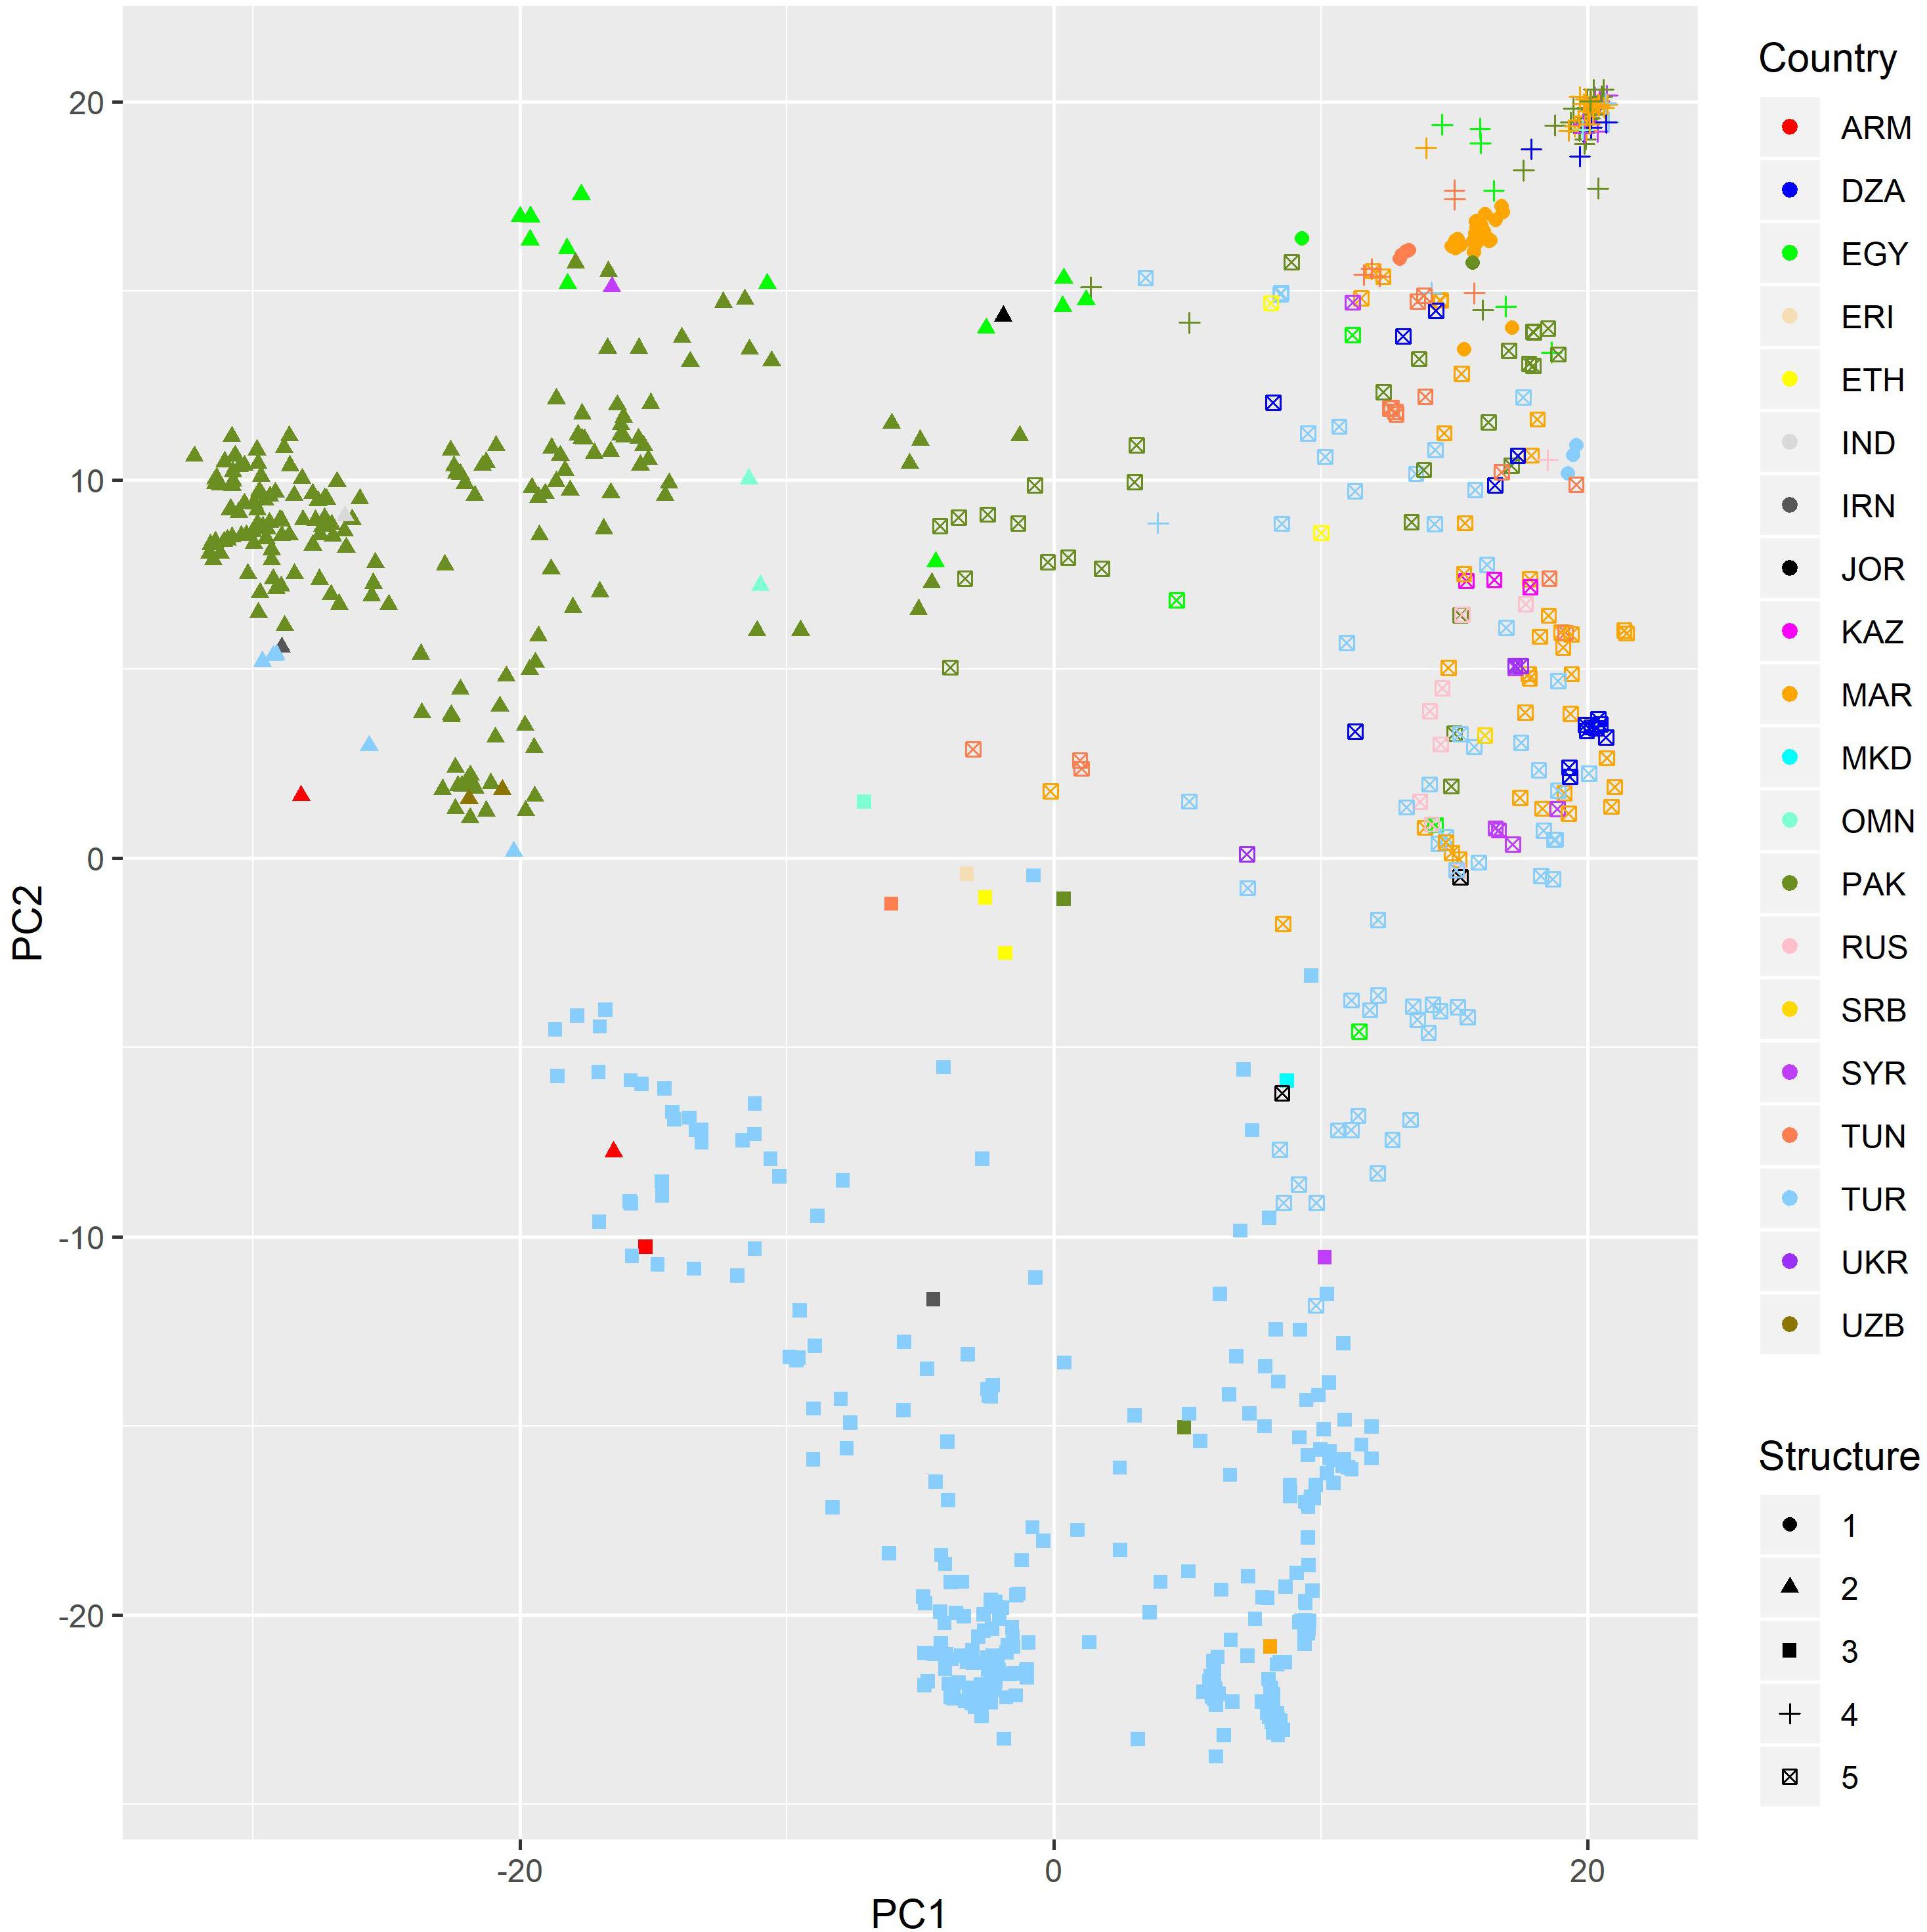
Figure 1. PC plot of a set of bread wheat landraces from PCA using DarTseq markers. Colorsed by country of origin. Dot shape gives the assignment to subpopulations when K = 5.
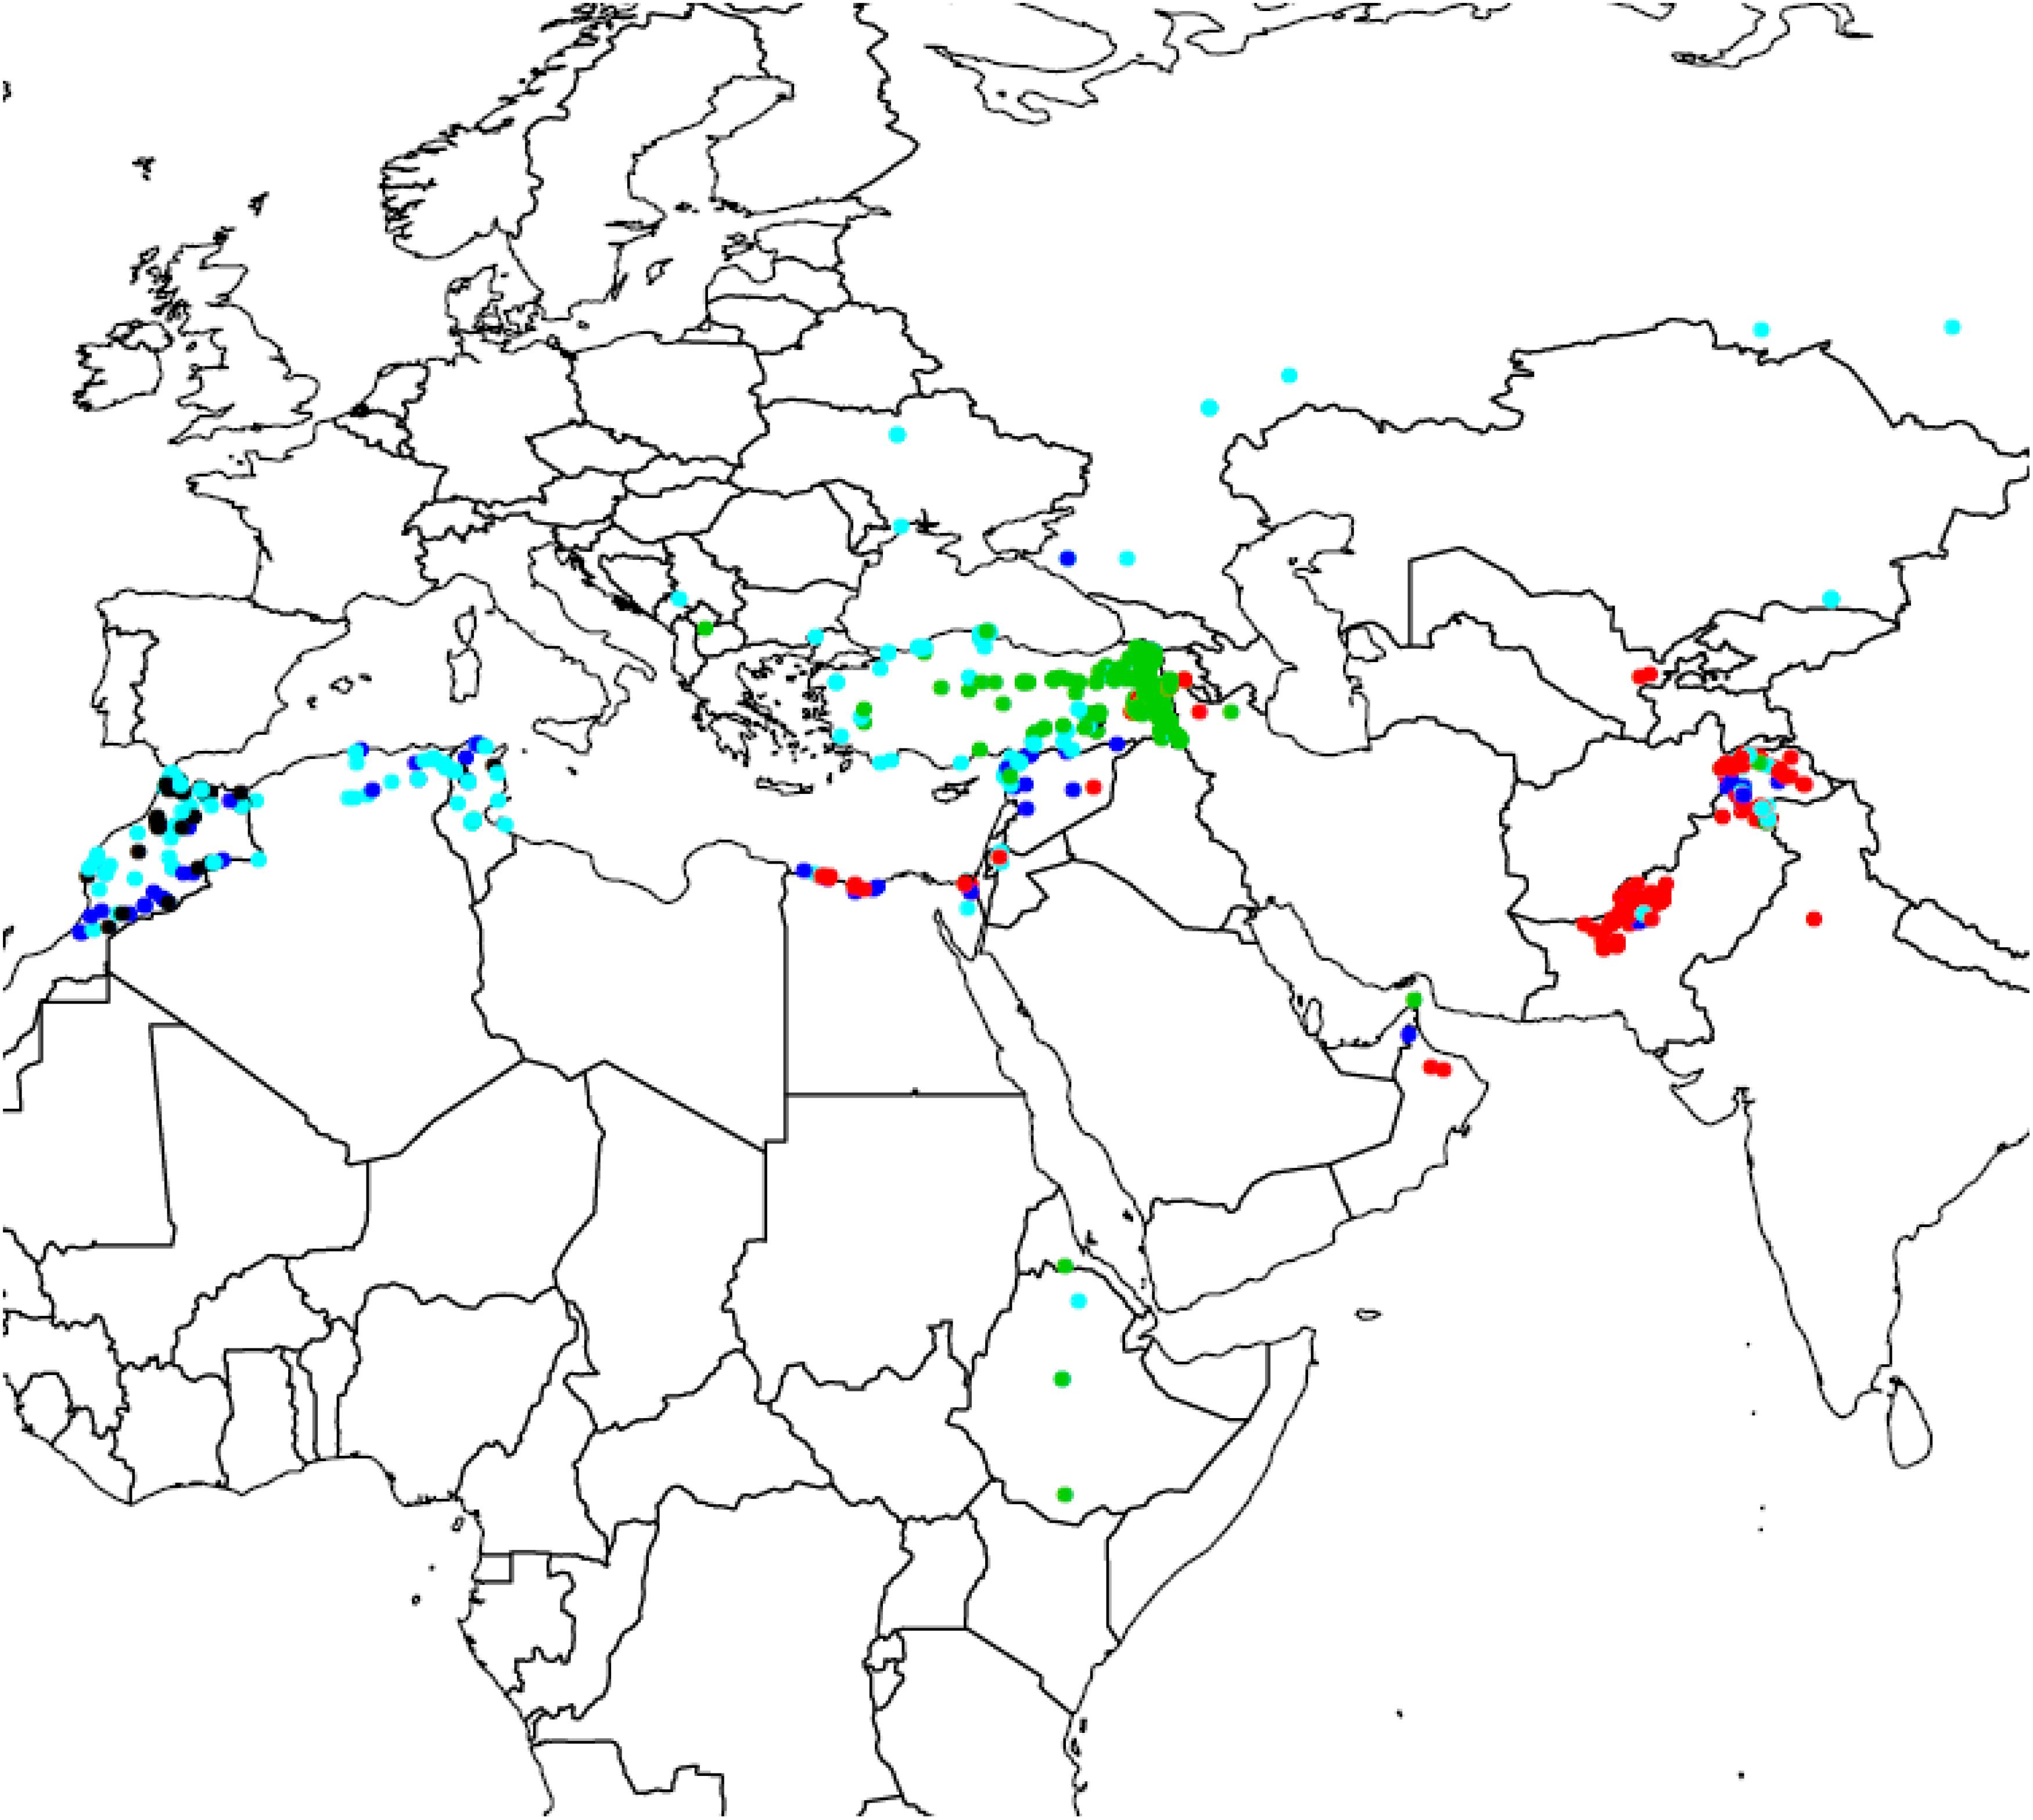
Figure 2. Geographic distribution of the five subpopulations of bread wheat landraces found using Discriminant Analysis of Principal Component.
The grain characteristics have shown the same range of variation between the two subpopulations resulting from DAPC for K = 2 (Table 1 and Supplementary Figure 1). Nevertheless, using the optimal number of subpopulations K = 5 revealed that some subpopulations (1 and 4) do not present as much variability as the other subpopulations (Supplementary Figure 2).
The prediction models showed medium to high accuracies for all grain traits (Figure 3 and Table 2). The Perimeter showed the lowest prediction accuracy with an average of 0.64, followed by Length and ColCha3, ColCha1, Area and ColCha2 with an average accuracy of 0.66, 0.69, 0.7, and 0.74 respectively. The prediction accuracy reach its greatest value for grain width with 0.74 in average. Overall, the variability in accuracy between the 50 random cross-validations had similar trend as average accuracies, where the highest variation was identified in perimeter, length and the ColCha1 and ColCha2, and the lowest variation shown by grain area and grain width (Figure 3).
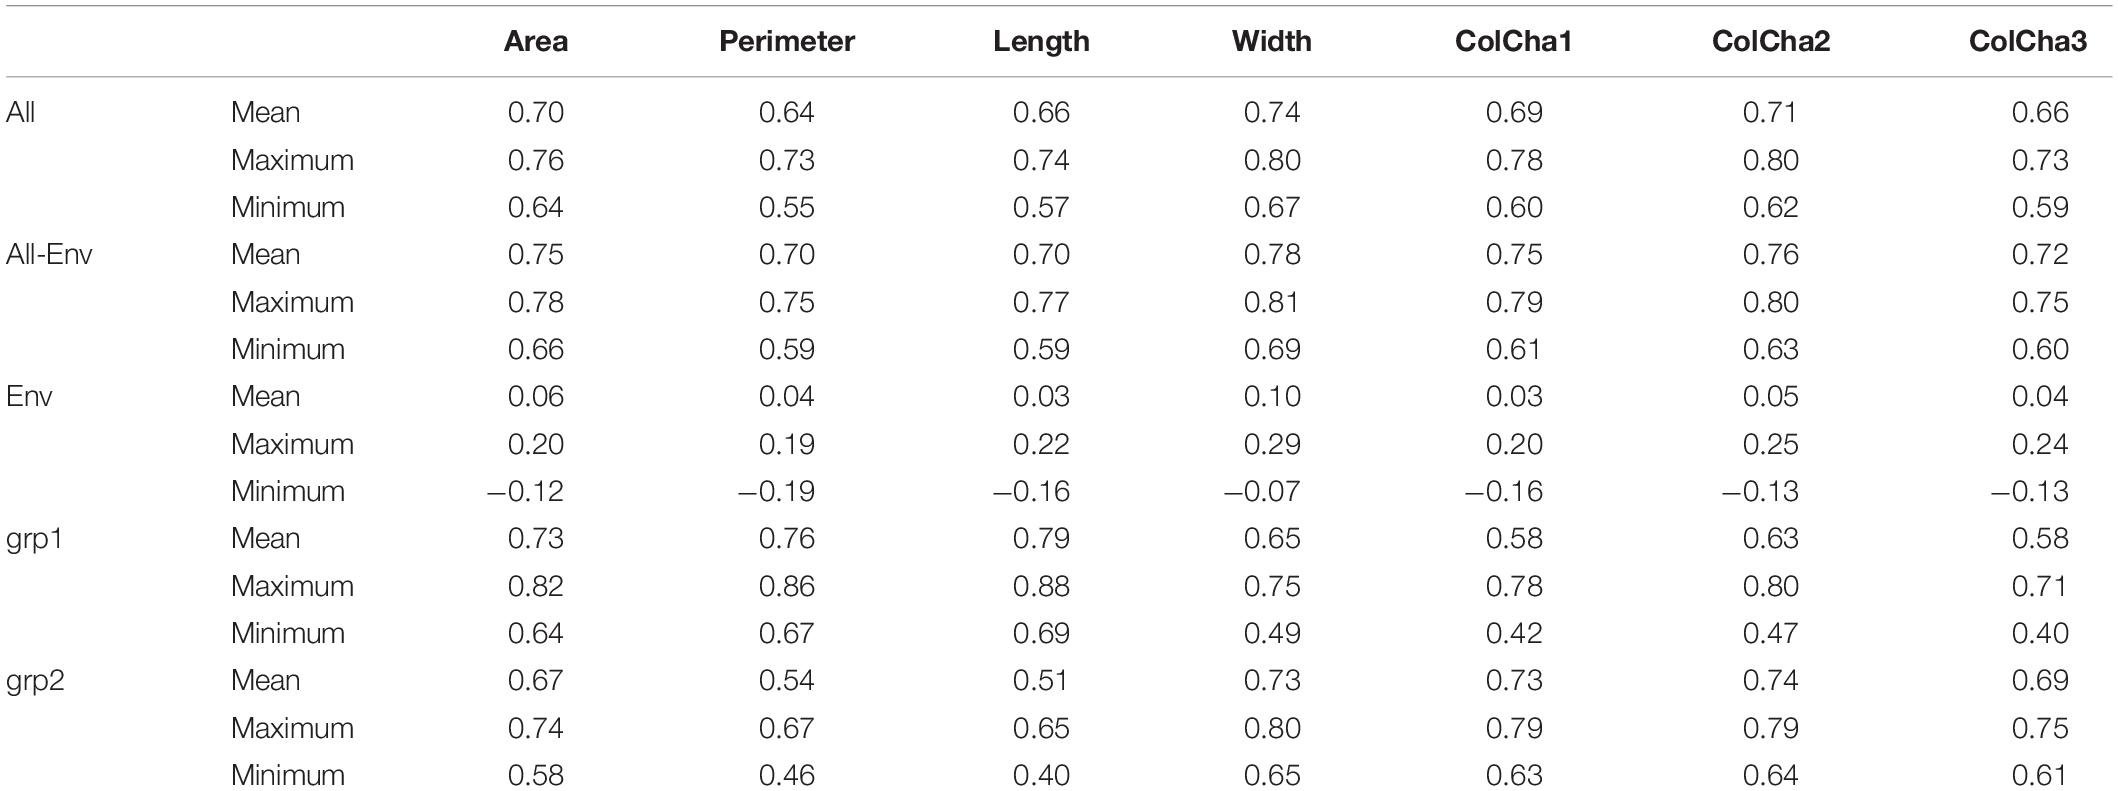
Table 2. Prediction accuracies for grain traits using only markers (All), passport information (Env) and combining both (All + Env), and for separate subpopulations grp1 and grp2 of bread wheat landraces.
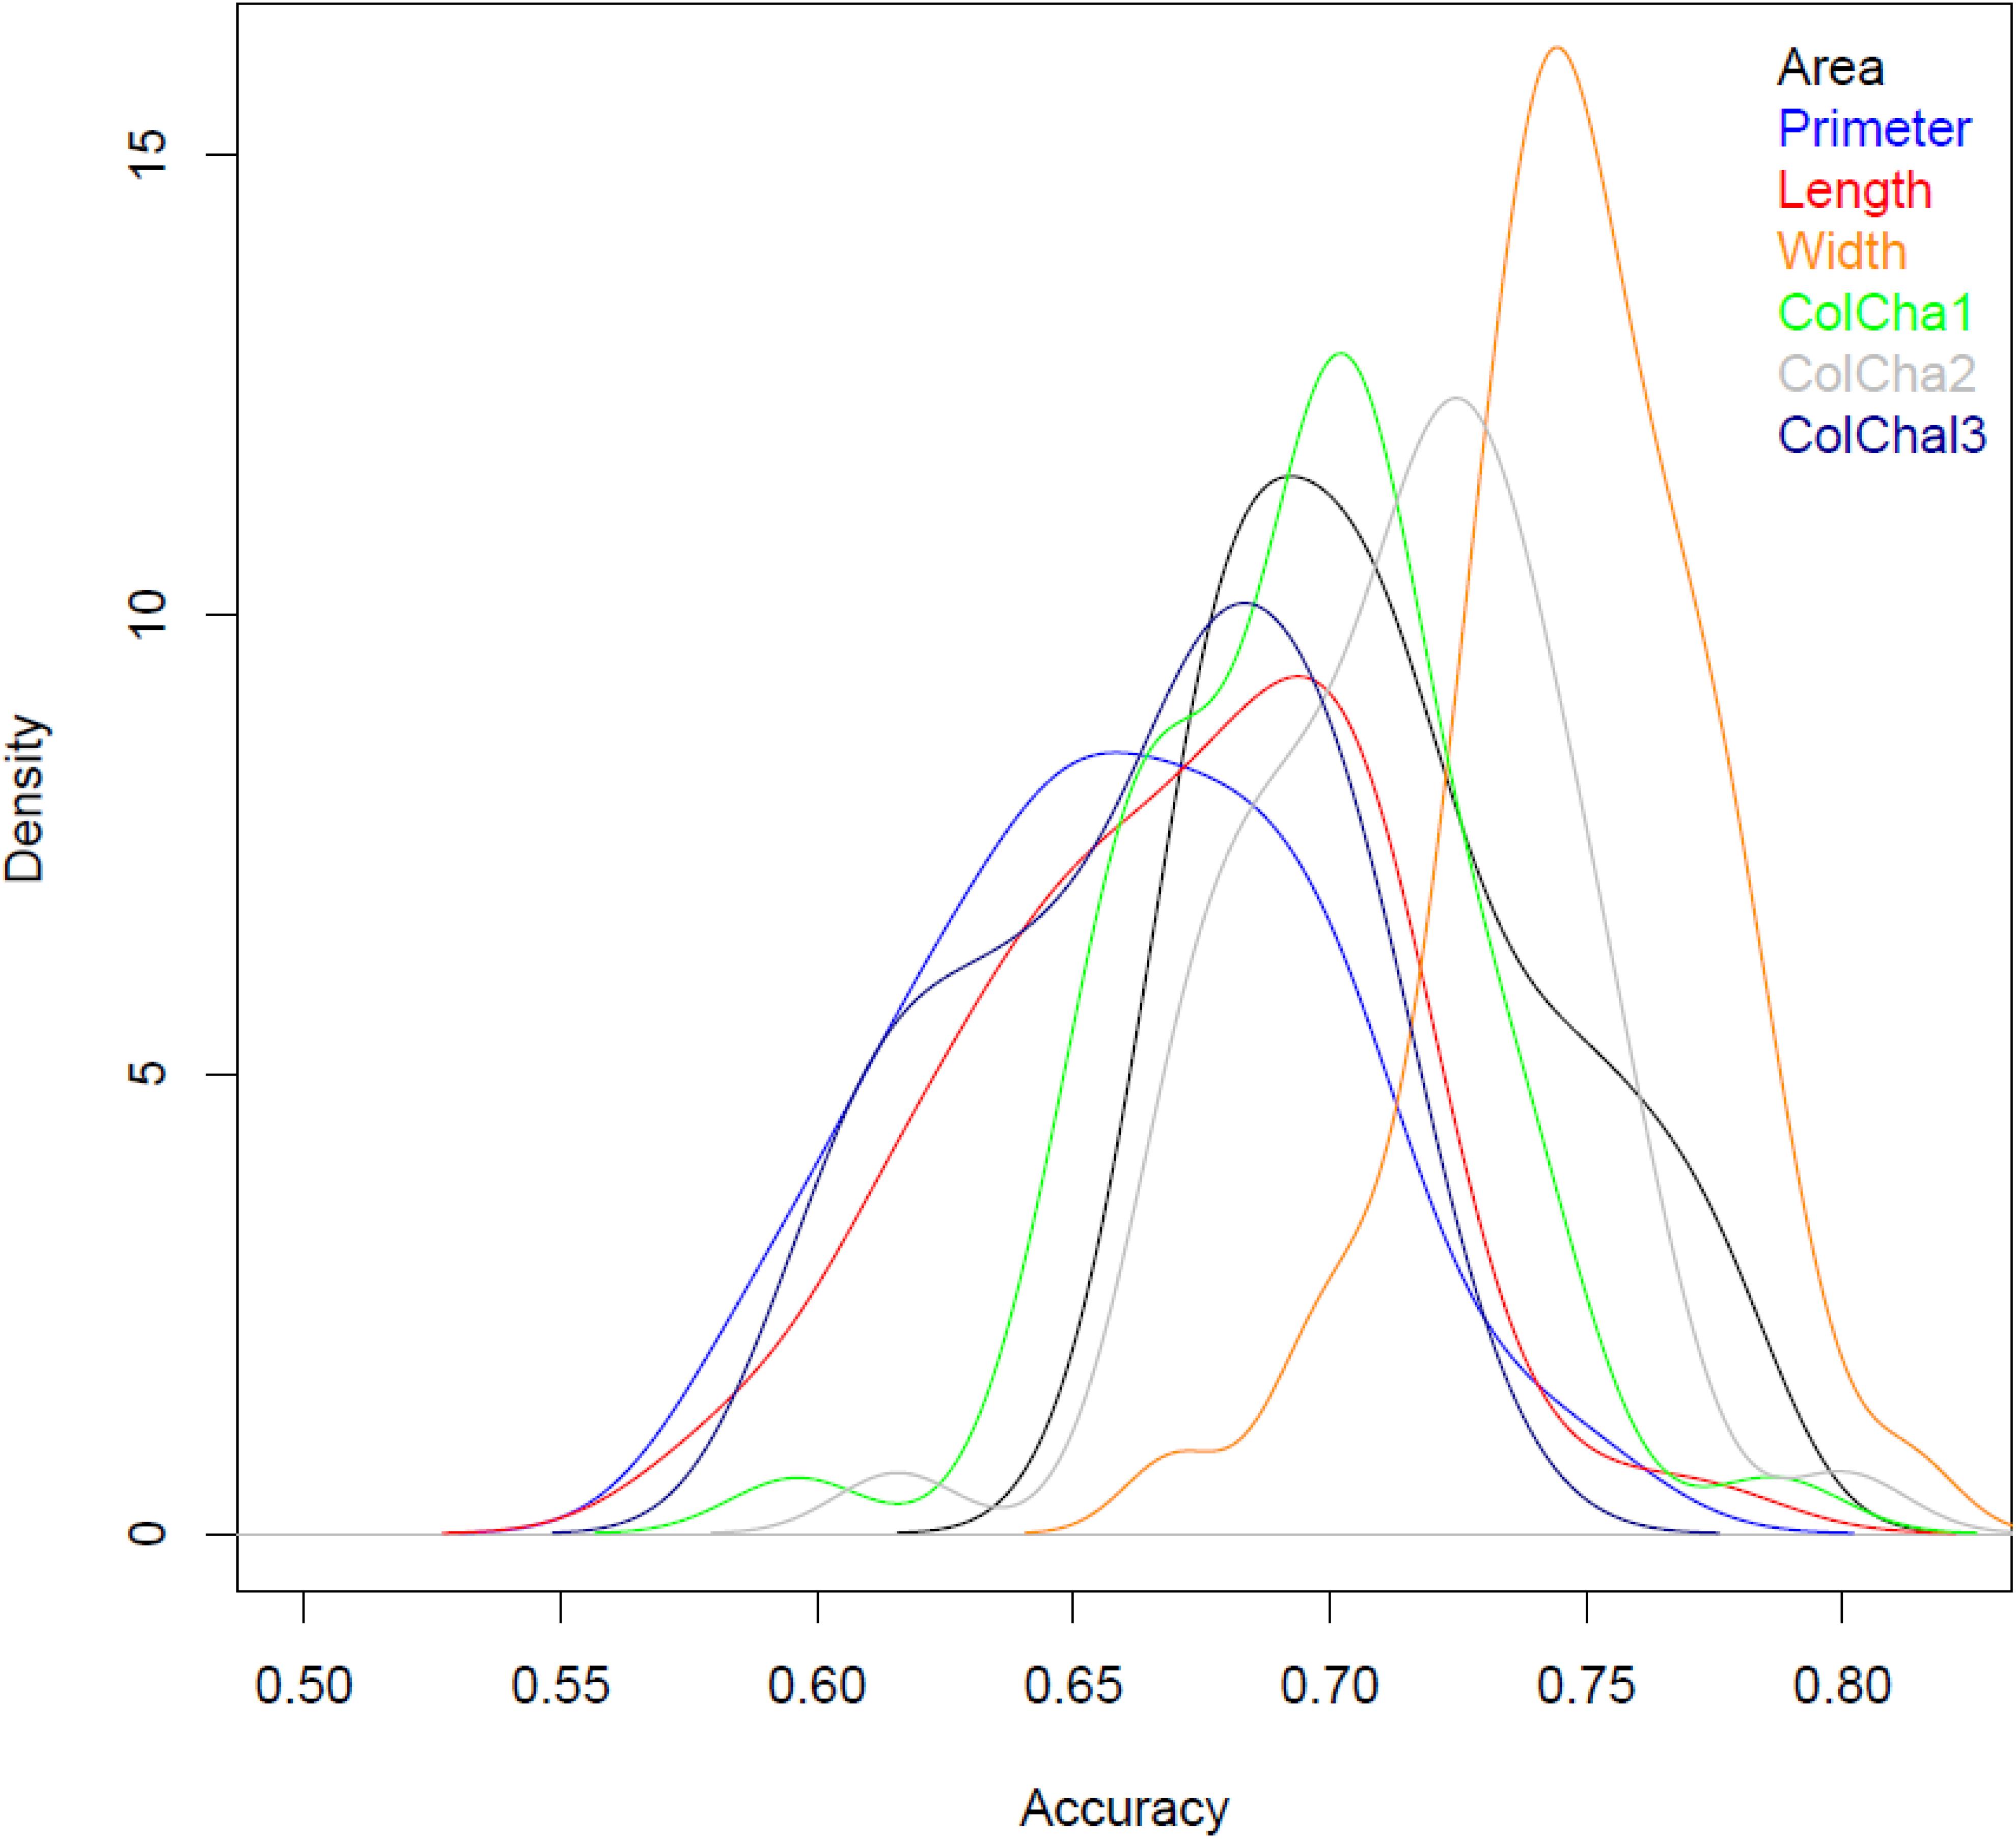
Figure 3. Densities for prediction accuracy using validation set for grain traits of bread wheat genebank accessions.
Prediction models using the climatic similarity matrix showed low values for prediction accuracy compared to the prediction model based on markers. On average for all traits, a maximum of 0.1 prediction accuracy was reached for the grain width (Table 2). The maximum prediction accuracy for the 50 random replicates reached more than 0.2 for all grain traits. Adding the climatic similarity to the genetic similarity in the prediction model has shown a slight increase in the prediction accuracy for all traits with a maximum increase of 0.06 (8%) achieved for the grain perimeter and ColCha1 and ColCha3.
Figure 4 displays genomic prediction accuracies comparing the null model with the ones that incorporated different population structure covariates. When accounting for population structure in the genomic prediction models, the change in the prediction accuracies showed different patterns depending on the variables used to correct for stratified populations and/or the trait under evaluation. Generally, when accounting for population structure using grp2, the accuracies were similar to the null models without accounting for population structure for all grain traits. However, when accounting for population structure using grp = 5, compared to the null model, there was a significant reduction of prediction accuracy at ∼0.06 (8%, p-value ∼ 0) found for all the traits; the lowest decrease was observed for the grain width (0.04). The most significant reduction in prediction accuracy was found when accounting for population structure using PC1–PC5. This decrease ranged from 0.33 for ColCh2 to as low as 0.11 and 0.14 for grain perimeter and area, respectively. Making genomic predicitions for grain characteristics for each subpopulation when K number of populations was equal to 2 has given contrasting results (Table 2). For the first subpopulation, increased prediction accuracy was obtained for the grain area, perimeter, and length, whereas prediction accuracies were found lower for the second subpopulation. A completely opposite pattern was observed for the width and the three color channels where subpopulation two showed a decreasing prediction accuracy for the area, length, and perimeter and an increasing prediction accuracy for the three color channels.
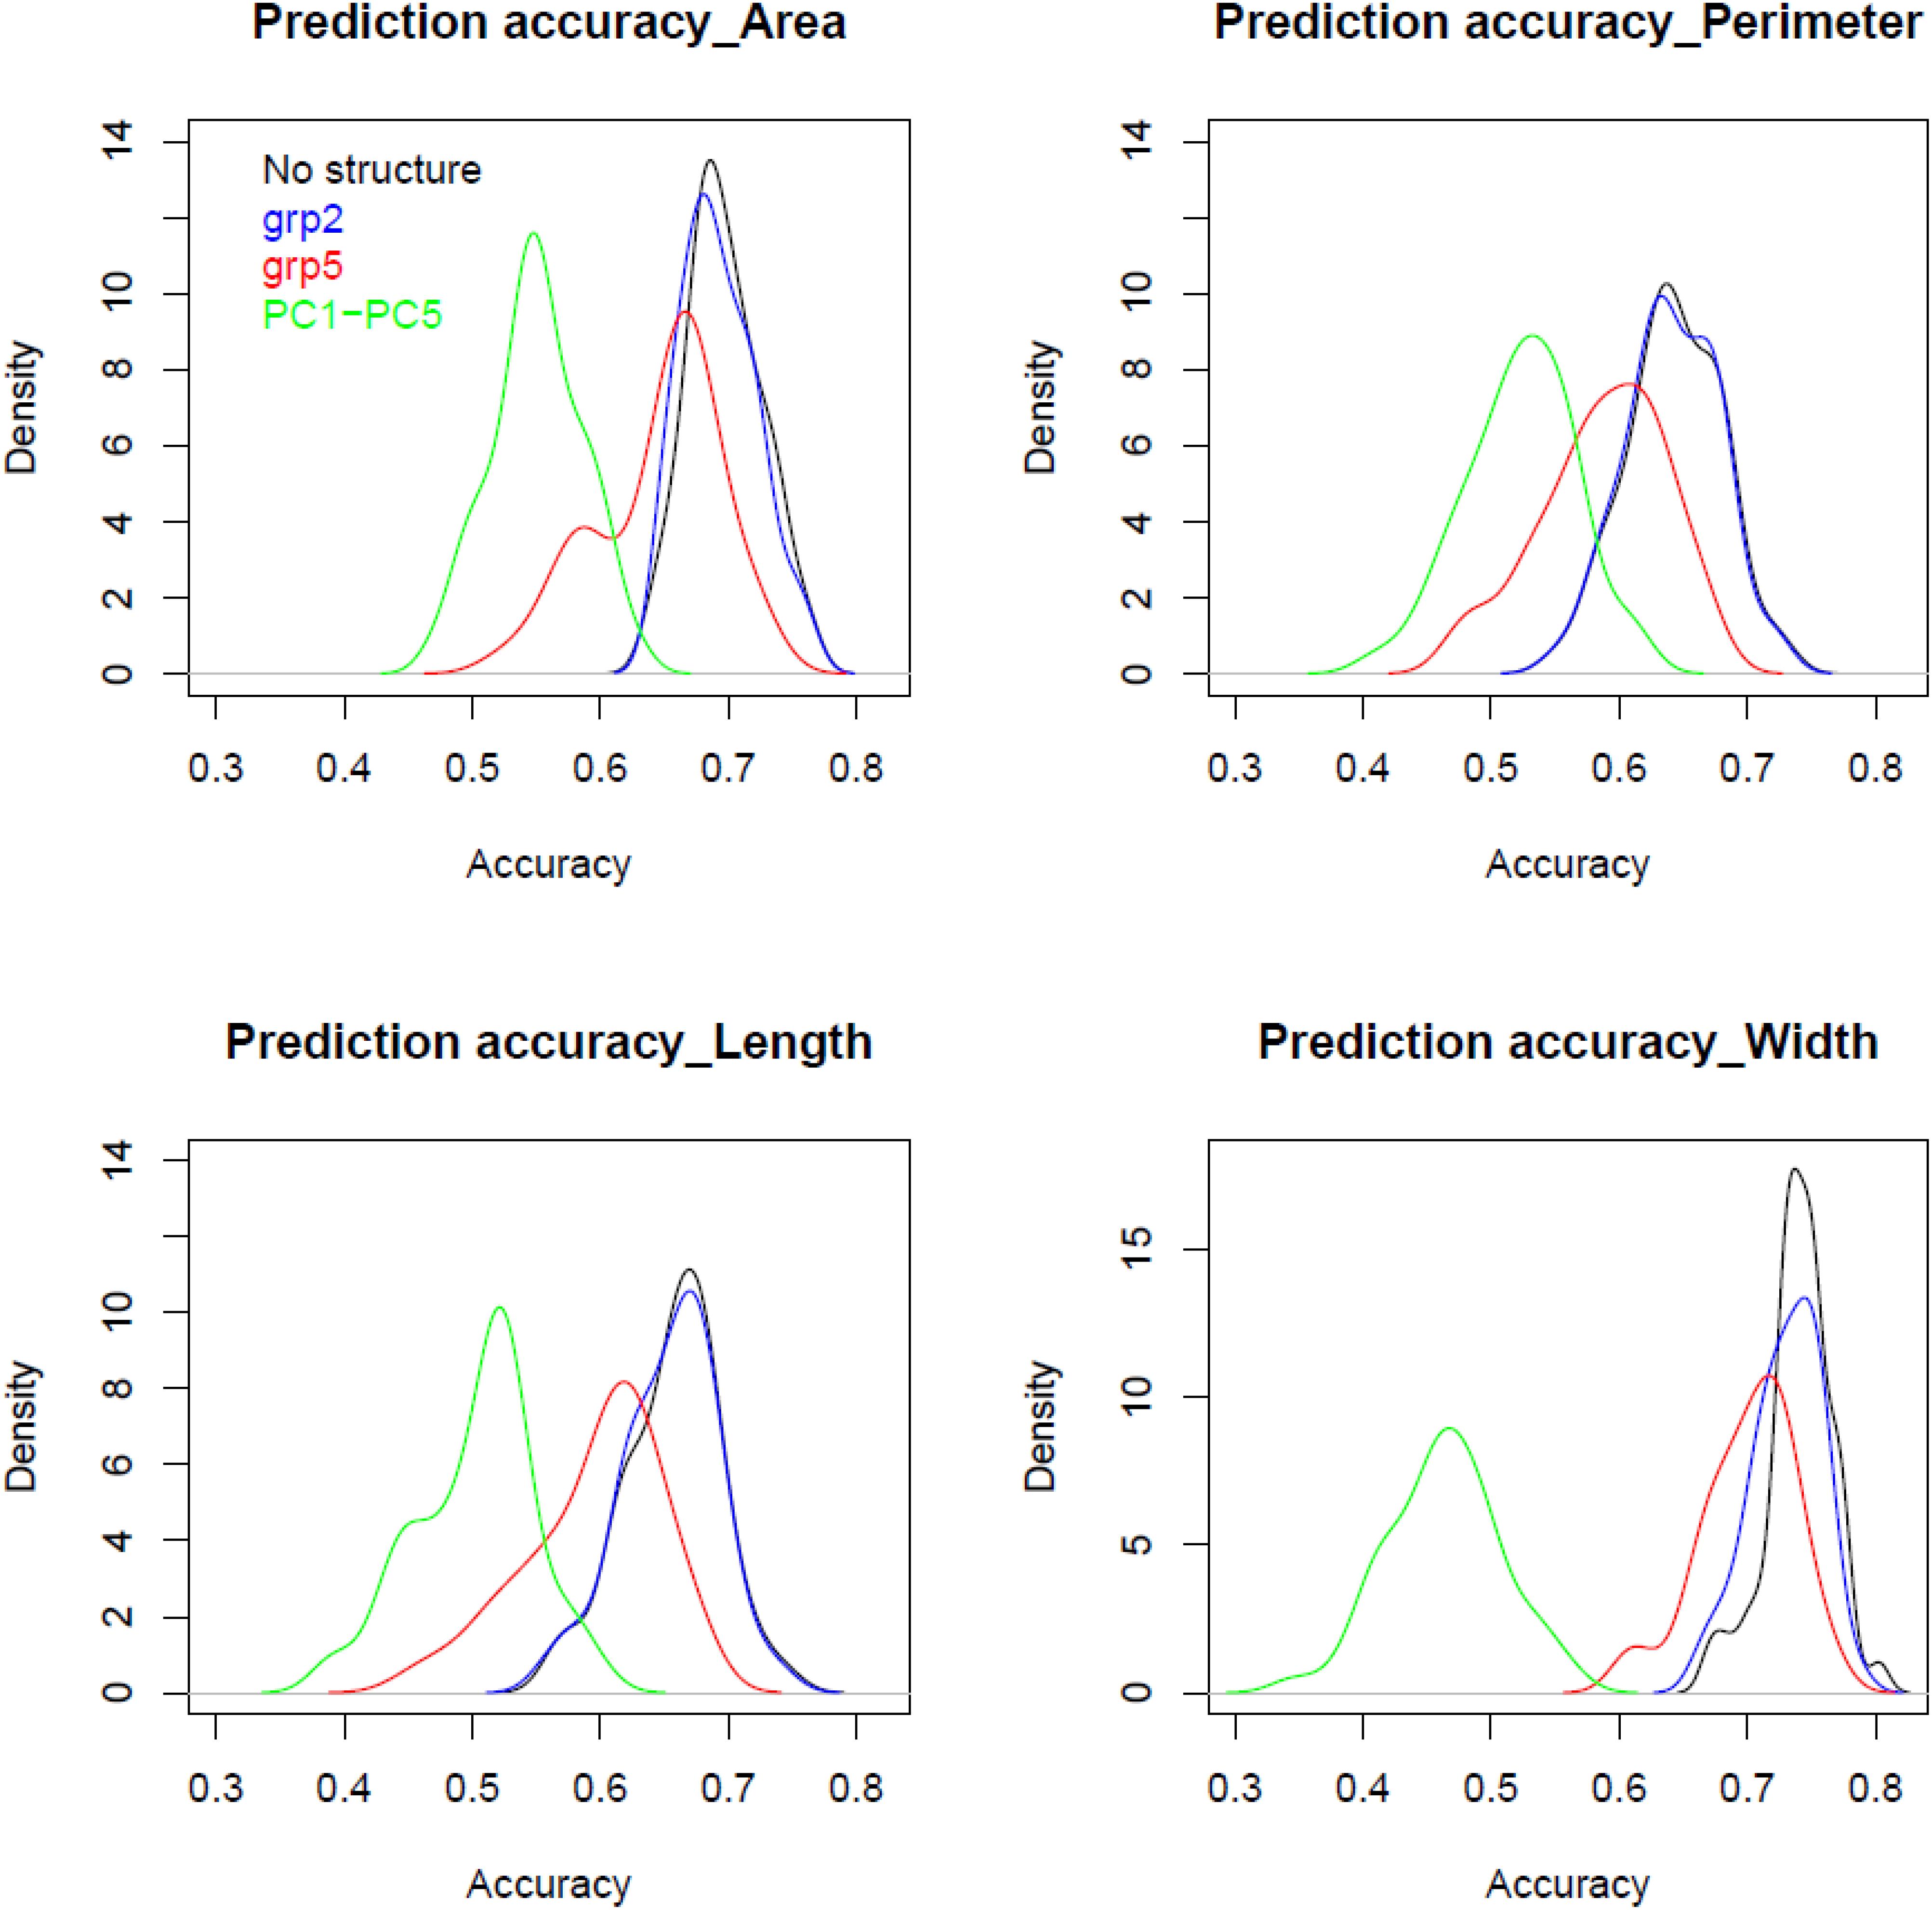
Figure 4. Comparison between densities for prediction accuracy using validation set using different population structure covariates for grain area, perimeter, length, and width of bread wheat landraces.
Discussion
Variation and Prediction Accuracies for Wheat Landrace’s Grain Traits and Building on FIGS
Variability among bread wheat landraces was assessed for grain traits using image analysis. The seven grain traits exhibited medium to high heritability with considerable variation, at a similar order of heritability and scale of variabilities found in other studies (Gegas et al., 2010). Grain traits, especially grain shape and size, have a direct influence on yield and quality, and consequently, the market value of the wheat product. Ample evidence has also suggested that, compared to landraces and primitive wheat species, the significant reduction in grain shape and size of modern varieties is a result of domestication and breeding (Gegas et al., 2010). Landraces held in genebanks can have a crucial role in wheat breeding for grain traits because of their wide variability in terms of grain size and shape.
However, sending genebank’s requesters the appropriate material to meet their demands is not a straightforward task. This means the genebank manager would have a complete description of all the genebank holdings. As a result, characterizing agronomically important grain traits has become an important activity within a genebank as it is essential to identify accessions with the desirable traits to be used as parental material in a breeding program. Characterization at the genebank level as well as at the breeding level is mainly based on 1000 kernel weight and hectoliter weight. However, characterization of large number of accessions held in the global collections is resources consuming. Several solutions have been developed and tested to address this issue, including core collections, FIGS, and GWAS (Anglin et al., 2018). The performance of core collection and GWAS to link a trait of interest to a genebank accession has been evaluated (Anglin et al., 2018); however, the application of FIGS has yet not been examined for quantitative morphological traits such as grain traits. In this research, we reported the efficiency of genome-wide prediction to predict the ICARDA genebank wheat landraces using high-density DartSeqTM markers. This is done by characterizing a portion of the wheat collection for grain traits, including grain area, perimeter, length, and width and using DartSeqTM and GS to predict the unevaluated genebank accessions. Our results suggest that genomic prediction is a useful tool for predictive characterization of genebank accessions, allowing phenotyping to be restricted to a portion of the collection in order to predict trait genomic estimated breeding value (GEBV) for the entire collection (Crossa et al., 2016; de Azevedo Peixoto et al., 2017; Thorwarth et al., 2017). We used GBLUP as a method of genomic predictions because of its performance stability and flexibility of applications regarding the genetic architecture (Meuwissen et al., 2001). Our study has shown that GS can be implemented within a genebank to predict important traits such as grain characteristics with accuracies of more than 0.7, more specifically for the trait with moderate to high heritability. Further work is needed to validate if those predictions are stable from year to year, knowing that our regeneration/characterization trials are done in the same experimental station and applying the same optimal field management practices.
We have shown that reasonable prediction accuracies for genomic predictions can be achieved using a randomly chosen subset from genebank wheat collection representing a wide genetic variability. These findings should encourage genebank managers to identify novel variation for potential use in breeding programs and facilitate broad, detailed phenotypic characterization of the entire genebank collection. Further, genotyping the entire ex situ collection is then needed to take full advantage of such technology.
Genomic Predictions in Stratified Populations
Genebank collections generally exhibit a wide array of genetic diversity, as well as the population structure due to the domestication process, including natural and farmer selection, genetic drift, and local adaptation. The knowledge of this diversity and structure is essential to genebanks when optimizing the collection’s conservation policy to secure a continuum between the conservation and the use of the germplasm. As expected, a significant population structure in the collection of wheat landraces was identified in this study, with the first five principal components accounting for 80% of genetic variation. The strong population structure also showed a negative impact on performance in association studies and genomic prediction models, which was also found in other studies (Gou et al., 2014; Daetwyler et al., 2015). This degree of decrease was, however, dependent on way we accounted for the population structure in this study. For example, our study has noted that using a continuous axis from PCA analysis or discrete population assignment from structure or DAPC gave very contrasting results from almost no change in prediction accuracy to a significant reduction in prediction accuracy. Also, running genomic prediction for each of the subpopulation may or may not improve the accuracy depending on the subpopulation and the trait under study. Previous studies have shown that accounting for stratified populations is not an easy task in a genomic prediction models and this is generally done using the first five eigen values as covariates in a the GS model (Patterson et al., 2006; Daetwyler et al., 2014; Crossa et al., 2016; Norman et al., 2018). Further work and simulations should be undertaken to study the population structure effect carefully in the framework of genomic predictions.
Building on FIGS: FIGS +
FIGS has shown its relevance on delivering sources of resistance to diseases and sources of variation for important desirable trait to breeders worldwide for wheat and other ICARDA mandate crops (El Bouhssini et al., 2009, 2011; Khazaei et al., 2013). In recent years, FIGS is used by ICARDA to make predictive characterization for the genebank characterization traits for its collection (Azough et al., 2019). This is done by quantifying a relationship between collection site agro-climatic conditions and the presence of specific traits using machine learning algorithms. Moreover, the application FIGS has been successful for categorical traits such as growth stages, class of maturity, and tillering capacity. Other unpublished results have shown that the performance of these machine learning algorithms for quantitative traits was limited.
With rapid advances in genomics techniques, genetic resources users should be able to mine quickly genetic diversity as part of pre-breeding programs to achieve better and faster breeding outcomes and gains. More specifically, GS, which uses a genomic relationship matrix to predict the performance of germplasm based on GEBVs, could be more reliable and useful to harness genetic gain from genetic resources (Bernardo, 2016). Since it has been shown that the environment of landrace’s origin strongly influences gene flow and natural selection (Lin et al., 1975; Epperson, 1990), we have incorporated in this study an environmental similarity matrix based on landrace’s passport data in addition to the genomic relationship matrix in the framework of GS. The increase in the prediction accuracy was noticeable but not significant. End-use and quality traits are the important factors that influence the market values, as well as the maintenance of landraces and then genetic diversity by the farmers (Negri, 2003; Seboka and van Hintum, 2006; Shewayrga and Sopade, 2011). Thus, we suspect that the grain traits used in this study were not only resulting from a natural selection but also affected by farmer selection and preferences. To summarize, genomic predictions for genebank accessions could benefit from using other characterization data such as phenology, morphology, and yield components.
Genebank Conservation and Use in the Era of Genomic Predictions
To safeguard future food, fiber and fuel resource, global germplasm conservation will increasingly rely on genomic technologies. Beyond the conservation aspects where identifying duplicates and redundancies between collections can be assessed by using genomics (Singh et al., 2019), there is an opportunity of using high-density markers to mine more efficiently genetic resources for better use of genebank accessions in pre-breeding programs (Rasheed et al., 2018). GS, for example, was identified as an optimal mining tool to identify genetic resources for quantitative traits, as also shown in the current study. Moving forward, several challenges might limit the broad and routine use of GS, which include (1) the cost-effectiveness of genotyping, as the entire collection should be genotyped to take full advantage of GS; (2) aligning the genotyped and field-evaluated grains from the genebank; and finally, (3) dealing with population structure and forming the optimal training subset. The results in this study have shown that the use of passport information can be of a good start, but extra attention might be required for several collections that contain limited information on coordinates, especially for the old collections.
Conclusion
Evaluating the entire collection held by a genebank for all traits needed by breeding programs is resources consuming. Genebanks should stay innovative in the way where technologies could aid the identification of accessions that possess traits for new desirable variation. Our study demonstrated that genomic prediction has the potential of matching these outputs alone or augmented by passport information. This result will help breeders make better use of untapped genetic diversity.
Data Availability Statement
The datasets analyzed in this article are not publicly available. Requests to access the datasets should be directed toei5rZWhlbEBjZ2lhci5vcmc=.
Author Contributions
HA, AT, and AA delivered the seed and run the field experiment. AE and MS-G produced the grain scan data. ZK, MS-G, and CC analyzed the data. ZK wrote this article. AA, AT, MS-G, and CC provided insightful revisions and discussions. All authors reviewed the final version of the manuscript.
Funding
This study was funded by the CGIAR Genebank Platform and CRP Wheat.
Conflict of Interest
The authors declare that the research was conducted in the absence of any commercial or financial relationships that could be construed as a potential conflict of interest.
Acknowledgments
The genotyping characterization work was implemented by CIMMYT as part of the MasAgro Biodiversidad project in collaboration with ICARDA, made possible by the generous support of the Mexican Secretariat of Agriculture, Livestock, Rural Development, Fisheries and Food (SAGARPA) and CRP Wheat. Research work for CC is supported by the NSF-MRI 1626157.
Supplementary Material
The Supplementary Material for this article can be found online at: https://www.frontiersin.org/articles/10.3389/fevo.2020.00032/full#supplementary-material
References
Anglin, N., Amri, A., Kehel, Z., and Ellis, D. (2018). A case of need: linking traits to genebank accessions. Biopreserv. Biobank. 16, 337–349. doi: 10.1089/bio.2018.0033
Aparicio, N., Villegas, D., Araus, J. L., Blanco, R., and Royo, C. (2002). Seedling development and biomass as affected by seed size and morphology in durum wheat. J. Agric. Sci. 139, 143–150. doi: 10.1017/s0021859602002341411
Austin, R. B., Ford, M. A., and Morgan, C. L. (1989). Genetic improvement in the yield of winter wheat: a further evaluation. J. Agric. Sci. 112, 295–301. doi: 10.1007/s11032-017-0715-8
Azough, Z., Kehel, Z., Benomar, A., Bellafkih, M., and Amri, A. (2019). “Characterization of ICARDA genebank barley accessions,” in Intelligent Environments, Vol. 26, Ambient Intelligence, 121–129.
Bernardo, R. (2016). Bandwagons I, too, have known. Theor. Appl. Genet. 129, 2323–2332. doi: 10.1007/s00122-016-2772-5
Brancourt-Hulmel, M., Doussinault, G., Lecomte, C., Berard, P., Le Buanec, B., and Trottet, M. (2003). Genetic improvement of agronomic traits of winter wheat cultivars released in France from 1946 to 1992. Crop Sci. 43, 37–45.
Braunisch, V., Coppes, J., Arlettaz, R., Suchant, R., Schmid, H., and Bollmann, K. (2013). Selecting from correlated climate variables: a major source of uncertainty for predicting species distributions under climate change. Ecography 36, 971–983. doi: 10.1111/j.1600-0587.2013.00138.x
Butler, D., Cullis, B., Gilmour, A., and Gogel, B. (2009). ASReml R-Reference Manual. Hemel Hempstead: VSN International Ltd.
Crossa, J., de los Campos, G., Pérez-Rodríguez, P., Gianola, D., Burgueño, J., Araus, J. L., et al. (2010). Prediction of genetic values of quantitative traits in plant breeding using pedigree and molecular markers. Genetics 186, 713–724. doi: 10.1534/genetics.110.118521
Crossa, J., Jarquín, D., Franco, J., Juan, B., and Vikram, P. (2016). Genomic prediction of gene bank wheat landraces. G3 6, 1819–1834. doi: 10.1534/g3.116.029637
Curtis, B. C., Rajaram, S., and Gómez Macpherson, H. (2002). Bread Wheat Improvement and Production. Rome: FAO.
Daetwyler, H. D., Bansal, U. K., Bariana, H. S., Hayden, M. J., and Hayes, B. J. (2014). Genomic prediction for rust resistance in diverse wheat landraces. Theor. Appl. Genet. 127, 1795–1803. doi: 10.1007/s00122-014-2341-8
Daetwyler, H. D., Kemper, K. E., van der Werf, J. H. J., and Hayes, B. J. (2015). Components of the accuracy of genomic prediction in a multi-breed sheep population. J. Anim. Sci. 90, 3375–3384. doi: 10.2527/jas2011-4557
de Azevedo Peixoto, L., Moellers, T. C., Zhang, J., Lorenz, A. J., Bhering, L. L., Beavis, W. D., et al. (2017). Leveraging genomic prediction to scan germplasm collection for crop improvement. PLoS One 12:e0179191. doi: 10.1371/journal.pone.0179191
de los Campos, G., Gianola, D., Rosa, G. J. M., Weigel, K., and Crossa, J. (2010). Semi-parametric genomic-enabled prediction of genetic values using reproducing kernel Hilbert spaces methods. Genet. Res. 92, 295–308. doi: 10.1017/S0016672310000285
de los Campos, G., Naya, H., Gianola, D., Crossa, J., Legarra, A., Manfredi, E., et al. (2009). Predicting quantitative traits with regression models for dense molecular markers and pedigree. Genetics 182, 375–385. doi: 10.1534/genetics.109.101501
El Bouhssini, M., Street, K., Amri, A., Mackay, M., Ogbonnaya, F. C., Omran, A., et al. (2011). Sources of resistance in bread wheat to Russian wheat aphid (Diuraphis noxia) in Syria identified using the focused identification of germplasm strategy (FIGS). Plant Breed. 130, 96–97. doi: 10.1111/j.1439-0523.2010.01814.x
El Bouhssini, M., Street, K., Joubi, A., Ibrahim, Z., and Rihawi, F. (2009). Sources of wheat resistance to Sunn pest, Eurygaster integriceps Puton, in Syria. Genet. Resour. Crop Evol. 56, 1065–1069. doi: 10.1007/s10722-009-9427-9421
Epperson, B. K. (1990). Spatial autocorrelation of genotypes under directional selection. Genetics 124, 757–771.
Evers, A. (2000). “Grain size and morphology: implications for quality,” in Wheat Structure, Biochemistry and Functionality, ed. J. Schofield, (Cambridge, MA: The Royal Society of Chemistry), 19–24. doi: 10.1533/9781845698478.1.19
Evers, A. D., Cox, R. I., Shaheedullah, M. Z., and Withey, R. P. (1990). Predicting milling extraction rate by image analysis of wheat grains. Asp. Appl. Biol. 25, 417–426.
Fick, S. E., and Hijmans, R. J. (2017). WorldClim 2: new 1-km spatial resolution climate surfaces for global land areas. Int. J. Climatol. 37, 4302–4315. doi: 10.1002/joc.5086
Gegas, V. C., Nazari, A., Griffiths, S., Simmonds, J., Fish, L., Orford, S., et al. (2010). A genetic framework for grain size and shape variation in wheat. Plant Cell 22, 1046–1056. doi: 10.1105/tpc.110.074153
González-Camacho, J. M., de los Campos, G., Pérez, P., Gianola, D., Cairns, J., Mahuku, G., et al. (2012). Genome-enabled prediction of genetic values using radial basis function neural networks. Theor. Appl. Genet. 125, 759–771. doi: 10.1007/s00122-012-1868-9
Gou, Z., Tucker, D. M., Basten, C. J., Gandhi, H., Ersoz, E., Guo, B., et al. (2014). The impact of population structure on genomic prediction in stratified populations. Theor. Appl. Genet. 127, 749–762. doi: 10.1007/s00122-013-2255-x
Grieve, C. M., and Francois, L. E. (1992). The importance of initial seed size in wheat plant response to salinity. Plant Soil 147, 197–205. doi: 10.1007/bf00029071
Heslot, N., Yang, H. P., Sorrells, M. E., and Jannink, J. L. (2012). Genomic selection in plant breeding: a comparison of models. Crop Sci. 52, 146–160. doi: 10.2135/cropsci2011.06.0297
Hu, X., Carver, B. F., Powers, C., Yan, L., and Chen, C. (2019). Genomic selectin and response to selection vy designed training population for grain yield and end-use quality traits in winter wheat variety development programs. Plant Genome 12. doi: 10.3835/plantgenomc2018.11.0090
Jombart, T., Devillard, S., and Balloux, F. (2010). Discriminant analysis of principal components: a new method for the analysis of genetically structured populations. BMC Genet. 11:94. doi: 10.1186/1471-2156-11-94
Khazaei, H., Street, K., Bari, A., Mackay, M., and Stoddard, F. (2013). The FIGS Focused Identification of Germplasm Strategy (FIGS) approach identifies traits related to drought adaptation in Vicia faba genetic resources. PLoS One 8:e63107. doi: 10.1371/journal.pone.0063107
Levandi, T., Püssa, T., Vaher, M., Ingver, A., Koppel, R., and Kaljurand, M. (2014). Principal component analysis of HPLC–MS/MS patterns of wheat (Triticum aestivum) varieties. Proc. Estonian Acad. Sci. 63, 86–92.
Lin, W., Bradshaw, A. D., and Thurman, D. A. (1975). The potential for evolution of heavy metal tolerance in plants. III. The rapid evolution of copper tolerance in Agrostis stolonifera. Heredity 34, 165–187. doi: 10.1038/hdy.1975.21
Lopes, M. S., Reynolds, M. P., Jalal-Kamali, M. R., Moussa, M., Feltaous, Y., Tahir, I. S. A., et al. (2012). The yield correlations of selectable physiological traits in a population of advanced spring wheat lines grown in warm and drought environments. Field Crops Res. 128, 129–136. doi: 10.1016/j.fcr.2011.12.017
López-Cruz, M., Crossa, J., Bonnett, D., Dreisigacker, S., Poland, J., Jannink, J. L., et al. (2015). Increased prediction accuracy in wheat breeding trials using a marker × environment interaction genomic selection model. G3 5, 569–582. doi: 10.1534/g3.114.016097
Mackay, M. C., and Street, K. (2004). “Focused identification of germplasm strategy—FIGS,” in Cereals 2004, Proceedings of the 54th Australian Cereal Chemistry Conference and the 11th Wheat Breeders’ Assembly Cereal Chemistry Division, eds C. K. Black, J. F. Panozzo, and G. J. Rebetzke, (Melbourne: Royal Australian Chemical Institute), 138–141.
Manickavelu, A., Hattori, T., Yamaoka, S., Yoshimura, K., Kondou, Y., Onogi, A., et al. (2017). Genetic nature of elemental contents in wheat grains and its genomic prediction: toward the effective use of wheat landraces from Afghanistan. PLoS One 12:e0169416. doi: 10.1371/journal.pone.0169416
Meuwissen, T. H. E., Hayes, B. J., and Goddard, M. E. (2001). Prediction of total genetic value using genome-wide dense marker maps. Genetics 157, 1819–1829.
Negri, V. (2003). Landraces in central Italy: where and why they are conserved and perspectives for their on-farm conservation. Genet. Resour. Crop Evol. 50, 871–885.
Nesbitt, M. (2002). “When and where did domesticated cereals first occur in southwest Asia?,” in The Dawn of Farming in the Near East. Studies in Early Near Eastern Production, Subsistence, and Environment, eds R. T. J. Cappers and S. Bottema, (Berlin: Ex Oriente), 113–132.
Norman, A., Taylor, J., Edwards, J., and Kuchel, H. (2018). Optimising genomic selection in wheat: effect of marker density, population size and population structure on prediction accuracy. G3 8, 2889–2899. doi: 10.1534/g3.118.200311
Pasam, R. K., Bansal, U., Daetwyler, H. D., Forrest, K. L., Wong, D., Petkowski, J., et al. (2017). Detection and validation of genomic regions associated with resistance to rust diseases in a worldwide hexaploid wheat landrace collection using BayesR and mixed linear model approaches. Theor. Appl. Genet. 130, 777–793. doi: 10.1007/s00122-016-2851-7
Patterson, N., Price, A., and Reich, D. (2006). Population structure and eigenanalysis. PLoS Genet. 2:e190. doi: 10.1371/journal.pgen.0020190
Pérez-Rodríguez, P., Gianola, D., González-Camacho, J. M., Crossa, J., Manes, Y., and Dreisigacker, S. (2012). Comparison between linear and non-parametric models for genome-enabled prediction in wheat. G3 2, 1595–1605. doi: 10.1534/g3.112.003665
R Core Team (2016). R: A Language and Environment for Statistical Computing. Vienna: R Foundation for Statistical Computing.
Rasheed, A., Mujeeb-Kazi, A., Ogbonnaya, F., He, Z., and Rajaram, S. (2018). Wheat genetic resources in the post-genomics era: promise and challenges. Ann. Bot. 121, 603–616. doi: 10.1093/aob/mcx148
Royo, C., Álvaro, F., Martos, V., Ramdani, A., Isidro, J., Villegas, D., et al. (2007). Genetic changes in durum wheat yield components and associated traits in Italian and Spanish varieties during the 20th century. Euphytica 155, 259–270. doi: 10.1007/s10681-006-9327-9
Sanchez-Garcia, M., Royo, C., Aparicio, N., Martín-Sánchez, J. A., and Álvaro, F. (2013). Genetic improvement of bread wheat yield and associated traits in Spain during the 20th century. J. Agric. Sci. 151, 105–118. doi: 10.1017/S0021859612000330
Seboka, B., and van Hintum, T. (2006). The dynamics of on-farm management of sorghum in Ethiopia: implication for the conservation and improvement of plant genetic resources. Genet. Resour. Crop Evol. 53, 1385–1403. doi: 10.1007/s10722-005-5676-9
Shewayrga, H., and Sopade, P. (2011). Ethnobotany, diverse food uses, claimed health benefits and implications on conservation of barley landraces in North Eastern Ethiopia highlands. J. Ethnobiol. Ethnomed. 7:19. doi: 10.1186/1746-4269-7-19
Siddique, K. H. M., Belford, R. K., Perry, M. W., and Tennant, D. (1989). Growth, development and light interception of old and modern wheat cultivars in a Mediterranean-type environment. Austral. J. Agric. Res. 40, 473–487.
Singh, N., Wu, S., Raupp, W. J., Sehgal, S., Arora, S., Tiwari, V., et al. (2019). Efficient curation of genebanks using next generation sequencing reveals substantial duplication of germplasm accessions. Sci. Rep. 9:410779. doi: 10.1038/s41598-018-37269-0
Thorwarth, P., Yousef, E. A. A., and Schmid, K. J. (2017). Genomic prediction and association mapping of curd-related traits in genebank accessions of cauliflower. G3 8, 707–718. doi: 10.1534/g3.117.300199
Title, P. O., and Bemmels, J. B. (2018). ENVIREM: an expanded set of bioclimatic and topographic variables increases flexibility and improves performance of ecological niche modeling. Ecography 41, 291–307. doi: 10.1111/ecog.02880
VanRaden, P. M. (2007). Genomic measures of relationship and inbreeding. Interbull. Bull. 37, 33–36.
Varona, L., Legarra, A., Toro, M. A., and Vitezica, Z. G. (2018). Non-additive effects in genomic selection. Front. Genet. 9:78. doi: 10.3389/fgene.2018.00078
Whan, A. P., Smith, A. B., Cavanagh, C. R., Ral, J. P. F., Shaw, L. M., Howitt, C. A., et al. (2014). GrainScan: a low cost, fast method for grain size and colour measurements. Plant Methods 10, 1–10. doi: 10.1186/1746-4811-10-23
Zhang, X., Sallam, A., Gao, L., Kantarski, T., Poland, J., DeHaan, L. R., et al. (2016). Establishment and optimization of genomic selection to accelerate the domestication and improvement of intermediate wheatgrass. Plant Genome 9, 1–18. doi: 10.3835/plantgenome2015.07.0059
Keywords: wheat, genomic selection, seed characteristics, landraces, genebank
Citation: Kehel Z, Sanchez-Garcia M, El Baouchi A, Aberkane H, Tsivelikas A, Charles C and Amri A (2020) Predictive Characterization for Seed Morphometric Traits for Genebank Accessions Using Genomic Selection. Front. Ecol. Evol. 8:32. doi: 10.3389/fevo.2020.00032
Received: 11 October 2019; Accepted: 05 February 2020;
Published: 17 March 2020.
Edited by:
Genlou Sun, Saint Mary’s University, CanadaReviewed by:
Raj K. Pasam, AgriBio, La Trobe University, AustraliaVetriventhan Mani, International Crops Research Institute for the Semi-Arid Tropics (ICRISAT), India
Copyright © 2020 Kehel, Sanchez-Garcia, El Baouchi, Aberkane, Tsivelikas, Charles and Amri. This is an open-access article distributed under the terms of the Creative Commons Attribution License (CC BY). The use, distribution or reproduction in other forums is permitted, provided the original author(s) and the copyright owner(s) are credited and that the original publication in this journal is cited, in accordance with accepted academic practice. No use, distribution or reproduction is permitted which does not comply with these terms.
*Correspondence: Zakaria Kehel, ei5rZWhlbEBjZ2lhci5vcmc=