 Peng Yan1†Tao Pan1†Guiyou Wu2Xing Kang2
 Izaz Ali1Wenliang Zhou3
 Jiatang Li4
 Xiaobing Wu1*
 Baowei Zhang1,2*
- 1Anhui Provincial Key Laboratory of the Conservation and Exploitation of Biological Resources, College of Life Sciences, Anhui Normal University, Wuhu, China
- 2School of Life Sciences, Anhui University, Hefei, China
- 3Key Lab of Animal Ecology and Conservation Biology, Institute of Zoology, Chinese Academy of Sciences, Beijing, China
- 4Chengdu Institute of Biology, Chinese Academy of Sciences, Chengdu, China
Species are the cornerstone in many domains of biology research, which make accurate species delimitation critically important. In this study, the systematics and biogeography of the Hyla chinensis group were analyzed based on phylogeny, species delimitation, and ancestral area reconstruction methods. The phylogenetic results showed that six specific clusters existed in the H. chinensis group. Bayesian Phylogenetics and Phylogeography (BPP) analysis indicated that six distinct species exist due to the high probability values (>0.95), which were also supported by the Bayes factor (BF) analysis. The divergence time of the H. chinensis group was estimated to date back to 18.84 million years ago (Mya) in the early Miocene. Combining the results of ancestral area reconstruction, the H. chinensis group might have originated from Guangxi-Hainan, then spread eastwardly and reached Nanling Mountains, Wuyi Mountains, Huangshan Mountain, and Taiwan. In right-about colonization, it was gradually extended to the Yunnan-Guizhou Plateau, Sichuan Basin, Qinling Mountains, and Dabie Mountains. Considering the geological movement from early Miocene to Pliocene, the colonization pattern of the H. chinensis group may be closely related to the progressive uplift of the Qinghai-Tibetan Plateau (QTP) and historical climate change. Our study provided evidence for species delimitation and speciation process within the H. chinensis group. Our study supported the hypothesis that the evolutionary divergence in this species group was a consequence of the progressive uplift of the QTP and environmental change.
Introduction
For biogeography, abiotic factors (e.g., climate changes and tectonic events) and biological factors (e.g., interspecific or intraspecific interactions, competition, and predation) act as the major drivers temporally and geographically for biological evolution and diversification (Benton, 2009). Generally, for mountainous landscapes, the interactions of those factors provided beneficial conditions for the various microhabitats. Herein, those species endemic to mountain habitats often exhibit special phylogeographic patterns, such as the relatively small populations with well-defined geographical boundaries (Shepard and Burbrink, 2011; Huang et al., 2017; Pan et al., 2019). In southern China, many mountains (e.g., Hengduan Mountains, Qinling Mountains, Daba Mountains, Wuyi Mountains, and Dabie Mountains) are scattered, which form potential spatially isolated sky islands, providing various microhabitats with beneficial conditions for the speciation process of endemic species (Gao et al., 2015; Zhen et al., 2016). For example, due to the various microhabitats under climate and tectonic events, the Qinghai-Tibetan Plateau (QTP) had significant influence on the evolution of many animal groups (Päckert et al., 2012; Favre et al., 2015).
Species are considered the cornerstone of research in biology fields (e.g., evolutionary biology, biogeography) (Aldhebiani, 2018), which makes appropriate and accurate species delimitation increasingly meaningful (Yang and Rannala, 2010; Grummer et al., 2014; Blair and Bryson, 2017; Kajtoch et al., 2017; Kotsakiozi et al., 2018; Sheridan and Stuart, 2018). The genus Hyla (Hylidae, Anura) comprised 35 recent described species (19 species distributed in Eurasia; 16 species distributed in North and Central America) (Frost, 2014; Li et al., 2015). Hyla chinensis group, mainly distributed in China, is one of the species complexes in Hyla. As for the number of species identified in the H. chinensis group, it is controversial (Hua et al., 2009; Li et al., 2015). One supported that it included seven species (Hyla annectans, H. chinensis, Hyla hallowelli, Hyla sanchiangensis, Hyla simplex, Hyla tsinlingensis, and Hyla zhaopingensis) (Hua et al., 2009); the other study supported only six species (H. annectans, H. chinensis, H. simplex, H. sanchiangensis, H. tsinlingensis, and H. zhaopingensis) and five subspecies in H. annectans (H. a. chuanxiensis, H. a. gongshanensis, H. a. jingdongensis, H. a. tengchongensis, and H. a. wulingensis) (Li et al., 2015). Combining those results, it is more urgent to solve the problem of determined number of species and subspecies within this species complex based on species delimitation methods.
On the other hand, Li et al. (2015) had demonstrated that the Hyla originated from North America, then diffused to China via Beringia during the Middle Eocene to Early Oligocene (Smith et al., 2005; Wiens et al., 2006), which may be inferred that the speciation of H. chinensis group may be from northern China to southern China. However, the phylogenetic tree in the study by Li et al. (2015) disclosed that the base clades of H. chinensis group were all located in southern China, which may be a hint of another expansion route of the H. chinensis group.
Using genetic data and multiple analysis methods to solve taxonomic uncertainties enables us to disclose phylogenetic topology and speciation process. Here, we reveal a phylogeny of the H. chinensis group based on multiple mitochondrial and nuclear genes covering currently described species or subspecies within the H. chinensis group (Li et al., 2015). On the basis of species delimitation methods, we aim to clarify systematic and taxonomic matters bound up with species within the H. chinensis group. Meanwhile, we evaluate whether orogeny and climate oscillations affected the speciation and evolutionary history of H. chinensis group.
Materials and Methods
Ethics Statement
In this study, the sample collection of H. tsinlingensis and H. chinensis was conducted by a long-term investigation project on amphibian diversity in Dabie Mountains and Huangshan Mountain. This investigation project and sample collection were approved by the Anhui Normal University Academic Ethics Committee, Anhui Province, China.
Taxon Sampling
Based on previous study, we embraced almost all currently recognized species (76 individuals) within the H. chinensis group (Li et al., 2015) and chose two species (Hyla arborea, Hyla orientalis) as outgroups. Additionally, our own specimens (17 H. tsinlingensis individuals and two H. chinensis individuals) were collected from Dabie Mountains and Huangshan Mountain during 2011 to 2014, all samples were non-invasive sampling and the specimens were stored in School of Life Sciences, Anhui University, China (Figure 1). Details on specimen vouchers and GenBank accession numbers and specimen sites are listed in Table 1.
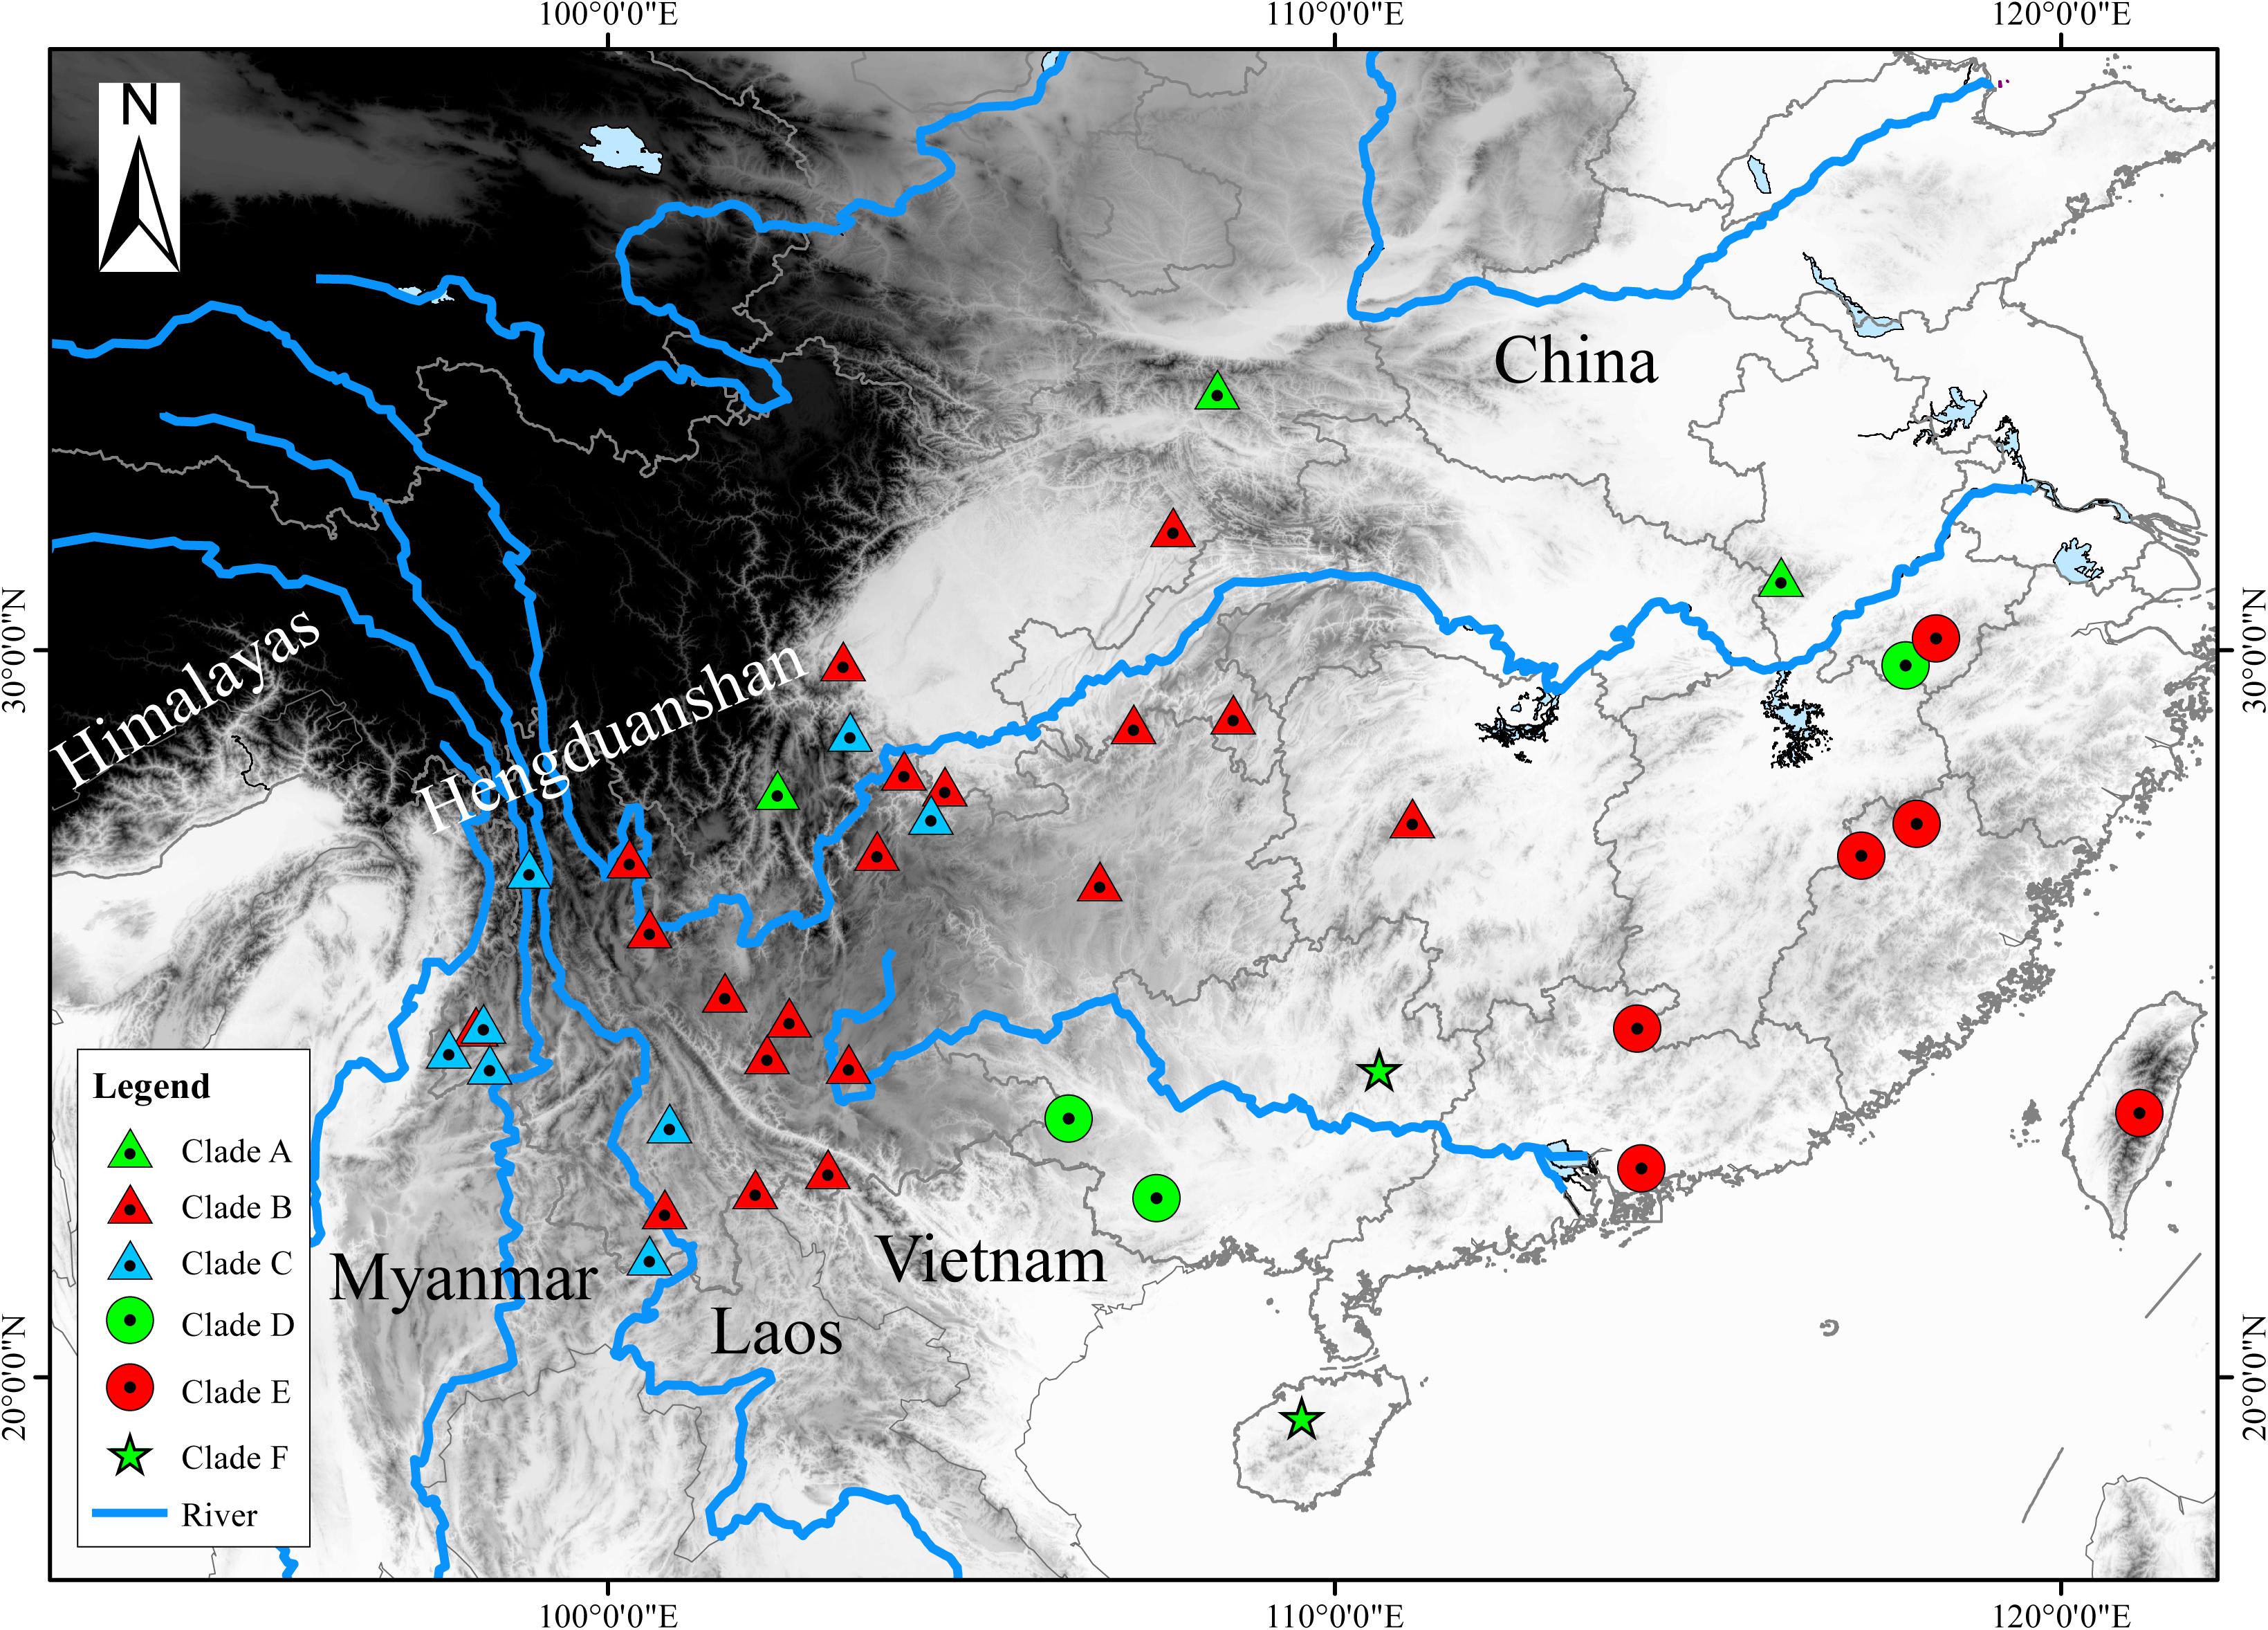
Figure 1. Map with the locality samples of the Hyla chinensis group in this study. The sampling sites of each clade (A–F) were marked with different triangles or dots in different colors. These clades (A–F) correspond to the clades in Figures 2, 3. The black and white coloration represents elevation.
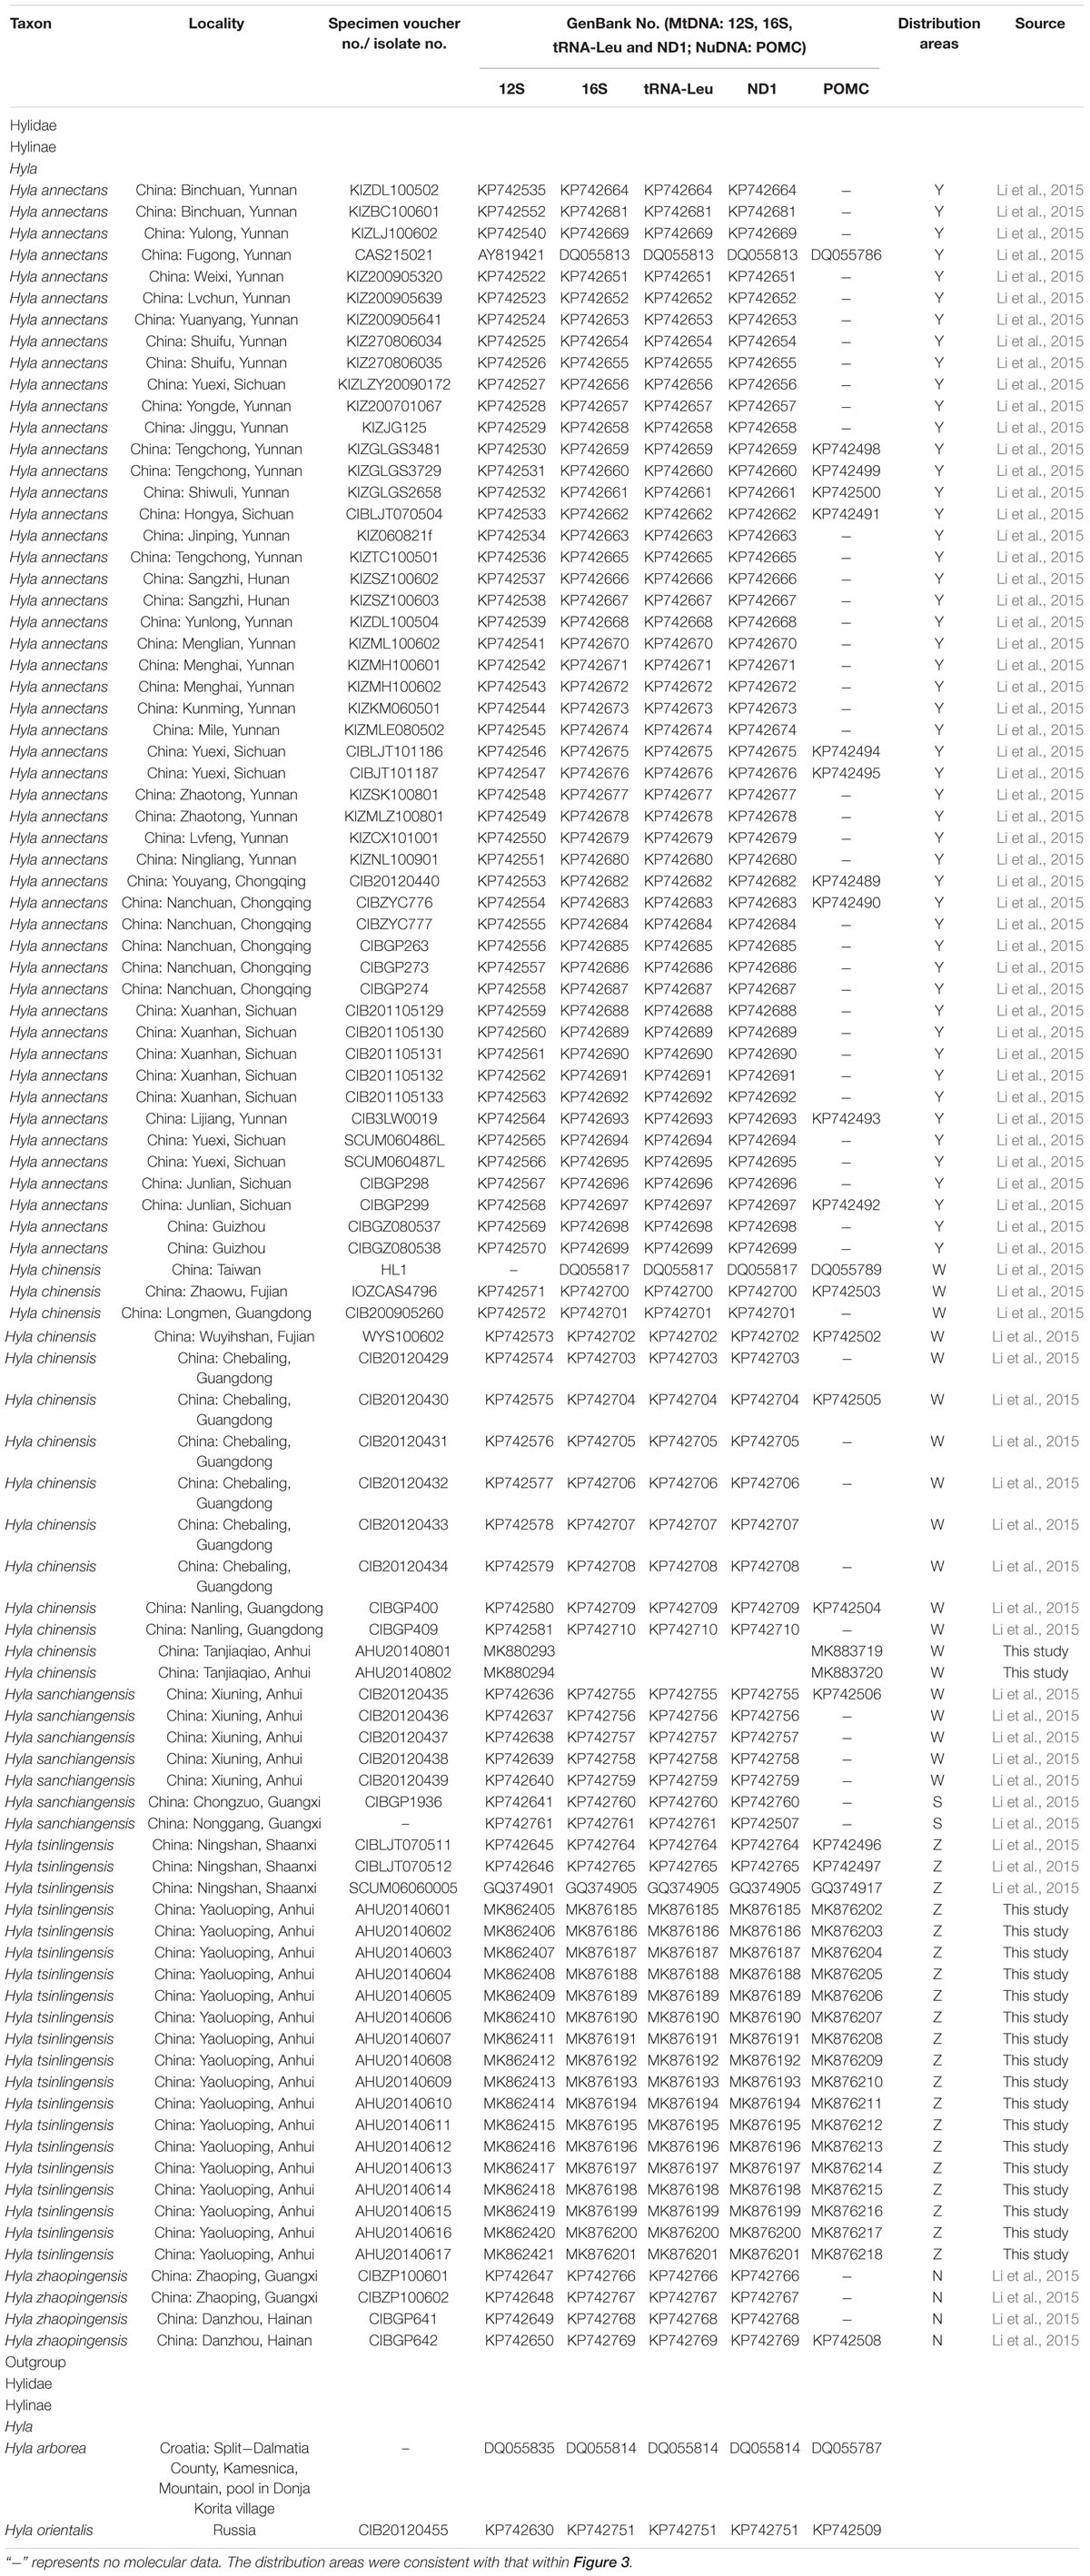
Table 1. Samples, with sampling site, museum voucher nos., and GenBank accession nos. of corresponding sequences.
Laboratory Methods
The proteinase K digestion and phenol/chloroform extraction method were used to extract total genomic DNA (Sambrook et al., 1989). For combined previous sequence data (Li et al., 2015), the same genes were selected based on published primers and new primers (Supplementary Table S1), including four mitochondrial genes (12S ribosomal small subunit gene/12S rRNA, NADH dehydrogenase subunit 1 gene/ND1, tRNA-Leu, and the partial 16S ribosomal large subunit gene/16S) and one nuclear protein-coding gene (proopiomelanocortin A/POMC) (Wiens et al., 2005).
All PCRs were performed within the same conditions in 30 μl volume: 10–40 ng of genomic DNA, 15 μl 2 × EasyTaq PCR SuperMix polymerase (containing 1 U Ex Taq, 0.4 mM dNTP, 3 mM Mg2+; TransGen Biotech) and 0.2 μM of primers. PCRs were performed by the following protocol: an initial denaturing step of 5 min at 94°C, followed by 32 cycles with denaturing 30 s at 94°C, annealing 30 s at 50°C and 55°C (for mitochondrial gene and nuclear gene, respectively), extending 40 and 100 s (for mitochondrial gene and nuclear gene, respectively) at 72°C, and a final extension step of 10 min conducted at 72°C. PCR samples were checked on a 1% agarose gel. Subsequently, PCR products were purified by EasyPure PCR Purification Kit (TransGene), and each fragment was sequenced in both directions on the ABI 3730 semiautomated sequencer (PE Applied Biosystems).
Sequence Processing and Phylogenetic Analyses
The DNA analysis package DNASTAR Lasergene Seqman and EditSeq v.7.1 were used to proofread or assemble the resulting sequences of all genes (Burland, 1999) with default parameters, and the nucleotide sequences were checked by eyes. All the genes were concatenated for analysis and aligned in MEGA v.7.0 (Tamura et al., 2011). Aligned sequences had a total length of 2,474 bp (12S rRNA, 815 bp; 16S+tRNA+ND1, 1,172 bp; POMC, 487 bp). Two datasets were applied in phylogenetic analyses: (1) a data set consisting of the combined mtDNA genes (12S rRNA+16S+tRNA+ND1) was used to conduct species tree, Bayes factor (BF) delimitation (BFD) analyses (Sullivan and Joyce, 2005), infer divergence times, phylogenetic network, and genetic distance analysis; (2) the entire set of mitochondrial and nuclear genes (12S rRNA+16S+tRNA+ND1+POMC) was used to conduct the phylogenetic reconstruction [maximum likelihood (ML); Bayesian] and Bayesian Phylogenetics and Phylogeography (BPP) analysis (Rannala and Yang, 2003; Yang and Rannala, 2010).
Before phylogenetic analysis, the software jModeltest v.2 (Darriba et al., 2012) was used to find the best-fit nucleotide substitution model of each gene using Bayesian information criterion (BIC), and this optimal model (GTR+G, 12S; GTR+I+G, 16S+tRNA+ND1+POMC) was selected and implemented in all downstream analyses. Bayesian phylogenetic analysis was performed on different partitions of mitochondrial and nuclear datasets with a mixed-model approach separated into using MrBayes v.3.2.2 (Ronquist and Huelsenbeck, 2003). The homologous sequence of H. arborea and H. orientalis was used as outgroups. Two independent runs of Markov Chain Monte Carlo (MCMC) analyses for 10 million generations were conducted. The run was sampled every 1,000 generations, and 10% of the initial samples were discarded as “burn-in.” The ML tree was generated with RAxML v.7.0.3 (Stamatakis, 2008) using the GTR model for mitochondrial and nuclear datasets. Support of nodes was calculated with 1,000 bootstrap replicates with the fast bootstrapping algorithm. Aside from the above analysis, we also operated “net between putative species mean distance” between the H. chinensis group species with 1,000 bootstrap replicates by Kimura two-parameter model on mitochondrial genes in MEGA v.7.0 (Tamura et al., 2011).
Divergence Time Estimation
Mitochondrial genes were used to estimate divergence times among H. chinensis group in BEAST v.1.8.0 (Drummond et al., 2012). An MCMC approach with uncorrelated lognormal relaxed molecular clock for rate variation was set. Two independent runs were performed, consisting of 10 million generations, each run sampling every 1,000 generations with a burn-in set to 10% of the samples. Tracer v.1.6 was used to check the stationarity of results (Rambaut and Drummond, 2007). TreeAnnotator v.1.8.0 (Rambaut and Drummond, 2007) and FigTree v. 1.4.2 (Rambaut, 2014) was used to annotate and visualize tree information. In the absence of appropriate fossils, we selected several calibration points information from previous work (Li et al., 2015), assuming a normal distribution for the divergence time between H. arborea group and the H. chinensis group, with a mean of 23 million years ago (Mya) and standard deviation of 3.04 (18–28 Mya).
Bayes Factor Delimitation
The BF is a common species delimitation selection tool in phylogenetics (Sullivan and Joyce, 2005) based on the marginal-likelihood estimates (MLE) via path-sampling (PS) and stepping-stone sampling (SS) analyses (Fan et al., 2011; Xie et al., 2011; Li and Drummond, 2012). The scopes of BF are as follows: 0 < BF < 2 is not worth more than a bare mention, 2 < BF < 6 is positive evidence, 6 < BF < 10 is strong support, and BF > 10 is decisive (Drummond et al., 2012). Coupled with the former studies (Hua et al., 2009; Li et al., 2015) and the above phylogenetic analysis inference, six ingroup species in the H. chinensis group were assumed and four species delimitation scenarios (True, Lump, Split, and Reassign) were generated to disclose the inner species number in ∗BEAST (Heled and Drummond, 2010). For “True” scenario, individuals were assigned to six ingroup species in the H. chinensis group as prior set. For the “Lump” scenario, we inferred that two ingroup species were regarded as a single species, corresponding to the ingroup number of species from six to five. In contrast, the “Split” scenario suggested two ingroup species each split into two species, which indicated the total number of ingroup species from six to eight. As to the “Reassign” scenario, a total of three individuals were “incorrectly” reassigned to different ingroup species than in the “True” tree. PS and SS analyses were each run, totaling 108 generations with a chain length of 106 generations for 100 path steps.
Bayesian Phylogenetics and Phylogeography
In contrast to the results of our BFD method and to a commonly used method of species delimitation, we performed species delimitation analysis with the phased dataset for the two mitochondrial loci and one nuclear locus implemented in BPP v.3.0 (Rannala and Yang, 2003; Yang and Rannala, 2010). This method utilizes a reversible jump MCMC (rjMCMC) algorithm to calculate the posterior probabilities to speciation events that contain more or less lineages (Yang and Rannala, 2010). Between all BPP analyses, probability values ≥0.95 were considered a strong support in favor of a speciation event (Leaché and Fujita, 2010). The guide tree was generated from the species tree.
The priors of ancestral population size (θ) and root age (τ) are directly related to the posterior probabilities of each result for the models. For example, the combination of large values for θ and small values for τ is assumed to be the most conservative, leading to a lower number of speciation events (Leaché and Fujita, 2010; Yang and Rannala, 2010). We evaluated three schemes of the prior of the θ and τ: (1) θ = G (1:2,000) and τ = G (1:10), (2) θ = G (1:2,000) and τ = G (1:100), (3) θ = G (2:2,000) and τ = G (1:10). The parameters of the rjMCMC analyses were set as 500,000 generations with sampling every 50 steps and 100,000 burn-in steps.
Species Tree Inference
The coalescent-based method implemented in ∗BEAST was used to construct the species tree (Heled and Drummond, 2010) based on mitochondrial genes. Two independent runs of 20 million generations were conducted. The sample frequency was set as 10,000 generations, and 10% of the total samples were discarded as burn-in. The other models and prior specification applied were set as follows: the nucleotide substitution model: HKY; Relaxed Uncorrelated Lognormal Clock (estimate); Yule process of speciation; random starting tree; alpha Uniform (0, 10). The convergence was checked by examining trace plots and histograms in Tracer. Runs were combined using LogCombiner. In addition, we tended to construct an uncorrected p-distances phylogenetic network with heterozygous ambiguities averaged and normalized by Splitstree v. 4.13.1 (Huson and Bryant, 2006). The neighbor-net ordinary least squares variance and equal angle algorithm were used, and 1,000 bootstrap replicates were calculated to assess branch support.
Ancestral Area Reconstruction
Geographical regions were delimited in terms of the current distribution area of the sequenced species of the H. chinensis group, at the same time, the information coming from the relevant literatures (Tang and Zhang, 1984; Li and Yang, 1985; Fei et al., 2009; Frost, 2014). The five areas were as follows: N, the southern China (Guangxi-Hainan provinces), which is a main distribution area of H. zhaopingensis; W, Eastern China; S, the southern Guangxi province in China, which is an important distribution range about H. sanchiangensis; Y, the eastern of the Tibetan Plateau (Yunnan-Guizhou Plateau and Sichuan Basin); Z, the Tsinling-Dabie Mountains (Figures 1, 3). LAGRANGE is a deep-time biogeographical model-based method that allows the incorporation of paleogeographical data (Ree and Smith, 2008; Chacón and Renner, 2014). Taking the effect of the LAGRANGE model components into account, we designed experiments that transform the adjacency matrix, hence, resulting in a total of three experiments (M0, M1, and M2). This is according to the assumption that the H. chinensis group, like all organisms, has a lower possibility to disperse over non-adjacent areas than adjacent areas. For this reason, no ranges were forbidden for M0; WZ, SZ, and NZ were forbidden for M1; WZ, NZ, SZ, and NY were forbidden for M2. To select the optimal model, we compared their log-likelihood (the data presented by LAGRANGE); meanwhile, we used the standard cutoff value of two log-likelihood units as indicating a conspicuous imbalance between models, with the less negative likelihood being preferred (Chacón and Renner, 2014). Ancestral areas were reconstructed by dispersal-extinction-cladogenesis model (Garzione et al., 2000) as carried out in the software Lagrange v.20130526 (Ree and Smith, 2008), and the chronogram obtained in BEAST was the starting component of the analyses.
Results
Phylogenetic analysis of concatenated sequences (mtDNA data and nuclear gene) recovered a well-resolved tree with six major clades (labeled A–F) within the H. chinensis group (Figures 2, 3). Clade A corresponds to H. tsinlingensis and H. annectans chuanxiensis, which are mainly located in the Qinling-Dabie mountains; Clade B included H. annectans, H. a. wulingensis, and H. a. jingdongensis, while H. a. gongshanensis and H. a. tengchongensis are within clade C, and they are all distributed in the Yunnan-Guizhou Plateau and Sichuan Basin. The remaining clade D (i.e., H. sanchiangensis), E (i.e., H. chinensis), and F (i.e., H. zhaopingensis) are located in the Guangxi province, Hainan province, and the Eastern China, respectively (Figures 2, 3). The phylogenetic network of the H. chinensis group showed the consistent groupings compared with the phylogenetic methods (Figure 4). Dating analyses indicated that the most recent common ancestor (MRCA) of the H. chinensis group dates back to 18.84 Mya [95% of the highest posterior density (HPD), 19.50–17.18 Mya] in the mid-Miocene. The divergence time between clades within the H. chinensis group was taken place from late Miocene (11.88 Mya) to the early Pleistocene (around 4.82 Mya) (Figure 3).
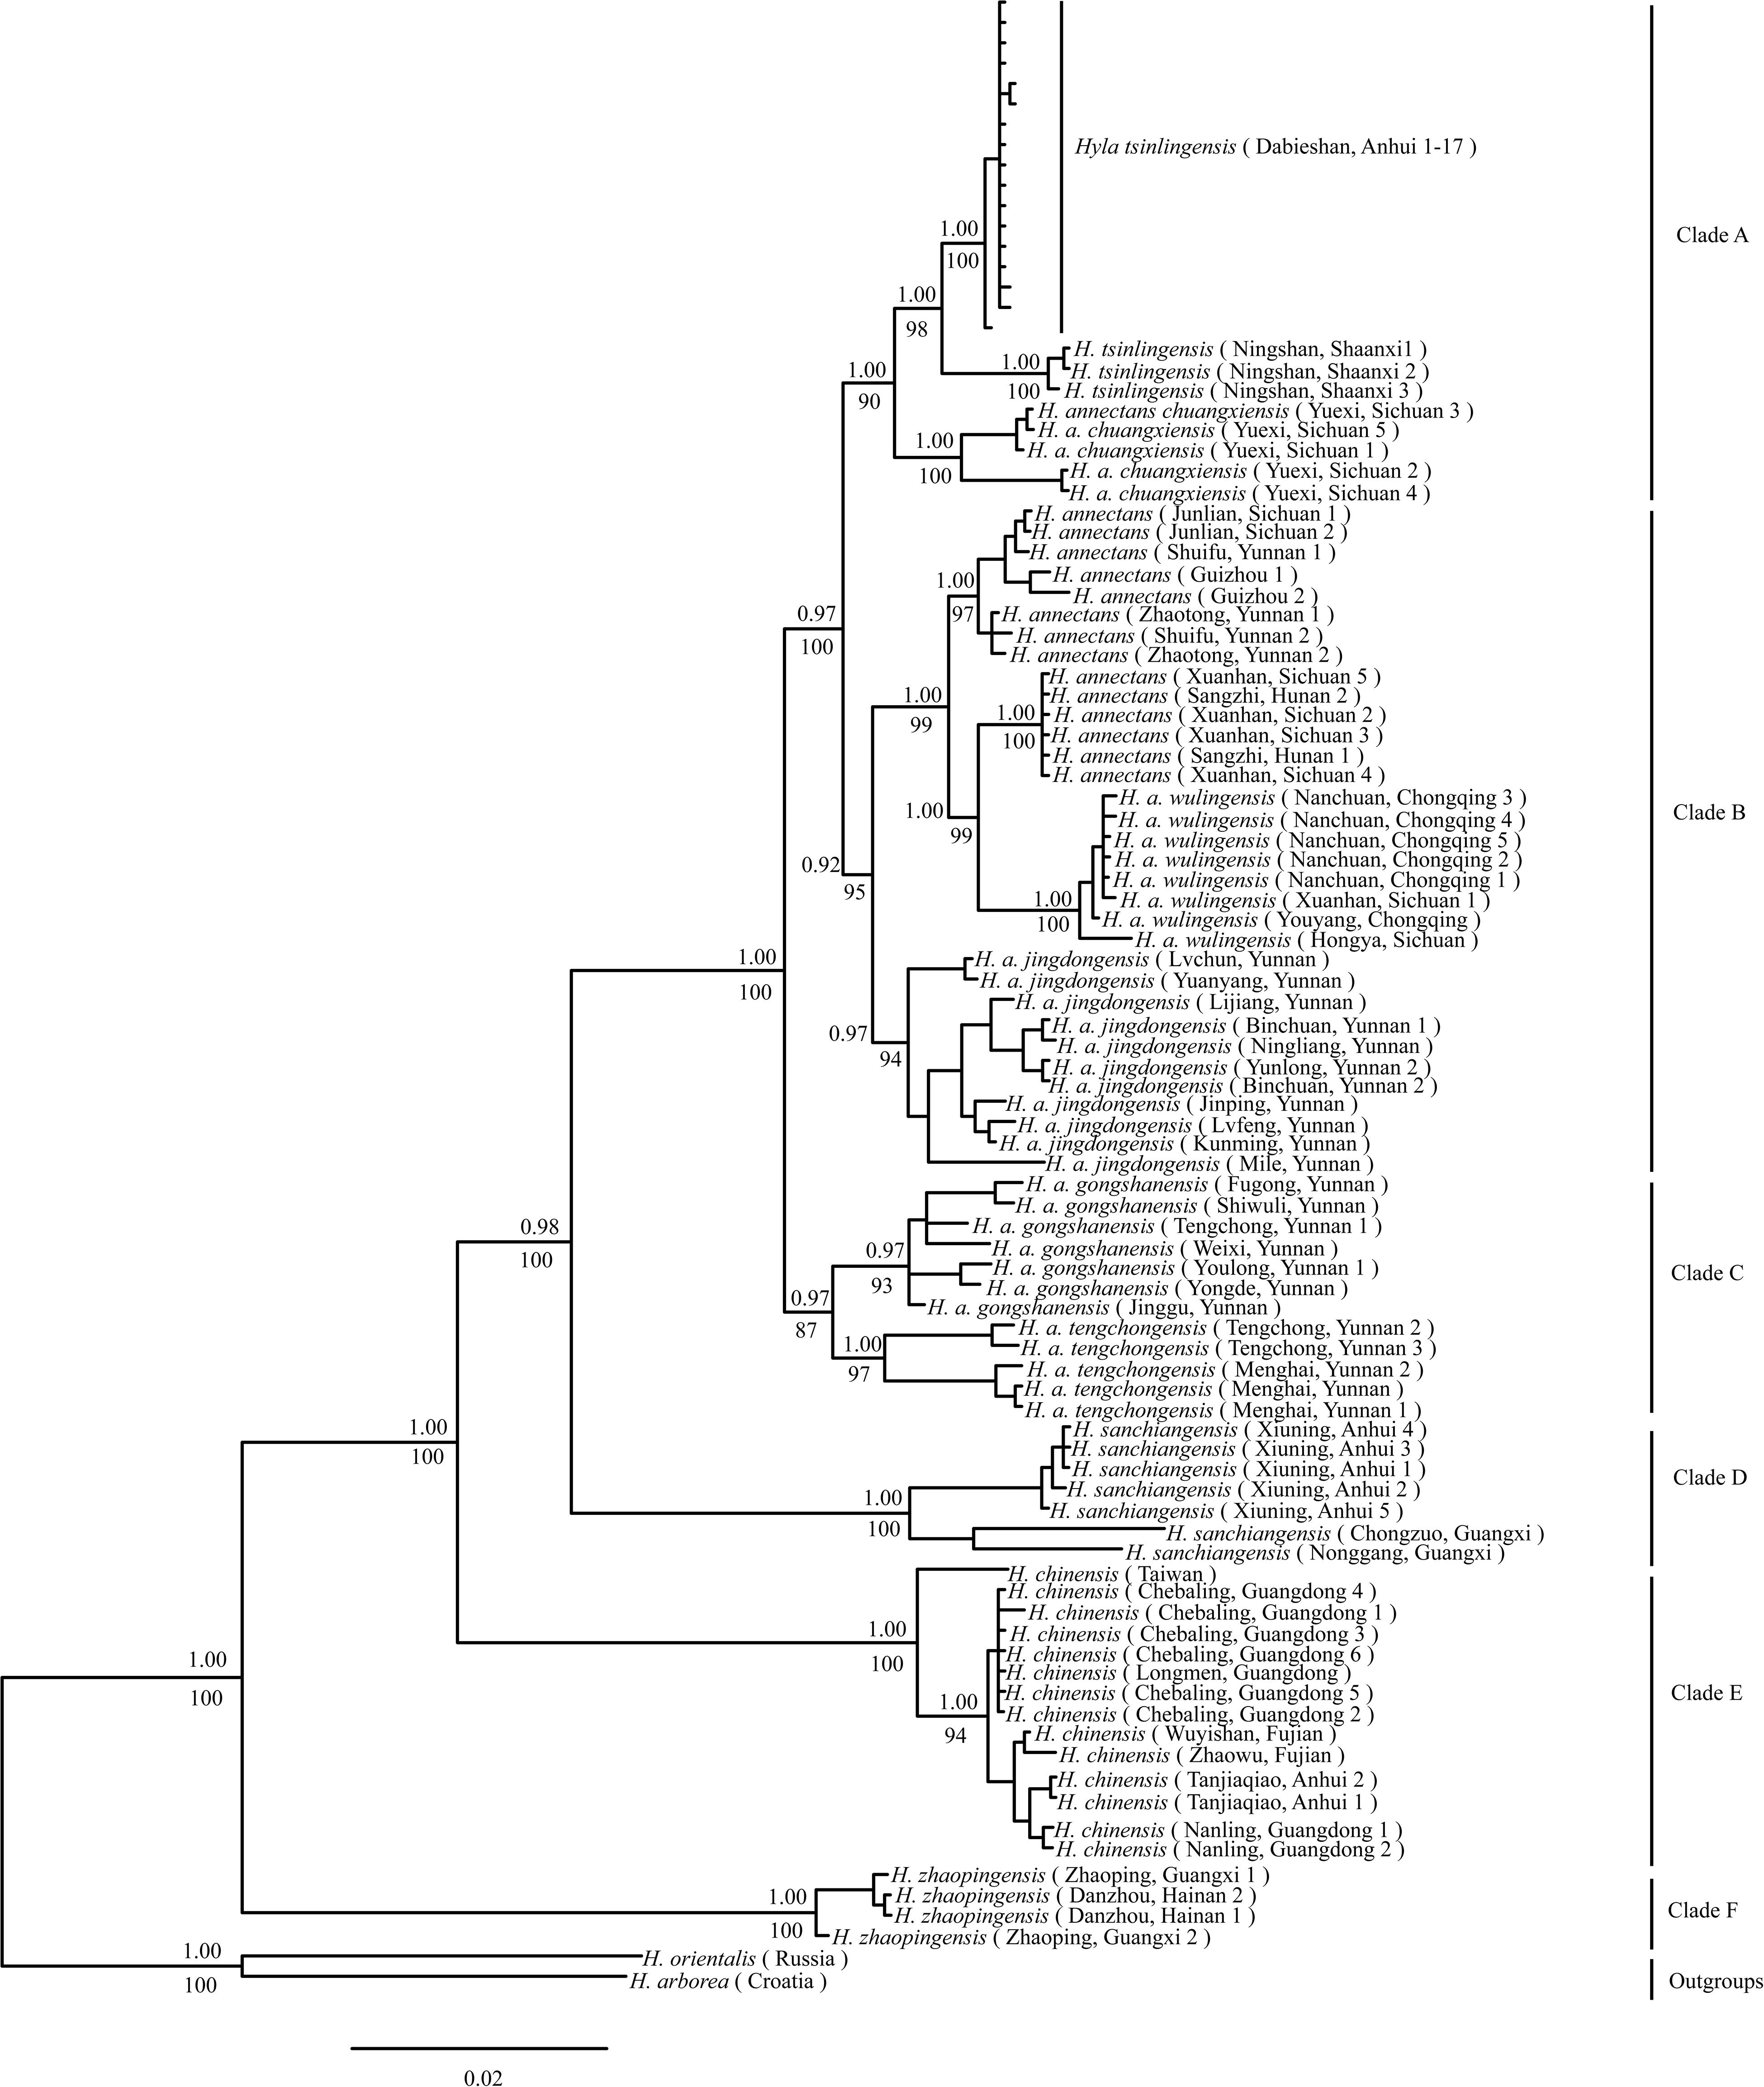
Figure 2. Phylogenetic relationship of the Hyla chinensis group by Bayesian phylogenetic and maximum likelihood (ML) analysis based on concatenated sequences (mtDNA and nuclear genes). Values above branches indicate Bayesian posterior probabilities, below bootstrap values of the ML analysis. (A–F) represents the six clades within the H. chinensis group.
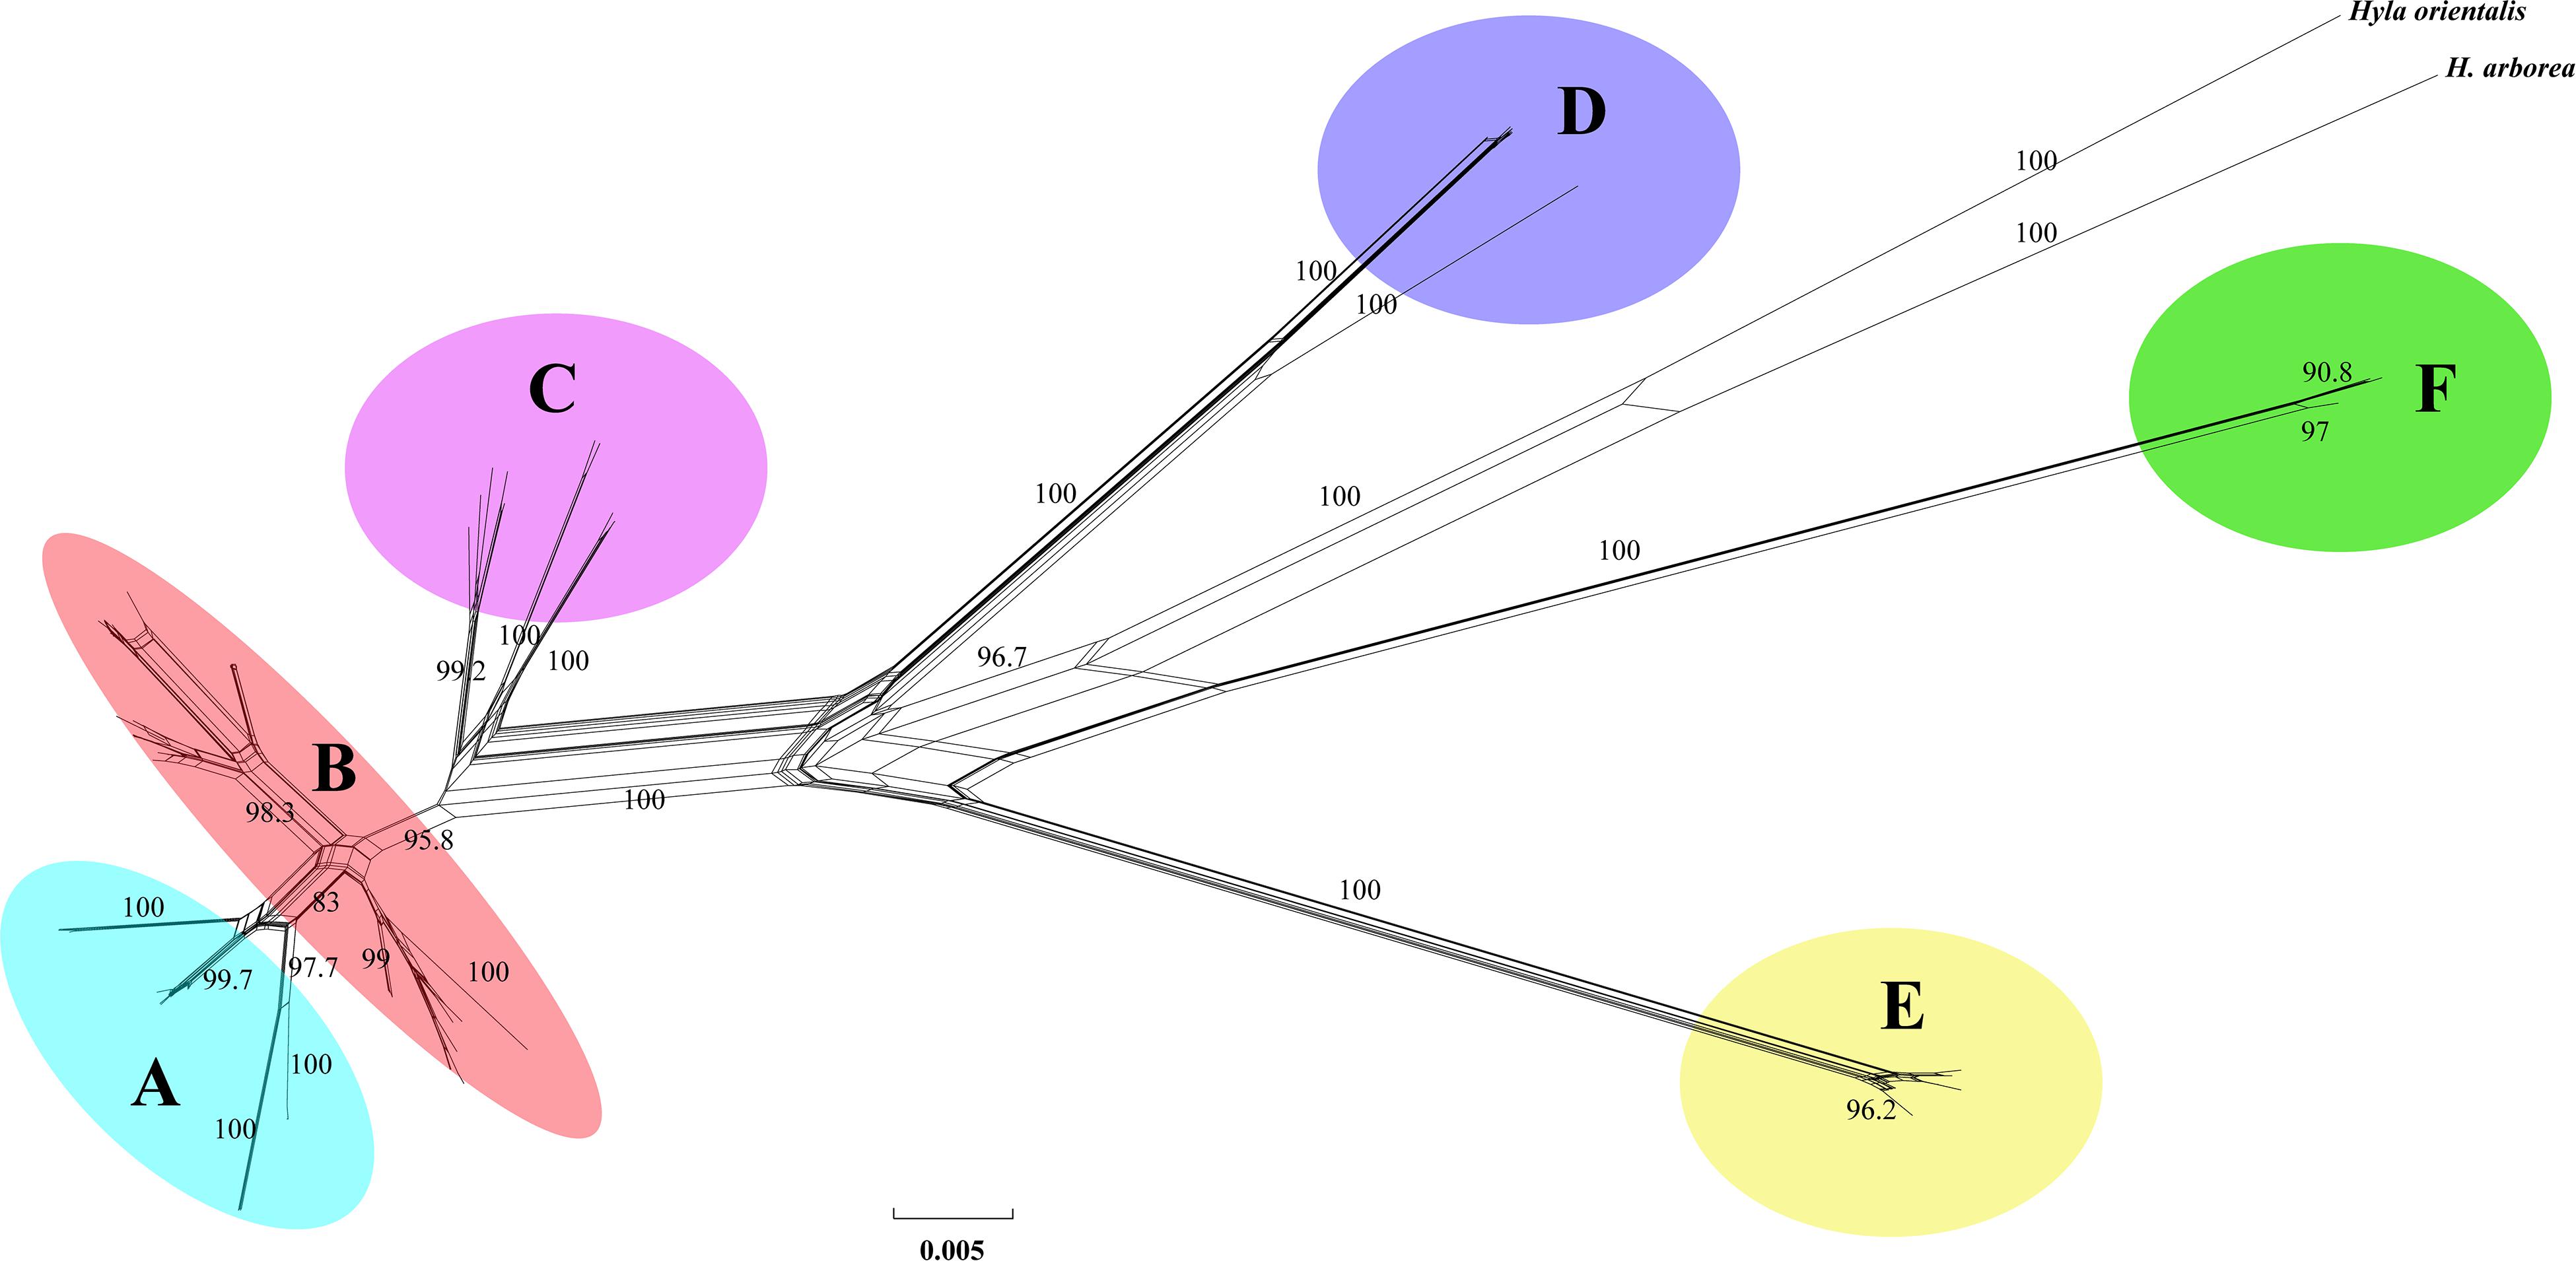
Figure 3. Network constructed from the mtDNA genes of the Hyla chinensis group based on uncorrected p-distances using SPLITSTREE. The values on nodes indicate bootstrap support (only values above 75% are shown). (A–F) represents the six clades within the H. chinensis group.
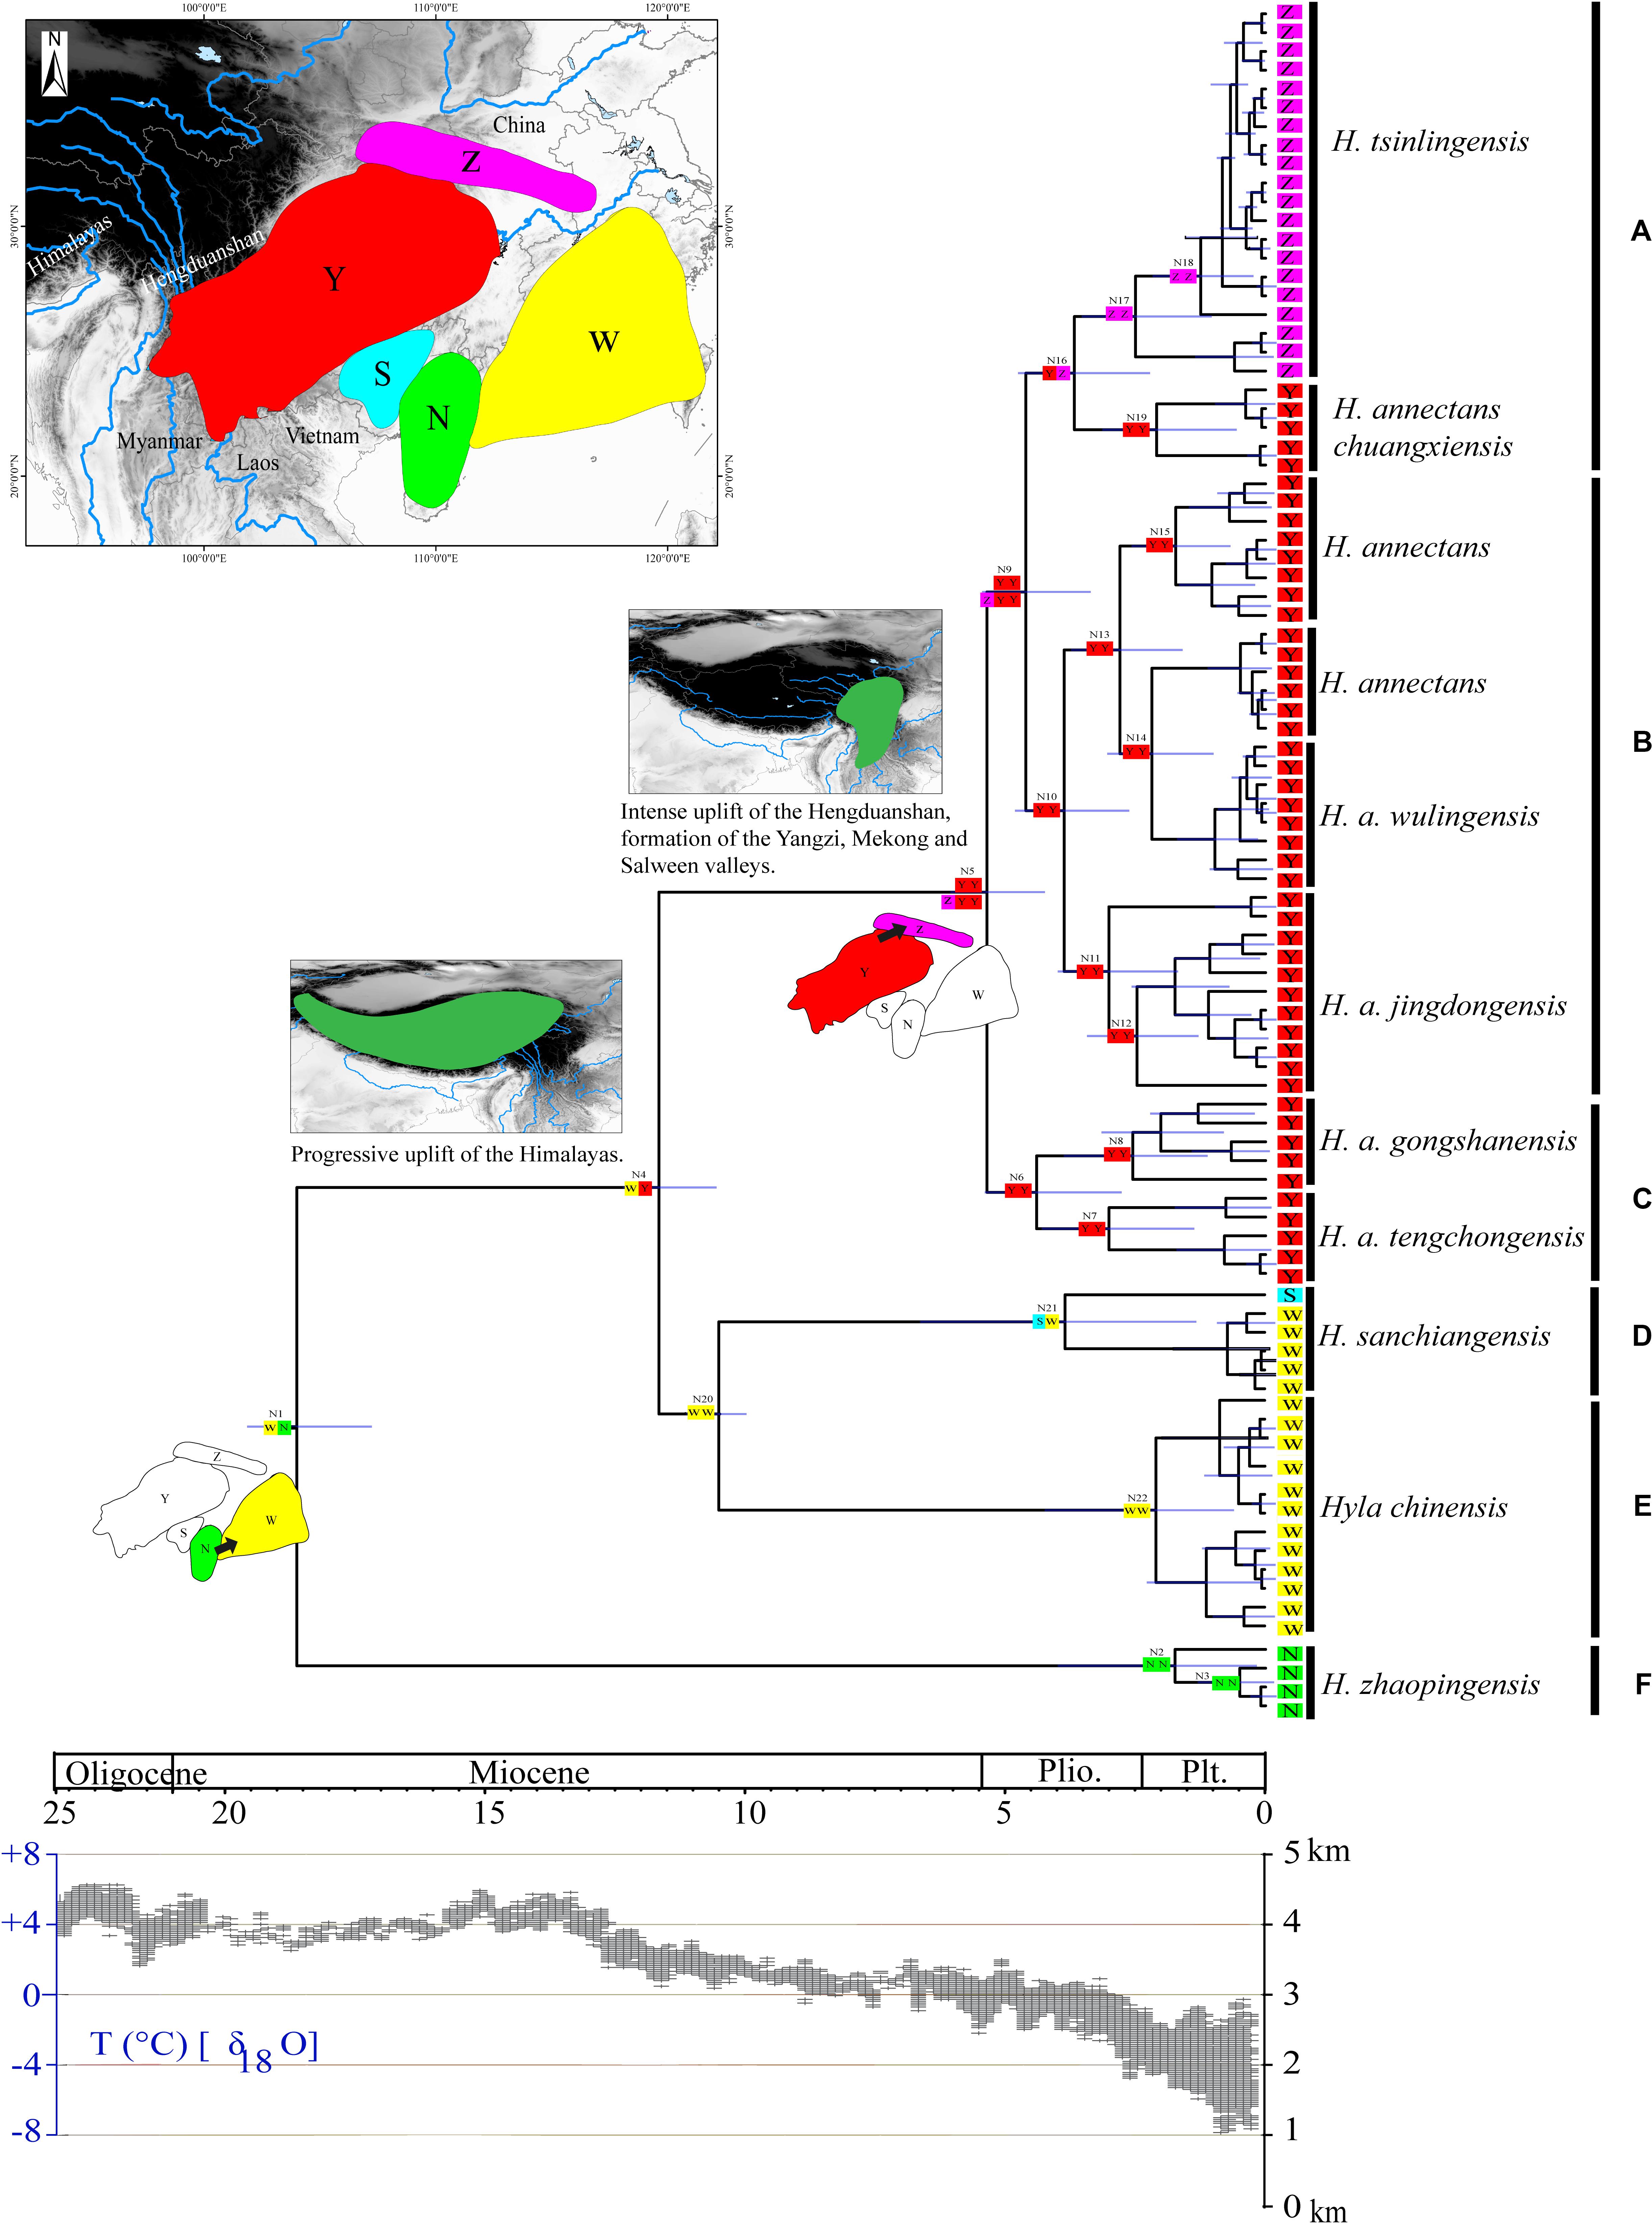
Figure 4. Chronogram and ancestral reconstructions of the Hyla chinensis group. Top panel: time-calibrated phylogeny of the H. chinensis group based on mitochondrial dataset [the light blue bars through the nodes indicate 95% highest posterior densities (HPDs)] and ancestral area reconstruction by a dispersal-extinction-cladogenesis model (colored squares), two extensive dispersal events were shown for the origin of N1 and N5 (arrows represent the direction of dispersal), geological sequence of events related to the diversification of the H. chinensis group including a graphical representation of the extent of uplift of the Tibetan Plateau (TP) through time green shades indicate the portion of the Qinghai-Tibetan Plateau that had achieved altitudes comparable to present day (adapted from Favre et al., 2015). Areas divided for reconstructing ancestral areas are displayed in the top left: N, Southern China (Guangxi-Hainan provinces); W, Eastern China; S, the southern Guangxi province in China; Y, the eastern of the Tibetan Plateau (Yunnan-Guizhou Plateau and Sichuan Basin); Z, the Tsinling-Dabie mountains. Lower panel: temperature changes (Zachos et al., 2001, 2008). (A–F) represents the six clades within the H. chinensis group.
The BFD based on PS (BF, 12.62) and SS (BF, 20.84) models decisively supported six species in the H. chinensis group (Table 2), corresponding to the six clades disclosed by the phylogenetic tree (Figures 2, 3). BPP methods also supported six separated species due to higher than 0.95 probability values (Table 3). Species tree, consistent with BPP tree topology, recovered a concordant, robust phylogenetic topology (Figure 5). Pairwise sequence divergence (p uncorrected distance) between hidden species in the H. chinensis group ranged from 2.1% (A vs. B) to 11.4% (E vs. F) (Table 4).
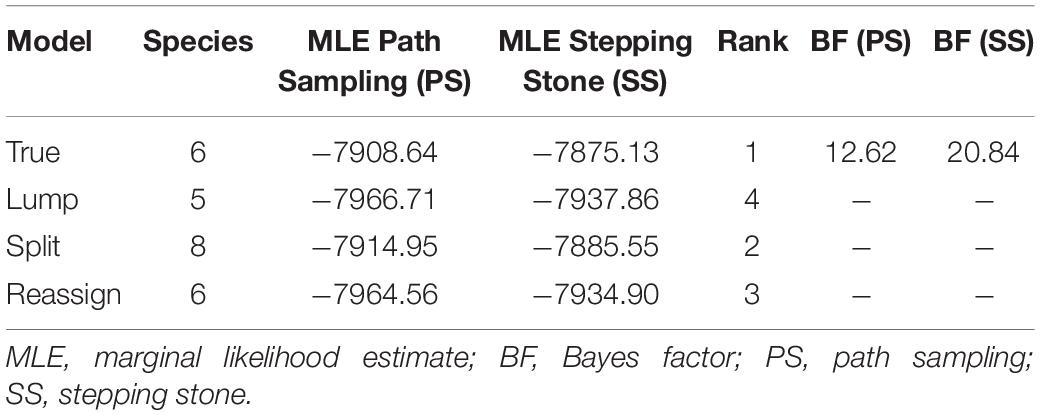
Table 2. Species delimitation results of the Hyla chinensis group.
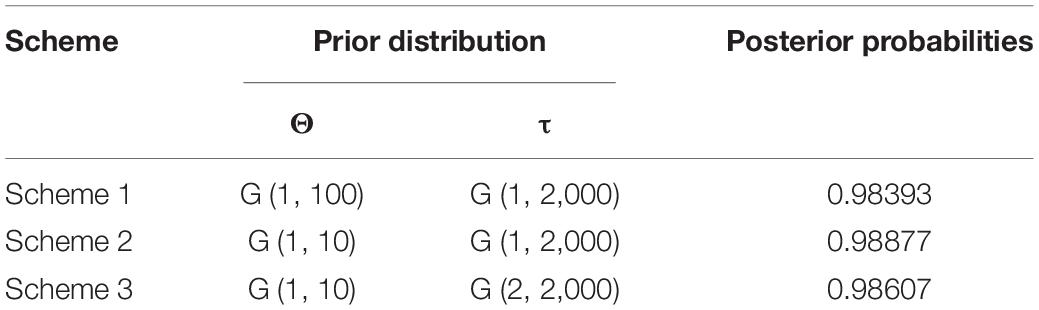
Table 3. The species delimitation results of the Hyla chinensis group based on mtDNA and nuclear gene data in Bayesian Phylogenetics and Phylogeography (BPP).
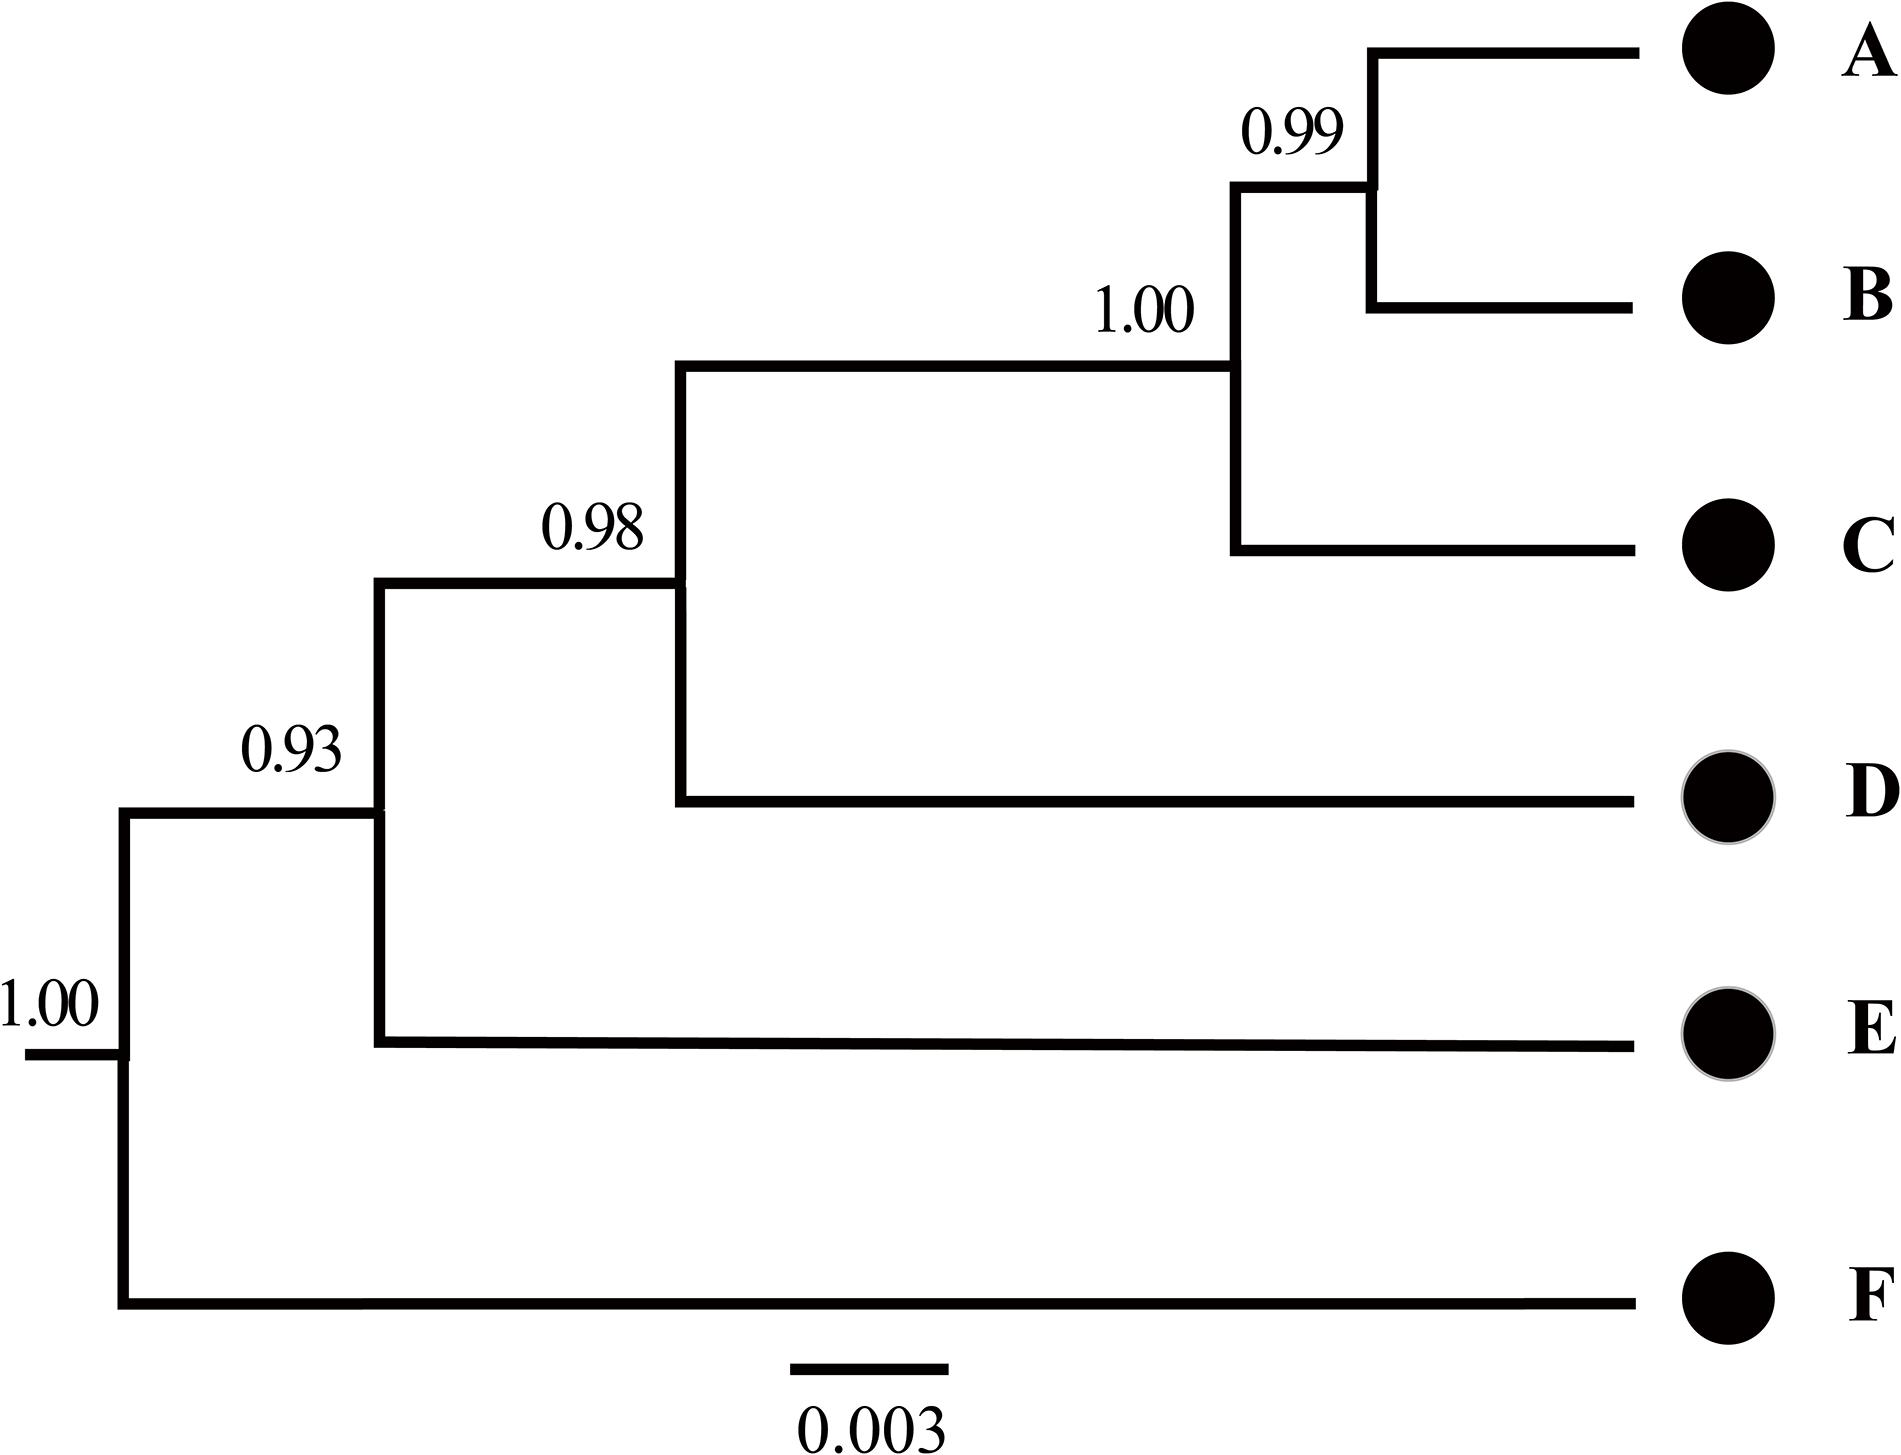
Figure 5. Species tree estimated using BEAST based on mtDNA genes in the Hyla chinensis group. The letters (A–F) correspond to the clades in Figures 2, 3. The values on nodes are Bayesian posterior probabilities.
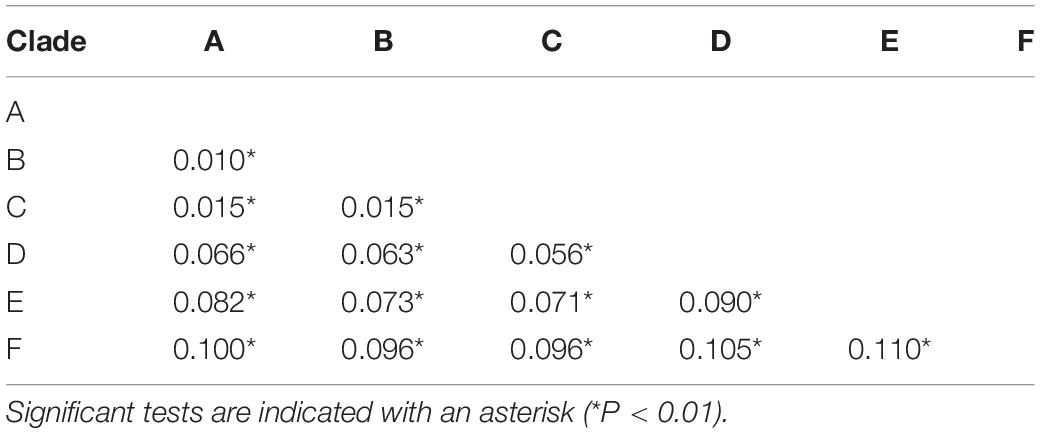
Table 4. Average genetic distances by Kimura two−parameter model among six candidate species within the Hyla chinensis group based on mtDNA genes.
In the ancestral area reconstruction, the best model for the H. chinensis group was M2, which supported that it was dispersed from southern China to the Qinling-Dabie mountains and to the Eastern of the Tibetan Plateau was restricted (Table 5). The analyses supported the Southern China (Guangxi-Hainan provinces, Area N) and Eastern China (Area W) as the ancestral area of the H. chinensis group, and most speciation events were attributed to the progressive uplift of the Himalayas (Figure 3 and Supplementary Table S2). Additionally, H. tsinlingensis originated from the Eastern of the Tibetan Plateau (Yunnan-Guizhou Plateau and Sichuan Basin, Area Y).
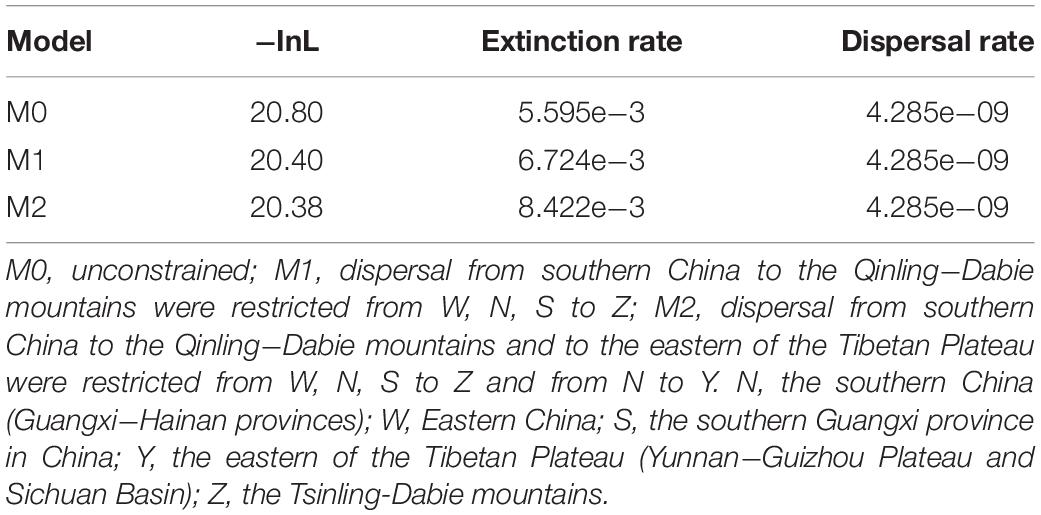
Table 5. Comparison of different dispersal models in Lagrange.
Discussion
The phylogenetic analysis identified all the individuals of the H. chinensis group formed into six genetically distinct population clusters (i.e., Clades A–F) (Figures 2–4). Based on BF and BPP methods, the species delimitation suggested that these six genetically distinct clades could be regarded as hidden separated species in the H. chinensis group, which also got the support from genetic distance (Table 4). In brief, clade A corresponds to H. tsinlingensis and H. annectans chuanxiensis; clade B included H. annectans, H. a. wulingensis, and H. a. jingdongensis; while H. a. gongshanensis and H. a. tengchongensis are within clade C. The remaining clades (D–F) corresponded to three putative species (H. sanchiangensis, H. chinensis, and H. zhaopingensis), respectively (Figures 2, 3), which were supported by the various species delimitation analyses. Overall, compared with the study of Li et al. (2015), some minor differences exist: H. annectans chuanxiensis belongs to H. tsinlingensis, not H. annectans; two subspecies of H. annectans (H. a. gongshanensis and H. a. tengchongensis) were regarded as separated species. As for the species not involved (H. simplex), we cannot give corresponding conclusions due to missing key samples in our research. As mentioned by previous researchers, further clarification of the relationship of H. simplex and H. zhaopingensis can be resolved only based on the H. simplex from its type locality in Vietnam and in-depth analysis (Li et al., 2015). In addition, for the distribution pattern of the clade D, this clade includes samples from Anhui and Guangxi; it seems that a large geographic gap exists between these places, which may hint the sampling incompleteness within this clade (Fei et al., 2012). These results represent a definitive molecular evidence for the taxonomic revision of each clade within the H. chinensis group. Nevertheless, in order to revise the group from a comprehensive perspective, a thorough quantitative multivariate analysis of the diagnostic morphological features and more key samples of unexplored species (e.g., H. simplex) is still required, and ideally, additional ecological evidence is required. During the Middle Eocene to Early Oligocene (45–34 Mya), the Hyla originated from North America, then diffused to China through the Bering Land Bridge, thus forming a branch of Hyla (Smith et al., 2005; Wiens et al., 2006; Li et al., 2015). In this study, the dated phylogenetic tree indicated that the Clade F (about 18.84 Mya) is at the base of the H. chinensis group and contains H. zhaopingensis in Southern China (Guangxi province). Six putative hidden species in the H. chinensis group (Clade A to F) approximately correspond to the three areas of China: the Eastern of Qinghai-Tibetan Plateau (i.e., the Yunnan-Guizhou Plateau and Sichuan Basin), the Eastern and Southern China, and the Qinling-Dabie mountains. Additionally, the first stage of speciation (e.g., split between Clades D and E) in the H. chinensis group occurs in Southern and Eastern in China during the Middle Miocene (ca. 18–10 Ma). Hyla is a small, arboreal, and semiaquatic frog; prefers to live in warm and damp environments, which widely inhabits boscages, paddy fields, or edges of rivers; and breeds in still water in ponds or paddy fields (Fei, 2005). During this period, the southern China humid climate is conducive to the survival of the species. For example, paleobotanical data indicated that the southeastern of the QTP has a warm and humid climate, was dominated by subtropical vegetation during the Miocene (Jacques et al., 2011), which had provided an opportunity for the first stage of speciation in the H. chinensis group.
The second stage of speciation in the H. chinensis group occurs in the Southwest of China (Yunnan Province and Sichuan Province) and the Qinling Mountains–Dabie Mountains in China from the late Miocene to Pliocene (5.57∼4.82 Mya). During the Late Miocene to Pliocene, the progressive uplift of the QTP particularly at its eastern and northern margins (mostly province of Yunnan, Sichuan, and Qinghai) led to the formation of some rivers; the Hengduanshan hot spot of biodiversity was composed of those areas (Favre et al., 2015). In addition, the upheaval of the QTP had a significant impact on the atmospheric circulation in Asia and promoted the development of the Asian monsoon system (Kutzbach et al., 1993; Tang et al., 2013). The East Asian Monsoon system has controlled China’s climate at that time, and this condition brought moisture air from the ocean to East China (Liu et al., 2009). Combining the geological events, they may be contributed to the second stage of speciation in the H. chinensis group.
In conclusion, although a previous study had demonstrated that the Hyla originated from North America, then diffused to China via Beringia during the Middle Eocene to Early Oligocene (Smith et al., 2005; Wiens et al., 2006; Li et al., 2015), it did not mean that the speciation of the H. chinensis group may be from northern China to southern China. Under the framework of speciation time within the H. chinensis group, the rapid uplifting mountain ranges (the Tibetan Plateau and its adjacent mountain) formed a blocky orographic barrier for many endemic species (Favre et al., 2015), which also played an important role in the formation of the Asian monsoon system (Guo et al., 2008; Song et al., 2010; Tang et al., 2013). Additionally, three East Asian monsoon intensification periods (∼15 Ma, ∼8 Ma, and 4–3 Ma) (Wan et al., 2007; Molnar et al., 2010; Jacques et al., 2011) also had urged the formation of humid and warm climates in south China (Sun and Wang, 2005), which was favorable for geographical dispersal, especially for amphibians (Che et al., 2010; Wu et al., 2013; Yan et al., 2013; Ye et al., 2013). More dispersal events often means that these species had more opportunities for allopatric divergence, which greatly affected the high levels of inter-population genetic divergence and unique patterns of genetic structure (Che et al., 2010; Wu et al., 2013; Yan et al., 2013; Ye et al., 2013; Favre et al., 2015). Therefore, based on those results, unlike the history of the Hyla evolution (North America→Beringia→China) (Smith et al., 2005; Wiens et al., 2006; Li et al., 2015), we can infer that the speciation and diffusion in the H. chinensis group had been from Guangxi-Hainan provinces to Guangxi province and Eastern China, and then to the Yunnan-Guizhou Plateau and Sichuan Basin, finally spread to Qinling-Dabie mountains. The diversification and speciation in the H. chinensis group also may be related to the special geological deformations and the climatic history.
Conclusion
As one of the species complexes in Hyla, the determined species number in the H. chinensis group was full of competing. Until now, no research focuses on the species delimitation based on the genetic data. In this study, different species delimitation approaches revealed that multiple species exist in the H. chinensis group. These methods indicated that there are six distinct species (from Clades A to F, respectively) in this species group. The progressive uplift of QTP and climate change led to the dispersal progress and formation of hidden species diversity in the Hyla chinensis group. Nevertheless, diagnostic morphological characters and other ecological evidences are still needed to supply for providing the integrative revision of this species group.
Data Availability Statement
The accession number(s) can be found in the table within this article.
Ethics Statement
The animal study was reviewed and approved by the Anhui Normal University.
Author Contributions
BZ, JL, and XW conceived the study. PY and TP contributed to sample collection. PY, GW, TP, XK, IA, and WZ carried out the laboratory work. PY, GW, TP, and XK analyzed the data and wrote the manuscript with contributions from BZ, XW, JL, PY, and TP. IA corrected the language. All authors approved the final version of the manuscript and agreed to be held accountable for its content.
Funding
This work is supported by the Anhui Natural Science Foundation (Youth, 1908085QC127), 2018 Funding for research activities of postdoctoral researchers in Anhui Province in the design of study, fieldwork, sample collection, lab work, and data analysis. The writing and publishing were supported by the Anhui Province Academic and Technical Leader & Backup Candidate Academic Research Activities Fund (2017H130).
Conflict of Interest
The authors declare that the research was conducted in the absence of any commercial or financial relationships that could be construed as a potential conflict of interest.
Acknowledgments
We are grateful to Chaochao Hu, Lifu Qian, Ke Fang, Chengcheng Wang, Yanan Zhang, and Xiaonan Sun for their help in the wild survey and data analysis. This manuscript has been released as a preprint at Research Square.
Supplementary Material
The Supplementary Material for this article can be found online at: https://www.frontiersin.org/articles/10.3389/fevo.2020.00234/full#supplementary-material
References
Aldhebiani, A. Y. (2018). Species concept and speciation. Saudi J. Biol. Sci. 25, 437–440. doi: 10.1016/j.sjbs.2017.04.013
Benton, M. J. (2009). The Red Queen and the Court Jester: species diversity and the role of biotic and abiotic factors through time. Science 323, 728–732. doi: 10.1126/science.1157719
Blair, C., and Bryson, J. R. (2017). Cryptic diversity and discordance in single-locus species delimitation methods within horned lizards (Phrynosomatidae: Phrynosoma). Mol. Ecol. Res. 17, 1–15.
Burland, T. G. (1999). “DNASTAR’s Lasergene sequence analysis software,” in Bioinformatics Methods and Protocols, eds S. Misener and S. A. Krawetz (Totowa, NJ: Humana Press), 71–91. doi: 10.1385/1-59259-192-2:71
Chacón, J., and Renner, S. S. (2014). Assessing model sensitivity in ancestral area reconstruction using lagrange: a case study using the Colchicaceae family. J. Biogeogr. 41, 1414–1427. doi: 10.1111/jbi.12301
Che, J., Zhou, W. W., Hu, J. S., Yan, F., Papenfuss, T. J., Wake, D. B., et al. (2010). Spiny frogs (Paini) illuminate the history of the Himalayan region and Southeast Asia. Proc. Natl. Acad. Sci. U.S.A. 107, 13765–13770. doi: 10.1073/pnas.1008415107
Darriba, D., Taboada, G. L., Doallo, R., and Posada, D. (2012). JModelTest 2: more models, new heuristics and parallel computing. Nat. Methods 9:772. doi: 10.1038/nmeth.2109
Drummond, A. J., Suchard, M. A., Xie, D., and Rambaut, A. (2012). Bayesian phylogenetics with BEAUti and the BEAST 1.7. Mol. Biol. Evol. 29, 1969–1973. doi: 10.1093/molbev/mss075
Fan, Y., Wu, R., Chen, M. H., Kuo, L., and Lewis, P. O. (2011). Choosing among partition models in Bayesian phylogenetics. Mol. Biol. Evol. 28, 523–532. doi: 10.1093/molbev/msq224
Favre, A., Päckert, M., Pauls, S. U., Jähnig, S. C., Uhl, D., Michalak, I., et al. (2015). The role of the uplift of the Qinghai-Tibetan Plateau for the evolution of Tibetan biotas. Biol. Rev. 90:236. doi: 10.1111/brv.12107
Fei, L., Hu, S. Q., Ye, C. Y., and Huang, Y. Z. (2009). Fauna Sinica. Amphibia Vol. 2 Anura. Beijing: Science Press.
Fei, L., Ye, C. Y., and Jiang, J. P. (2012). Colored Atlas of Chinese Amphibians and their Distributions. Chengdu: Sichuan Publishing House of Science and Technology.
Frost, D. R. (2014). Amphibian Species of the World: An Online Reference. Version 6.0. New York, NY: American Museum of Natural History.
Gao, Y., Ai, B., Kong, H. H., Kang, M., and Huang, H. W. (2015). Geographical pattern of isolation and diversification in karst habitat islands: a case study in the Primulina eburnea complex. J. Biogeogr. 42, 2131– 2144.
Garzione, C. N., Dettman, D. L., Quade, J., Decelles, P. G., and Butler, R. F. (2000). High times on the Tibetan Plateau: paleoelevation of the Thakkhola graben. Nepal Geol. 28, 339–342. doi: 10.1130/0091-7613(2000)028<0339:htottp>2.3.co;2
Grummer, J. A., Bryson, R. W., and Reeder, T. W. (2014). Species delimitation using Bayes factors: simulations and application to the Sceloporus scalaris species group (Squamata: Phrynosomatidae). Syst. Biol. 63, 119–133. doi: 10.1093/sysbio/syt069
Guo, Z. T., Sun, B., Zhang, Z. S., Peng, S. Z., Xiao, G. Q., Ge, J. Y., et al. (2008). A major reorganization of Asian climate by the early Miocene. Clim. Past 4, 153–174. doi: 10.5194/cp-4-153-2008
Heled, J., and Drummond, A. J. (2010). Bayesian inference of species trees from multilocus data. Mol. Biol. Evol. 27, 570–580. doi: 10.1093/molbev/msp274
Hua, X., Fu, C. Z., Li, J. T., De Oca, A. N. M., and Wiens, J. J. (2009). A revised phylogeny of Holarctic treefrogs (genus Hyla) based on nuclear and mitochondrial DNA sequences. Herpetologica 65, 246–259. doi: 10.1655/08-058r1.1
Huang, Z. S., Yu, F. L., Gong, H. S., Song, Y. L., Zeng, Z. G., and Zhang, Q. (2017). Phylogeographical structure and demographic expansion in the endemic alpine stream salamander (Hynobiidae: Batrachuperus) of the Qinling Mountains. Sci. Rep. 7, 1–13.
Huson, D. H., and Bryant, D. (2006). Application of phylogenetic networks in evolutionary studies. Mol. Biol. Evol. 23, 254–267. doi: 10.1093/molbev/msj030
Jacques, F. M. B., Guo, S. X., Su, T., Xing, Y. W., Huang, Y. J., Liu, Y. S., et al. (2011). Quantitative reconstruction of the Late Miocene monsoon climates of southwest China: a case study of the Lincang flora from Yunnan Province. Palaeogeogr. Palaeocl. 304, 318–327. doi: 10.1016/j.palaeo.2010.04.014
Kajtoch, Ł, Montagna, M., and Wanat, M. (2017). Species delimitation within the Bothryorrhynchapion weevils: multiple evidence from genetics, morphology and ecological associations. Mol. Phylogenet. Evol. 120, 354–363. doi: 10.1016/j.ympev.2017.12.022
Kotsakiozi, P., Jablonski, D., Ilgaz, Kumlutaş, Y., Avcı, A., Meiri, S., et al. (2018). Multilocus phylogeny and coalescent species delimitation in Kotschy’s gecko, Mediodactylus kotschyi: hidden diversity and cryptic species. Mol. Phylogenet. Evol. 125, 177–187. doi: 10.1016/j.ympev.2018.03.022
Kutzbach, J. E., Prell, W. L., and Ruddiman, W. F. (1993). Sensitivity of Eurasian climate to surface uplift of the Tibetan Plateau. J. Geol. 101, 177–190. doi: 10.1086/648215
Leaché, A. D., and Fujita, M. K. (2010). Bayesian species delimitation in West African forest geckos (Hemidactylus fasciatus). Proc. R. Soc. Lond. B Biol. 277, 3071–3077. doi: 10.1098/rspb.2010.0662
Li, J. T., Wang, J. S., Nian, H. H., Litvinchuk, S. N., Wang, J. C., Li, Y., et al. (2015). Amphibians crossing the Bering Land Bridge: evidence from holarctic treefrogs (Hyla, Hylidae, Anura). Mol. Phylogenet. Evol. 87, 80–90. doi: 10.1016/j.ympev.2015.02.018
Li, S. M., and Yang, D. T. (1985). The description of a new subspecies Hyla annectanus gongshanensis from Yunnan. Zool. Res. 6, 23–28.
Li, W. L. S., and Drummond, A. J. (2012). Model averaging and Bayes factor calculation of relaxed molecular clocks in Bayesian phylogenetics. Mol. Biol. Evol. 29, 751–761. doi: 10.1093/molbev/msr232
Liu, L. P., Eronen, J. T., and Fortelius, M. (2009). Significant mid-latitude aridity in the middle Miocene of East Asia. Palaeogeogr. Palaeocl. 279, 201–206. doi: 10.1016/j.palaeo.2009.05.014
Molnar, P., Boos, W. R., and Battisti, D. S. (2010). Orographic controls on climate and paleoclimate of Asia: thermal and mechanical roles for the Tibetan Plateau. Annu. Rev. Earth Publ. Sci. 38, 77–102. doi: 10.1146/annurev-earth-040809-152456
Päckert, M., Martens, J., Sun, Y. H., Severinghaus, L. L., Nazarenko, A. A., Ting, J., et al. (2012). Horizontal and elevational phylogeographic patterns of Himalayan and Southeast Asian forest passerines (Aves: Passeriformes). J. Biogeogr. 39, 556–573. doi: 10.1111/j.1365-2699.2011.02606.x
Pan, T., Sun, Z. L., Lai, X. L., Orozcoterwengeld, P., Yan, P., Wu, G. Y., et al. (2019). Hidden species diversity in Pachyhynobius: a multiple approaches species delimitation with mitogenomes. Mol. Phylogenet. Evol. 137, 138–145. doi: 10.1016/j.ympev.2019.05.005
Rannala, B., and Yang, Z. H. (2003). Bayes estimation of species divergence times and ancestral population sizes using DNA sequences from multiple loci. Genetics 164, 1645–1656.
Ree, R. H., and Smith, S. A. (2008). Maximum likelihood inference of geographic range evolution by dispersal, local extinction, and cladogenesis. Syst. Biol. 57, 4–14. doi: 10.1080/10635150701883881
Ronquist, F., and Huelsenbeck, J. P. (2003). MrBayes 3: bayesian phylogenetic inference under mixed models. Bioinformatics 19, 1572–1574. doi: 10.1093/bioinformatics/btg180
Sambrook, J., Fritsch, E. F., and Maniatis, T. (1989). Molecular Cloning. New York, NY: Cold spring harbor laboratory press.
Shepard, D. B., and Burbrink, F. T. (2011). Local-scale environmental variation generates highly divergent lineages associated with stream drainages in a terrestrial salamander, Plethodon caddoensis. Mol. Phylogenet. Evol. 59, 399–411. doi: 10.1016/j.ympev.2011.03.007
Sheridan, J. A., and Stuart, B. L. (2018). Hidden species diversity in Sylvirana nigrovittata (Amphibia: Ranidae) highlights the importance of taxonomic revisions in biodiversity conservation. PLoS One 13:e0192766. doi: 10.1371/journal.pone.0192766
Smith, S. A., Stephens, P. R., and Wiens, J. J. (2005). Replicate patterns of species richness, historical biogeography, and phylogeny in Holarctic treefrogs. Evolution 59, 2433–2450. doi: 10.1111/j.0014-3820.2005.tb00953.x
Song, J. H., Kang, H. S., Byun, Y. H., and Hong, S. Y. (2010). Effects of the Tibetan Plateau on the Asian summer monsoon: a numerical case study using a regional climate model. Int. J. Climatol. 30, 743–759.
Stamatakis, A. (2008). The RAxML 7.0.3 Manual. Heidelberg: Heidelberg Institute for Theoretical Studies.
Sullivan, J., and Joyce, P. (2005). Model selection in phylogenetics. Annu. Rev. Ecol. Sci. 36, 445–466.
Sun, X. G., and Wang, P. X. (2005). How old is the Asian monsoon system?—Palaeobotanical records from China. Palaeogeogr. Palaeocl. 222, 181–222. doi: 10.1016/j.palaeo.2005.03.005
Tamura, K., Peterson, D., Peterson, N., Stecher, G., Nei, M., and Kumar, S. (2011). MEGA5: molecular evolutionary genetics analysis using maximum likelihood, evolutionary distance, and maximum parsimony methods. Mol. Biol. Evol. 28, 2731–2739. doi: 10.1093/molbev/msr121
Tang, H., Micheels, A., Eronen, J. T., Ahrens, B., and Fortelius, M. (2013). Asynchronous responses of East Asian and Indian summer monsoons to mountain uplift shown by regional climate modelling experiments. Clim. Dyn. 40, 1531–1549. doi: 10.1007/s00382-012-1603-x
Tang, Y. X., and Zhang, Z. J. (1984). A new species of amphibians from Guangxi. Acta Zootaxon. Sin. 4:23.
Wan, S. M., Li, A. C., Clift, P. D., and Stuut, J. B. W. (2007). Development of the East Asian monsoon: mineralogical and sedimentologic records in the northern South China Sea since 20 Ma. Palaeogeogr. Palaeocl. 254, 561–582. doi: 10.1016/j.palaeo.2007.07.009
Wiens, J. J., Fetzner, J. W., Parkinson, C. L., and Reeder, T. W. (2005). Hylid frog phylogeny and sampling strategies for speciose clades. Syst. Biol. 54, 778–807. doi: 10.1080/10635150500234625
Wiens, J. J., Graham, C. H., Moen, D. S., Smith, S. A., and Reeder, T. W. (2006). Evolutionary and ecological causes of the latitudinal diversity gradient in hylid frogs: treefrog trees unearth the roots of high tropical diversity. Am. Nat. 168, 579–596. doi: 10.1086/507882
Wu, Y. K., Wang, Y. Z., Jiang, K., and Hanken, J. (2013). Significance of pre-Quaternary climate change for montane species diversity: insights from Asian salamanders (Salamandridae: Pachytriton). Mol. Phylogenet. Evol. 66, 380–390. doi: 10.1016/j.ympev.2012.10.011
Xie, W. G., Lewis, P. O., Fan, Y., Kuo, L., and Chen, M. H. (2011). Improving marginal likelihood estimation for Bayesian phylogenetic model selection. Syst. Biol. 60, 150–160. doi: 10.1093/sysbio/syq085
Yan, F., Zhou, W. W., Zhao, H. T., Yuan, Z. Y., Wang, Y. Y., Jiang, K., et al. (2013). Geological events play a larger role than Pleistocene climatic fluctuations in driving the genetic structure of Quasipaa boulengeri (Anura: Dicroglossidae). Mol. Ecol. 22, 1120–1133. doi: 10.1111/mec.12153
Yang, Z. H., and Rannala, B. (2010). Bayesian species delimitation using multilocus sequence data. Proc. Natl. Acad. Sci. U.S.A. 107, 9264–9269. doi: 10.1073/pnas.0913022107
Ye, S. P., Huang, H., Zheng, R. Q., Zhang, J. Y., Yang, G., and Xu, S. X. (2013). Phylogeographic analyses strongly suggest cryptic speciation in the giant spiny frog (Dicroglossidae: Paa spinosa) and interspecies hybridization in Paa. PLoS One 8:e70403. doi: 10.1371/journal.pone.0070403
Zachos, J., Pagani, M., Sloan, L., Thomas, E., and Billups, K. (2001). Trends, rhythms, and aberrations in global climate 65 Ma to present. Science 292, 686–693. doi: 10.1126/science.1059412
Zachos, J. C., Dickens, G. R., and Zeebe, R. E. (2008). An early Cenozoic perspective on greenhouse warming and carbon-cycle dynamics. Nature 451, 279–283. doi: 10.1038/nature06588
Keywords: Hyla chinensis group, species delimitation, phylogeny, biogeography, evolutionary history
Citation: Yan P, Pan T, Wu G, Kang X, Ali I, Zhou W, Li J, Wu X and Zhang B (2020) Species Delimitation and Evolutionary History of Tree Frogs in the Hyla chinensis Group (Hylidae, Amphibian). Front. Ecol. Evol. 8:234. doi: 10.3389/fevo.2020.00234
Received: 07 January 2020; Accepted: 26 June 2020;
Published: 11 August 2020.
Edited by:
Zehao Shen, Peking University, ChinaReviewed by:
Zhenghuan Wang, East China Normal University, ChinaXiaolei Huang, Fujian Agriculture and Forestry University, China
Copyright © 2020 Yan, Pan, Wu, Kang, Ali, Zhou, Li, Wu and Zhang. This is an open-access article distributed under the terms of the Creative Commons Attribution License (CC BY). The use, distribution or reproduction in other forums is permitted, provided the original author(s) and the copyright owner(s) are credited and that the original publication in this journal is cited, in accordance with accepted academic practice. No use, distribution or reproduction is permitted which does not comply with these terms.
*Correspondence: Xiaobing Wu, d3V4YkBhaG51LmVkdS5jbg==; Baowei Zhang, emhhbmdid0BhaHUuZWR1LmNu
†These authors have contributed equally to this work