- 1State Key Laboratory of Plateau Ecology and Agriculture, Qinghai University, Xining, China
- 2Medical College, Qinghai University, Xining, China
- 3Department of Anesthesiology, Qinghai Hospital of Traditional Chinese Medicine, Xining, China
- 4Department of Anesthesiology, Red Cross Hospital of Qinghai, Xining, China
- 5College of Eco-Environmental Engineering, Qinghai University, Xining, China
The objective of this study was to investigate the regulation of X-ray irradiation and its effect on the activity and protein and mRNA expression levels of CYP1A2 and CYP2E1 in rats. Rats were randomly divided into 0 Gy (control), 1 Gy (low-dose irradiation), and 5 Gy (high-dose irradiation) groups. CYP1A2 and CYP2E1 activity was evaluated from changes in pharmacokinetic parameters of caffeine and chlorzoxazone, respectively. The plasma concentrations of the probe drugs were determined by high-performance liquid chromatography (HPLC). Enzyme-linked immunosorbent assay (ELISA) and real-time polymerase chain reaction (PCR) tests were used to analyze the protein and mRNA expression levels of CYP1A2 and CYP2E1, respectively. The AUC0-12 of caffeine was decreased by 1.7- and 2.5-fold, and the CL was increased by 1.8- and 2.6-fold in the 1 Gy and 5 Gy groups, respectively, compared to the 0 Gy group. The AUC0-10 of chlorzoxazone was 1.4- and 1.8-fold lower, and the CL was 1.4- and 1.9-fold higher in the 1 Gy and 5 Gy groups, respectively, compared to the 0 Gy group. The metabolism of caffeine and chlorzoxazone increased under X-ray irradiation as CL levels increased and AUC levels decreased, suggesting that CYP1A2 and CYP2E1 activity is enhanced in rats after X-ray irradiation. Compared to that of the 0 Gy group, the protein expression level of CYP1A2 was measured as 28.3% and 38.9% higher in the 1 Gy and 5 Gy groups, respectively. The protein expression level of CYP2E1 was 48.4% higher in the 5 Gy group compared to the 0 Gy group, and there was no statistically significant difference between 0 Gy and 1 Gy. Compared to the 0 Gy group, the mRNA expression level of CYP1A2 was 200% and 856.3% higher in the 1 Gy and 5 Gy group, respectively, whereas the mRNA expression level of CYP2E1 was 89.0% and 192.3% higher in the 1 Gy and 5 Gy groups, respectively. This study reveals significant changes in the activity and protein and mRNA expression levels of CYP1A2 and CYP2E1 in rats after exposure to X-ray irradiation.
Introduction
Cytochrome P450 enzyme-based drug metabolism is dependent on oxygen. Interindividual differences in P450 isozyme activity are attributable to genetic polymorphisms and specific xenobiotic induction or inhibition (Eichelbaum et al., 1992; Guengerich, 1995). To date, our understanding of the role of nonchemical factors, including biophysical influences, disorders, pathological states, and various constitutional properties of interindividual variations in hepatic drug metabolism, remains limited (Jones et al., 1989; Vesell, 1997). Irradiation is considered to be one of the oldest and most common pathogenic factors (Li et al., 2019).
Irradiation pertains to the process of distributing energy into space or matter using waves and particles (Repacholi, 2017; Li et al., 2019). Ionizing and non-ionizing irradiation have been extensively utilized in medicine, agriculture, food processing, national defense, and daily activities, and they have also negatively influenced human health (Sato and Zouain, 2012; Sutlief, 2015; Andrianov et al., 2015; von Neubeck et al., 2015). Ionizing irradiation includes X-ray and γ-ray. A γ-ray source is typically cesium-137 or cobalt-60. X-rays are stimulated by the inner electrons of the atoms, while γ-rays come from the nucleus. Compared to γ-rays, X-ray irradiation units are less expensive and have no radioactive source. X-ray irradiation is a possible alternative to γ-ray irradiation in clinical settings due to its reliability, wide energy wavelength, and user-friendly interface (Janatpour et al., 2005; Thwaites and Tuohy, 2006). Scientists have uncovered a series of physiological variations and pathological divergences induced by irradiation, and these influence drug absorption, distribution, metabolism, and excretion from the body (Rendic and Guengerich, 2012; Qiao et al., 2017). Exposure to irradiation has significantly increased with the use of nuclear power and technology in various industries (e.g., agriculture and medicine). Currently, individuals susceptible to irradiation exposure include those working in radioactive areas and residents living in high-altitude zones. Therefore, it is essential for medical researchers to rationalize drug use for these specific populations. Additional changes in drug metabolism observed after irradiation have been reported with an increasing amount of cancer patients treated conventionally with radiotherapy methods (Rendic and Guengerich, 2010; Rendic and Guengerich, 2012; Qiao et al., 2017).
Investigations into preventing and treating irradiation damage, drug efficacy, and mitigating the effects of irradiation on the pharmacokinetics of drugs, such as 5-fluorouracil, cisplatin, and irinotecan hydrochloride, have been conducted for years (Hsieh et al., 2011; Duan et al., 2015; Tsai et al., 2015; Spetz et al., 2018; Qiao et al., 2019). These studies have observed significant differences in the characteristics of drugs in experimental rats after irradiation exposure. Physiological changes observed after irradiation exposure may change drug pharmacokinetics that may require modifications in dosage regimens to maintain efficacy and/or prevent toxicity. Cytochrome P450 enzymes play a role in not only the phase I-dependent metabolism of xenobiotics but also in the metabolism of endogenous compounds. The CYP1A2 and CYP2E1 phase I enzymes are responsible for the metabolic activation and detoxification of several chemical compounds. Caffeine and chlorzoxazone have been widely regarded as probe substrates used to evaluate the activity of CYP1A2 and CYP2E1, respectively, in vivo (Yong et al., 2016; Satish and Prasad, 2018). Earlier studies have reported an increase in CYP1A2, CYP2B1, CYP2C9, CYP2E1, and CYP3A1 mRNA and protein levels in rats after γ-ray irradiation exposure (Chung et al., 2001; Maksymchuk et al., 2008; Yi et al., 2015).
Investigations into changes in the activity and expression of cytochrome P450 due to X-ray irradiation are scarce. The effects of X-ray irradiation exposure on CYP3A1 and carboxylesterase (CES) expression in rats have recently been investigated by our team (Marchenko et al., 2010; Qiao et al., 2019). However, no reports on changes in CYP1A2 and CYP2E1 expression levels and activity due to X-ray irradiation have been published to date. The present study investigated changes in the activities and mRNA and protein expression levels of CYP1A2 and CYP2E1 in rats after X-ray irradiation at doses of 1 Gy and 5 Gy with the goal of providing information about rational drug use during concurrent chemoradiation therapy.
Materials and Methods
Chemicals, Reference Standards, and Solvents
Chlorzoxazone (lot: LC90O72) was purchased from J&K Scientific Corporation (Beijing, China). Caffeine (lot: 20071224) was obtained from Sinopharm Chemical Reagent Co., Ltd. (Shanghai, China). Rat CYP1A2 and CYP2E1 ELISA Kits (lot: 20180511, 20180321) were purchased from Fangcheng Beijing Technology Co., Ltd. (Beijing, China). Biochemical reagents kits were purchased from Jiangxi Tekang Technology Co., Ltd.: alanine phosphatases (lot: 1707110), transaminases GPT (lot: 1707136), transaminases GOT (lot: 1707132), total bilirubin (lot: 1707113), direct bilirubin (lot: 1707128), indirect bilirubin (lot: 1707126), total protein (lot: 1707131), albumin (lot: 1707127), globulin (lot: 1707108), creatinine assay kit (lot: 1707129), and uric acid (lot: 1707125). HPLC-grade methanol (lot: 20170507) was purchased from Shandong Yuwang Company Inc. (Jinan, China). All other chemicals and solvents were obtained from commercial sources at the highest grade available. HEPES were obtained from AMRESCO Company Inc. (Boise, USA). RNAiso Plus (lot: 9109), Prime-Script™ RT Reagent (Lot: K1622), and SYBR premix EX Taq™ II (lot:AK6401) were obtained from Takara (Kyoto, Japan). Primers used for real-time PCR were synthesized by Takara.
Animals
Sprague Dawley SPF rats (200 ± 20 g, certificate No. 2007-001) of both sexes were provided by the laboratory animal center at Xi'an Jiaotong University Medical College, China. They were adapted for a week at 23 ± 2°C with a constant humidity level of 55% ± 5% under a cycle of 12 h of dark conditions and given ad libitum access to water and food pellets. Three animals were housed per cage in separate rooms to ensure that each animal was restrained to a single space to prevent the development of restraint stress. All experimental procedures were applied in strict accordance with the National Institutes of Health Guide for the Care and Use of Laboratory Animals.
Thirty clean SD rats were randomly divided into 0 Gy (control), 1 Gy (low dose irradiation), and 5 Gy (high dose irradiation) groups, and every group included five male and five female rats. All rats, except for those in the control group, were restrained in special boxes and exposed to 1 or 5 Gy whole-body X-ray irradiation from a medical electronic linear accelerator (23EX, Varian, Palo Alto, CA, USA). We chose plastic bottles to make a mold that fit the shape of the rats to restrain the rats in the chamber (Supplementary Figure S1). The upper end of the bottle was small and the lower end was sealed to limit activity whilst also ensuring the breathing of the rats. The same group of rats was neatly arranged in the center of the electron accelerator field of view before irradiation. The source-to-animal distance was set as 100 cm, and the dose rate was set to 300 cGy/min. The irradiation period was set to 20 s and 100 s for the 1 Gy and 5 Gy doses, respectively. We applied 1 and 5 Gy to the rats to simulate the relevant dosage range for the daily treatment of a human torso and in the interest of safety and workability, as described in our previous report (Duan et al., 2015; Li et al., 2019; Qiao et al., 2019).
Determination of Physiologic and Blood Parameters
A routine blood examination was performed with an XFA6100 automatic hematology analyzer (Nanjing Perlove Medical Equipment, Co., Ltd., China), and blood biochemical parameters were determined by applying an AU2700 automatic biochemistry analyzer (Olympus Corporation, Japan) to rats after exposure to X-ray irradiation.
Determination of Thymus and Spleen Indexes
The thymus and spleen were removed from each rat 40 h after X-ray irradiation. Thymus and spleen indexes were calculated by dividing the organ weight by the bodyweight (BW):
Measurement of Rat CYP1A2 and CYP2E1 Activity
CYP1A2 and CYP2E1 activities in rats were identified using the previously reported “cocktail” method (Li et al., 2014a; Li et al., 2014b). Caffeine and chlorzoxazone served as probe substrates of CYP1A2 and CYP2E1, respectively. The activities of CYP1A2 and CYP2E1 were evaluated by the pharmacokinetic characteristics of caffeine and chlorzoxazone, respectively. The rats in the 1 Gy or 5 Gy groups were given probe drugs 40 hours after receiving X-ray irradiation. To evaluate the effect of X-ray irradiation on CYP1A2 activity, rats from three groups were given a caffeine solution orally at a dose of 60 mg/kg after an overnight fast of ≥ 12 h (with water allowed ad libitum) (Wang et al., 2009). A total of 0.3 ml of serial blood samples taken from the eye socket was collected before (baseline) the study drug was given and 0.083, 0.167, 0.333, 0.5, 1, 2, 4, 6, 8, and 12 h after study drug administration. To evaluate the effect of X-ray irradiation on CYP2E1 activity, rats from three groups were given a chlorzoxazone solution orally at a dose of 100 mg/kg after an overnight fast of ≥12 h (with water allowed ad libitum) (Yang, 2014). A total of 0.3 ml of serial blood samples taken from the eye socket was collected before (baseline) the study drug was given and 0.083, 0.167, 0.333, 0.5, 1, 2, 4, 6, 8, and 10 h after study drug administration. Plasma samples were separated by centrifuging the blood samples at 3,000 g for 10 min at 4°C and were immediately stored at -20°C until the quantitative drug analysis.
Bioanalytical Methods
The plasma concentrations of caffeine and chlorzoxazone were determined by HPLC. A 0.12-ml aliquot was added to 0.04 ml of 30% perchloric acid in a 1-ml centrifuge tube. The tube was vortexed for 0.5 min and then centrifuged for 10 min at 16,000 g at 4°C. The HPLC system was then injected with 20 μL aliquot of supernatant.
HPLC analyses of caffeine and chlorzoxazone were performed using an HPLC pump (G7104C, Agilent Technologies, Inc., California, USA) and a diode array detection system (G7115A, Agilent Technologies, Inc., California, USA) equipped with a C18 column (Boston, Boston Analytics, Inc., Boston, USA; 4.6 × 250 mm, inner diameter, 10 μm). The mobile phase of caffeine was methyl alcohol-water (60∶40, v/v), and the column temperature was maintained at 25°C. A constant flow rate of 1.0 ml/min was employed throughout the analyses, and the detection was performed at 275 nm. The method was linear in the range of 0.5−60 μg/ml, and the correlation coefficients of the regression lines were always > 0.9995. The lower limit of quantitation was 0.5 μg/ml. The batch-to-batch CV of the spiked quality-control samples was 4.36%, 2.56%, 6.71%, and 3.85% for caffeine concentrations of 0.5, 1, 25, and 50 μg/ml, respectively. The accuracy levels were calculated as the difference between the given and measured mean concentrations expressed as a percentage, and they were measured as 5.83%, 5.67%, 3.11%, and 1.48%, respectively, at the aforementioned target concentrations. The mobile phase of chlorzoxazone was methyl alcohol-water (62∶38, v/v), and the column temperature was maintained at 25°C. A constant flow rate of 1.0 ml/min was employed throughout the analyses, and detection was performed at 287 nm. The method applied was linear in the range of 0.5−60 μg/ml, and the correlation coefficients of the regression lines were always > 0.9995. The lower limit of quantitation was 0.5 μg/ml. The batch-to-batch CV of the spiked quality-control samples was 6.50%, 2.28%, 1.70%, and 2.35% for chlorzoxazone concentrations of 0.5, 1, 25, and 50 μg/ml, respectively. The accuracy levels were calculated as the difference between the given and measured mean concentrations expressed as a percentage, and they were measured as -4.19%, -1.80%, -0.58%, and -1.78%, respectively, at the aforementioned target concentrations.
Pharmacokinetic Analysis
Pharmacokinetic values for caffeine and chlorzoxazone were calculated for each rat, and these were used to determine mean values for analysis. A noncompartmental analysis using DAS 2.0 software (Institute of Clinical Pharmacology, Shanghai University of Traditional Chinese Medicine, Shanghai, China) was performed to calculate the elimination rate constant (Ke), plasma t1/2, mean residence time (MRT), volume of distribution (Vd), clearance (CL), and AUC0–t and AUC0–∞. The values of Tmax and Cmax were directly obtained from the raw data.
Preparation of Hepatic Microsomes
Ten rats of every group were decapitated after collecting the last blood sample. Liver tissues were collected and immediately frozen in liquid nitrogen. Liver microsomes were prepared via differential centrifugation according to our previous reports (Li et al., 2014a; Li et al., 2014b; Qiao et al., 2019). Briefly, after the liver samples were thawed and weighed, two volumes of ice-cold Tris-HCl buffer at pH 7.4 containing 0.25 M sucrose (50 mmol/L) were added. Liver tissue was cut using scissors and homogenized with an automatic homogenizer at 500 g (IKA T8, Labortechnik, Stanfen, Germany). The resulting homogenates were then transferred to clean centrifuge tubes and centrifuged at 10,000 g for 30 min at 4°C using a TGL-16B centrifuge (Anting Scientific Instrument Factory, Shanghai, China). The supernatant was then collected and centrifuged at 100,000 g for 80 min at 4°C using an Optima MAX-XP ultracentrifuge (Beckman Coulter Inc., California, USA). The microsomal pellet was resuspended in homogenization medium. Hepatic microsomal suspensions (0.5 mL) were then aliquoted into Eppendorf tubes and stored at -80°C.
ELISA Analysis of CYP1A2 and CYP2E1 Proteins
The expression levels of CYP1A2 and CYP2E1 were measured using the ELISA method according to our previous reports (Li et al., 2014a; Li et al., 2014b). Briefly, to prepare a bland well, 50 μL of the sample and 50 μL of standard diluted solution were added to the sample and standard well, respectively, with a biotin-conjugated antibody specific to CYP1A2 and CYP2E1. Then, Avidin conjugated to horseradish peroxidase (HRP) was added to each microplate well and incubated for 30 min at 37°C. After the complete removal of the liquid, 200 μL of wash buffer was added to each well, equilibrated for 10 s, and centrifuged. This process was repeated for a total of five rinsing cycles, and any remaining wash buffer was then removed by aspirating and decanting after the last wash. Then, 50 μL of substrate A and 50 μL of substrate B were added to each well, mixed thoroughly, and incubated for 30 min at 37°C. The enzyme–substrate reaction was terminated with the addition of a sulfuric acid solution, and the resulting change in color was spectrophotometrically measured at a wavelength of 450 nm. CYP1A2 and CYP2E1 concentrations in the samples were then determined by comparing the O.D. of the samples to the standard curve. The equation of the standard curve for CYP1A2 was C = 4.3222 × O.D. - 0.2394. The method was linear in the range of 0.312−20 ng/ml, and the correlation coefficients of the regression lines were always > 0.9990. The lower limit of quantitation was 0.118 ng/ml. The CV of intraday precision was less than 10%, and the CV of interday precision was less than 12% for low, middle, and high-level CYP1A2. The equation of the standard curve for CYP2E1 was C = 5.118 × O.D. - 0.1377. The method was linear in the range of 3.12−200 ng/ml, and the correlation coefficients of the regression lines were always > 0.9970. The lower limit of quantitation was 1.41 ng/ml. The CV of intraday precision was less than 10%, and the CV of interday precision was less than 12% for low, middle, and high-level CYP2E1.
Real-Time PCR Analysis of CYP1A2 and CYP2E1 mRNA
The livers of ten rats from every group were excised immediately after the rates were killed. A small portion of liver from the left lobe was snap-frozen in liquid nitrogen and stored at -80°C before the extraction of total RNA. Approximately 100−200 mg of liver tissue was homogenized, and total RNA was isolated with the TRIzol reagent. The quality of the RNA solution was determined with a spectrophotometer. Primers for rat CYP1A2 and CYP2E1, including the reaction protocol, were designed by Major Bio-pharm Technology Co., Ltd. (Shanghai, China). All real-time PCRs were carried out using a SYBR® Premix Ex Taq™ Kit (Takara) in accordance with the manufacturer's instructions. Amplification was performed in PCR capillaries on a Light Cycler 2.0 Real-Time Detection System (Roche, USA). The amplification of pre-denatured products was performed at 94°C for 60 s, followed by 45 cycles at 95°C for 30 s, 58°C for 30 s and 72°C for 30 s, 95°C for 10 s, 65°C for 45 s, and at 40°C for 60 s. Fold induction values were calculated using the value of 2-ΔΔCt where ΔCt represents differences in cycle threshold numbers between the target gene and the control gene β-actin and where ΔΔ Ct represents the relative change in differences between the control and treatment groups. The RNA samples were of sufficient quality for RT-qPCR analysis. Protein-free and intact RNA was indicated by purity and integrity assessment of total RNA. RT-qPCR efficiency over all samples was calculated according to the Minimum Information for Publication of Quantitative Real-Time PCR Experiments (MIQE) guidelines. Primer specificity was confirmed by melting curve analysis. Specific amplification of target reference genes was confirmed by the observation of a specific peak in the melting curve analysis (Supplementary Figures S2 and S3).
CYP1A2 primer sequence:
5'-TCGGTGGCTAATGTCATCGG-3' (forward primer)
5'-ACCGGAAAGAAGTCCACAGC-3' (reverse primer)
CYP2E1 primer sequence:
5'-TGGCTACAAGGCTGTCAAGG-3' (forward primer)
5'- AGGCTGGCCTTTGGTCTTTT -3' (reverse primer)
β-actin primer sequence:
5'- CAGGTCATCACTATCGGCAAT -3' (forward primer)
5'- TGGCATAGAGGTCTTTACGGA -3' (reverse primer)
Data Analysis
The results are presented as the mean ± SD values. Statistical analysis was performed using SPSS version 23.0 (SPSS, IBM, Armonk, NY, USA). One-way analysis of variance (ANOVA) was used for multigroup comparisons, and the least significant difference (LSD) test was used for two-group comparison. Values of P < 0.05 were considered statistically significant.
Results
HPLC Method Validation
The retention times for caffeine and chlorzoxazone were measured as approximately 6.8 min and 7.8 min, respectively, under the present analytical conditions. The peaks of caffeine and chlorzoxazone were well-differentiated, and no endogenous interference in the rat plasma was observed. Strong levels of caffeine linearity were achieved within a range of 0.5−60 μg/ml with all coefficients of correlation exceeding 0.9995. Intraday precision and accuracy levels ranged from 2.56% to 6.71% and 1.48% to 5.83%, respectively. Interday precision and accuracy levels in the rat plasma ranged from 3.88% to 9.50% and from 1.59% to 9.30%, respectively. Strong levels of chlorzoxazone linearity were achieved within a range of 0.5−60 μg/ml with all coefficients of correlation exceeding 0.9995. Intraday precision and accuracy levels ranged from 1.70% to 6.50% and from -4.19% to -0.58%, respectively. Interday precision and accuracy levels in the rat plasma ranged from 2.20% to 5.16% and from -1.54% to 1.10%, respectively.
Physiologic and Blood Parameters
Changes in blood routine parameters induced by X-ray irradiation are shown in Figure 1, and the results of biochemical blood tests are shown in Figure 2. Compared to the 0 Gy group, the white blood cell count was 26.0% and 61.3% lower for the 1 Gy and 5 Gy groups (both P < 0.01), respectively, and 47.7% lower in the 5 Gy group than in the 1 Gy group (P < 0.01). The platelet count was 148.7% (P < 0.01) and 87.3% (P < 0.05) higher for the 1 Gy and 5 Gy groups, respectively, than for the 0 Gy group, and the count was 24.7% lower in the 5 Gy group than in the 1 Gy group (P < 0.05). Lymphocyte levels were 63.2% lower in the 5 Gy group than in the 0 Gy group (P < 0.01) and 64.4% lower in the 5 Gy group than in the 1 Gy group (P < 0.01). The lymphocyte percentage was 18.2% lower in the 5 Gy group than in the 0 Gy group (P < 0.01) and 16.6% lower in the 5 Gy group than in the 1 Gy group (P < 0.01). For red blood cells and hemoglobin, there was no significant difference when comparing the 1 Gy or 5 Gy groups with the 0 Gy group. Total protein levels were 15.3% and 14.0% higher for the 1 Gy and 5 Gy groups (both P < 0.01), respectively, than for the 0 Gy group. Compared to the 0 Gy group, globulin values were 26.7% and 20.7% higher for the 1 Gy and 5 Gy groups (both P < 0.01), respectively. Alkaline phosphatase levels were decreased by 30.5% (P < 0.05) and 39.6% (P < 0.01) in the 1 Gy and 5 Gy group, respectively, compared to the 0 Gy group. Albumin levels were 3.2% higher in the 1 Gy group than in the 0 Gy group (P < 0.05). For transaminases GPT, transaminases GOT, total bilirubin, direct bilirubin, indirect bilirubin, creatinine, and uric acid, and there was no significant difference when comparing the 1 Gy or 5 Gy groups with the 0 Gy.
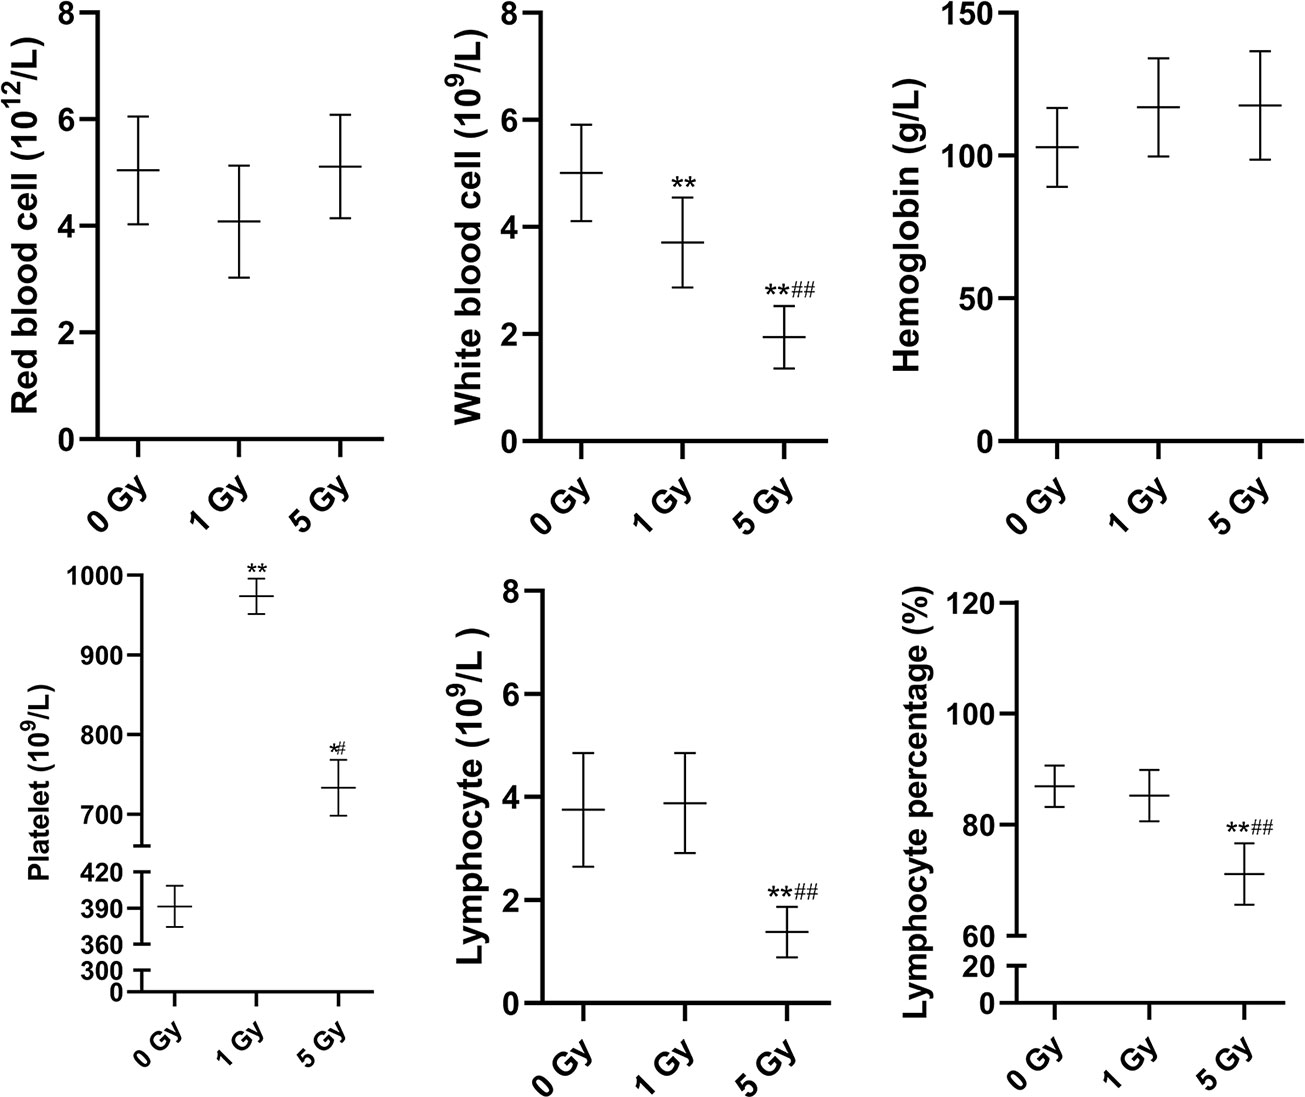
Figure 1 Changes in red blood cells, white blood cells, hemoglobin, platelets, lymphocytes, and lymphocyte percentage in the rats after X-ray irradiation. The data are presented as mean ± SD. N = 10. The data were analyzed using ANOVA, and the differences between the means of two groups were compared using LSD tests. *P < 0.05, **P < 0.01 compared to the 0 Gy group; #P < 0.05, ##P < 0.01 compared to the 1 Gy group.
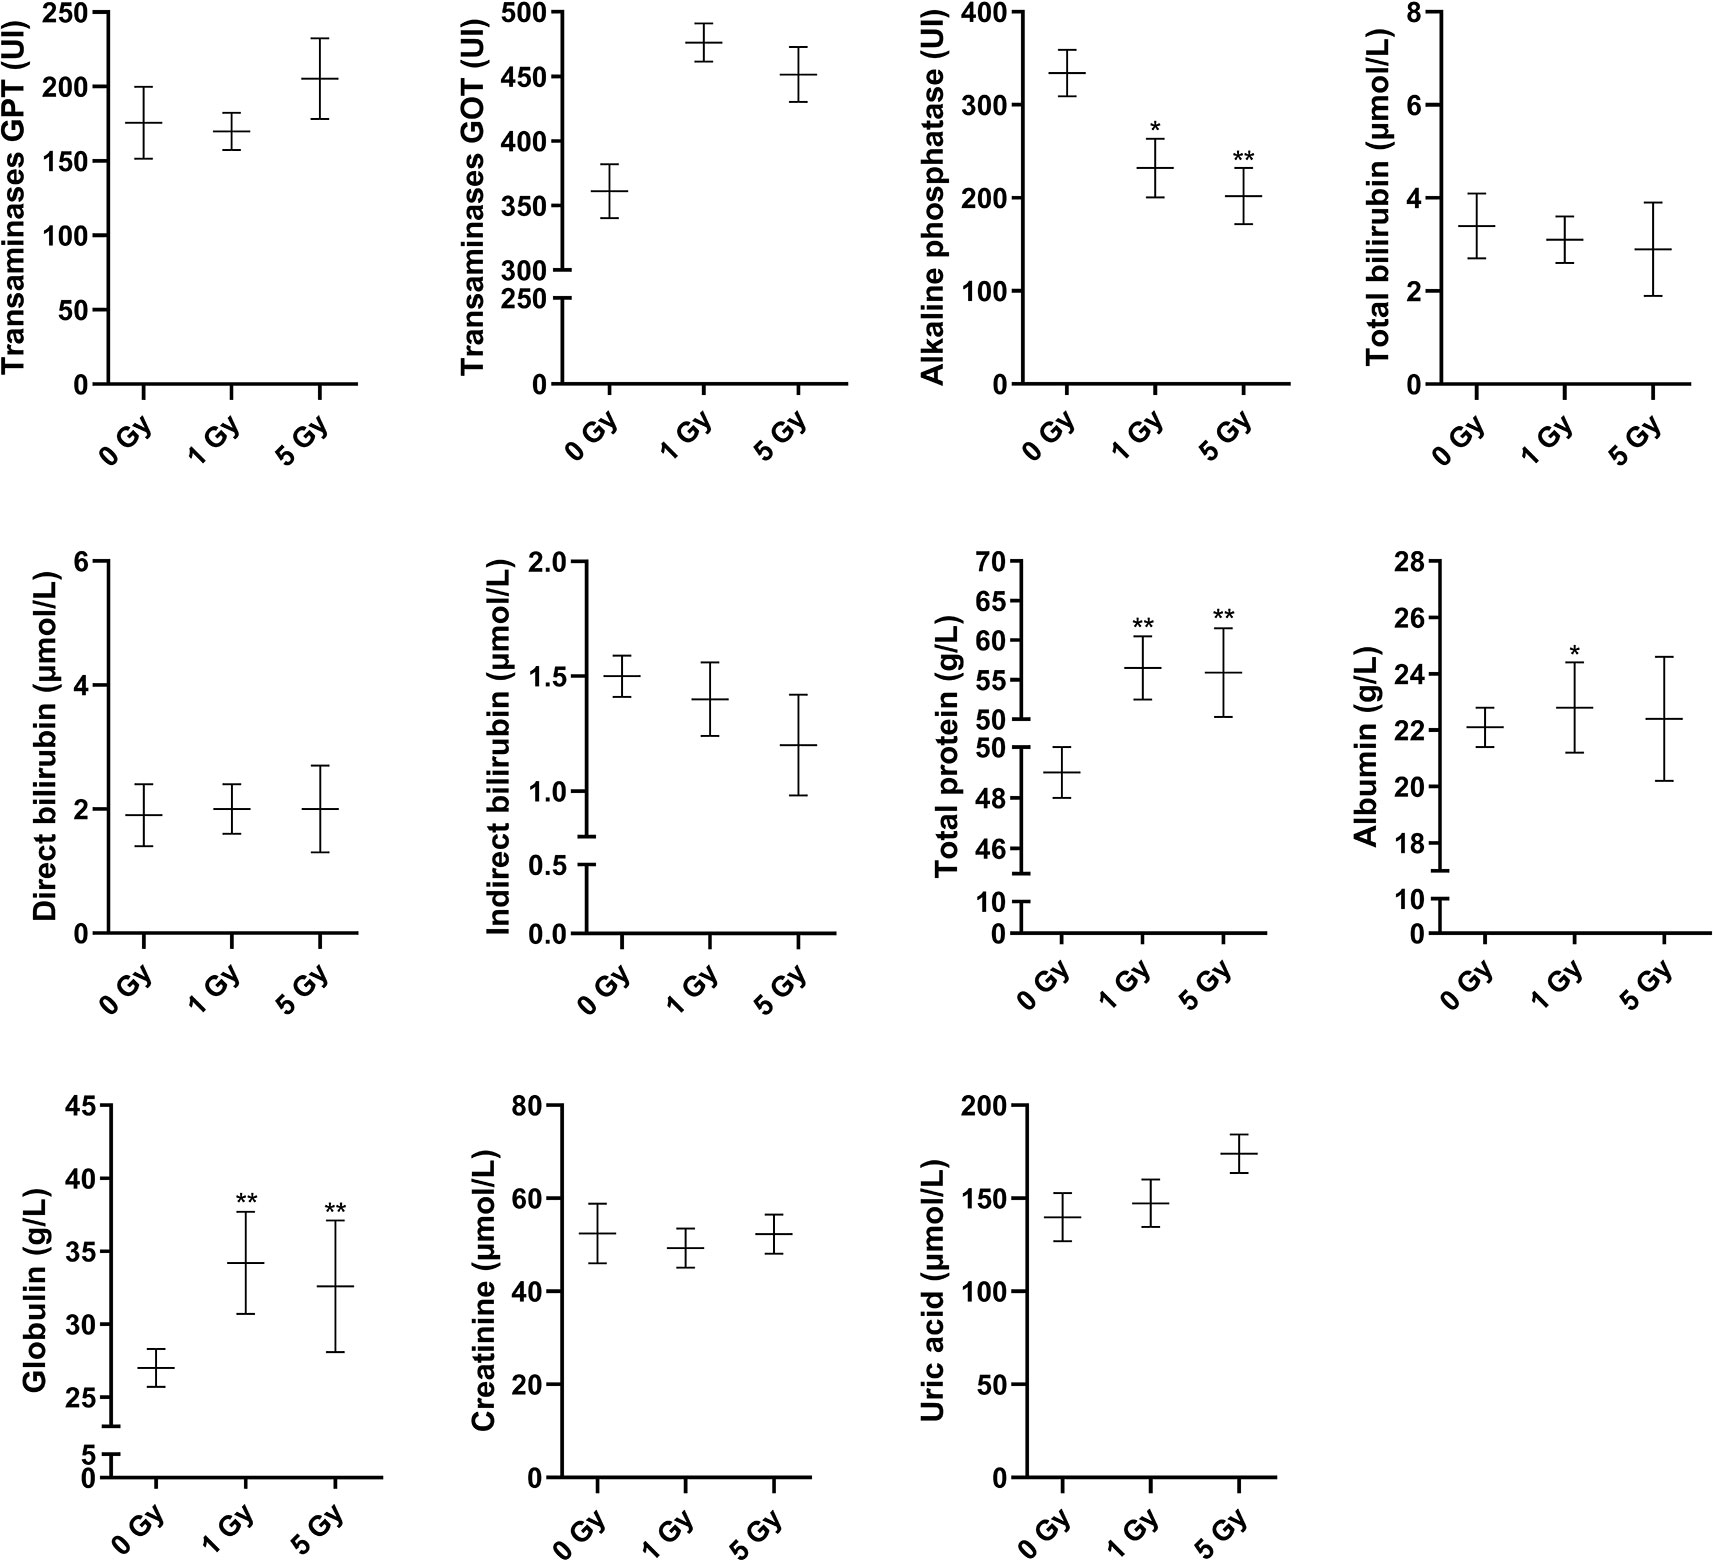
Figure 2 Changes in transaminases GPT, transaminases GOT, alkaline phosphatase, total bilirubin, direct bilirubin, indirect bilirubin, total protein, albumin, globulin, creatinine, and uric acid in the rats after X-ray irradiation. The data are presented as mean ± SD. N = 10. The data were analyzed using ANOVA, and the differences between the means of two groups were compared using LSD tests. *P < 0.05, **P < 0.01 compared to the 0 Gy group.
Thymus and Spleen Indexes
Figure 3 shows the thymus and spleen indexes for the rats after X-ray irradiation. Thymus indexes were 41.8% and 72.8% lower in the 1 Gy and 5 Gy groups (both P < 0.01), respectively, compared to those in the 0 Gy group, and they were 53.3% lower in the 5 Gy group than in the 1 Gy group (P < 0.01). The spleen index was 19.9% (P < 0.05) lower in the 1 Gy group and 56.8% lower in the 5 Gy group (P < 0.01) than in the 0 Gy group, and it was 46.1% lower in the 5 Gy group than in the 1 Gy group (P < 0.01).
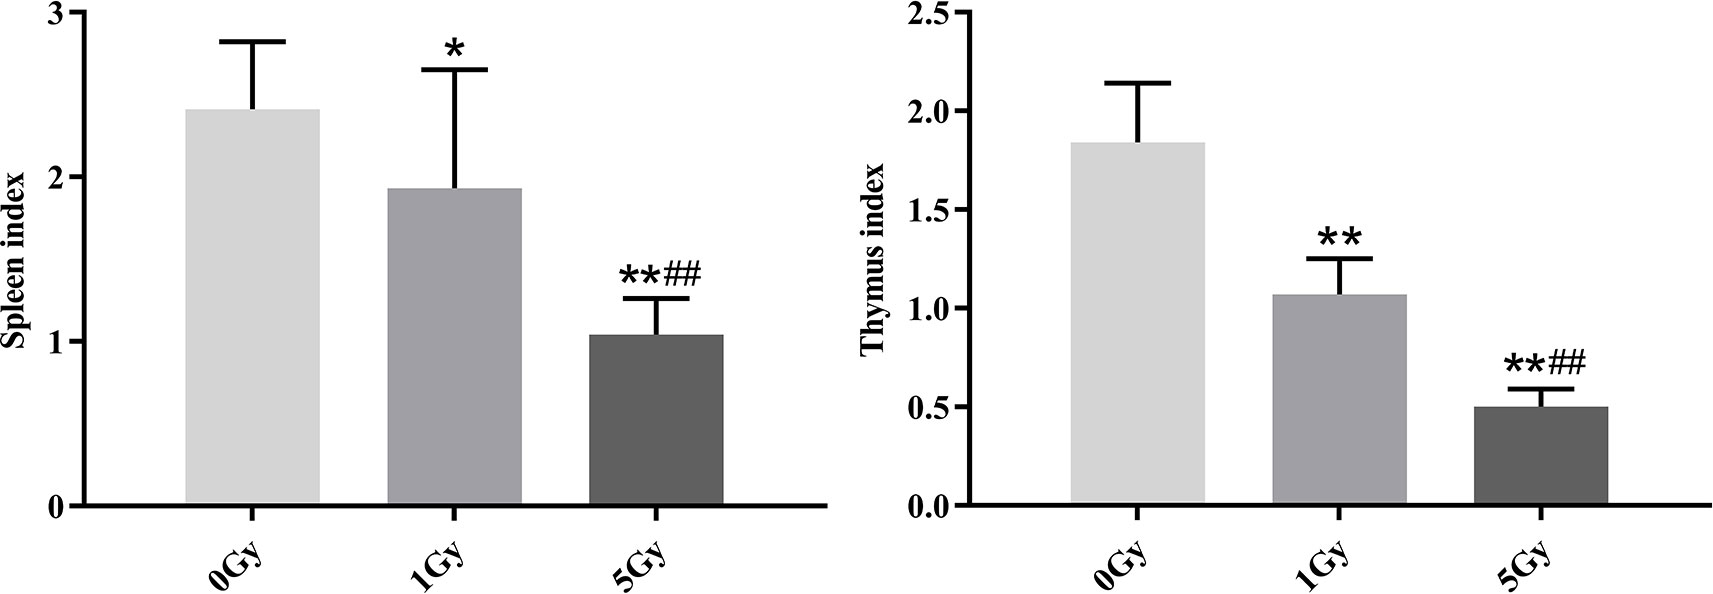
Figure 3 Thymus and spleen indexes in rats after exposure to X-ray irradiation. The data are presented as mean ± SD. N = 10. The data were analyzed using ANOVA, and the differences between the means of two groups were compared using LSD tests. *P < 0.05, **P < 0.01 compared to the 0 Gy group; ##P < 0.01 compared to the 1 Gy group.
Pharmacokinetics
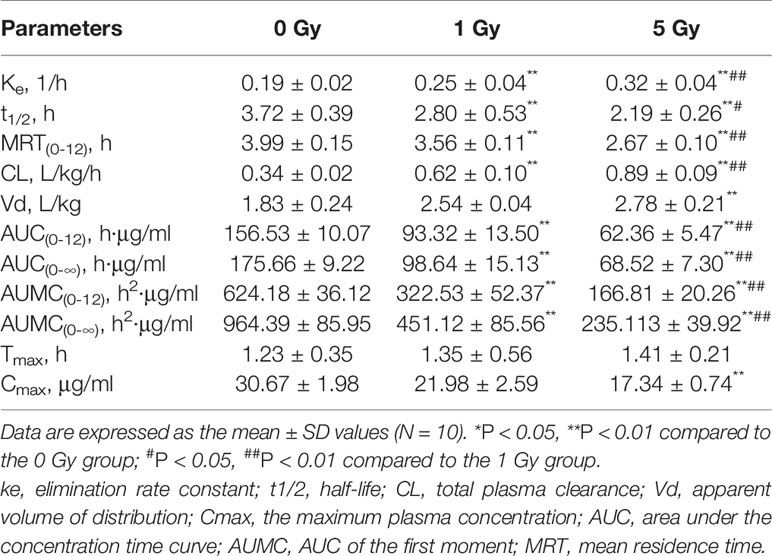
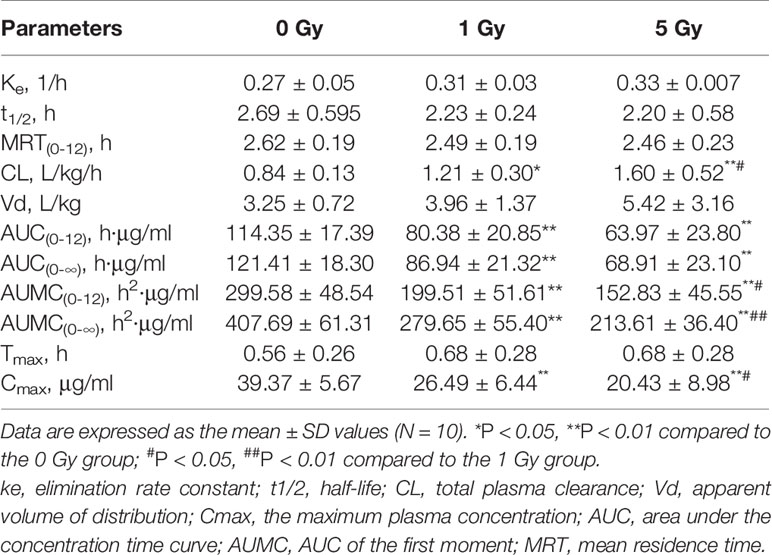
The pharmacokinetic parameters of caffeine and chlorzoxazone were not significantly different between genders, and both data were combined. The mean pharmacokinetic parameters of caffeine and chlorzoxazone in the rat plasma are listed in Tables 1 and 2, respectively. Figures 4 and 5 show mean plasma concentration–time profiles for caffeine and chlorzoxazone, respectively. Concentration–time profiles for caffeine and chlorzoxazone in plasma obtained for the three groups are similar in shape. Comparisons drawn between t1/2 in caffeine obtained from the rat plasma for the three groups studied revealed declines of 24.7% and 41.1% (both P < 0.01) after 1 and 5 Gy X-ray irradiation, respectively. Compared to the 0 Gy group, MRT0-12 values were 10.7% and 33.1% lower for the 1 Gy and 5 Gy groups (both P < 0.01), respectively. We also observed 1.7- and 2.5-fold declines for AUC0-12 in the 1 Gy and 5 Gy groups (both P < 0.01), respectively, compared to the 0 Gy group, and we observed a 1.5-fold decline in the 5 Gy group compared to the 1 Gy group (P < 0.01). CL values were 1.8- and 2.6-fold higher for the 1 Gy and 5 Gy groups (both P < 0.01), respectively, than for the 0 Gy group, and 1.4-fold higher in the 5 Gy group than in the 1 Gy group (P < 0.01). The Vd value was 38.8% and 51.9% (P < 0.01) higher in the 1 Gy and 5 Gy groups, respectively, compared with the 0 Gy group. The Cmax value was 28.3% and 43.5% (P < 0.01) lower in the 1 Gy and 5 Gy groups, respectively, than in the 0 Gy group. For Tmax, there was no significant difference when comparing the 1 Gy or 5 Gy groups with the 0 Gy.
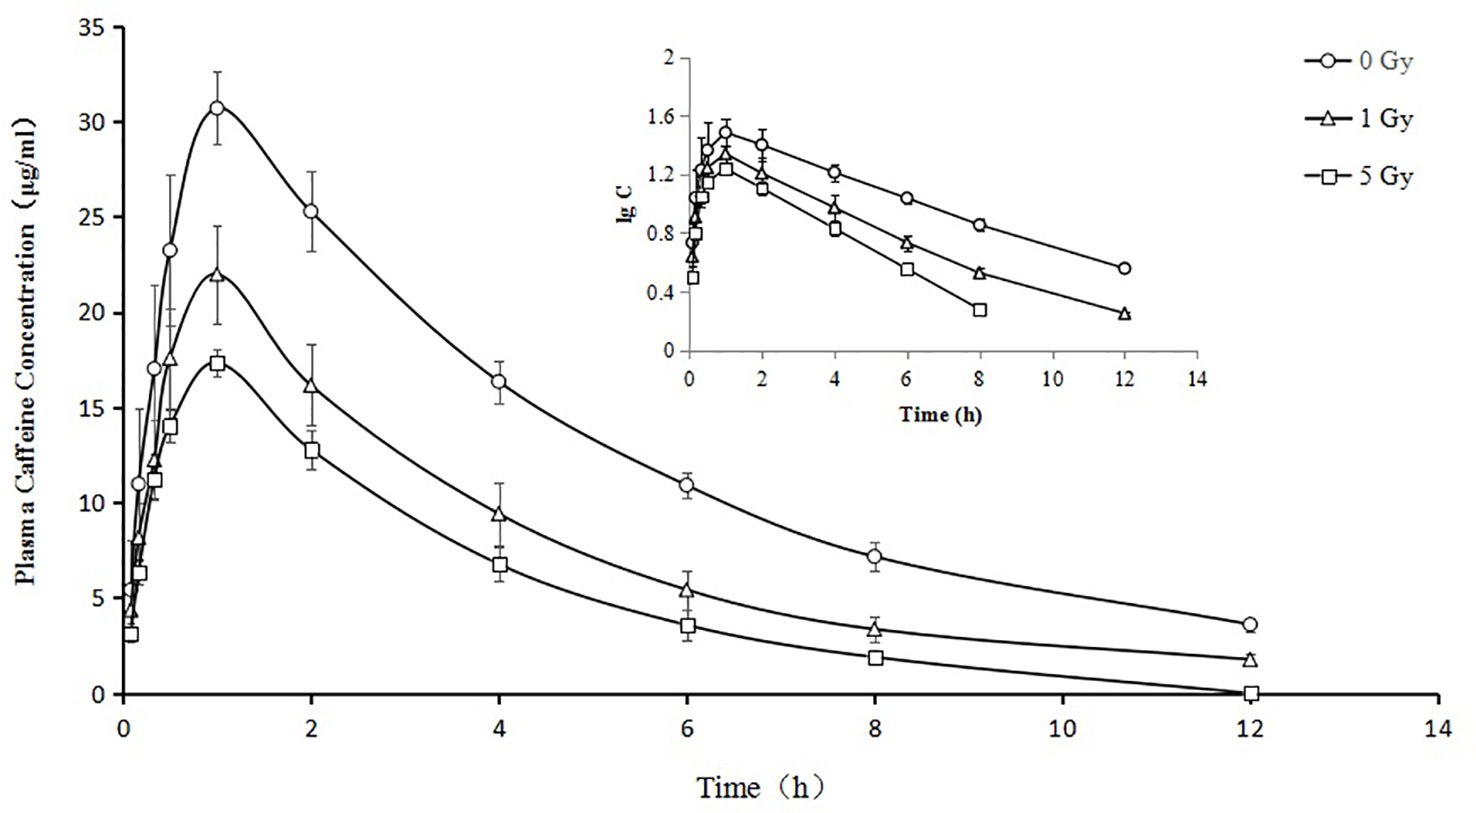
Figure 4 Mean plasma concentration time curve for oral caffeine (60 mg/kg) for rats subjected or not subjected to 1 Gy and 5 Gy of X-ray irradiation (N = 10).
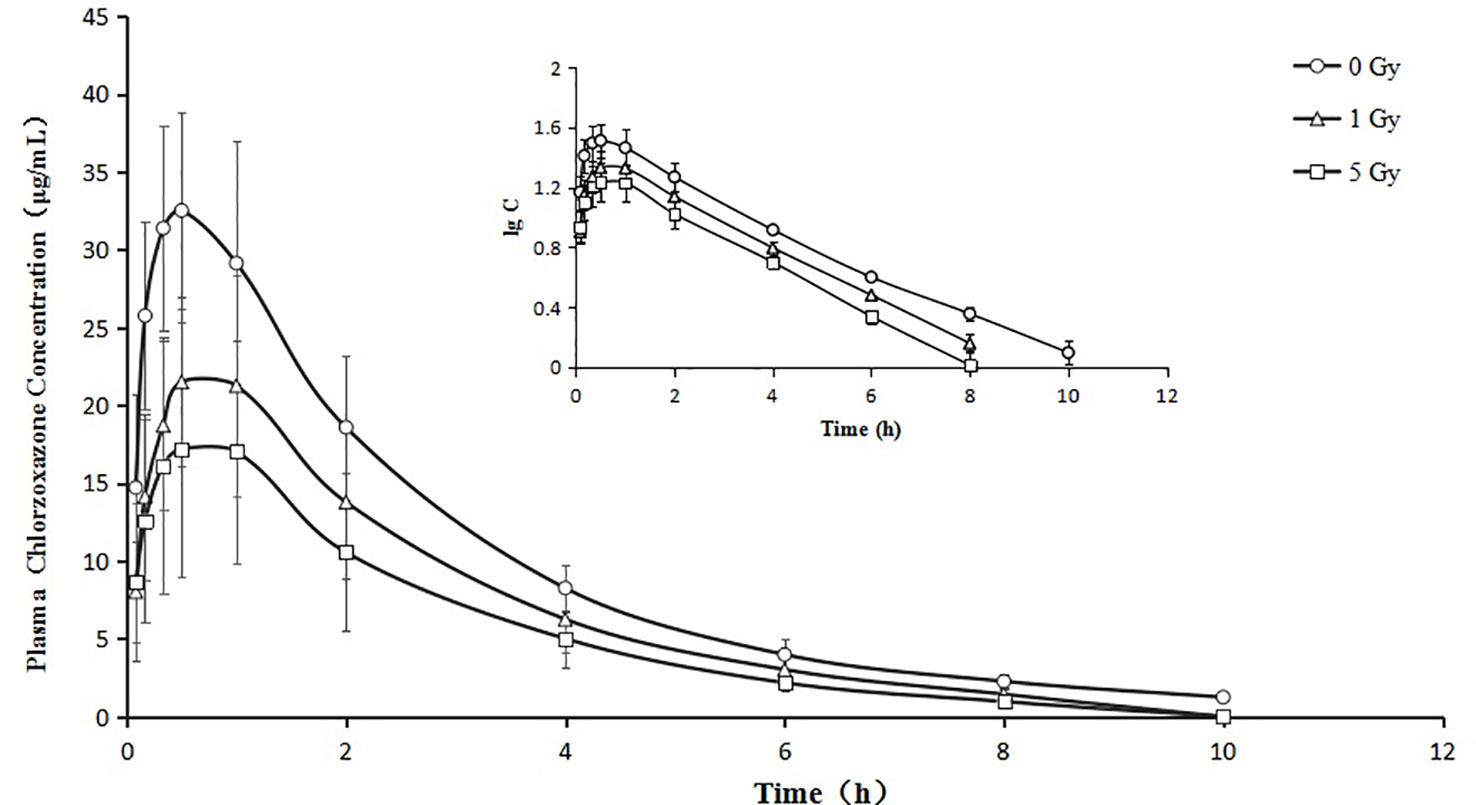
Figure 5 Mean plasma concentration time curve for oral chlorzoxazone (100 mg/kg) for rats subjected or not subjected to 1 Gy and 5 Gy of X-ray irradiation (N = 10).
Relative to the value in the 0 Gy group, AUC0-10 values for chlorzoxazone were 1.4- and 1.8-fold lower in the 1 Gy and 5 Gy groups (both P < 0.01), respectively. CL values were 1.4- (P < 0.05) and 1.9- (P < 0.01) fold higher in the 1 Gy and 5 Gy groups, respectively, than in the 0 Gy group and 1.3-fold higher in the 5 Gy group than in the 1 Gy group (P < 0.05). Cmax values were 32.7% and 48.1% lower in the 1 Gy and 5 Gy groups (both P < 0.01), respectively, compared to the 0 Gy group, and 22.9% lower in the 5 Gy group than in the 1 Gy group (P < 0.05). When comparing the 1 Gy and 5 Gy groups to the 0 Gy group, no statistically significant change in Vd was observed due to interindividual variations. However, it tended to enlarge with increasing irradiation and was 21.8% and 66.8% higher in the 1 Gy and 5 Gy groups, respectively, compared to the 0 Gy group. For t1/2, MRT, Ke, and Tmax values, we found no significant differences when comparing the 1 Gy and 5 Gy groups to the 0 Gy group.
The metabolism of caffeine and chlorzoxazone increases under X-ray irradiation as CL levels increase and AUC levels decrease, suggesting that CYP1A2 and CYP2E1 activity is enhanced in rats after X-ray irradiation.
Protein Expression of CYP1A2 and CYP2E1
CYP1A2 and CYP2E1 protein expression levels were enhanced significantly by X-ray irradiation in rats. Figures 6 and 7 show changes in the protein expression levels of CYP1A2 and CYP2E1 in rats after exposure to X-ray irradiation, respectively. Relative to the 0 Gy group, CYP1A2 protein expression levels were 28.3% and 38.9% higher for the 1 Gy and 5 Gy groups (both P < 0.05), respectively. The CYP2E1 protein expression levels were 48.4% higher for the 5 Gy group relative to those for the 0 Gy group (P < 0.05) and 25.6% higher for the 5 Gy group relative to those for the 1 Gy group (P < 0.05).
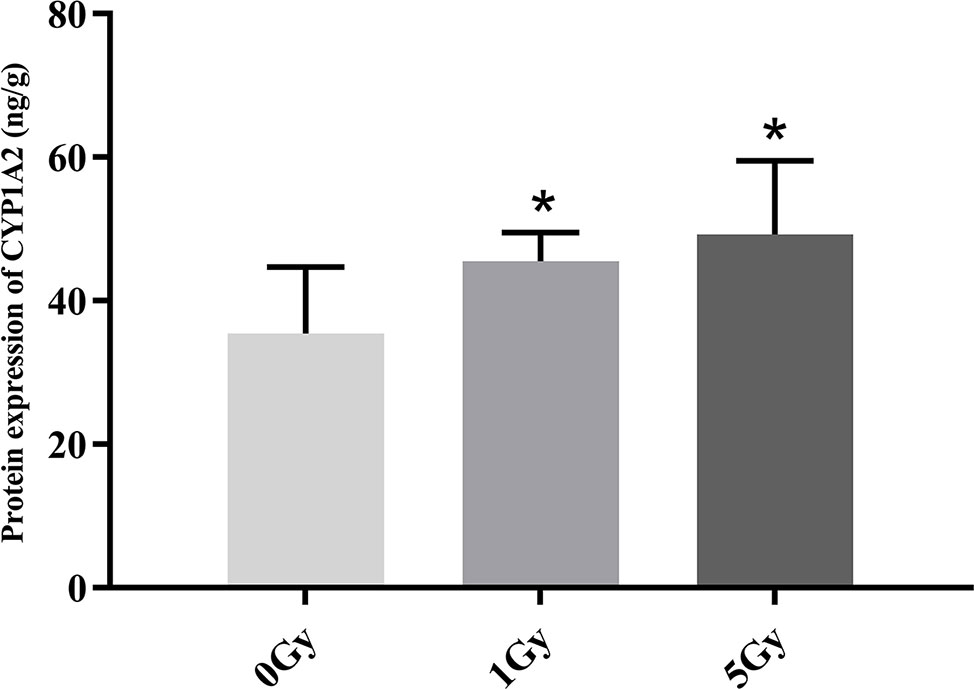
Figure 6 Protein expression of CYP1A2 in rats after exposure to X-ray irradiation. The data are presented as mean ± SD. N = 10. The data were analyzed using ANOVA, and the differences between the means of two groups were compared using LSD tests. *P < 0.05 compared to the 0 Gy group.
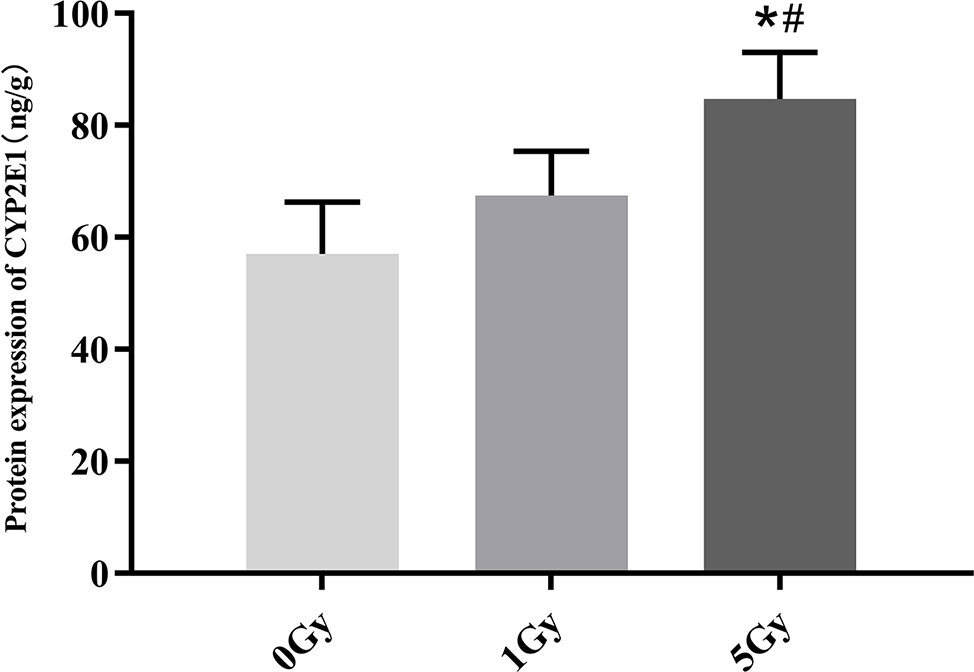
Figure 7 Protein expression of CYP2E1 in rats after exposure to X-ray irradiation. The data are presented as mean ± SD. N = 10. The data were analyzed using ANOVA, and the differences between the means of two groups were compared using LSD tests. *P < 0.05 compared to the 0 Gy group; #P < 0.05 compared to the 1 Gy group.
mRNA Expression of CYP1A2 and CYP2E1
CYP1A2 and CYP2E1 mRNA expression levels were enhanced significantly by X-ray irradiation in rats. Figures 8 and 9 show changes in the mRNA expression levels of CYP1A2 and CYP2E1 in rats after exposure to X-ray irradiation, respectively. The mRNA expression level of CYP1A2 was 200.0% and 856.3% higher for the 1 Gy and 5 Gy groups (both P < 0.01), respectively, than for the 0 Gy group and 218.8% higher for the 5 Gy group than for the 1 Gy group (P < 0.01). CYP2E1 mRNA expression level was 89.0% and 192.3% higher for the 1 Gy and 5 Gy groups (both P < 0.01), respectively, than for the 0 Gy group and 54.7% higher for the 5 Gy group relative to the 1 Gy group (P < 0.01).
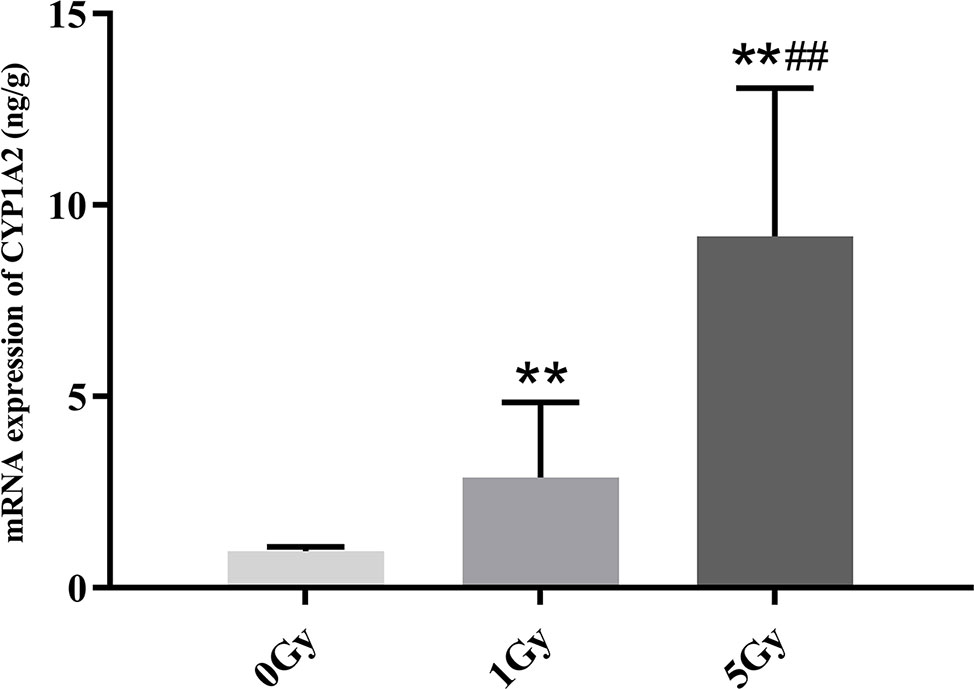
Figure 8 The mRNA expression of CYP1A2 in rats after exposure to X-ray irradiation. The data are presented as mean ± SD. N = 10. The data were analyzed using ANOVA, and the differences between the means of two groups were compared using LSD tests. **P < 0.01 compared to the 0 Gy group; ##P < 0.01 compared to the 1 Gy group.
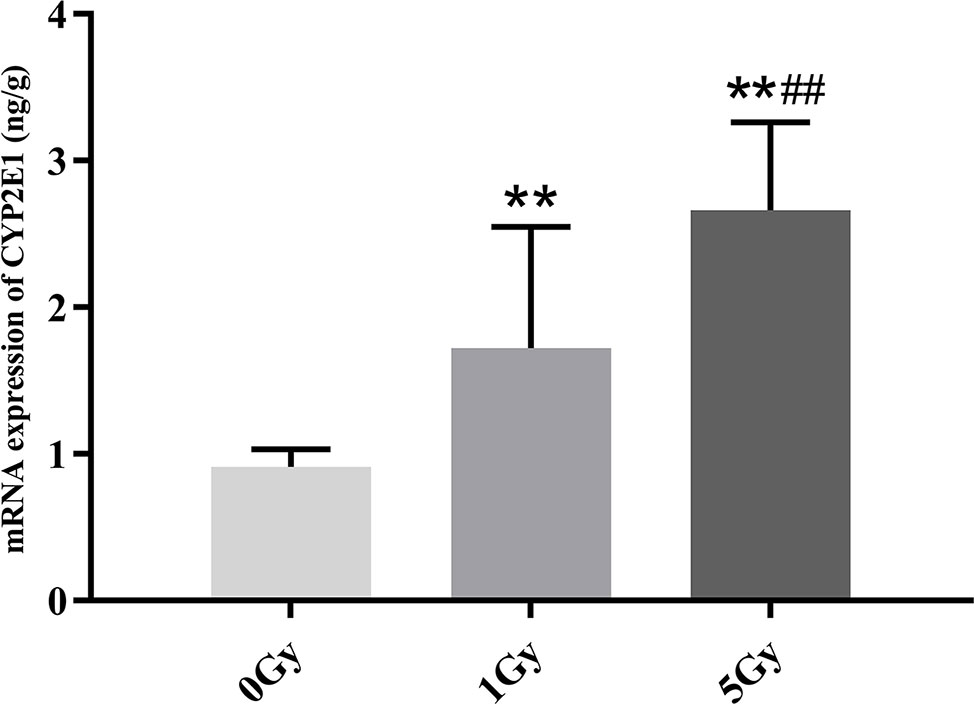
Figure 9 The mRNA expression of CYP2E1 in rats after exposure to X-ray irradiation. The data are presented as mean ± SD. N = 10. The data were analyzed using ANOVA, and the differences between the means of two groups were compared using LSD tests. **P < 0.01 compared to the 0 Gy group; ##P < 0.01 compared to the 1 Gy group.
Discussion
A cocktail method was used to evaluate CYP1A2 and CYP2E1 activity. CYP450 activity can be determined from the ratio of probe drugs and their metabolites in the plasma or serum at a certain time point after probe drugs are administered or from changes in the pharmacokinetic parameters of probe substrates (Li et al., 2014a; Wu et al., 2015). Due to differences observed among individuals, there are some limitations in evaluating CYP450 activity from the ratio of probe drugs and their metabolites at a certain time point. For this study, caffeine and chlorzoxazone were selected as probe drugs for CYP1A2 and CYP2E1, respectively, and CYP1A2 and CYP2E1 activity was evaluated from pharmacokinetic changes in the probes. In addition, drug doses, the timing of blood collection, and analytical methods were optimized according to the relevant literature. In our pre-experiment, the pharmacokinetic study and tissue samplings were conducted around 0 and 24 hours following irradiation, and the results showed a slight significant difference between the irradiation and control groups. In this study, therefore, the pharmacokinetic experiments and tissue samplings were conducted around 40 hours following irradiation.
The present study is the first to investigate the activity and expression levels of CYP1A2 and CYP2E1 in rats after exposure to X-ray irradiation. γ-ray irradiation from Co60 has been used as modeling material in previous studies (Hsieh et al., 2011; Tsai et al., 2015), but the use of Co60 has been gradually discontinued due to its harmful effects on patients. Linear accelerators customize electrons or high-energy X-rays to conform to a tumor's shape and to destroy cancer cells while sparing the surrounding normal tissue, and they are now commonly used in radiotherapy due to their reliability, wide energy wavelength, and user-friendly interface (Janatpour et al., 2005; Thwaites and Tuohy, 2006; Griffiths et al., 2007). In our study, therefore, rat models were established with a one-time X-ray generated from a linear accelerator and applied to the whole body.
The body's hematopoietic and immune systems are the most sensitive to ionizing irradiation (Sanzari et al., 2013). Irradiation can inhibit or destroy the proliferation of the hematopoietic stem cells, granulocyte progenitors, and erythroid progenitor cells, and it can cause the dysfunction of the bone marrow hematopoietic system, the destruction of hematopoietic microenvironments, microcirculation disturbances, and the decline of peripheral blood cell counts (Volpi and Tarugi, 1999). Previous studies have shown that the number of white blood cells and the thymus and spleen indexes are decreased significantly in mice after exposure to X-ray irradiation (Duan et al., 2015). Our results show that white blood cell counts were 26.0% and 61.3% lower, that thymus indexes were 41.8% and 72.8% lower, and that spleen indexes were 19.9% and 56.8% lower in rats after X-ray irradiation at 1 Gy and 5 Gy, respectively. The thymus and spleen are the two main immune organs, and the thymus and spleen indexes can reflect and predict the immune function of the body. In our study, the indexes of the thymus and spleen were significantly decreased after irradiation, which indicated atrophy of the thymus and spleen. This may be mainly due to the increased apoptosis of the thymus and spleen cells after irradiation. Under the combined action of the first and second signals of antigen stimulation, a series of specific and non-specific immune responses are generated. This long-lasting, strong response further aggravates immune organ damage (Cao et al., 2004). In addition, the physiologic changes produced by irradiation are extremely complex and not completely understood. Total protein levels were higher in the irradiation groups than in the control group in the current study. Whether the protein binding rate of caffeine and chlorzoxazone changes under X-ray irradiation and further affects their pharmacokinetics needs further evaluation.
The activity of CYP1A2 and CYP2E1 was increased significantly in rats after exposure to X-ray irradiation. We found statistically significant differences in several pharmacokinetic parameters of caffeine and chlorzoxazone obtained from plasma data in rats after exposure to X-ray irradiation. Compared with the 0 Gy group, whole-body irradiation decreased the AUC of caffeine and chlorzoxazone and increased the CL. With respect to pharmacokinetics, this suggests that X-ray irradiation could facilitate the excretion of caffeine and chlorzoxazone. The decrease in AUC observed after 1 Gy or 5 Gy exposure to X-ray irradiation is consistent with the observed CL. When comparing the 1 Gy and 5 Gy groups to the 0 Gy group, no statistically significant change in the Vd of chlorzoxazone was observed due to interindividual variations. However, this parameter tended to enlarge with increasing irradiation. Mean plasma concentration–time profiles for chlorzoxazone in the treated groups seem to just shift parallely downward, which may indicate that Vd is the only factor needed to describe the effect of irradiation. The pharmacokinetic parameters of Tmax of caffeine and Ke, t1/2, MRT as well as Tmax of chlorzoxazone obtained from the 1 Gy and 5 Gy groups were in accord with those found in the 0 Gy group. Our results are reminiscent of the effect of irradiation on the pharmacokinetics of 5-fluorouracil and irinotecan hydrochloride reported in recent studies. Whole pelvic and abdominal γ-ray irradiation with 2 Gy decreased the AUC of 5-fluorouracil in rats by 21.5% and 31.7%, respectively (Hsieh et al., 2010; Hsieh et al., 2011; Hsieh et al., 2015). Our previous study indicated that whole-body X-ray irradiation decreased the AUC of irinotecan hydrochloride and increased the CL (Qiao et al., 2019).
We found statistically significant increases in the activity and expression levels of CYP1A2 and CYP2E1 in rats after exposure to X-ray irradiation, and the changes in the activity observed echo changes in protein and mRNA expression levels. Previous studies show that successive exposure to γ-ray irradiation at 0.5 and 1 Gy does not affect the expression of CYP2E1, though protein and mRNA expression levels increase 3.6- and 2.5-fold after successive exposure to 3 Gy γ-ray (Chung et al., 2001; Maksymchuk et al., 2008). Chung et al. assessed the expression of CYP1A2 and CYP3A in rats after γ-ray irradiation, and they found that 3 Gy γ-rays do not change the expression levels of CYP1A2 and CYP3A (Chung et al., 2001). Ahn et al. found that the expression level of CYP2E1 exhibited a significant 2.3-fold increase in rats after uranium irradiation (Ahn et al., 2003). Lee et al. and Chung et al. investigated the effects of uranium irradiation on CYP1A2, CYP2E1, and CYP3A1, and their results showed that the expression level of CYP1A2 remained unchanged by uranium radiation, whereas the levels for CYP2E1 and CYP3A1 exhibited 2–4-fold and 4-fold increases, respectively (Chung et al., 2003; Lee et al., 2006). We found that CES1 and CYP3A1 protein and mRNA expression levels increased significantly in rats after exposure to X-ray irradiation. The irradiation-CYP450 phenomena must be therefore further investigated (Qiao et al., 2019).
Given that the concurrent use of chemotherapeutics in combination with radiotherapy is improving clinical treatment outcomes for an increasing number of malignancies (Herskovic et al., 1992; Eifel et al., 2004), the present study is timely. We show that X-ray irradiation can affect CYP1A2 and CYP2E1 activity and expression levels, which provides a reason for considering adjustments to chemotherapeutic administration during radiotherapy. The effect of these changes on the pharmacokinetics of drugs will depend upon the isoform involved in their biotransformation. We may predict that the AUC for substrates of CYP1A2 and CYP2E1, such as tamoxifen, pomalidomide, and etoposide, should be lower due to the decreased absorption and increased first pass and renal clearance levels under X-ray irradiation. The effect of X-ray irradiation on the systemic pharmacokinetics of chemotherapeutic agents or on other drugs is clearly in need of further clinical evaluation. Our study was performed on healthy rats. It is not known whether the same results would be observed in humans. Also, the significance of these changes may be different for patient populations, children, or the elderly. Moreover, theobromine, theophylline, and paraxanthine for caffeine and 6-hydroxy chlorzoxazone for chlorzoxazone should be measured simultaneously to support our findings. Given the significant changes in the absorption of caffeine and chlorzoxazone, one can speculate that intestinal CYP induction took place as well under irradiation. In addition, the pharmacokinetics of oral anti-cancer drugs, such as kinase inhibitors, is influenced by the intestinal CYP System. Additional experiments are required to further evaluate the activity and expression of intestinal CYP1A2 and CYP2E1 under X-ray irradiation.
Conclusion
The present study is the first to investigate the activity and expression levels of CYP1A2 and CYP2E1 in rats after exposure to X-ray irradiation. This study reveals significant increases in the activity and expression levels of CYP1A2 and CYP2E1 in rats after exposure to X-ray irradiation, and the changes in activity observed echo changes in protein and mRNA expression levels. These findings support the suggestion that the pharmacokinetics of drugs during concurrent chemoradiation therapy should be re-checked and the optimal dose should be reevaluated, and adjusted if necessary, during concurrent chemoradiation therapy.
Data Availability Statement
The datasets generated for this study are available on request to the corresponding author.
Ethics Statement
The experimental procedures involving animals in this study were approved by the Animal Ethics Committee of the Medical College of Qinghai University. Experimental protocols were followed with strict adherence to the regulations set forth by the Experimental Animal Regulation by the National Science and Technology Commission, China, for the use of laboratory animals.
Author Contributions
X-YL and NQ conceived and designed the research study. Y-YX, J-BZ, and J-XY participated in the acquisition of samples and data. XB and Y-BD analyzed and interpreted the data. X-JW, X-YL, NQ, and Y-BD wrote and revised the manuscript. All authors listed have made substantial, direct, and intellectual contributions to the work, and all approved it for publication.
Funding
This study was supported by the National Natural Science Fund of China (No. 81760673 and 81660197) and the Natural Science Fund of Qinghai province, China (No. 2019-ZJ-918).
Conflict of Interest
The authors declare that the research was conducted in the absence of any commercial or financial relationships that could be construed as a potential conflict of interest.
Acknowledgments
We thank LetPub (www.letpub.com) for its linguistic assistance during the preparation of this manuscript.
Supplementary Material
The Supplementary Material for this article can be found online at: https://www.frontiersin.org/articles/10.3389/fphar.2019.01575/full#supplementary-material
References
Ahn, C. Y., Kim, E. J., Lee, I., Kwon, J. W., Kim, W. B., Kim, S. G., et al. (2003). Effects of glucose on the pharmacokinetics of intravenous chlorzoxazone in rats with acute renal failure induced by uranyl nitrate. J. Pharm. Sci. 92, 1604–1613. doi: 10.1002/jps.10426
Andrianov, A., Kanke, V., Kuptsov, I., Murogov, V. (2015). Reexamining the ethics of nuclear technology. Sci. Eng. Ethics 21, 999–1018. doi: 10.1007/s11948-014-9578-0
Cao, M. D., Chen, Z. D., Xing, Y. (2004). Gamma irradiation of human dendritic cells influences proliferation and cytokine profile of T cells in autologous mixed lymphocyte reaction. Cell. Biol. Int. 28, 223–228. doi: 10.1016/j.cellbi.2003.12.006
Chung, H. C., Kim, S. H., Lee, M. G., Cho, C. K., Kim, T. H., Lee, D. H., et al. (2001). Mitochondrial dysfunction by γ-irradiation accompanies the induction of cytochrome P450 2E1 (CYP2E1) in rat liver. Toxicology 161, 79–91. doi: 10.1016/s0300-483x(01)00332-8
Chung, W., Kim, E. J., Lee, I., Kim, S. G., Lee, M. G., Kim, S. H. (2003). Effects of recombinant human growth hormone on the pharmacokinetics of intravenous chlorzoxazone in rats with acute renal failure induced by uranyl nitrate. Life. Sci. 73, 253–263. doi: 10.1016/s0024-3205(03)00268-6
Duan, Y. B., Chen, F., Yao, X. C., Zhu, J. B., Wang, C., Zhang, J. L., et al. (2015). Protective effect of lycium ruthenicum murr. Against irradiation injury in mice. Int. J. Environ. Res. Public. Health 12, 8332–8347. doi: 10.3390/ijerph120708332
Eichelbaum, M., Kroemer, N. K., Mikus, G. (1992). Genetically determined differences in drug metabolism as a risk factor in drug toxicity. Toxicol. Lett. 64–65, 115–122. doi: 10.1016/0378-4274(92)90180-r
Eifel, P. J., Winter, K., Morris, M., Levenback, C., Grigsby, P. W., Cooper, J., et al. (2004). Pelvic irradiation with concurrent chemotherapy versus pelvic and para-aortic irradiation for high-risk cervical cancer: an update of radiation therapy oncology group trial (RTOG) 90-01. J. Clin. Oncol. 22, 872–880. doi: 10.1200/JCO.2004.07.197
Griffiths, A., Marinovich, L., Barton, M. B., Lord, S. J. (2007). Cost analysis of Gamma Knife stereotactic radiosurgery. Int. J. Technol. Assess. Health Care 23, 488–494. doi: 10.1017/S0266462307070584
Guengerich, F. P. (1995). “Human cytochrome P450 enzymes,” in Cytochrome P450. Ed. Ortiz de Montellano, P. R. (New York: Plenum Press), 473–535.
Herskovic, A., Martz, K., al-Sarraf, M., Leichman, L., Brindle, J., Vaitkevicius, V., et al. (1992). Combined chemotherapy and radiotherapy compared with radiotherapy alone in patients with cancer of the esophagus. N. Engl. J. Med. 326, 1593–1598. doi: 10.1056/NEJM199206113262403
Hsieh, C. H., Hsieh, Y. J., Liu, C. Y., Tai, H. C., Huang, Y. C., Shueng, P. W., et al. (2010). Abdominal irradiation modulates 5-Fluorouracil pharmacokinetics. J. Transl. Med. 8, 29. doi: 10.1186/1479-5876-8-29
Hsieh, C. H., Liu, C. Y., Hsieh, Y. J., Tai, H. C., Wang, L. Y., Tsai, T. H., et al. (2011). Matrix metallopro-teinase-8 mediates the unfavorable systemic impact of local irirradiation on pharmacokinetics of anti-cancer drug 5-fluorouracil. PloS One 6, e21000. doi: 10.1371/journal.pone.0021000
Hsieh, C. H., Hou, M. L., Wang, L. Y., Tai, H. C., Tsai, T. H., Chen, Y. J. (2015). Local pelvic irradiation modulates pharmacokinetics of 5-fluorouracil in the plasma but not in the lymphatic system. BMC Cancer 15, 316–324. doi: 10.1186/s12885-015-1344-4
Janatpour, K., Denning, L., Nelson, K., Betlach, B., MacKenzie, M., Holland, P. (2005). Conparison of X-ray vs. Gamma irradiation of CPDA-1 red cells. Vox Sang. 89, 215–219. doi: 10.1111/j.1423-0410.2005.00699.x
Jones, D. P., Aw, T. Y., Shan, X. Q. (1989). Drug metabolism and toxicity during hypoxia. Drug Metab. Rev. 20, 247–260. doi: 10.3109/03602538909103540
Lee, M. G., Lee, J. H., Oh, J. M. (2006). Pharmacokinetic changes of drugs in rat model of acute renal failure induced by uranyl nitrate: correlation between drug metabolism and hepatic microsomal cytochrome P450 isozymes. Curr. Clin. Pharmacol. 1, 193–205. doi: 10.2174/157488406776872569
Li, X. Y., Wang, X. J., Li, Y. P., Yuan, M., Zhu, J. B., Su, X. D., et al. (2014a). Effect of exposure to acute and chronic high altitude hypoxia on the activity and expression of CYP1A2, CYP2D6, CYP2C9, CYP2C19 and NAT2 in rats. Pharmacology 93, 76–83. doi: 10.1159/000358128
Li, X. Y., Wang, X. J., Li, Y. P., Zhu, J. B., Su, X. D., Yao, X. C., et al. (2014b). The activity, protein and mRNA expression of CYP2E1 and CYP 3A1 in rats after exposure to acute and chronic high-altitude hypoxia. High. Alt. Med. Biol. 15, 491–496. doi: 10.1089/ham.2014.1026
Li, X. Y., Yang, J. X., Qiao, Y. J., Duan, Y. B., Xin, Y. Y., Nian, Y. Q., et al. (2019). Effects of Radiation on Drug Metabolism: A Review. Curr. Drug Metab. 20, 350–360. doi: 10.2174/1389200220666190405171303
Maksymchuk, O. V., Bobyk, V. I., Sydoryk, L. L., Chashchyn, M. O. (2008). Influence of long-term combined gamma-radiation and ethanol on cytochrome P450 2E1 expression in the mice liver. Ukr. Biokhim. Zh. 80, 105–111.
Marchenko, M. M., Kopyl'chuk, G. P., Ketsa, O. V. (2010). Effect of low doses of X-ray irradiation on the liver detoxication system in rats with transplanted Guerin's carcinoma. Biomed. Khim. 56, 266–273. doi: 10.1134/s1990750809040076
Qiao, Y. J., Xin, Y. Y., Zhou, X. J., Yang, M., Li, X. Y. (2017). A review of irradiation impact on drug metabolism. Acta Pharmaceutica. Sinica. 52, 871–878. doi: 10.16438/j.0513-4870.2016-1152
Qiao, Y. J., Wang, X. J., Xin, Y. Y., Nian, Y. Q., Yang, J. X., Duan, Y. B., et al. (2019). Effect of x-ray irradiation on pharmacokinetics of irinotecan hydrochloride and expression of CES1 and CYP3A1 in rats. Fundam. Clin. Pharmacol. 33, 558–566. doi: 10.1111/fcp.12456
Rendic, S., Guengerich, F. P. (2010). Update information on drug metabolism systems-2009, part II: summary of information on the effects of diseases and environmental factors on human cytochrome P450 (CYP) enzymes and transporters. Curr. Drug Metab. 11, 4–84. doi: 10.2174/138920010791110917
Rendic, S., Guengerich, F. P. (2012). Summary of information on the effects of ionizing and non-ionizing irradiation on cytochrome P450 and other drug metabolizing enzymes and transporters. Curr. Drug Metab. 13, 787–814. doi: 10.2174/138920012800840356
Repacholi, M. H. (2017). A history of the international commission on non-ionizing irradiation protection. Health Phys. 113, 282–300. doi: 10.1097/HP.0000000000000699
Sanzari, J. K., Wan, X. S., Krigsfeld, G. S., Wroe, A. J., Gridley, D. S., Kennedy, A. R. (2013). The effects of gamma and proton radiation exposure on hematopoietic cell counts in the ferret model. Gravit. Space. Res. 1, 79–94.
Satish, K. B., Prasad, N. (2018). The effect of quercetin on the pharmacokinetics of chlorzoxazone, a CYP2E1 substrate, in healthy subjects. Eur. J. Clin. Pharmacol. 74, 91–97. doi: 10.1007/s00228-017-2345-9
Sato, R. C., Zouain, D. M. (2012). Factor analysis for the adoption of nuclear technology in diagnosis and treatment of chronic diseases. Einstein (Sao Paulo) 10, 62–66. doi: 10.1590/s1679-45082012000100013
Spetz, J., Moslehi, J., Sarosiek, K. (2018). Irradiation-induced cardiovascular toxicity: mechanisms, prevention, and treatment. Curr. Treat. Options. Cardiovasc. Med. 20, 31–38. doi: 10.1007/s11936-018-0627-x
Sutlief, S. G. (2015). Protection and measurement in radiation therapy. Health Phys. 108, 224–241. doi: 10.1097/HP.0000000000000241
Thwaites, D. I., Tuohy, J. B. (2006). Back to the future: the history and development of the clinical linear accelerator. Phys. Med.Biol. 51, 343–362. doi: 10.1088/0031-9155/51/13/R20
Tsai, T. H., Chen, Y. J., Hou, M. L., Wang, L. Y., Tai, H. C., Hsieh, C. H. (2015). Pelvic irirradiation modulates the pharmacokinetics of cisplatin in the plasma and lymphatic system. Am. J. Transl. Res. 7, 375–384.
Vesell, E. S. (1997). Genetic and environmental factors affecting drug disposition in man. Clin. Pharmacol. Ther. 22, 659–679. doi: 10.1002/cpt1977225part2659
Volpi, N., Tarugi, P. (1999). Influence of chondroitin sulfate charge density, sulfate group position, and molecular mass on Cu2+-mediated oxidation of human low-density lipoproteins: effect of normal human plasma-derived chondroitin sulfate. J. Biochem. 125, 297–304. doi: 10.1093/oxfordjournals.jbchem.a022286
von Neubeck, C., Geniza, M. J., Kauer, P. M., Robinson, R. J., Chrisler, W. B., Sowa, M. B. (2015). The effect of low dose ionizing irradiation on homeostasis and functional integrity in an organotypic human skin model. Mutat. Res. 775, 10–18. doi: 10.1016/j.mrfmmm.2015.03.003
Wang, X., Lee, W. Y. W., Or, P. M. Y., Yeung, J. H. K. (2009). Effects of major tanshinones isolated from danshen (salvia miltiorrhiza) on rat cyp1a2 expression and metabolism of model cyp1a2 probe substrates. Phytomedicine 16 (8), 712–725. doi: 10.1016/j.phymed.2009.03.004
Wu, Q., Zhang, Q. W., Wen, C. C., Hu, L. F., Wang, X. Q., Lin, G. Y. (2015). The effect of MS-275 on CYP450 isoforms activity in rats by cocktail method. Int. J. Clin. Exp. Pathol. 8, 9360–9367.
Yang, P. (2014). The metabolism in vivo and pharmacokinetic interaction study of chlorzoxazone in SD rats. [dissertation/master"s thesis] (Fujian (IL): Fujian University of Tranditional Chinese Medicine). doi: 10.7666/d.Y2561498
Yi, J. F., Wu, B., Liu, C. L., Gao, Y. (2015). Effect of ginsenoside total saponinon on regulation of P450 of livers of rats after γ-ray irradiation. Zhongguo. Zhong. Yao. Za. Zhi. 40, 4037–4043. doi: 10.4268/cjcmm20152027
Keywords: CYP1A2, CYP2E1, X-ray irradiation, activity, expression, pharmacokinetics
Citation: Li X-Y, Qu N, Wang X-J, Yang J-X, Xin Y-Y, Zhu J-B, Bai X and Duan Y-B (2020) Regulation of X-Ray Irradiation on the Activity and Expression Levels of CYP1A2 and CYP2E1 in Rats. Front. Pharmacol. 10:1575. doi: 10.3389/fphar.2019.01575
Received: 12 September 2019; Accepted: 05 December 2019;
Published: 28 January 2020.
Edited by:
Yurong Lai, Gilead, United StatesReviewed by:
Dirk Theile, Heidelberg University Hospital, GermanyXin Wang, East China Normal University, China
Satish Kumar Bedada, Sanofi, India
Copyright © 2020 Li, Qu, Wang, Yang, Xin, Zhu, Bai and Duan. This is an open-access article distributed under the terms of the Creative Commons Attribution License (CC BY). The use, distribution or reproduction in other forums is permitted, provided the original author(s) and the copyright owner(s) are credited and that the original publication in this journal is cited, in accordance with accepted academic practice. No use, distribution or reproduction is permitted which does not comply with these terms.
*Correspondence: Xiang-Yang Li, cWhtY2x4eUAxNjMuY29t
†These authors share first authorship
 Xiang-Yang Li
 Ning Qu3†
 Ya-Bin Duan