 Giovani Preza Fontes
 Rabin Bhattarai
 Laura E. Christianson
 Cameron M. Pittelkow
- 1Department of Crop Sciences, University of Illinois, Urbana, IL, United States
- 2Department of Agricultural and Biological Engineering, University of Illinois, Urbana, IL, United States
Nitrogen (N) losses from cropping systems in the U.S. Midwest represent a major environmental and economic concern, negatively impacting water and air quality. While considerable research has investigated processes and controls of N losses in this region, significant knowledge gaps still exist, particularly related to the temporal and spatial variability of crop N uptake and environmental losses at the field-scale. The objectives of this study were (i) to describe the unique application of environmental monitoring and remote sensing technologies to quantify and evaluate relationships between artificial subsurface drainage nitrate (NO3-N) losses, soil nitrous oxide (N2O) emissions, soil N concentrations, corn (Zea mays L.) yield, and remote sensing vegetation indices, and (ii) to discuss the benefits and limitations of using recent developments in technology to monitor cropping system N dynamics at field-scale. Preliminary results showed important insights regarding temporal (when N losses primarily occurred) and spatial (measurement footprint) considerations when trying to link N2O and NO3-N leaching losses within a single study to assess relationship between crop productivity and environmental N losses. Remote sensing vegetation indices were significantly correlated with N2O emissions, indicating that new technologies (e.g., unmanned aerial vehicle platform) could represent an integrative tool for linking sustainability outcomes with improved agronomic efficiencies, with lower vegetation index values associated with poor crop performance and higher N2O emissions. However, the potential for unmanned aerial vehicle to evaluate water quality appears much more limited because NO3-N losses happened prior to early-season crop growth and image collection. Building on this work, we encourage future research to test the usefulness of remote sensing technologies for monitoring environmental quality, with the goal of providing timely and accurate information to enhance the efficiency and sustainability of food production.
Introduction
The installation of artificial subsurface drainage (tile drainage) played an important role in the development of the U.S. Midwestern Corn Belt, with the drainage improved in this way on more than 17 million ha across the region today (USDA-NASS, 2012). This region is one of the most productive agricultural areas in the world. In 2017, the states of Illinois, Indiana, Iowa, Michigan, Minnesota, Missouri, Ohio, and Wisconsin produced ~232 million metric tons of corn (Zea mays L.) on 19.4 million ha of land (USDA-NASS, 2018), accounting for ~35% of the world's total corn production (USDA-ERS, 2018). As global demand for food, fiber, and energy is expected to continue increasing throughout the second half of the twenty first century (Godfray, 2014), agricultural producers are facing the dual challenge of further increasing crop production while conserving natural resources and enhancing environmental sustainability. Nitrogen (N) fertilizer inputs, in particular, are essential to maximize production and sustain soil quality in high-yielding cropping systems (Mueller et al., 2012; EU Nitrogen Expert Panel, 2015). However, applied N fertilizer is susceptible to environmental losses, with approximately only half of N inputs recovered by harvested crop products globally (Lassaletta et al., 2014; Zhang et al., 2015).
In the U.S. Midwest, N losses from croplands represent a major environmental and economic concern, negatively impacting water and air quality. The naturally N-rich soils in this region are extremely well-suited for highly productive cropping systems, but these soils also require artificial tile drainage to meet productivity potential. The combination of cropping systems composed of annual row crops, some of which are N-intensive, naturally N-rich soils, and tile drainage is a key driver of elevated nitrate (NO3-N) concentrations in the upper Mississippi River Basin (David et al., 2010). High N loads from this region contribute significantly to the seasonal hypoxic zone (oxygen-depleted area) in the Northern Gulf of Mexico each year (USEPA, 2007). Meanwhile, soil nitrous oxide (N2O) emissions are a potent greenhouse gas (GHG) contributing to stratospheric ozone depletion (Ravishankara et al., 2009). In 2016, soil management activities (including N fertilizer application) accounted for 77% of the total anthropogenic N2O sources in the U.S., with the agriculture sector contributing around 9% of total GHG emissions overall (USEPA, 2018). A recent economic analysis estimated N losses (air/deposition, surface freshwater, groundwater, and coastal zones) related to agricultural N use in the U.S. have corresponding environmental damage costs of $157 billion year−1 (Sobota et al., 2015).
Management of N fertilizer to meet both production and environmental goals is challenging, in part because cropping system N dynamics are based on complex relationships that are difficult to monitor and cannot be easily predicted. Ammonium (NH4-N) and NO3-N are the main forms of inorganic soil N, with NH4-N being rapidly converted to NO3-N through the process of nitrification in warm, well-aerated soil (Norton, 2008). However, NO3-N is susceptible to losses through leaching (the downward movement of dissolved nutrients through the soil profile with flowing water) (Mulla and Strock, 2008) and denitrification (the biological reduction of NO3-N into N2O gas under anaerobic conditions and microbial respiratory metabolism) (Coyne, 2008). Due to interactions among weather, soil properties, crop growth, and soil N transformations, the fate of applied N fertilizer is highly variable and there are unanswered questions about how much N not recovered by the crop is susceptible to N leaching and gaseous losses (Scharf, 2015). Adding to this complexity is that relationships between soil N availability, crop N uptake, and environmental losses vary across temporal and spatial scales. While considerable research has investigated processes and controls of N losses in this region, individual studies are often focused on only one or two components of the system, leading to an incomplete understanding. Thus, significant knowledge gaps still exist, particularly related to how the spatial and temporal variability of soil-plant-water relationships collectively drive environmental N losses at the field-scale.
The ability to simultaneously measure crop N dynamics and environmental loss pathways using recent developments in monitoring technologies could be an important step in improving crop production efficiencies to maximize grain yields while reducing N losses. For instance, it is well-documented in separate studies that increased N inputs correspond to greater N2O and tile drainage N losses in corn-based systems, especially when the N rate exceeds plant N demand (Decock, 2014; Christianson and Harmel, 2015a). Therefore, one would expect that conditions leading to high N leaching losses would also result in high N2O losses. However, a recent meta-analysis evaluating the effects of N fertilizer management practices on corn yields and N losses highlighted the lack of paired N2O emission and drainage N leaching data collected from the same fields in the same cropping year (Eagle et al., 2017b). With only one study out of 27 in the U.S. and Canada measuring both N2O and N leaching losses, these authors concluded the lack of information is impeding our understanding of N cycling tradeoffs and synergies (Eagle et al., 2017b). Similarly, understanding potential tradeoffs between crop productivity and environmental N losses is a key issue in reducing the N footprint of agriculture (Zhang et al., 2015). Nevertheless, few studies have evaluated whether increased crop yields and N uptake within a field correspond with lower N2O emissions and N leaching losses, likely because individual studies are often focused on only limited parameters due to disciplinarily of researches often combined with funding limitations.
Investigating the potential usefulness of enhanced monitoring technologies requires field-scale research approaches to identify benefits and limitations for specific crop production contexts. In addition to spatial variability of N cycling processes within a field, there is also variation between different measurement methods. Nitrous oxide emissions are often measured following the static closed-chamber method in small areas (~0.7 × 0.4 m) (Parkin and Venterea, 2010). This observational footprint is significantly smaller than many drainage studies where the nature of drainage hydrology integrates N leaching losses over several ha (Christianson et al., 2016). Crop response to N fertilizer has also been shown to be highly variable within-field due to differences in soil properties (Scharf et al., 2005; Schmidt et al., 2011). At broader spatial scales, remote sensing technologies [e.g., satellite imagery, unmanned aerial vehicles (UAV)] have increasingly been used for crop monitoring and yield forecasting in the recent decades (Rembold et al., 2013). These new technologies allow improved data collection capability over large areas with finer temporal and spatial resolution, and these technologies are becoming more readily available at the farm-level to aid monitoring, awareness, and decision-making (Atzberger, 2013; Bell and Tzimiropoulos, 2018). However, we are unaware of efforts to combine recently available technologies with the goal of shedding new insights into how fundamental N cycling processes are correlated at the field-scale, while also exploring the limitations of such approaches.
The objective of this investigation was to describe the unique application of environmental monitoring and remote sensing technologies to quantify cropping system N dynamics (i.e., artificial subsurface drainage N losses, soil N2O emissions, soil N concentrations, corn yield, and remote sensing vegetation indices) at a new research site established in central Illinois, U.S. The purpose of this manuscript was to interpret preliminary results from 2017 (corresponding to the baseline year of a long-term field experiment) to illustrate how this research approach can help inform the development of high-yielding crop production systems with a low environmental footprint.
Materials and Methods
Site Description and Experimental Design
Sixteen individually subsurface drained plots (hydrologically isolated using border tiles) were established in fall 2016 at the University of Illinois Dudley Smith Farm in Christian County, IL, U.S. (39° 27' N, 89° 6' W). Each plot was approximately 0.85 ha, containing three tile laterals at 18 m spacing (Figure 1). The drainage system was design using a drainage design coefficient of 9.5 mm day−1 (i.e., the rate at which water is to be removed from the field). The soils were generally silty clay loam and silt loam series, classified as somewhat poorly drained (Herrick, Oconee, and Oconee-Darmstadt-Coulterville series), poorly drained (Virden series), and moderately well-drained (Harrison series) (Web Soil Survey, 2018). The region has a hot humid continental climate (Köppen Climate Classification System: Dfa), with long term annual rainfall of 1,043 mm and annual mean temperature of 11.6°C (30-year average). Daily temperature and precipitation were recorded using an on-site weather station (HOBO RX3000, Onset Computer Corporation, Bourne, MA, U.S.) (Figure 2).
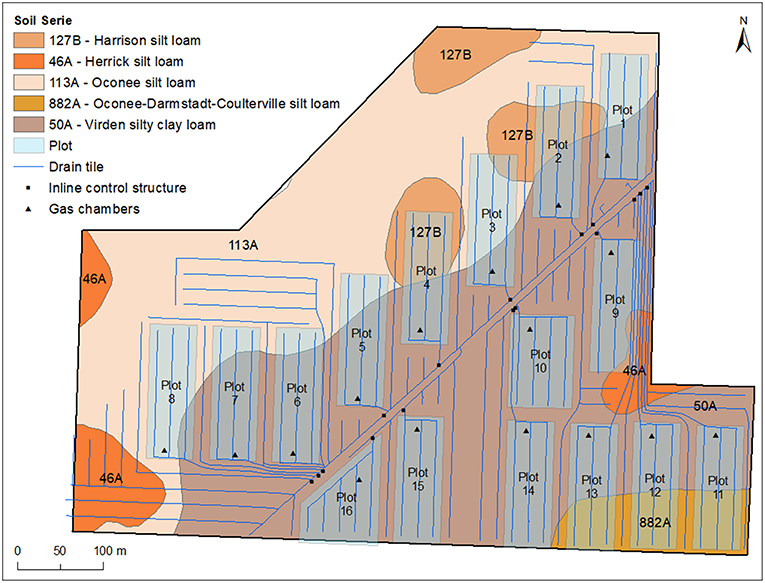
Figure 1. Experiment and drainage design layout at the University of Illinois Dudley Smith Farm, Illinois, U.S.
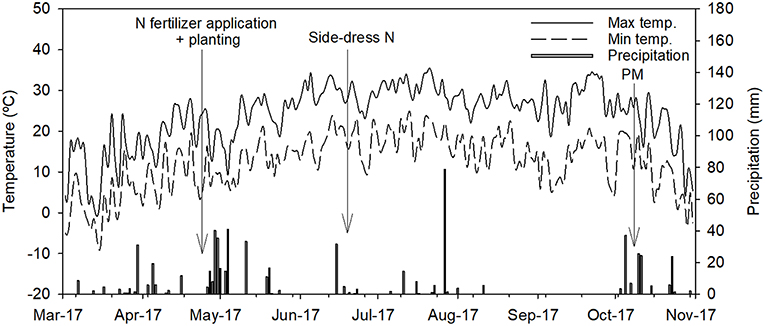
Figure 2. Daily maximum and minimum air temperatures and precipitation during the corn growing season in 2017 at Dudley Smith Farm, Illinois, U.S. (N, nitrogen; PM, physiological maturity).
Drainage Water Monitoring
Each plot drained to an inline control structure (AgridrainTM, Adair, IA, U.S.). Beginning in late spring 2017 (April/May), flow was continuously monitored using a water level data logger (HOBO U20L-04, Onset Corporation, Bourne, MA, U.S.; water depth recorded every 15 min) at six of the 16 plots (plots 3, 7, 9, 10, 13, and 15). These initial six plots were selected from across the site to trial potential monitoring equipment during this baseline year; all plots were eventually instrumented during the treatment period (data not presented here). Drainage flow rates were calculated using a calibrated v-notch weir equation or a compound weir equation at greater flow depths (AgriDrainTM, personal communication; Chun and Cooke, 2008). Drainage water samples (~100 mL) were collected weekly from all 16 plots, filtered within 24 h (0.45 μm, S-Pak® Membrane Filters, Millipore Sigma, Darmstadt, Germany), and stored frozen until analysis for NO3-N (within 20 days; method 10-107-106-1-J, Lachat QuickChem 8500 series, Loveland, CO, U.S.). Nitrate-N loads for this period were estimated by multiplying NO3-N concentrations by discharge volumes for each sampling event and summing across the growing season. Yield-scaled NO3-N leaching losses (YSNO3, in kg NO3-N per Mg of grain) were estimated by dividing NO3-N loads by grain yield for each plot.
Soil N2O Emission and Inorganic N Measurements
Measurements of N2O were performed following the closed-static chamber method according to USDA-ARS GraceNET Project Protocols (see details in Parkin and Venterea, 2010). The chamber consisted of two parts: a chamber base (67.3 cm length × 40.6 cm width × 14 cm height) and a vented closed chamber lid (same dimensions as base) that was covered with reflective double bubble foil insulation (Ecofoil, Urbana, IA, U.S.) to minimize temperature changes during gas sampling. The lids also contained a layer of weather stripping (Lundell Manufacturing Corporation, Minneapolis, MN, U.S.) lining the connection between lids and base to create an air-tight seal during gas sampling and prevent ambient mixing. The chamber bases were inserted 5 cm into the soil on May 15, ~4.5 m beside the center tile lateral to obtain representative drainage conditions. This location was the midpoint between the plot area furthest from the lateral (9 m) and directly over the lateral. Chamber bases were left in place during the entire growing season (Figure 1).
Gas samples were collected weekly from side-dress N application until August, and twice a month thereafter. On each sampling date, the chamber lid was placed on top of the chamber base and secured in place with clamps. Each chamber lid had an airtight septum at the top through which samples were withdrawn. Individual gas samples of 20 mL were taken at 0, 16, 32, and 48 min following chamber deployment using a 20 mL syringe. After withdrawing a sample, 5 mL of gas was ejected, and 15 mL was immediately transferred into a 10 mL previously evacuated glass vial sealed with butyl rubber stoppers (Voigt Global Distribution Inc., Lawrence, KS, U.S.). Rubber stoppers were covered with clear RTV silicone adhesive sealant (Dow Corning, Midland, MI, U.S.) to prevent leakage. Gas samples were stored in glass vials until analyzed by gas chromatography (Shimadzu GC-2017, Canby, OR, U.S.). Nitrous oxide fluxes were calculated from the linear increase in gas concentration in the chamber headspace vs. time, as described by Parkin and Venterea (2010). Cumulative area-scaled N2O emissions (cN2O) were estimated using trapezoidal integration of flux vs. time, as described by Venterea et al. (2011). Yield-scaled N2O emissions (YSNE, in kg N2O per Mg of grain) were estimated for each plot by dividing cN2O by the respective grain yield (van Groenigen et al., 2010).
Soil samples for NO3-N and NH4-N determination were taken following procedures described by Graham et al. (2018). Briefly, composite samples were obtained from five equally spaced soil cores across the inter-row area along a transect running perpendicular to the crop row. Samples were collected to 20 cm depth near gas chambers in each plot using a 2 cm diameter probe. Soil inorganic N was extracted within 24 h using 2M KCl and NO3-N and NH4-N concentrations were determined using a Smartchem 170 discrete wet chemistry auto-analyzer (Unity Scientific, Milford, MD, U.S.).
Corn Management and Aerial Imagery Collection
Corn was grown with uniform management across all 16 plots in 2017. Following pre-plant tillage to prepare the seed bed (S-tine field cultivator 2210 John Deere, Moline, IL, U.S.), corn was planted on April 26 2017 at 80,000 seeds ha−1 and 76 cm row spacing. Nitrogen fertilizer management consisted of a pre-plant application (April 25 2017; 168 kg N ha−1) and a side-dress application (June 14 2017; 135 kg N ha−1), both as liquid urea ammonium nitrate (UAN) (28-0-0, N-P2O5-K2O) using a coulter applicator (BLU-JET AT6020, Thurston Manufacturing Company, NE, U.S.) that injected the liquid fertilizer between crop rows at a depth of 3.5 cm below the soil surface.
Aerial imagery was collected using a UAV (3DR® Drone Site Scan, Berkeley, CA, U.S.) equipped with a multi-spectral sensor (Parrot Sequoia®, Paris, France) on June 14 2017 and July 12 2017 (corn approximately at growth stages V6 and R1, respectively). The images were taken at an altitude of 100 m, with spatial resolution of 10 cm. The Normalized Difference Vegetation Index (NDVI) and Normalized Difference Red Edge Index (NDRE) were calculated from the reflectance measurements in the Red, Red Edge, and Near Infrared (NIR) portion of the spectrum, according to the following equations (Gitelson, 2011):
A total of 20 locations over the site were randomly selected to collect plant biomass samples after the drone flight on June 14 2017. The sample areas (0.76 m2) were georeferenced using a Global Position System (GPS) (Geo 7X handheld GeoCollectorTM, Trimble®, Wesminster, CO, U.S.). The plants were clipped at ground level, dried at 60°C in a forced-air oven for 7 days, ground to pass through a 2 mm screen (Wiley Mill, Arthur H. Thomas Co., Philadelphia, PA, U.S.), and analyzed for N via combustion on an elemental analyzer (Brookside Labs, New Bremen, OH, U.S.).
After corn physiological maturity (growth stage R6), grain and biomass N concentration was determined following a standard research protocol in this region (Kitchen et al., 2017). A total of six whole plants were taken near the gas chambers within each plot and separated into ear and stover (stems + leaves) fractions. The dried stover was ground to pass through a 2 mm screen using the Wiley Mill. Corn grain was shelled from ears using an Almaco ECS (Nevada, IA, U.S.). Grain moisture and test weight were measured with a grain analyzer (Model GAC 2000, DICKEY-John Corp., Springfield, IL, U.S.). Grain yields were corrected to 155 g kg−1 moisture content. To calculate total aboveground N uptake, N concentration for both grain and stover samples were determined by Brookside Labs as described above.
Corn was harvested on October 17 2017 using a John Deere Combine equipped with a GREENSTARTM Yield Monitor System and Yield Mapping System (John Deere, Moline, IL, U.S.). Grain yield was recorded every 3 s along with GPS location. Grain yield data consisted of 21,647 points (observations) for the entire field (41.5 ha). For each point, N content in grain was estimated using the average N concentration from the hand-harvested samples (1.4%). Nitrogen balance was estimated as an indicator of environmental loss, and was calculated by the difference between N input (fertilizer) and N output (N removed in grain) (McLellan et al., 2018).
Data Processing and Analysis
After each drone flight, aerial images were processed and analyzed using Pix4D Software (Pix 4D S.A., Switzerland). A raster image file with a spatial resolution of 10 cm was created for both NDVI and NDRE of corn at both growth stages. All maps were created using ArcGIS (version 10.5, ESRI®, Redlands, CA, U.S.) Geospatial Analyst tool.
The pixel values from the raster files were extracted and averaged based on the measurement scale at which the different observational data were collected. For instance, the NDVI and NDRE values were extracted and averaged within each plant biomass sampling area (0.76 m2) to make inferences regarding the relationship between remote sensing indices and in-season plant N status and biomass production. Following the same logic both NDVI and NDRE values were extracted and averaged across the sampling area comprising the gas chamber (1.5 m2) in order to evaluate the relationship between N2O emissions and remote sensing indices. Average NDVI and NDRE values were also obtained for each plot (~0.85 ha) to evaluate the relationship between NO3-N loads and remote sensing indices.
Before yield map analysis, grain yield data was filtered to remove the extreme outliers [i.e., values outside of the mean ± 3 standard deviation (Schwalbert et al., 2018)] due to common inherent errors when the combine changed speed and direction (Simbahan et al., 2004). The final data set was normally distributed and comprised 97% of the original data (mean 13.2 Mg ha−1, standard deviation 2.15 Mg ha−1). A grain yield map was created in raster format by spatial interpolation of point measurements using the Inverse Distance Weighted method. A grid-cell size of 12.2 × 12.2 m was selected to reflect the width of the combine's head used for harvesting.
Correlation analyses were conducted using PROC CORR of the SAS® Software (version 9.4, SAS Institute, Cary, NC, U.S.) to evaluate the degree of association among remote sensing vegetation indices, crop, air, and water quality data. Correlations were considered significant at p < 0.1.
Results
Weather Conditions
Compared to the 30 years average for the region, monthly precipitation in 2017 was high early in the growing season (April and May) and low throughout the remainder of the season (except July) (data not shown). Precipitation amounts in April and May were 47.7 and 18.2 mm greater than the 30 years average. Total precipitation in August and September was 9.3 and 2 compared to 71 and 82 mm for the 30 year average, respectively. In addition, a period of high daily precipitation was observed from late April to early May, with daily precipitation totals ranging from 4.5 to 41 mm (Figure 2).
Soil N2O Emissions, Tile Drainage NO3-N Concentrations, and Soil Inorganic N Concentrations
The overall pattern of daily N2O fluxes (dN2O) during the growing season was similar among plots, despite differences in magnitude (Figure 3A). There were clear signals of increased N2O fluxes on May 23, June 19, and July 25. For example, 5 days after UAN side-dress application (June 19), dN2O increased from 4.9 and 4.3 to 72.3 and 81.7 g N2O-N ha−1 day−1 on plots 1 and 2, respectively. Similarly, dN2O were above 90 g N2O-N ha−1 day−1 for both plots 7 and 16 on that date. Spikes in dN2O were also seen later in the growing season (July 25), particularly on plots 1, 2, 8, and 9.
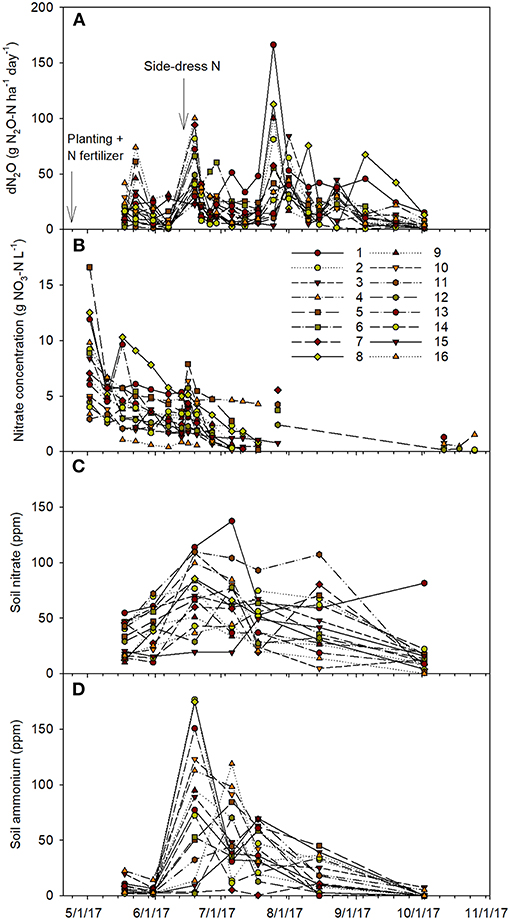
Figure 3. Daily nitrous oxide fluxes (dN2O) (A), tile drainage nitrate concentration (B), soil nitrate (NO3-N) (C), and ammonium (NH4-N) concentration (D) during the 2017 corn growing season.
Whereas, trends in N2O emissions were relatively consistent across plots, tile drainage NO3-N concentrations showed much greater variability (Figure 3B). While there was a similar decreasing seasonal trend in NO3-N concentrations over the growing season, the coefficient of variation (CV) of daily NO3-N concentration was above 40%, despite the similar soil types, weather patterns, and consistent drainage design for this experimental site. For instance, on the first sampling date (May 2), NO3-N concentration ranged from 2.9 (plot 11) to 16.6 mg NO3-N L−1 (plot 5), highlighting the within-field temporal and spatial variation. Elevated NO3-N concentration also were observed during the last 2 weeks of May (May 17–30) on plots 8 and 13. Tile drainage flow stopped from July 27 to October 11, due to zero precipitation during this period (Figure 2), resulting in no samples being collected.
The temporal behavior of soil NO3-N and NH4-N concentrations were somewhat different from each other. Throughout the growing season, temporal variability was lower in soil NO3-N (CV ranged from 42 to 60%) compared to NH4-N concentration (CV ranged from 52 to 94%) (Figures 3C,D). Before UAN side-dress, soil NO3-N concentration was greater (<70 ppm) in all plots compared to NH4-N (<20 ppm). Yet, NH4-N concentration rapidly increased in most of the plots after the second N fertilization event, with several spikes (>20 ppm increase) in NO3-N concentration also being observed. For instance, NH4-N concentration increased from approximately 5 to more than 150 ppm on plots 2, 8, and 13. In addition, NH4-N concentration was above 50 ppm in all plots (except 7, 12, 15, and 16). Except for plot 1, soil NO3-N and NH4-N concentrations were lower toward the end of the growing season.
In-season Corn NDVI and NDRE
In general, higher spatial variability of both NDVI and NDRE were seen at V6 compared to when corn was at growth stage R1 (Figure 4). Across the entire field, the CV of NDVI and NDRE were 29 and 23% at V6 compared to 8 and 11% at R1, respectively. When averaged within plots, the CV ranged from 10 (plot 13) to 28% (plot 12) for NDVI at V6 compared to the range of 1 (plot 9) to 7% (plot 4) at R1. Similarly, higher CV was found on NDRE at V6 (ranging from 13 to 22%) than at R1 (ranging from 4 to 8%).
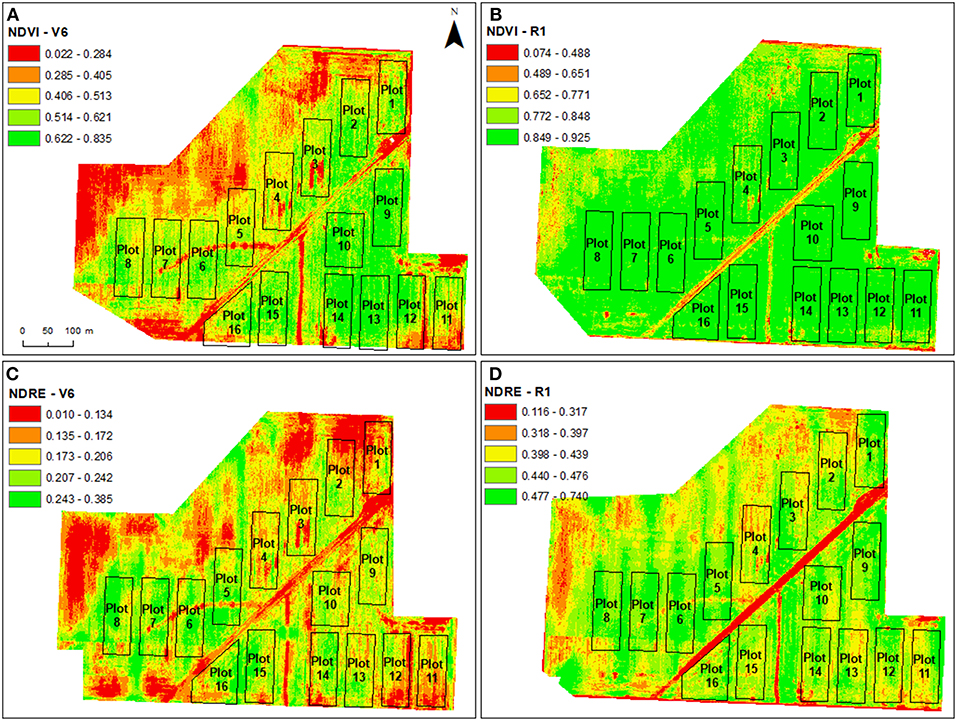
Figure 4. Normalized Difference Vegetation Index (NDVI) (A,B) and Normalized Difference Red Edge (NDRE) (C,D) of corn at growth stage V6 and R1 during the 2017 corn growing season.
The linear regression models relating plant biomass and N content with both NDVI and NDRE showed a highly significant relationship (p < 0.001) (Figure 5). At growth stage V6, the variation in plant biomass was more strongly correlated with NDVI (R2 = 0.67) compared to NDRE (R2 = 0.40). Similar trends were seen when plant N content was plotted against NDVI and NDRE, with NDVI accounting for a larger proportion of variation in plant N content.
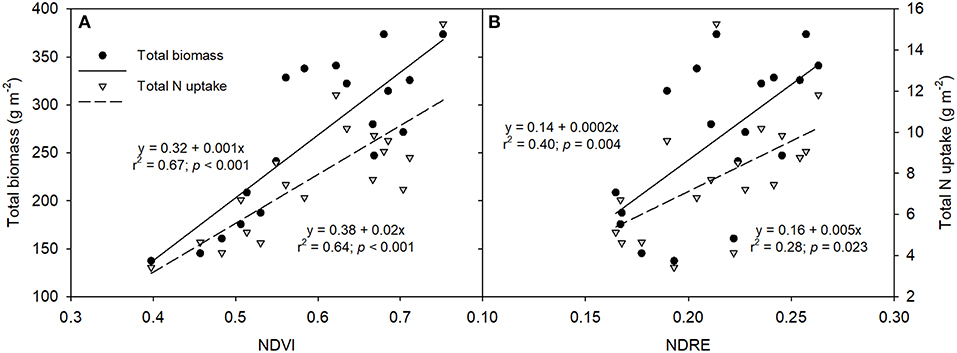
Figure 5. Relationships of plant biomass (A) and nitrogen (N) uptake (B) with both Normalized Difference Vegetation Index (NDVI) and Normalized Difference Red Edge (NDRE) at growth stage V6.
Corn Yield and N Balance
Corn grain yield was found to be highly variable both within-field and within-plots (Figure 6A). Across the entire field, mean grain yield was 13.2 Mg ha−1 and the CV was 16%. When averaged within-plots, grain yield ranged from 12.8 (plot 4) to 15 Mg ha−1 (plot 8), and the CV ranged from 5 (plot 7) to 17% (plot 14).
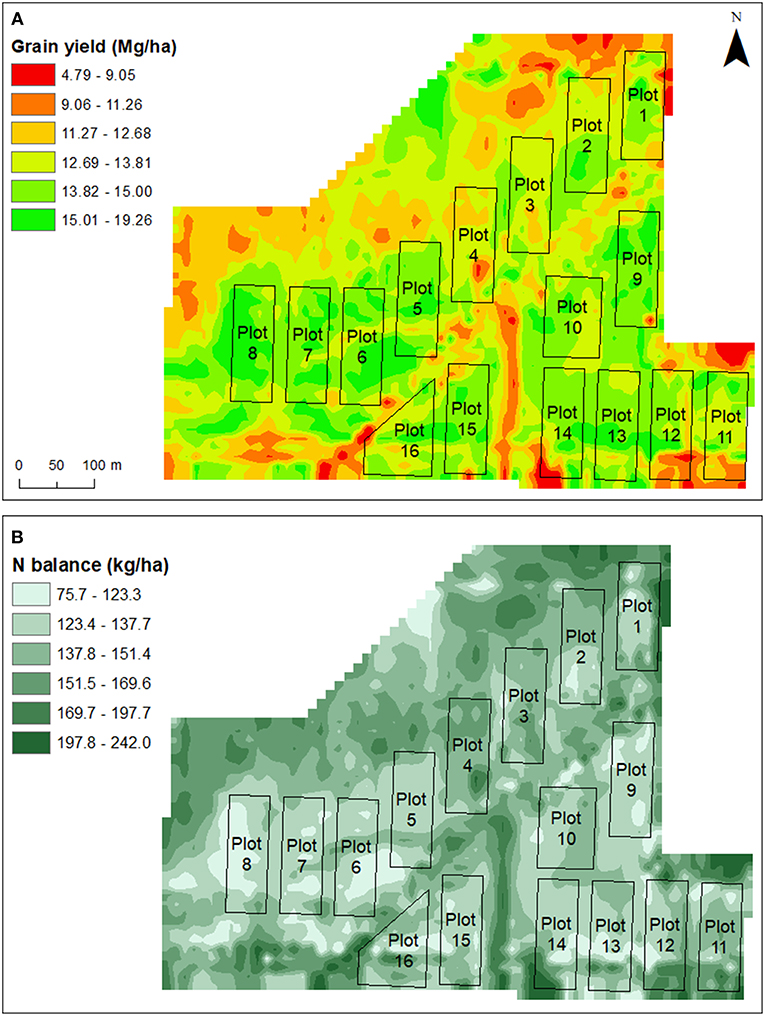
Figure 6. Corn grain yield (A) and nitrogen (N) balance (B) at the end of the 2017 growing season.
As the end-of-season N balance was estimated from grain yield and grain N concentration, the spatial variability of N balance followed a similar but inverse trend to yield. That is, areas in the field with low and high values of N balance corresponded to areas with high and low grain yields, respectively (Figure 6B). The average N balance across the whole field was 145 kg ha−1 with a CV 14%. Despite high grain yields in portions of the field, there were no negative values for N balance, which ranged from 75 to 242 kg ha−1.
Relationship Between Remote Sensing Vegetation Indices, Crop, Air, and Water Quality Data
Overall, few significant relationships were observed between vegetation indices and crop, air, and water quality data. However, NDVI at growth stage V6 was negatively correlated with N2O losses (p < 0.1) (Table 1). Also, the correlation coefficient (R) between NDVI and N2O losses increased as the season progressed (R = −0.44, −0.56, and −0.66 for cN2O at growth stage V6, R1, and seasonal cN2O, respectively). Early- and mid-season remote sensing vegetation indices were significantly correlated with corn grain yield and end-of-season N balance. Corn grain yield and N balance was positively and negatively correlated with both NDVI and NDRE at both growth stage V6 and R1.
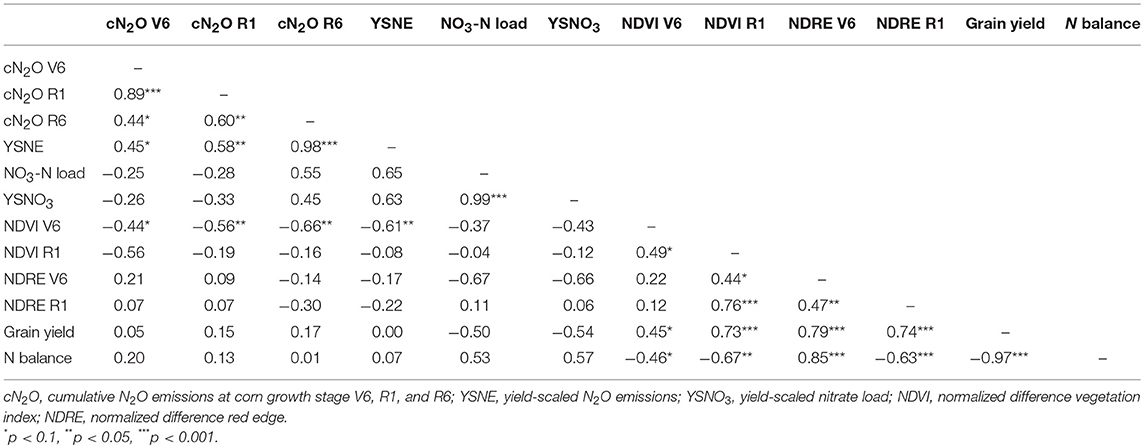
Table 1. Pearson's correlation coefficient of correlations analysis between remote sensing vegetation indices, crop, air, and water quality data.
Discussion
The lack of studies evaluating multiple pathways of N loss limits our overall understanding of, and ability to optimize, N management to achieve both crop production and environmental goals, particularly in highly productive tile-drained landscapes. In this study, we used recent developments in technologies to evaluate the variability and potential correlations between N cycling processes within 16 separate experimental units in a field. As noted above, 2017 corresponds to the baseline year of a long-term field experiment and no treatments were imposed. We also acknowledge that definitive relationships cannot be determined based on 1 year of data, and thus, preliminary results are interpreted with the goal of highlighting the type of knowledge gained using this unique approach and the benefits and limitations for developing strategies to mitigate N losses and enhance crop production sustainability.
Relationship Between Crop Productivity and N Losses
One common theory for minimizing the risk of N losses is to increase crop productivity per unit of applied N (Snyder et al., 2009; van Groenigen et al., 2010; McLellan et al., 2018). Yet, surprisingly few studies have evaluated within-field relationships between crop yield and both N2O emissions and N leaching losses, perhaps because these parameters are not often collected or reported for the same experiment (Omonode et al., 2017). In this study, growing season N2O emissions and NO3-N loads were not significantly correlated with grain yield (Table 1). While this finding is not consistent with the theory that higher yields correspond with lower environmental N losses, it nonetheless illustrates the benefits of this experimental approach for simultaneously evaluating of agronomic and environmental performance in this region.
The need to identify potential tradeoffs between crop productivity and N losses is also important from a policy perspective. There is increasing emphasis on improving N use efficiency by reducing N balance, which is proposed as a robust index of potential N losses because it is a measure of anthropogenic N supply that exceeds crop N demand (McLellan et al., 2018). As the majority of crop N uptake is concentrated in grain at the end of the season, large N balances are generally associated with high N rates and/or low yields. In this study, relatively large N balances resulted from an N rate well above regional recommendations, suggesting that a greater portion of applied N fertilizer was susceptible to losses. However, similar to yield, correlations between N balance and N2O and NO3-N leaching losses were not significant (Table 1). This finding differs from McLellan et al. (2018) who found a significant relationship between N balance and yield-scaled N losses using data from published studies and modeling efforts in the U.S. Corn Belt. In another meta-analysis assessing N2O emissions in North America's corn production systems, Omonode et al. (2017) found a strong and positive relationship between N2O losses and N balance, suggesting that management systems achieving low N balance (<60 kg N ha−1) would possibly increase N use efficiency and decrease cN2O. Generating additional empirical evidence through field-scale experiments under commercial production conditions should help scientists further evaluate and strengthen these relationships, especially if N balance is to be used in developing policies or incentive programs.
Relationship Between N2O Emissions and NO3-N Leaching Losses
Evaluating patterns in N losses throughout the season may help elucidate potential relationships between N2O emissions and NO3-N leaching losses. In theory, N2O and NO3-N leaching losses should be related via soil N pools (Denk et al., 2017). Nitrogen fertilization is a major factor controlling N2O production in agricultural soils because of its direct impact on soil mineral N availability (NH4-N + NO3-N) (Snyder et al., 2009), and N2O emissions have been found to increase both linearly and non-linearly with N fertilizer rate (Kim et al., 2013; Decock, 2014; Shcherbak et al., 2014). In 2017, notable spikes in soil N2O emissions occurred on several dates, with dN2O increasing from 8 to 50 g N2O-N ha−1 day−1 right after UAN side-dress application (Figure 3A). However, spikes did not always correspond with N application events, fluxes were also correlated with soil moisture (R = 0.55, p < 0.001, n = 80) and to a lesser extent soil temperature (R = 0.25, p = 0.028, n = 80). Following a similar logic as N2O emissions, due to the high mobility of NO3-N in the soil, tile drainage NO3-N concentration is expected to increase after N fertilizer application, particularly if the N fertilizer source contains N in the form of NO3-N and in years with high precipitation. However, in our study, only three plots showed an increase in tile drainage NO3-N concentrations following the second N application event, whereas NO3-N concentration remained relatively constant on the remaining plots (Figure 3B).
Soil N transformations following fertilizer N application events could help explain trends in N2O and NO3-N leaching losses. While there was a clear signal of increased soil NH4-N after N side-dress application, this did not occur for NO3-N concentrations (Figures 3C,D). In agricultural soils, NH4-N concentration is generally low because it is rapidly converted to NO3-N through the process of nitrification (Norton, 2008), as evidenced by the lower concentrations of NH4-N compared to NO3-N before UAN application events. Soil NO3-N concentrations may not have increased because crop N uptake started to occur during the period of nitrification, which also corresponded with relatively few plots having increased NO3-N concentrations in drainage following the second N application event. Several studies have emphasized the importance to synchronize soil N supply with crop N demand to improve N use efficiency and reduce N losses in croplands (Robertson and Vitousek, 2009; Snyder and Fixen, 2012). Often this corresponds to a split-application of N fertilizer: generally at planting (to ensure initial N supply) and right before the period of rapid crop growth and N uptake, which in corn is roughly between growth stages V8 and R1 (Sawyer et al., 2006). In the long-term, the unique approach in this experiment for monitoring N fluxes at the field-scale will provide a better understanding of how specific management practices (e.g., timing of N fertilizer application) may influence soil N availability, and in turn, the potential for either enhanced N2O emissions or NO3-N leaching losses depending on weather variability and crop growth patterns, among other factors.
Relationships between N loss pathways can also be compared across the growing season. Preliminary data from 2017 indicate that both daily (R = 0.08, p = 0.327, n = 133) and seasonal (R = 0.55, p = 0.259, n = 6) N2O and NO3-N leaching losses were not significantly correlated. While these results are only based on 1 year, they provide some important insights regarding temporal and spatial considerations when trying to link N2O and NO3-N leaching losses within a single study. First, there was an important temporal disconnect when N2O vs. NO3-N losses primarily occurred. On average, ~96 and 86% of the seasonal NO3-N leaching and N2O losses occurred between April and May, and between May and August, respectively. This is consistent with other subsurface drainage work showing that the largest drainage volumes occur in the March-May timeframe (e.g., Jin and Sands, 2003), which is often a period of high precipitation coupled with N fertilizer application in corn-based cropping systems. Our results are also relatively consistent with the period of highest N2O emissions in the Midwest, with approximately 50–80% of the seasonal cN2O occurring within 30–40 days following N application early in the growing season (Omonode et al., 2017), when plant N uptake is relatively low and excess N becomes available for nitrification and denitrification. In our study, ~42% of the seasonal cN2O occurred within 40 days after UAN side-dress on June 14.
In this sense, the lack of a relationship between N2O and NO3-N leaching losses is not surprising due to the temporal difference of when these losses were occurring and the soil and climate conditions influencing those losses. However, in other years where warm, wet springs are followed by cool, dry summers, it would not be surprising if this resulted in high NO3-N losses but low N2O emissions. It is also important to highlight that the seasonal N losses measured here correspond to the corn growing season (April–October), and therefore do not reflect annual losses. To account for these limitations mentioned above, both N2O and NO3-N leaching losses will be monitored throughout the year in all 16 experimental units, which will also lead to better estimations of total N losses. Drainage events and N2O fluxes during the winter by freeze/thaw cycles have been shown in separate studies to contribute significantly to the total N losses in certain locations and years (Christianson and Harmel, 2015b; Wagner-Riddle et al., 2017).
Beyond the temporal disconnect discussed above, there is an important spatial disconnect (i.e., measurement footprint) that may pose challenges in trying to develop quantitative relationships between N2O and NO3-N leaching losses. The different scale of measurements between N2O and NO3-N, and the within-plot variability that is likely observed for N2O emissions in large-scale research, complicates any assessment of the relationship between these two variables. It has long been recognized that there is large spatial variability in soil N2O emissions. Recent studies have shown that hotspots of N2O emissions within field can account for as much as 30% of the cumulative emissions (Turner et al., 2016). While new measurement techniques are available to analyze emissions in large plots [e.g., see methods in Hensen et al. (2013)], they are considerably more expensive and may not support replicated treatment comparisons. Hence, new approaches may be needed to strengthen our ability to capture the spatial variability in soil N2O emissions, specifically for plot sizes typical for assessing tile drainage nutrients concentrations. Recently there have been calls for not only additional field studies where multiple types of N loss pathways are simultaneously evaluated, but also for better data reporting to enhance future agro-ecosystem data syntheses and meta-analyses (Eagle et al., 2017a). A great deal of research activity is being directed toward addressing this knowledge gap, thus we encourage others to consider these temporal and spatial methodology points when evaluating both N2O and NO3-N leaching losses in the same study.
Remote Sensing Technologies for Monitoring Both Crop and Environmental Performance
Despite the rapid growth of UAVs in agriculture, little work has explored the potential for new technologies to directly link sustainability outcomes with improved agronomic efficiencies. The value in the present research is not only being able to assess these relationships after harvest, but also earlier in the growing season when adaptive N management decisions could still be made. To date, we are unaware of any effort to assess the degree to which in-season measurements of crop performance or N use efficiency may correspond with environmental N losses.
Our results from one growing season show that UAV images collected at corn growth stage V6 may be an indicator of N2O losses, but not for NO3-N leaching losses (Table 1). Vegetation indices such as NDVI have been extensively used to make inferences of in-season plant N status and biomass production, and generally, greater leaf area and greener plant biomass result in higher NDVI values (Rembold et al., 2013) (Figure 5). In theory, areas in the field with low early-season NDVI values correspond to areas with poor crop establishment and consequently low N uptake, and with more N accumulating in soil, it becomes susceptible for losses through denitrification. This rationale could help explain the strong and negative relationship between early-season NDVI and N2O losses found in this study. In addition, the correlation coefficient between early-season NDVI and N2O losses increased as the season progressed (R = −0.44, −0.56, and −0.66 for cN2O at growth stage V6, R1, and seasonal cN2O, respectively). On average, ~27 and 44% of the total N2O losses had already occurred at growth stage V6 and R1, respectively. These results indicate that UAV platforms could represent an integrative tool for linking crop performance and air quality outcomes, but further research is necessary. Agricultural monitoring systems that provide timely and accurate information are of great interest to agricultural producers, allowing them to make in-season management decisions to enhance the efficiency of production. If relationships between N2O emissions and NDVI were consistent under a wide range of conditions, such an approach could have the co-benefit of enhancing the sustainability of food production.
The correlation between remote sensing vegetation indices and NO3-N leaching losses was not significant at any time throughout the growing season (Table 1). In fact, due to the temporal disconnect discussed above (i.e., 73% of the seasonal NO3-N leaching losses occurred before crop emergence), this correlation was not expected to be significant. However, there might be cases where this relationship is observable, particularly if excess rainfall affects crop growth and losses during the period of crop growth contributing significantly to seasonal NO3-N loads. In theory, it is possible that in years with significant flooding events, crop emergence/establishment would be poor (which is associated with NDVI/NDRE) and NO3-N leaching losses would he high. Following similar logic as N2O emissions discussed above, being able to link agronomic and environmental performance early in the growing season would provide enhanced and timely information for monitoring, measurement, and management to achieve both production and environmental goals. Nonetheless, because the majority of NO3-N leaching on an annual basis occurs before UAVs are used to map early season crop N status, there are likely inherent limitations in using remote sensing technologies as an indicator of water quality outcomes.
Conclusion
Reducing the N footprint of high-yielding cropping systems in the U.S. Midwest has become of great interest to agricultural producers, policy-makers, and society. Understanding potential tradeoffs between crop productivity and environmental pollution is key to advancing the sustainability of N fertilizer use in this region. In this study, preliminary results from 2017 were used to (i) assess correlations between crop N dynamics and environmental losses and to (ii) discuss the benefits and limitations of using recent developments in technologies to monitor cropping systems N dynamics at the field-scale. There is a common consensus in the literature that enhancing crop yields and N use efficiency will result in lower environmental N losses. While growing season N2O emissions and NO3-N loads were not correlated with grain yield in this study, results illustrate how an integrated field-scale research approach can help further evaluate and strengthen current theories relating crop N dynamics to environmental losses. Despite the assumption that N2O and NO3-N leaching losses should be correlated with each other, our results showed that both daily and seasonal N2O emissions and NO3-N were not significant correlated, mainly due to a temporal disconnect when N2O vs. NO3-N losses primarily occurred. Hence, this is an important aspect that needs to be considered when trying to link N2O and NO3-N leaching losses in future research. With recent developments in UAV systems, remotely-sensed data at high temporal and spatial resolutions have become more affordable at the farm-level. While the results shown here are only based on 1 year, there are indications that remote sensing technologies could help early detection of poor cropping system performance, with lower NDVI values associated with higher N2O emissions. However, the potential for UAVs to evaluate water quality appears much more limited because NO3-N losses happened prior to early-season crop growth and image collection. Building on this work, we encourage future research to test the usefulness of remote sensing technologies for monitoring environmental quality, with the goal of providing timely and accurate information to enhance the efficiency and sustainability of food production.
Author Contributions
CP, RB, and LC obtained the funding and designed the experiment. GPF and CP conceptualized the manuscript with ideas of relationships to be explored based on the journal research topic. GPF collected the data, conducted the statistical analysis, and wrote the first draft of the manuscript. RB helped with the geostatistical analysis. CP, RB, and LC helped guide the discussion as well as editing various drafts.
Funding
This material is based upon work supported by the Dudley Smith Initiative in the College of Agricultural, Consumer, and Environmental Sciences at the University of Illinois at Urbana-Champaign, the Illinois Nutrient Research and Education Council (NREC 27-16 UI), the Foundation for Food and Agriculture Research, the International Plant Nutrition Institute, and the National Institute of Food and Agriculture, U.S. Department of Agriculture, Hatch project (No. ILLU-802-949).
Conflict of Interest Statement
The authors declare that the research was conducted in the absence of any commercial or financial relationships that could be construed as a potential conflict of interest.
Acknowledgments
The authors would like to express appreciation to Kristin Greer, Cheri Esgar, Camila Martins, Juan Burjel, Daniel Hiatt, Hannah Dougherty, and Jonathan Mrozek for assisting with field data collection and laboratory analysis.
References
Atzberger, C. (2013). Advances in remote sensing of agriculture: context description, existing operational monitoring systems and major information needs. Remote Sens. 5, 949–981. doi: 10.3390/rs5020949
Bell, M. J., and Tzimiropoulos, G. (2018). Novel monitoring systems to obtain dairy cattle phenotypes associated with sustainable production. Front. Sustain. Food Syst. 2:31. doi: 10.3389/fsufs.2018.00031
Christianson, L. E., and Harmel, R. D. (2015a). 4R water quality impacts: an assessment and synthesis of forty years of drainage nitrogen losses. J. Environ. Qual. 44, 1852–1860. doi: 10.2134/jeq2015.03.0170
Christianson, L. E., and Harmel, R. D. (2015b). The MANAGE drain load database: review and compilation of more than fifty years of North American drainage nutrient studies. Agric. Water Manag. 159, 277–289. doi: 10.1016/j.agwat.2015.06.021
Christianson, L. E., Harmel, R. D., Smith, D., Williams, M. R., and King, K. (2016). Assessment and synthesis of 50 years of published drainage phosphorus losses. J. Environ. Qual. 45, 1467–1477. doi: 10.2134/jeq2015.12.0593
Chun, J. A., and Cooke, R. A. (2008). Calibrating agridrain water level control structures using generalized weir and orifice equations. Appl. Eng. Agric. 24, 595–602. doi: 10.13031/2013.25274
Coyne, M. S. (2008). “Biological denitrification,” in Nitrogen in Agricultural Systems, eds J. S. Schepers and W. R. Raun (Madison, WI: ASA, CSSA, SSSA), 201–253.
David, M. B., Drinkwater, L. E., and McIsaac, G. F. (2010). Sources of nitrate yields in the Mississippi river basin. J. Environ. Qual. 39, 1657–1667. doi: 10.2134/jeq2010.0115
Decock, C. (2014). Mitigating nitrous oxide emissions from corn cropping systems in the midwestern U.S.: Potential and data gaps. Environ. Sci. Technol. 48, 4247–4256. doi: 10.1021/es4055324
Denk, T. R. A., Mohn, J., Decock, C., Lewicka-Szczebak, D., Harris, E., Butterbach-Bahl, K., et al. (2017). The nitrogen cycle: a review of isotope effects and isotope modeling approaches. Soil Biol. Biochem. 105, 121–137. doi: 10.1016/j.soilbio.2016.11.015
Eagle, A. J., Christianson, L. E., Cook, R. L., Harmel, R. D., Miguez, F. E., Qian, S. S., et al. (2017a). Meta-analysis constrained by data: recommendations to improve relevance of nutrient management research. Agron. J. 109, 2441–2449. doi: 10.2134/agronj2017.04.0215
Eagle, A. J., Olander, L. P., Locklier, K. L., Heffernan, J. B., and Bernhardt, E. S. (2017b). Fertilizer management and environmental factors drive N O and NO losses in corn: a meta-analysis. Soil Sci. Soc. Am. J. 81, 1191–1202. doi: 10.2136/sssaj,2016.09.0281
EU Nitrogen Expert Panel (2015). Nitrogen Use Efficiency (NUE) - An Indicator for the Utilization of Nitrogen in Agriculture and Food Systems. Wageningen. Available online at: https://www.unece.org/fileadmin/DAM/env/documents/2017/AIR/WGSR/10_The_EU_Nitrogen_Expert_Panel_and_its_indicator_forNitrogen_Use_Efficiency__Tiffanie_Stephanie.pdf
Gitelson, A. (2011). “Remote sensing estimation of crop biophysical characteristics at various scales,” in Hyperspectral Remote Sensing of Vegetation, eds P. S. Thenkabail, J. G. Lyon, and A. Huete (Boca Raton, FL: CRC Press), 329–358.
Godfray, H. C. J. (2014). The challenge of feeding 9-10 billion people equitably and sustainably. J. Agric. Sci. 152, S2–S8. doi: 10.1017/S0021859613000774
Graham, R. F., Greer, K. D., Villamil, M. B., Nafziger, E. D., and Pittelkow, C. M. (2018). Enhanced efficiency fertilizer impacts on yield-scaled nitrous oxide emissions in maize. Soil Sci. Soc. Am. J. 82, 1–35. doi: 10.2136/sssaj2018.05.0196
Hensen, A., Skiba, U., and Famulari, D. (2013). Low cost and state of the art methods to measure nitrous oxide emissions. Environ. Res. Lett. 8:025022. doi: 10.1088/1748-9326/8/2/025022
Jin, C.-X., and Sands, G. R. (2003). The long-term field-scale hydrology of subsurface drainage systems in a cold climate. Trans. ASAE 46, 1011–1021. doi: 10.13031/2013.13963
Kim, D. G., Hernandez-Ramirez, G., and Giltrap, D. (2013). Linear and nonlinear dependency of direct nitrous oxide emissions on fertilizer nitrogen input: a meta-analysis. Agric. Ecosyst. Environ. 168, 53–65. doi: 10.1016/j.agee.2012.02.021
Kitchen, N. R., Shanahan, J. F., Ransom, C. J., Bandura, C. J., Bean, G. M., Camberato, J. J., et al. (2017). A public–industry partnership for enhancing corn nitrogen research and datasets: project description, methodology, and outcomes. Agron. J. 109, 2371–2388. doi: 10.2134/agronj2017.04.0207
Lassaletta, L., Billen, G., Grizzetti, B., Anglade, J., and Garnier, J. (2014). 50 year trends in nitrogen use efficiency of world cropping systems: the relationship between yield and nitrogen input to cropland. Environ. Res. Lett. 9:105011. doi: 10.1088/1748-9326/9/10/105011
McLellan, E. L., Cassman, K. G., Eagle, A. J., Woodbury, P. B., Sela, S., Tonitto, C., et al. (2018). The nitrogen balancing act: tracking the environmental performance of food production. Bioscience 68, 194–203. doi: 10.1093/biosci/bix164
Mueller, N. D., Gerber, J. S., Johnston, M., Ray, D. K., Ramankutty, N., and Foley, J. A. (2012). Closing yield gaps through nutrient and water management. Nature 490, 254–257. doi: 10.1038/nature11420
Mulla, D. J., and Strock, J. S. (2008). “Nitrogen transport processes in soil,” in Nitrogen in Agricultural Systems, eds J. S. Schepers and W. R. Raun (Madison, WI: ASA, CSSA, SSSA), 361–400.
Norton, J. M. (2008). “Nitrification in agricultural soils,” in Nitrogen in Agricultural Systems, eds J. S. Schepers and W. R. Raun (Madison, WI: ASA, CSSA, SSSA), 173–199.
Omonode, R. A., Halvorson, A. D., Gagnon, B., and Vyn, T. J. (2017). Achieving lower nitrogen balance and higher nitrogen recovery efficiency reduces nitrous oxide emissions in North America's maize cropping systems. Front. Plant Sci. 8:1080. doi: 10.3389/fpls.2017.01080
Parkin, T. B., and Venterea, R. T. (2010). “USDA-ARS GRACEnet project protocols. Chapter 3. chamber-based trace gas flux measurements,” in Sampling Protocols, ed R. F. Follett, 1–39. Available online at: www.ars.usda.gov/research/GRACEnet
Ravishankara, A. R., Daniel, J. S., and Portmann, R. W. (2009). Nitrous oxide (N2O): the dominant ozone-depleting substance emitted in the 21st century. Science 326, 123–125. doi: 10.1126/science.1176985
Rembold, F., Atzberger, C., Savin, I., and Rojas, O. (2013). Using low resolution satellite imagery for yield prediction and yield anomaly detection. Remote Sens. 5, 1704–1733. doi: 10.3390/rs5041704
Robertson, G. P., and Vitousek, P. M. (2009). Nitrogen in agriculture: balancing the cost of an essential resource. Annu. Rev. Environ. Resour. 34, 97–125. doi: 10.1146/annurev.environ.032108.105046
Sawyer, J., Nafziger, E., Randall, G., Bundy, L., Rehm, G., and Joern, B. (2006). Concepts and Rationale for Regional Nitrogen Rate Guidelines for Corn Concepts and Rationale for Regional Nitrogen Rate Guidelines for Corn. Ames, IA: Iowa State University Extension.
Scharf, P. C. (2015). Managing Nitrogen in Crop Production, Understanding Nitrogen. Madison, WI: ACCESS Publications, 1–24.
Scharf, P. C., Kitchen, N. R., Sudduth, K. A., Davis, J. G., Hubbard, V. C., and Lory, J. A. (2005). Field-scale variability in optimal nitrogen fertilizer rate for corn. Agron. J. 97, 452–461. doi: 10.2134/agronj2005.0452
Schmidt, J. P., Sripada, R. P., Beegle, D. B., Rotz, C. A., and Hong, N. (2011). Within-field variability in optimum nitrogen rate for corn linked to soil moisture availability. Soil Sci. Soc. Am. J. 75, 306–316. doi: 10.2136/sssaj2010.0184
Schwalbert, R. A., Amado, T. J. C., Nieto, L., Varela, S., Corassa, G. M., Horbe, T. A. N., et al. (2018). Forecasting maize yield at field scale based on high-resolution satellite imagery. Biosyst. Eng. 171, 179–192. doi: 10.1016/j.biosystemseng.2018.04.020
Shcherbak, I., Millar, N., and Robertson, G. P. (2014). Global metaanalysis of the nonlinear response of soil nitrous oxide (N2O) emissions to fertilizer nitrogen. Proc. Natl. Acad. Sci. U.S.A. 111, 9199–9204. doi: 10.1073/pnas.1322434111
Simbahan, G. C., Dobermann, A., and Ping, J. L. (2004). Screening yield monitor data improves grain yield maps. Agron. J. 96, 1091–1102. doi: 10.2134/agronj2004.1091
Snyder, C. S., Bruulsema, T. W., Jensen, T. L., and Fixen, P. E. (2009). Review of greenhouse gas emissions from crop production systems and fertilizer management effects. Agric. Ecosyst. Environ. 133, 247–266. doi: 10.1016/j.agee.2009.04.021
Snyder, C. S., and Fixen, P. E. (2012). Plant nutrient management and risks of nitrous oxide emission. J. Soil Water Conserv. 67, 137A−144A. doi: 10.2489/jswc.67.5.137A
Sobota, D. J., Compton, J. E., McCrackin, M. L., and Singh, S. (2015). Cost of reactive nitrogen release from human activities to the environment in the United States. Environ. Res. Lett. 10:025006. doi: 10.1088/1748-9326/10/2/025006
Turner, P. A., Griffis, T. J., Mulla, D. J., Baker, J. M., and Venterea, R. T. (2016). A geostatistical approach to identify and mitigate agricultural nitrous oxide emission hotspots. Sci. Total Environ. 572, 442–449. doi: 10.1016/j.scitotenv.2016.08.094
USDA-ERS (2018). Outlook for U.S. Agricultural Trade. Available online at: https://www.ers.usda.gov/ (Accessed October, 1, 2018).
USDA-NASS (2012). 2012 Census of Agriculture: Tile Drained Acres by State. Available online at: http://www.nass.usda.gov/AgCensus/ (Accessed October, 23, 2018).
USDA-NASS (2018). Agricultural Statistics 2017. Washington, DC. Available online at: http://www.nass.usda.gov/ (Accessed August 1, 2018).
USEPA (2007). Hypoxia in the Northen Gulf of Mexico: An Update by the EPA Science Advisory Board. Washington, DC
van Groenigen, J. W., Velthof, G. L., Oenema, O., van Groenigen, K. J., and van Kessel, C. (2010). Towards an agronomic assessment of N2O emissions: a case study for arable crops. Eur. J. Soil Sci. 61, 903–913. doi: 10.1111/j.1365-2389.2009.01217.x
Venterea, R. T., Bijesh, M., and Dolan, M. S. (2011). Fertilizer source and tillage effects on yield-scaled nitrous oxide emissions in a corn cropping system. J. Environ. Qual. 40, 1521–1531. doi: 10.2134/jeq2011.0039
Wagner-Riddle, C., Congreves, K. A., Abalos, D., Berg, A. A., Brown, S. E., Ambadan, J. T., et al. (2017). Globally important nitrous oxide emissions from croplands induced by freeze-thaw cycles. Nat. Geosci. 10, 279–283. doi: 10.1038/ngeo2907
Web Soil Survey (2018) Soil Survey Staff, Natural Resources Conservation Services, and United States Department of Agriculture Web Soil Survey. Available online at: https://websoilsurvey.sc.egov.usda.gov/ (Accessed September 15, 2018).
Keywords: nitrogen dynamics, nitrous oxide emissions, nitrate leaching, remote sensing, environmental monitoring, sustainable food production
Citation: Preza Fontes G, Bhattarai R, Christianson LE and Pittelkow CM (2019) Combining Environmental Monitoring and Remote Sensing Technologies to Evaluate Cropping System Nitrogen Dynamics at the Field-Scale. Front. Sustain. Food Syst. 3:8. doi: 10.3389/fsufs.2019.00008
Received: 30 October 2018; Accepted: 30 January 2019;
Published: 20 February 2019.
Edited by:
Matt Bell, University of Nottingham, United KingdomReviewed by:
Alexandra C. Morel, University of Oxford, United KingdomEmma Louise Burns, Australian National University, Australia
Copyright © 2019 Preza Fontes, Bhattarai, Christianson and Pittelkow. This is an open-access article distributed under the terms of the Creative Commons Attribution License (CC BY). The use, distribution or reproduction in other forums is permitted, provided the original author(s) and the copyright owner(s) are credited and that the original publication in this journal is cited, in accordance with accepted academic practice. No use, distribution or reproduction is permitted which does not comply with these terms.
*Correspondence: Giovani Preza Fontes, Z2lvdmFuaTNAaWxsaW5vaXMuZWR1