 Crystal A. Sorgini
 Ilse Barrios-Perez
 Patrick J. Brown
 Elizabeth A. Ainsworth
- 1Department of Crop Sciences, University of Illinois at Urbana Champaign, Urbana, IL, United States
- 2Department of Soil and Crop Sciences, Texas A&M University, College Station, TX, United States
- 3Department of Plant Sciences, University of California, Davis, Davis, CA, United States
- 4Global Change and Photosynthesis Research Unit, USDA ARS, Urbana, IL, United States
Screening crop plants under elevated ozone concentrations ([O3]) is a pre-requisite for identification of tolerant lines, but few studies have mapped maize responses to elevated [O3]. B73-Mo17 nearly isogenic lines (NILs) were screened in the field under ambient (~40 ppb) and elevated (~100 ppb) [O3] at the Free Air gas Concentration Enrichment (FACE) research facility in Champaign, IL to identify maize leaf damage QTL associated with variation in O3-induced oxidative stress response. In Mo17 NILs, a significant leaf damage QTL was identified at 161Mb on chromosome 2. To assess the feasibility of high-throughput phenotyping and fine mapping of early season O3 leaf damage QTL, a subset of the nested association mapping (NAM) founder lines were screened in a growth chamber experiment under ambient and elevated [O3]. Results showed that elevated [O3] decreased the number of green leaves while increasing the number of lesioned and dead leaves. Most lines showed the same general response to elevated [O3], but the degree of damage varied among lines. Next, tolerant and sensitive B73-Mo17 NILs identified from the FACE study, and hybrid crosses of the identified NILs with Mo17 (n = 20) were grown under elevated O3 (~150 ppb) in growth chambers (n = 7). In the chambers, O3-sensitive lines could be distinguished from tolerant lines based on leaf lesions, but there was not a continuous degree of damage like that seen in the field. This research identified a repeatable O3-induced leaf damage QTL and developed populations and markers that can be used in future growth chamber fine mapping experiments. These results demonstrate the feasibility of high-throughput phenotyping and fine mapping of O3 leaf damage QTL in a controlled environment.
Introduction
Tropospheric O3 is one of the most important environmental pollutants and is estimated to cost billions of dollars in global crop losses (Van Dingenen et al., 2009; Avnery et al., 2011; McGrath et al., 2015; Ainsworth, 2017; Mills et al., 2018). A majority of tropospheric O3 comes from anthropogenic emissions. Tropospheric O3 is a direct driver of global warming and has indirect negative effects on plant production. O3 has been shown to have a negative effect on yield and quality traits of crop plants such as soybean and rice (Betzelberger et al., 2010; Frei, 2015). However, there have been fewer studies that have investigated the effects of elevated O3 on C4 plants (Leisner and Ainsworth, 2012). Maize is one of the world's primary agricultural commodities for food, fodder, and fuel (FAO, 2018). The global demand for maize crop production is increasing exponentially (Kay et al., 2013), and it is estimated that by 2050 agricultural commodities will need to sustain more than nine billion people (FAO, 2018). Concurrently, it is projected that by 2050 tropospheric O3 concentrations will increase (Pachauri et al., 2014). Therefore, understanding how maize is affected by O3-induced oxidative stress will contribute to improving current and future maize crop productivity.
O3 causes damage to plants when it enters leaves through the stomata and forms other reactive oxygen species (ROS; Black et al., 2000). Plant response to oxidative stress involves the creation of ROS stress and its interaction with phytohormones, Ca2+, and MAPK signal cascades. There appears to be significant overlap between O3 response and pathogen response pathways in plants (Perez and Brown, 2014). High [O3] mimics oxidative bursts generated by early signal pathways that regulate plant hypersensitive response (Rao and Davis, 1999; Rao et al., 2000). Secondary ROS bursts activate the expression of defense genes and the ethylene, salicylic acid, and jasmonic acid signal pathways (Black et al., 2000; Perez and Brown, 2014). The cost associated with detoxification of O3 often increases respiration, which along with a reduction in photosynthesis at elevated [O3], imparts a substantial C cost to plants (Ainsworth et al., 2012).
Amongst the range of effects caused by elevated [O3], visible leaf damage symptoms are considered an important indicator of O3 injury (Miller et al., 1989). O3-induced leaf damage traits have been reported for the past 35 years from countries all around the world (Krupa et al., 2001). Both acute and chronic O3 exposure induce oxidative stress due to the production of ROS in the apoplast (Frei, 2015). At high O3 concentrations, this production of ROS can result in cell death and necrotic symptoms (Rao and Davis, 2001; Kangasjarvi et al., 2005). Chronic injury is normally induced by long-term, lower O3 concentrations, and develops slowly over days to weeks. Chronic injury is characterized by chlorosis, stippling, necrosis, leaf edge yellowing, and premature senescence (Brace et al., 1999). A concern in diagnosing leaf damage is the ability to distinguish O3 symptoms from a wide range of potential symptoms caused by other agents. Therefore, foliar symptoms are best identified through a systematic survey. Assessing O3-induced leaf damage is important because it is often correlated with a decreased carbon fixation and water use efficiency (Rao and Davis, 2001; Kangasjarvi et al., 2005) and is much easier to score than physiological measurements that require specialized equipment.
Free Air gas Concentration Enrichment (FACE) facilities allow for the investigation into predicted climate change scenarios. The power of FACE facilities is in the ability to study how changes in atmospheric gasses alter plant growth in a field setting, with treatment application having only a minimal effect on other abiotic and biotic factors. FACE technologies have been adapted to enrich O3 to study plant responses in field settings (Morgan et al., 2004; Tang et al., 2011). A potential problem with FACE systems is their limited size, making it difficult to screen large populations needed for modern genetic analysis. Previous work has shown that the SoyFACE research facility at the University of Illinois Urbana-Champaign can be successfully used to screen crops for O3 tolerance and sensitivity (Ainsworth et al., 2014; Yendrek C. R. et al., 2017). Using modern screening SoyFACE studies have shown genetic variation in numerous traits for numerous species. The most recent research in crop species response to elevated O3 has focused on identifying physiological variation and/or yield traits in soybean (Betzelberger et al., 2010), rice (Shi et al., 2009), and wheat (Zhu et al., 2011). Identifying intraspecific variation for oxidative stress tolerance is an important pre-breeding step (Ainsworth, 2017). However, the next step is to use genetically structured populations, such as near isogenic lines, in FACE experiments to perform genetic analysis of O3 response. Genetic mapping studies have identified leaf damage QTL for Arabidopsis (Brosché et al., 2010), poplar (Street et al., 2011), rice (Kim et al., 2004; Frei et al., 2008; Frei, 2015; Tsukahara et al., 2013), and soybean (Burton et al., 2016), but not for maize.
Building on previous, unpublished results suggesting B73 and Mo17 differed in O3 sensitivity, B73-Mo17 nearly isogenic lines (NILs) were screened in the field under ambient (~40 ppb) and elevated (~100 ppb) [O3] at the FACE research facility in Champaign, IL to identify maize leaf damage QTL associated with variation in oxidative stress response. The aims of this study were to (i) assess variation in the sensitivity of maize to elevated [O3] using nearly isogenic lines, (ii) identify O3-induced leaf damage QTL(s) and, (iii) develop populations and marker tools for fine mapping to confer O3 tolerance and/or verify sensitive lines. Additionally, the feasibility of high-throughput phenotyping and fine mapping of early season O3 damage QTL were tested with a controlled environment experiment. Two hypotheses were tested: (i) maize exposure to elevated [O3] (~150 ppb) in a growth chamber will result in an abiotic stress response, which will accelerate senescence; and, (ii) O3 response in the growth chamber will correlate to response measured in the field.
Materials and Methods
Field NIL Experiment
One hundred B73-Mo17 NILs were screened in the field under ambient (~40 ppb) and elevated (~100 ppb) [O3] at the FACE research facility in Champaign, IL. Fifty B73 NILs (n = 4) with Mo17 introgressions into a B73 background and 50 Mo17 NILs (n = 4) with B73 introgressions into a Mo17 background developed by Eichten et al. (2011) were planted in a single-row 1.65 m plot in four elevated [O3] and four ambient rings in 2016 and 2017. B73 and Mo17 were grown as checks and replicated five times within each ring for a total of 40 plots across the experiment. Each NIL was present one time within each ring for a total of eight replications across the experiment. Air enriched with O3 was delivered to the experimental rings with FACE technology, as described in Yendrek C. et al. (2017). Maize was exposed to elevated [O3] (100 ppb) for 8 h each day from shortly after emergence until physiological maturity. When the fumigation system was operating, O3 concentrations were within 20% of the 100 ppb target concentration for 81% of the time.
O3-induced leaf damage was scored on a 0–9 scale in two successive years. A foliar disease scale was modified for leaf damage susceptibility in maize (Figure 1); with zero representing 0–10% of the leaf area having damage and nine representing 90–100% of the leaf area having damage. Leaf damage was scored on eight plants per plot and the average was used for analysis. Plot averages for each FACE ring were used in the analysis for each NIL genotype. In 2016 and 2017, 43 days after planting (DAP) measurements were taken on the 5th true leaf. Damage scores were collected independently by two scientists and compared for reliability.
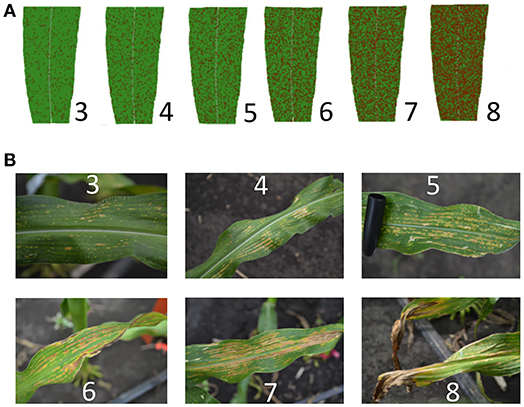
Figure 1. O3-Induced leaf damage scale. Leaf damage was scored on a 0–9 scale. Visual rating scales were adapted from foliar disease scoring methods. Not shown: “0” mark for 0–10% damage, “1” mark for 10–20% damage, “2” mark for 20–30% damage, and the “9” mark for 90–100% damage. (A) Cartoon interpretation of percentage leaf damage coverage. (B) Field pictures of O3 leaf damage. Damage scores are shown.
QTL analysis was completed using stepwise regression with the lm function in R (R Core Team, 2015). Three models with different random effects were tested and best fit chosen by the Akaike information criterion (AIC). The final model included random effects for ring, ring set by ring interaction (ringset:ring), and genotype. “Ringset” is the cardinal direction location of the plot in each ring. This model was used to analyze the data in separate genotypes, in separate environments, and in both genotypes. First, the ozone response (Elevated leaf damage—Ambient leaf damage) was calculated. Mo17 NILs were analyzed separately from B73 NILs. Then, an additional QTL analysis was completed in separate environments (elevated or ambient). Finally, the analysis was run analyzing B73 and Mo17 NILs together with recurrent parent (“RP”) as a covariate in the model. Significance thresholds were determined by using 200 permutations and an alpha of 0.05.
Growth Chamber Experiments
A subset of nested association mapping (NAM) founder lines (CML322, CML333, Ki3, M37W, Mo18W, MS71, NC358, and P39) were grown under ambient and elevated [O3] (~150 ppb) in growth chambers (n = 4) (Environmental Growth Chamber, GC Series, 1.4 m2 growing area, Chagrin Falls, OH, USA). Ozone was produced by a variable output UV-C light bulb ballast (HVAC 560 ozone generator, Crystal Air, Langley, Canada), and controlled with a custom multiport sampling system. The subset of NAM founder lines was selected based on previous results (Yendrek C. R. et al., 2017) that showed in elevated [O3] leaf senescence of inbred and hybrid maize was genotype-specific. The NAM founder lines were selected to maximize diversity from maize inbreds. The subset selected contained tropical lines (CML322, CML333, Ki3), a high-carotenoid line (M37W), temperate lines (Mo18W, MS71, NC358), and a popcorn (P39). Each chamber was setup in a 10 × 5 (n = 50 plants per chamber) layout, as an incomplete block design with five blocks and 10 plants per block. Each block had a B73 check such that B73 was replicated 10 times per chamber for a total of 80 pots across the experiment. The selected NAM founder lines were replicated five times per a chamber for a total of 40 pots across the experiment. Genotype location was randomized for ambient and elevated [O3] chamber pair (Supplemental Figure 1). Growth conditions included Sungrow© professional LC1 growing mix soil, osymocote© all-purpose plant fertilizer, and daily hand watering. Chambers were set to maintain constant light (700 μmol m−2 s−1; 15 h day), temperature (25°C day, 21°C night), and relative humidity (60%). Ozone was produced with a variable output UV-C light bulb and ballast (HVAC 560 ozone generator, Crystal Air, Langley, Canada) for a setpoint of 150 ppb for 9 h per day. Ozone concentrations within each chamber were monitored with an O3 analyzer (Thermo Electron 49i, Thermo Scientific, Waltham, MA, USA) and controlled using a custom multiport sampling system.
Total leaf number, green leaf number, lesioned leaf number, and dead leaf number phenotypic measurements were completed at 21 and 32 DAP. Additional phenotypic measurements were completed 32 DAP and included height of the main stalk to the whorl (“height”), tiller number, and the sum of all tiller lengths and main stalk (“total height”). Green leaf number and lesioned leaf number were scored to capture different potential response mechanisms. In the field, some genotypes put leaves on more rapidly in elevated ozone, and so we counted green leaf number to determine if this trait was consistent. Lesioned leaf number informs us how many leaves are showing ozone sensitivity. Statistical analysis was performed on mean trait values for each genotype within a chamber. Independent T-tests were performed on genotype by trait:treatment. Significance was adjusted using the Bonferroni correction for multiple testing. Linear mixed effect modeling was completed using the Lme4 R package (Bates et al., 2015), using a model with: treatment as a fixed effect, chamber within treatment as a random effect, block within chamber within treatment as random effect, genotype as a fixed effect, and genotype*treatment as a fixed effect. The mixed model p-values were calculated using normal distribution approximation which assumes infinite degrees of freedom. The significance threshold was set at p < 0.05 for all analyses.
Selected tolerant (m076) and sensitive (m002, m072, m007, m030, m091, m016, m038, b131, b005) NILs plus their hybrid crosses with Mo17 were grown under elevated O3 (~150 ppb) in growth chambers (n = 7), with an incomplete block design. Each chamber was setup in a 4 × 8 (32 plants per chamber) layout to allow plants to grow without overcrowding through the 6th leaf stage. Each chamber contained four blocks with eight plants per block. Each block had B73, Mo17, and B73 × Mo17 checks, so each check was replicated four times within a chamber. Selected NIL lines and hybrids were screened in each chamber for a total of seven plants in the experiment. Within a chamber plant location was randomized (Supplemental Figure 2). Growth conditions included Sungrow© professional LC1 growing mix soil, osymocote© all-purpose plant fertilizer, and daily hand watering. Chambers were set to maintain constant light (700 μmol m−2 s−1; 15 h day), temperature (25°C day, 21°C night), relative humidity (60%), and elevated [O3] (150 ppb) for 9 h per day.
O3-induced leaf damage was scored on a 0–9 scale as described above, on the 5th and 6th true leaf at 32 DAP. Chamber average damage scores were recorded for each NIL, hybrid, and check. Leaf damage scores were collected independently by two scientists and compared for reliability. Additionally, each leaf of each plant was photographed. Growth chamber values for leaf damage were compared to field values scored in the elevated [O3] plots using a 2 parameter logarithmic function (y = yo + αlnx). The data were assessed with the Shapiro Wilk normality test and QQ plot analysis using the 5th leaf damage scores from the chamber, the 6th leaf damage scores from the chamber, the combined 5th and 6th leaf (“leaf_variable”) damage scores, and the field leaf damage scored on 5th leaf in elevated [O3]. To determine best fits for the data distributions, three models were tested and the best was chosen using AIC. The final models included random effects for leaf_variable, chamber, block:chamber, and genotype. All calculations and analysis were completed in R (R Core Team, 2015).
Results
Field NIL Experiment
There was considerable genetic variation within the NILs in the response to elevated [O3] (Figure 2). Mo17 was more sensitive than B73, and some Mo17 NILs were much more sensitive than Mo17 (Figure 2). Leaf damage scores from the field in 2016 and 2017 had a strong, significant correlation (r = 0.93, Figure 3). Five sensitive Mo17 NILs (m007, m022, m030, m072, and m091), two sensitive B73 NILs (b005, b131), and one tolerant Mo17 NIL (m076) were consistent across years (Figure 3). In Mo17 NILs, a repeatable significant QTL was identified on chromosome 2 at 161Mb (Figures 4A,C,E and Table 1). Interestingly, B73 introgressions into Mo17 in this region made NILs more sensitive to elevated [O3] (Figures 4B,D,F). Sensitive Mo17 NILs had on average five total introgression regions. All five sensitive NILs shared a common introgression on chromosome 2 at 161Mb, and the left-hand boundaries of the LOD drop off support intervals (Supplemental Table 1) for this QTL cross the centromere. Sensitive B73 NILs (b005 and b131) had two shared introgressions: one on chromosome 5 that is 1.86Mb and another on chromosome 6 that is 7.95 Mb. Resistant NIL m076 has six small homozygous introgressions on four chromosomes.
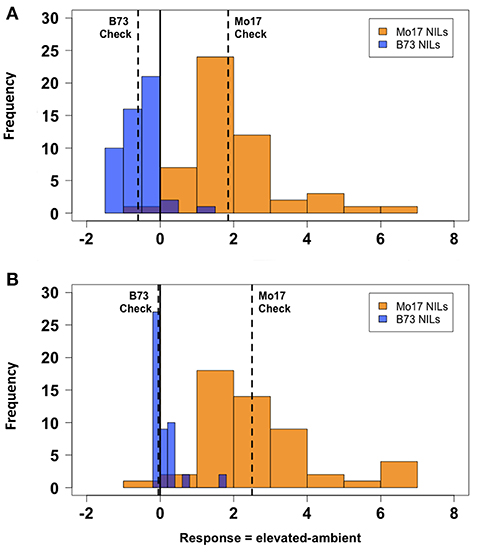
Figure 2. Field O3 leaf damage response. Field-based FACE screening of B73-Mo17 NILs showed that Mo17 alleles contribute more susceptibility to O3 than B73 alleles. Solid vertical line indicates overall mean. Dashed vertical lines indicate means of parental (B73 and Mo17) checks. (A) 2016 Measurement, (B) 2017 Measurement. Blue indicates ambient FACE ring. Orange indicates elevated [O3] FACE ring.
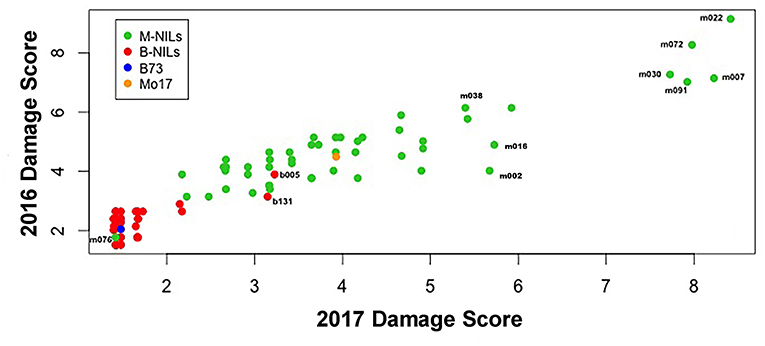
Figure 3. Field O3 leaf damage correlation. Leaf damage scores from the field in 2016 and 2017 had a strongly significant correlation (r = 0.93). Five sensitive Mo17 NILs (m007, m022, m030, m072, and m091), one tolerant Mo17 NIL (m076), and two sensitive B73 NILs (b005 and b131) were identified and consistent across years.
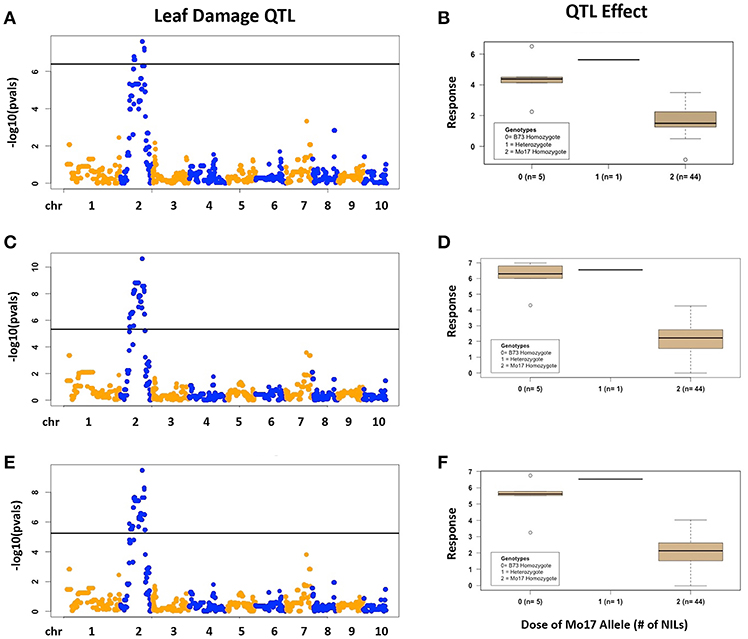
Figure 4. Field O3 Leaf Damage QTL in Mo17 NILs. Results are shown for Mo17 NILs; (A,B) 2016, (C,D) 2017, (E,F) 2016 and 2017 combined data results. (Left) QTL mapping results. (Right) Boxplots showing phenotypic distributions for B73-allele homozygotes (0), heterozygotes (1), and Mo17-allele homozygotes (2) at the most significant marker, which is the same in (A–C).
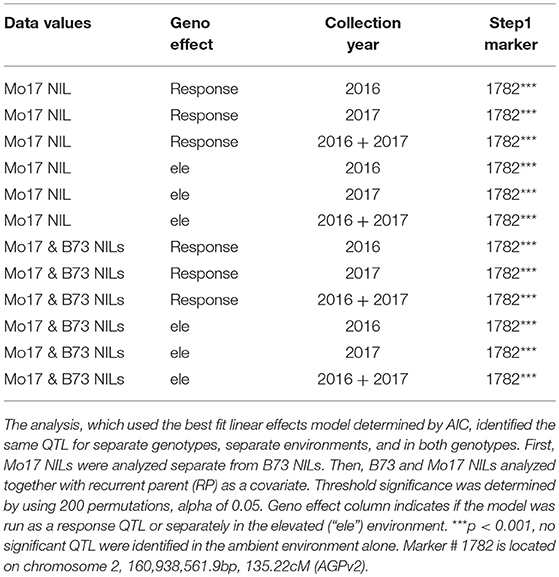
Table 1. Field stepwise regression QTL linkage mapping results.
NAM Founder Lines Subset Growth Chamber Experiment
Maize plant exposure to elevated [O3] in a growth chamber setting resulted in an abiotic stress response that was distinguishable by leaf trait phenotyping. In general, independent T-tests by trait for each genotype show that elevated [O3] in the growth chambers decreased the number of green leaves while increasing the number of lesioned and dead leaves (Figure 5 and Table 2). Most NAM founder lines showed the same general trends for leaf traits, however individual lines showed varying responses to elevated O3 treatment (Figure 5 and Table 2). Height response was variable; lines B73, CML322, MS71, and NC358 were significantly (p < 0.05) affected by O3 treatment, but lines CML333, Ki3, M37W, and Mo18W were not (Table 2). Line P39 tiller production was significantly (p < 0.05) reduced in the elevated O3 environment (Table 2). The growth chamber experiment showed that B73 grown under ~150 ppb O3 for 3–4 weeks can clearly be differentiated from ambient-grown B73 based on leaf lesion types (Table 2). Linear mixed-effects modeling shows that NAM founder lines B73 and MS71 were significantly affected (p < 0.05) by O3 treatment in all three traits analyzed (Table 3). NAM founder lines CML322, M37W, Mo18W, Ms71, and NC358 were significantly affected (p < 0.01) by O3 treatment for traits green leaf number and lesioned leaf number but not height (Table 3).
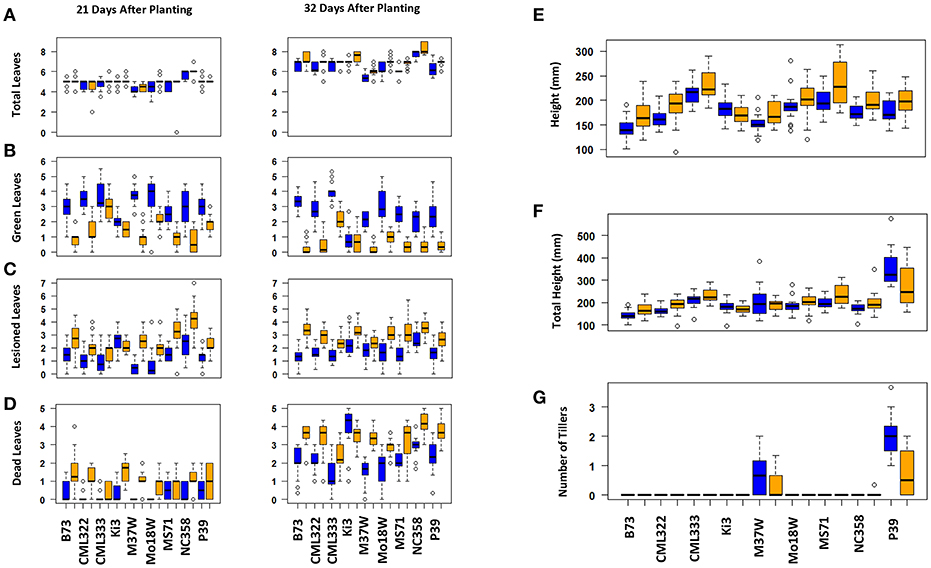
Figure 5. Growth chamber NAM founder lines subset elevated [O3] screen trait by genotype. Individual lines show varying effect size of O3 treatment. Most lines show the same general trends. (A) Total number of leaves, (B) number of green leaves, (C) number of lesioned leaves, (D) number of dead leaves, (E) height, (F) total height (sum of all tiller lengths and main stalk), (G) number of tillers. Blue indicates ambient chambers. Orange indicates elevated [O3] chambers.
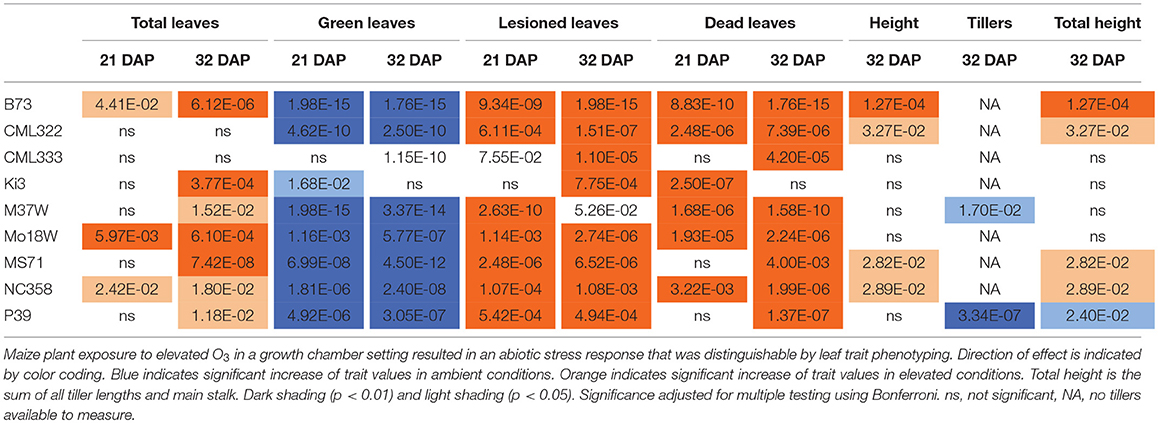
Table 2. Growth chamber NAM founder lines subset elevated [O3] screen independent T-tests trait by genotype.
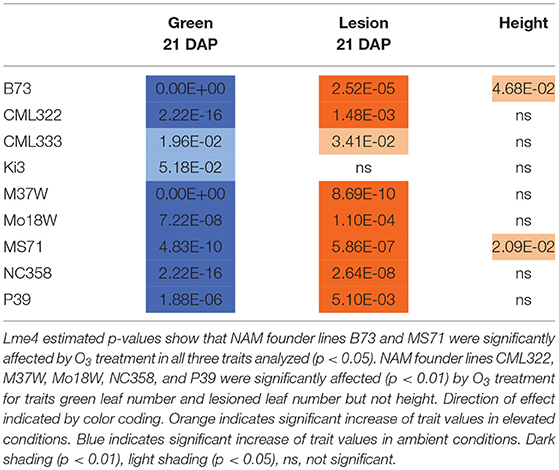
Table 3. Growth chamber NAM founder lines subset P-values from Lme4 modeling.
NIL Growth Chamber Experiment
Experiments in the growth chambers with selected NILs and hybrids revealed that the leaf damage scores showed a binary distribution, and not the continuous degree of damage that was observed in the field (Figures 6A,C). Leaf damage scores on the fifth and sixth leaves were similar (Figures 6A,B). B73 and Mo17 were clearly distinguishable in both the field and the growth chamber. Mo17 NILs m002 and m016 carry the introgression chromosome 2. While, NIL m038 is heterozygous on chromosome 2 for the shared introgression under the QTL. Using leaf damage scores from NILs and hybrids in the chambers, we observed that the B73 QTL allele on chromosome 2 appeared to confer O3 sensitivity in the Mo17 background in a dominant fashion (Figures 7A,B), whereas the B73 allele(s) conferring resistance in m076 appeared to act additively (Figure 7C). Sensitive B73 NILs, b005, and b131, appeared to confer O3 sensitivity in a dominant fashion (Figures 7D,E). All of the sensitive NILs had a similar high leaf damage score (~8) in the growth chamber, despite showing a range of scores in the field.
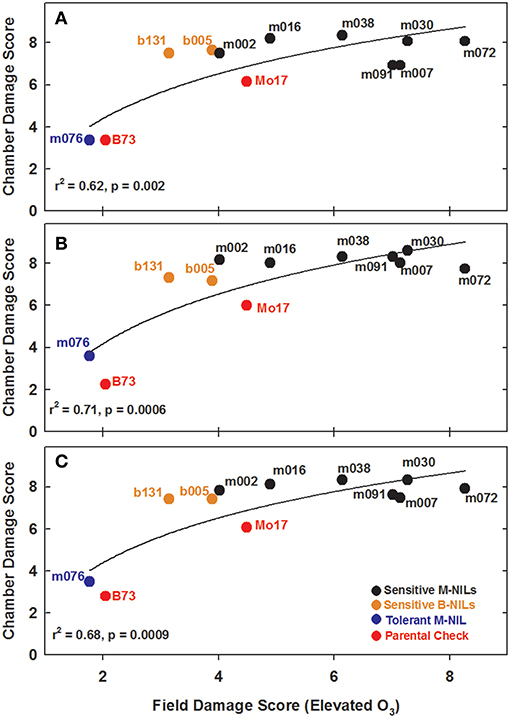
Figure 6. Field and growth chamber O3 leaf damage scores. Field 5th leaf elevated damage scores were plotted against (A) combined chamber 5th and 6th leaf damage scores, (B) chamber 5th leaf damage scores, and (C) chamber 6th leaf damage scores.
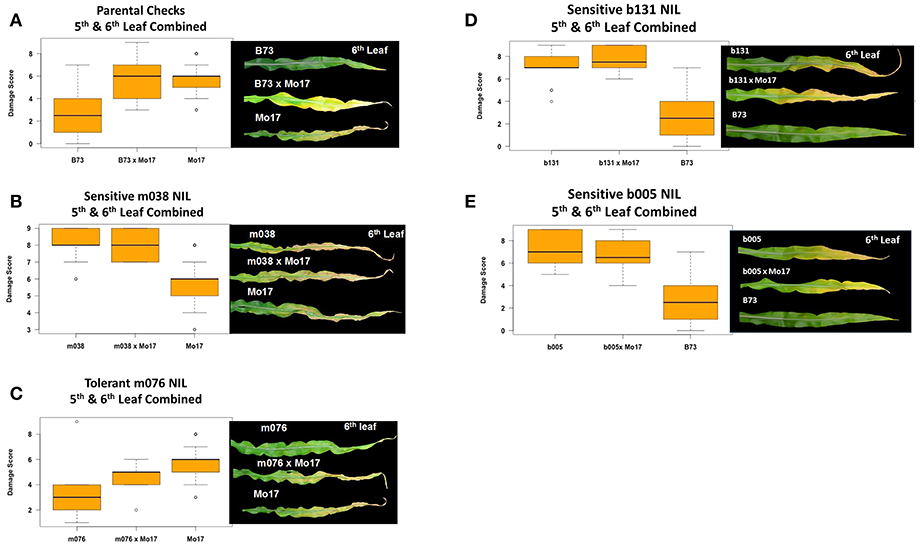
Figure 7. Growth chamber estimation of gene action. Images from each leaf were taken and O3 leaf damage score distributions plotted. Damage scores were calculated by combining 5th and 6th leaf measurements. (A,B) In a Mo17 background, the B73 QTL allele on chromosome 2 appears to confer O3 sensitivity in a dominant fashion, (C) whereas the B73 allele(s) conferring resistance in m076 appear to act additively. (D,E) Sensitive B73 NILs, b131 and b005, appear to confer O3 sensitivity in a dominant fashion.
Discussion
This study used FACE technology to screen maize B73—Mo17 NILs in ambient and elevated [O3] in order to identify genetic regions associated with O3 response. Two NIL populations were screened, one with Mo17 as the recurrent background, and one with B73. Mo17 was more sensitive to elevated [O3] as evidenced by greater visual leaf damage, and the NILs showed transgressive segregation (Figure 2). A significant QTL on chromosome 2 was identified and was consistent in both years of the study (Figure 4 and Table 1). The direction of the QTL effect was unexpected since B73 showed less leaf damage in elevated [O3] than Mo17 (Figure 2). Just because B73 is more tolerant overall does not mean that it will have a tolerant allele for all QTL. Still, given the complexity of plant responses to elevated [O3], it is unexpected that only one major QTL was detected and that B73 introgressions into Mo17 make those NILs more susceptible. Other O3 studies of Arabidopsis and rice have reported multiple smaller QTL for O3 leaf damage (Shi et al., 2009; Brosché et al., 2010; Frei, 2015; Burton et al., 2016), and in rice, an apoplastic protein closely related to ascorbate oxidase, but lacking enzyme activity was subsequently suspected of involvement in O3 tolerance (Ueda et al., 2015). There are several possible explanations for the maize results, including: (i) genetic background matters, (ii) there is cytoplasmic inheritance, or (iii) the B73 alleles have been unmasked. At this time it is inconclusive if the Mo17 introgression into B73 in this region has an effect. All NILs were derived from a B73 × Mo17 hybrid with B73 cytoplasm. An experiment using F2 populations to determine whether the cytoplasm (B73 vs. Mo17) has an effect on the detection of the QTL effect could be revealing. F2 populations could determine whether the QTL effect is only present in certain cytoplasms. To test for genetic background effects B73 NILs with a Mo17 introgression in this location could be leveraged. When particular natural variants are placed into different backgrounds the phenotypic consequences of that allele may be profoundly different from in their own background (Chandler et al., 2013). Genetic background effects have been observed in most genetically tractable organisms where isogenic lines are used, including mice (Strunk et al., 2004), nematodes (Remold and Lenski, 2004), fruit flies (Gibson and van Helden, 1997), yeast (Dowell et al., 2010), rice (Cao et al., 2007), Arabidopsis (Huang et al., 2012), and bacteria (Wang et al., 2013).
Mapping is completed in general stages (Mackay et al., 2009). We identified a QTL that defines a large genomic region where one or more alleles affecting the trait segregate. In this study, the QTL associated with O3 leaf damage on chromosome 2 has support intervals that crossed the centromere. This can reduce the probability of recovering recombinants in subsequent generations (Rodgers-Melnick et al., 2015) and make fine mapping more challenging. Still, theoretically, the next steps in fine mapping would be screen backcrossed F2's to identify segregating NILs. This would assist determination of which of the five introgressions is responsible for the O3-induced leaf damage QTL. The shortcoming of such a classical QTL study is that the resolution of mapping is limited by the number of genetic recombination events occurring in the mapping populations (Lipka et al., 2015).
A second aim of this study was to test if growth chamber experiments could be used to accelerate screening for O3 responsive lines. FACE technology, developed to study elevated CO2 concentrations, is readily adaptable to study O3. In fact, this has been used to study the impact of O3 on various crops (reviewed in Ainsworth, 2017). There are certain limitations to all field trials including those using FACE technology. In many crop growing regions, only a single field season is possible, and FACE “rings” have a limited size. Given the desire for breeding programs to screen potentially thousands of genotypes, conducting mapping experiments in smaller scale chamber experiments followed by verification in the field with elevated [O3] may be more feasible (Frei, 2015). Our results showed that exposure to elevated O3 in chambers caused leaf damage (Figure 5), and that O3 sensitive and tolerant lines were consistent with field-based observations (Figure 6). In the growth chambers, damage was either present or absent, whereas in the field, we observed a continuum of leaf damage (Figure 6). This may be because we used a higher concentration of O3 in the growth chambers compared to the field or because the air flow in the growth chambers provides greater O3 exposure to the plants. Or alternatively that, the FACE experiment could capture small differences that could not be observed in chamber experiment. It was encouraging that the chamber experiments, even with differences in the degree of leaf damage, supported the field experiments overall.
We further used the growth chambers to examine potential dominance in sensitive and tolerant NILs (Figure 7). Mapping populations of Arabidopsis, poplar, rice and soybean have been used previously to identify QTL associated with O3 response (Kim et al., 2004; Frei et al., 2008, 2010; Brosché et al., 2010; Street et al., 2011; Tsukahara et al., 2013, 2015; Burton et al., 2016). Brosché et al. (2010) identified three QTL on chromosomes 1, 2, and 3 for O3 induced leaf injury in Arabidopsis. This research found that genes under these QTL are involved in ROS signaling and stomatal regulation. Street et al. (2011) screened a F2 Populus trichocarpa × Populus deltoids population in a chromic O3 study. They found QTL for leaf necrosis, diameter, late-season leaf number, height, late season abscission, area of the first unfurled leaf, and chlorophyll content in elevated [O3] or as response QTL. These findings indicate that O3 responsive genomic regions exist and govern numerous traits. In soybean, Burton et al. (2016) found a leaf injury QTL following acute O3 treatment varied with leaf position in the canopy. The analysis showed that loci were associated with distinct leaf developmental stages while the O3 sensitive parent contributed one favorable allele for O3 response. In rice O3 damage QTL have been found on chromosomes 1, 2, 5, 7, 8, 9, and 11 and they tend to co-localize. Two rice QTL for leaf bronzing were further studied and found to contribute to O3 tolerance via difference mechanisms (Frei et al., 2008, 2010; Shi et al., 2009). Breeding lines containing both bronzing QTLs were developed, and the lines were more O3 tolerant than the sensitive line and the parental chromosome segment substitution lines.
To advance the findings reported here for maize, F2 populations and markers have been developed. These resources can be utilized to further fine map the leaf damage QTL identified on chromosome 2 at 161 Mb. Additionally, they can be used to map sensitive B73 NILs, b007, and b003, and tolerant Mo17 NIL m076 down to a single introgression. Co-dominant markers can be used to screen for recombinants. These populations have been created to fine map resistance in m076, sensitivity in b005 and b131, and sensitivity in Mo17 NILs (m007, m022, m030, m072, and m091). These developed resources could be used to study which regions and/or genes are underpinning O3 response in maize.
Conclusions
Ozone pollution is hypothesized to cost up to 10% of current maize yields in the U.S. (McGrath et al., 2015). Progress in improving maize tolerance to oxidative stress requires genetic variability, reliable selection methods, time, and resources. Here, we identified a repeatable O3-induced leaf damage QTL on chromosome 2 at 161Mb, which appears to confer O3 sensitivity in a dominant manner. We further showed that O3 sensitive lines identified in the field were also sensitive to elevated [O3] in growth chambers, thus opening potential for high-throughput phenotyping and fine mapping of early season O3 damage QTL in a controlled environment.
Data Availability
The raw data supporting the conclusions of this manuscript will be made available by the authors, without undue reservation, to any qualified researcher.
Author Contributions
All authors listed have made a substantial, direct and intellectual contribution to the work, and approved it for publication.
Funding
This work was supported by the National Science Foundation under grant number PGR-1238030.
Disclaimer
Any opinions, findings, conclusions, or recommendations expressed in this publication are those of the author(s) and do not necessarily reflect the view of the U.S. Department of Agriculture. Mention of trade names or commercial products in this publication is solely for the purpose of providing specific information and does not imply recommendation or endorsement by the U.S. Department of Agriculture. USDA is an equal opportunity provider and employer.
Conflict of Interest Statement
The authors declare that the research was conducted in the absence of any commercial or financial relationships that could be construed as a potential conflict of interest.
Supplementary Material
The Supplementary Material for this article can be found online at: https://www.frontiersin.org/articles/10.3389/fsufs.2019.00051/full#supplementary-material
References
Ainsworth, E. A. (2017). Understanding and improving global crop response to ozone pollution. Plant J. 90, 886–897. doi: 10.1111/tpj.13298
Ainsworth, E. A., Serbin, S. P., Skoneczka, J. A., and Townsend, P. A. (2014). Using leaf optical properties to detect ozone effects on foliar biochemistry. Photosynth. Res. 119, 65–76. doi: 10.1007/s11120-013-9837-y
Ainsworth, E. A., Yendrek, C. R., Sitch, S., Collins, W. J., and Emberson, L.D. (2012). The effects of tropospheric ozone on net primary productivity and implications for climate change. Annu. Rev. Plant Biol. 61, 637–661. doi: 10.1146/annurev-arplant-042110-103829
Avnery, S., Mauzerall, D. L., Liu, J., and Horowitz, L. W. (2011). Global crop yield reductions due to surface ozone exposure: 1. Year 2000 crop production losses and economic damage. Atmos. Environ. 45, 2284–2296. doi: 10.1016/j.atmosenv.2010.11.045
Bates, D., Maechler, M., Bolker, B., and Walker, S. (2015). Fitting linear mixed-effects models using lme4. J. Stat. Softw. 67, 1–48. doi: 10.18637/jss.v067.i01
Betzelberger, A. M., Gillespie, K. M., McGrath, J. M., Koester, R. P., Nelson, R. L., and Ainsworth, E. A. (2010). Effects of chronic elevated ozone concentration on antioxidant capacity, photosynthesis and seed yield of 10 soybean cultivars. Plant Cell Environ. 33, 1569–1581. doi: 10.1111/j.1365-3040.2010.02165.x
Black, V. J., Black, C. R., Roberts, J. A., and Stewart, C. A. (2000). Tansley review no. 115, impact of ozone on the reproductive development of plants. New Phytol. 147, 421–447. doi: 10.1046/j.1469-8137.2000.00721.x
Brace, S., Peterson, D. L., and Bowers, D. (1999). A Guide to Ozone Injury in Vascular Plants of the Pacific Northwest. US Department of Agriculture, Forest Service, Pacific Northwest Research Station.
Brosché, M., Merilo, E., Mayer, F., Pechter, P., Puzõrjova, I., Brader, G., et al. (2010). Natural variation in ozone sensitivity among Arabidopsis thaliana accessions and its relation to stomatal conductance. Plant Cell Environ. 33, 914–925. doi: 10.1111/j.1365-3040.2010.02116.x
Burton, A. L., Burkey, K. O., Carter, T. E., Orf, J., and Cregan, P. B. (2016). Phenotypic variation and identification of quantitative trait loci for ozone tolerance in a Fiskeby III × Mandarin (Ottawa) soybean population. Theor. Appl. Genet. 129, 1113–1125. doi: 10.1007/s00122-016-2687-1
Cao, Y., Ding, X., Cai, M., Zhao, J., Lin, Y., Li, X., et al. (2007). The expression pattern of a rice disease resistance gene Xa3/Xa26 is differentially regulated by the genetic backgrounds and developmental stages that influence its function. Genetics 177, 523–533. doi: 10.1534/genetics.107.075176
Chandler, C. H., Chari, S., and Dworkin, I. (2013). Does your gene need a background check? How genetic background impacts the analysis of mutations, genes, and evolution. Trends Genet. 29, 358–366. doi: 10.1016/j.tig.2013.01.009
Dowell, R. D., Ryan, O., Jansen, A., Cheung, D., Agarwala, S., Danford, T., et al. (2010). Genotype to phenotype: a complex problem. Science 328, 469–469. doi: 10.1126/science.1189015
Eichten, S. R., Foerster, J. M., de Leon, N., Kai, Y., Yeh, C. T., Liu, S., et al. (2011). B73-Mo17 near-isogenic lines demonstrate dispersed structural variation in maize. Plant Physiol. 156, 1679–1690. doi: 10.1104/pp.111.174748
FAO (2018). FAOSTAT. Available online at: http://www.fao.org/faostat/en/#home (accessed February 2018).
Frei M., Tanaka J. P., Chen C., and Wissuwa M. (2010). Mechanisms of ozone tolerance in rice: characterization of two QTLs affecting leaf bronzing by gene expression profiling and biochemical analyses. J. Exp. Bot. 61, 1405–1417.
Frei, M. (2015). Breeding of ozone resistant rice: relevance, approaches and challenges. Environ. Pollut. 197, 144–155. doi: 10.1016/j.envpol.2014.12.011
Frei, M., Tanaka, J. P., and Wissuwa, M. (2008). Genotypic variation in tolerance to elevated ozone in rice: dissection of distinct genetic factors linked to tolerance mechanisms. J. Exp. Bot. 59, 3741–3752. doi: 10.1093/jxb/ern222
Gibson, G., and van Helden, S. (1997). Is function of the Drosophila homeotic gene Ultrabithorax canalized? Genetics 147, 1155–1168.
Huang, X., Effgen, S., Meyer, R. C., Theres, K., and Koornneef, M. (2012). Epistatic natural allelic variation reveals a function of AGAMOUS-LIKE6 in axillary bud formation in Arabidopsis. Plant Cell 24, 2364–2379. doi: 10.1105/tpc.112.099168
Kangasjarvi, J., Jaspers, P., and Kollist, H. (2005). Signaling and cell death in ozone-exposed plants. Plant Cell Environ. 28, 1021–1036. doi: 10.1111/j.1365-3040.2005.01325.x
Kay, D. K., Mueller, N. D., West, P. C., and Foley, J. A. (2013). Yield trends are insufficient to double global crop production by 2050. PLoS ONE 8:e66428. doi: 10.1371/journal.pone.0066428
Kim, K. M., Kwon, Y. S., Lee, J. J., Eun, M. Y., and Sohn, J. K. (2004). QTL mapping and molecular marker analysis for the resistance of rice to ozone. Mol. Cells 17, 151-155.
Krupa, S., McGrath, M. T., Andersen, C. P., Booker, F. L., Burkey, K. O., Chappelka, A. H., et al. (2001). Ambient ozone and plant health. Plant Dis. 85, 4–12. doi: 10.1094/PDIS.2001.85.1.4
Leisner, C. P., and Ainsworth, E. A. (2012). Quantifying the effects of ozone on plant reproductive growth and development. Glob. Chang. Biol. 18, 606–616. doi: 10.1111/j.1365-2486.2011.02535.x
Lipka, A. E., Kandianis, C. B., Hudson, M. E., Yu, J., Drnevich, J., Bradbury, P. J., et al. (2015). From association to prediction: statistical methods for the dissection and selection of complex traits in plants. Curr. Opin. Plant Biol. 24, 110–118. doi: 10.1016/j.pbi.2015.02.010
Mackay, T. F., Stone, E. A., and Ayroles, J. F. (2009). The genetics of quantitative traits: challenges and prospects. Nat. Rev. Genet. 10, 565–572. doi: 10.1038/nrg2612
McGrath, J. M., Betzelberger, A. M., Wang, S., Shook, E., Zhu, X. G., Long, S. P., et al. (2015). An analysis of ozone damage to historical maize and soybean yields in the United States. Proc. Natl. Acad. Sci. U.S.A. 112, 14390–14395. doi: 10.1073/pnas.1509777112
Miller, J. E., Heagle, A. S., Vozzo, S. F., Philbeck, R. B., and Heck, W. W. (1989). Effects of ozone and water-stress, separately and in combination, on soybean yield. J. Environ. Qual. 18, 330–336. doi: 10.2134/jeq1989.00472425001800030016x
Mills, G., Sharps, K., Simpson, D., Pleijel, H., Broberg, M., Uddling, J., et al. (2018). Ozone pollution will compromise efforts to increase global wheat production. Glob. Chang. Biol. 24, 3560–3574. doi: 10.1111/gcb.14157
Morgan, P. B., Bernacchi, C. J., Ort, D. R., and Long, S. P. (2004). An in vivo analysis of the effect of season-long open-air elevation of ozone to anticipated 2050 levels on photosynthesis in soybean. Plant Physiol. 135, 2348–2357. doi: 10.1104/pp.104.043968
Pachauri, R. K., Allen, M. R., Barros, V. R., Broome, J., Cramer, W., Christ, R., et al. (2014). Climate Change 2014: Synthesis Report. Contribution of Working Groups I, II and III to the fifth assessment report of the Intergovernmental Panel on Climate Change (IPCC), 151.
Perez, I. B., and Brown, P. J. (2014). The role of ROS signaling in cross-tolerance: from model to crop. Front. Plant Sci. 5, 1–6. doi: 10.3389/fpls,.2014.00754
R Core Team (2015). R: A Language and Environment for Statistical Computing. Vienna: R Foundation for Statistical Computing.
Rao, M. V., and Davis, K. R. (1999). Ozone-induced cell death occurs via two distinct mechanisms in Arabidopsis: the role of salicylic acid. Plant J. 17, 603–614. doi: 10.1046/j.1365-313X.1999.00400.x
Rao, M. V., and Davis, K. R. (2001). The physiology of ozone induced cell death. Planta 213, 682–690.
Rao, M. V., Lee, H. I., Creelman, R. A., Mullet, J. E., and Davis, K. R. (2000). Jasmonic acid signaling modulates ozone-induced hypersensitive cell death. Plant Cell 12, 1633–1646. doi: 10.1105/tpc.12.9.1633
Remold, S. K., and Lenski, R. E. (2004). Pervasive joint influence of epistasis and plasticity on mutational effects in Escherichia coli. Nat. Genet. 36, 423–437. doi: 10.1038/ng1324
Rodgers-Melnick, E., Bradbury, P. J., Elshire, R. J., Glaubitz, J. C., Acharya, C. B., Mitchell, S. E., et al. (2015). Recombination in diverse maize is stable, predictable, and associated with genetic load. Proc. Natl. Acad. Sci. U.S.A. 112, 3823–3828. doi: 10.1073/pnas.1413864112
Shi, G., Yang, L., Wang, Y., Kobayashi, K., Zhu, J., Tang, H., et al. (2009). Impact of elevated ozone concentration on yield of four Chinese rice cultivars under fully open-air field conditions. Agric. Ecosyst. Environ. 131, 178–184. doi: 10.1016/j.agee.2009.01.009
Street, N. R., James, T. M., James, T., Mikael, B., Jaakko, K., Mark, B., et al. (2011). The physiological, transcriptional and genetic responses of an ozone- sensitive and an ozone tolerant poplar and selected extremes of their F2 progeny. Environ. Pollut. 159, 45–54. doi: 10.1016/j.envpol.2010.09.027
Strunk, K. E., Amann, V., and Threadgill, D. W. (2004). Phenotypic variation resulting from a deficiency of epidermal growth factor receptor in mice is caused by extensive genetic heterogeneity that can be genetically and molecularly partitioned. Genetics 167, 1821–1832. doi: 10.1534/genetics.103.020495
Tang, H., Liu, G., Han, Y., Zhu, J., and Kobayashi, K. (2011). A system for free-air ozone concentration elevation with rice and wheat: control performance and ozone exposure regime. Atmos. Environ. 45, 6276–6282. doi: 10.1016/j.atmosenv.2011.08.059
Tsukahara, K., Sawada, H., Kohno, Y., Matsuura, T., Mori, I. C., Terao, T., et al. (2015). Ozone-induced rice grain yield loss is triggered via a change in panicle morphology that is controlled by ABERRANT PANICLE ORGANIZATION 1 gene. PLoS ONE 10:e0123308. doi: 10.1371/journal.pone.0123308
Tsukahara, K., Sawada, H., Matsumura, H., Kohno, Y., and Tamaoki, M. (2013). Quantitative trait locus analyses of ozone-induced grain yield reduction in rice. Environ. Exp. Bot. 88, 100–106. doi: 10.1016/j.envexpbot.2011.12.012
Ueda, Y., Siddique, S., and Frei, M. (2015). A novel gene, OZONE-RESPONSIVE APOPLASTIC PROTEIN1, enhances cell death in ozone stress in rice. Plant physiol. 169, 873–889.
Van Dingenen, R., Dentener, F. J., Raes, F., Krol, M. C., Emberson, L., and Cofala, J. (2009). The global impact of ozone on agricultural crop yields under current and future air quality legislation. Atmos. Environ. 43, 604–618. doi: 10.1016/j.atmosenv.2008.10.033
Wang, Y., Arenas, C. D., Stoebel, D. M., and Cooper, T. F. (2013). Genetic background affects epistatic interactions between two beneficial mutations. Biol. Lett. 9:20120328. doi: 10.1098/rsbl.2012.0328
Yendrek, C., Tomaz, T., Montes, C. M., Cao, Y., Morse, A. M., Brown, P. J., et al. (2017). High-throughput phenotyping of maize leaf physiology and biochemistry using hyperspectral reflectance. Plant Physiol. 173, 614–626. doi: 10.1104/pp.16.01447
Yendrek, C. R., Erice, G., Montes, C. M., Tomaz, T., Sorgini, C. A., Brown, P. J., et al. (2017). Elevated ozone reduces photosynthetic carbon gain by accelerating leaf senescence of inbred and hybrid maize in a genotype-specific manner. Plant Cell Environ. 40, 3088–3100. doi: 10.1111/pce.13075
Keywords: maize, tropospheric ozone (O3), FACE technology, QTL mapping, global climate change
Citation: Sorgini CA, Barrios-Perez I, Brown PJ and Ainsworth EA (2019) Examining Genetic Variation in Maize Inbreds and Mapping Oxidative Stress Response QTL in B73-Mo17 Nearly Isogenic Lines. Front. Sustain. Food Syst. 3:51. doi: 10.3389/fsufs.2019.00051
Received: 10 April 2019; Accepted: 17 June 2019;
Published: 04 July 2019.
Edited by:
Kent Oliver Burkey, Agricultural Research Service, United States Department of Agriculture, United StatesReviewed by:
Yoshiaki Ueda, The University of Tokyo, JapanShawn Christensen, United States Department of Agriculture (USDA), United States
Md Ashrafuzzaman, Shahjalal University of Science and Technology, Bangladesh
Copyright © 2019 Sorgini, Barrios-Perez, Brown and Ainsworth. This is an open-access article distributed under the terms of the Creative Commons Attribution License (CC BY). The use, distribution or reproduction in other forums is permitted, provided the original author(s) and the copyright owner(s) are credited and that the original publication in this journal is cited, in accordance with accepted academic practice. No use, distribution or reproduction is permitted which does not comply with these terms.
*Correspondence: Elizabeth A. Ainsworth, TGlzYS5BaW5zd29ydGhAYXJzLnVzZGEuZ292