 Alison Heslin1,2*
 Michael J. Puma1,2
 Philippe Marchand3
 Joel A. Carr4
 Jampel Dell'Angelo5
 Paolo D'Odorico6Jessica A. Gephart7
 Matti Kummu8
 Miina Porkka9
 Maria Cristina Rulli10
 David A. Seekell11
 Samir Suweis12
 Alessandro Tavoni13
- 1Center for Climate Systems Research, Earth Institute, Columbia University, New York, NY, United States
- 2NASA Goddard Institute for Space Studies, New York, NY, United States
- 3Institut de Recherche sur les Forêts, Université du Québec en Abitibi-Témiscamingue, Rouyn-Noranda, QC, Canada
- 4Department of Environmental Sciences, University of Virginia, Charlottesville, VA, United States
- 5Institute for Environmental Studies (IVM), Vrije Universiteit Amsterdam, Amsterdam, Netherlands
- 6Department of Environmental Science, Policy, and Management, University of California, Berkeley, Berkeley, CA, United States
- 7Department of Environmental Science, American University, Washington, DC, United States
- 8Water and Development Research Group, Aalto University, Espoo, Finland
- 9Stockholm Resilience Centre and Bolin Centre for Climate Research, Stockholm University, Stockholm, Sweden
- 10Department of Civil and Environmental Engineering, Politecnico di Milano, Milan, Italy
- 11Department of Ecology and Environmental Science, Umeå University, Umeå, Sweden
- 12Department of Physics and Astronomy, University of Padova, Padova, Italy
- 13Department of Economics, University of Bologna, Bologna, Italy
Higher temperatures expected by midcentury increase the risk of shocks to crop production, while the interconnected nature of the current global food system functions to spread the impact of localized production shocks throughout the world. In this study, we analyze the global potential impact of a present-day event of equivalent magnitude to the US Dust Bowl, modeling the ways in which a sudden decline in US wheat production could cascade through the global network of agricultural trade. We use observations of country-level production, reserves, and trade data in a Food Shock Cascade model to explore trade adjustments and country-level inventory changes in response to a major, multiyear production decline. We find that a 4-year decline in wheat production of the same proportional magnitude as occurred during the Dust Bowl greatly reduces both wheat supply and reserves in the United States and propagates through the global trade network. By year 4 of the event, US wheat exports fall from 90.5 trillion kcal before the drought to 48 trillion to 52 trillion kcal, and the United States exhausts 94% of its reserves. As a result of reduced US exports, other countries meet their needs by leveraging their own reserves, leading to a 31% decline in wheat reserves globally. These findings demonstrate that an extreme production decline would lead to substantial supply shortfalls in both the United States and in other countries, where impacts outside the United States strongly depend on a country's reserves and on its relative position in the global trade network.
Introduction
Food production is vulnerable to climate change and associated extreme weather events. Crops are highly sensitive to temperature, rainfall, and soil characteristics, which means that production is likely to decline during periods of drought, heavy rainfall, and extreme temperature, and any resultant flooding, pest outbreaks, or erosion events (Lobell et al., 2011; Wheeler and von Braun, 2013; Sundström et al., 2014; Pacetti et al., 2017). Livestock are also vulnerable to extreme events such as heat stress, which affects production levels and animal health (Nardone et al., 2010; Renaudeau et al., 2012), and rainfall variability, which impacts pastures, forage crops, and feed grain production (Henry et al., 2012). Furthermore, both marine and inland fisheries are impacted by climate, with increased ocean temperatures changing the distribution and health of fish species (Brander, 2007; Bell et al., 2013) and rainfall and temperature shifting the spatial distribution and timing of migration and spawning of inland fish (Lynch et al., 2016).
The tight coupling between environmental conditions and food production yields makes it essential to understand the impacts of sudden disruptions, or shocks, to the production of crops, livestock, and fish. Environmental shock events have increased in frequency since the 1970s (Gephart et al., 2017; Cottrell et al., 2019), with local to global impacts. Shocks affect local food security by damaging or destroying agricultural infrastructure and assets, including standing crops, livestock, farming equipment, and fishing boats (FAO, 2015). Subsequent decreases in crop, livestock, and fishery production directly threaten subsistence consumption and can lead to local food price spikes. Resultant reductions of income and loss of livelihoods serve to amplify these impacts (FAO, 2015).
In addition to local outcomes, the effects of production shocks can propagate in the international food trade network, as countries seek to minimize losses in their food supply. In 2010, the Asia-Pacific Economic Cooperation (APEC) ministers declared that trade “plays a key role in achieving food security” (APEC, 2010). While international trade generally enhances food availability (Porkka et al., 2013) by increasing the diversity of food supplies (Kearney, 2010) and helping to buffer the impacts of local resource deficits and production shocks (Allan, 1998; Porkka et al., 2017), trade also serves to expose populations to food production disruptions globally. Increased trade has also introduced fragility to the global food system (Fader et al., 2013; Puma et al., 2015; Suweis et al., 2015), putting populations at risk not only of extreme weather events but also of the loss of resilience in the food system as a result of trade dependency, increased connectivity, and decreased modularity in the international food trade network (Suweis et al., 2015; Tu et al., 2019). Marchand et al. (2016) found that trade flows, as well as food reserves, are key factors affecting a country's exposure to production shocks; also, high reliance on imports can accentuate the risk of critical food supply losses (Gephart et al., 2016; Tamea et al., 2016).
Indeed, in 2007 and 2010, extreme local environmental conditions (e.g., droughts, extensive wildfires) and the resultant declines in regional production combined with a range of other factors, including speculation and trade restrictions, caused a spike in global food prices (Tadesse et al., 2014). Although food supply shocks are not always strongly coupled to commodity price changes, when a food supply shock does result in commodity price increases, poorer countries are at increased risk of food insecurity (Distefano et al., 2018). D'Odorico et al. (2019) raise the concern about how, under unfair policies, international trade might aggravate cross-country food inequality, but also highlight the potential that international trade has to reduce this type of inequality and become an effective tool for the fulfillment of the global right to food.
Climate Disruptions to Food Security
While the 2015 Paris Agreement aims to increase “the ability to adapt to the adverse impacts of climate change and foster climate resilience and low greenhouse gas emissions development, in a manner that does not threaten food production” (UNFCCC, 2015), scientists agree that the rapidly changing climate means that the world's food security is increasingly at risk. Global food security faces the increased frequency of extreme weather events (IPCC, 2019).
History offers numerous examples of the deleterious effects of extreme weather on food production, from the Dust Bowl in the 1930s United States to the 2011 drought in East Africa. Such severe temperature and rainfall anomalies affect agricultural production and food security within the affected regions and in contemporary extreme weather events have far reaching effects through global trade. The 2010 drought in Russia, for instance, resulted in export bans and global price increases (Wegren, 2011), and the 2012 drought in the Midwestern United States resulted in sharper increases in food prices than previous production shocks of similar magnitude (Boyer et al., 2013).
The US Dust Bowl
The US Dust Bowl of the 1930s provides a stark example of an extreme weather event's impact on US agricultural production. The “Dust Bowl” refers to a series of critical extreme events that led to steep crop yield declines and major societal impacts including human migration. Although the North American Great Plains often experience drought, the Dust Bowl event was a deviation from typical La Niña conditions (Bennett, 1938; Schubert et al., 2004b; Worster, 2004; Cook et al., 2009). Persistent, large-scale drought conditions of low rainfall and high temperatures impacted the Great Plains region, particularly the states of Kansas, Colorado, Oklahoma, Texas, and New Mexico, with distinct and intense drought events during 1930–1931, 1933–1934, and 1936 (Riebsame et al., 1991; Schubert et al., 2004b; Glotter and Elliott, 2016).
The severe weather events associated with the Dust Bowl affected major agricultural producing areas of the United States, and as such, declines in national agricultural productivity were substantial. During the 1930s, wheat and maize production declined by up to 36 and 48%, respectively, relative to the average yearly production from 1921 to 1930 (USDA, 2019b). Human-induced land degradation, in combination with the drought-induced loss of vegetation, caused large-scale dust storms while also contributing a feedback effect that further amplified the drought (Cook et al., 2009). Furthermore, high winds eroded 480 tons of topsoil per acre on average in the southern plains, degrading soil fertility and air quality in the region (Hansen and Libecap, 2004).
The consequences of the drought on food supply and environmental conditions had direct impacts on livelihoods and health, resulting in substantial migration of people from the region. Even with the return of wetter weather, the loss of topsoil slowed economic and agricultural recovery in heavily affected areas (Hornbeck, 2012). Dust Bowl–affected states experienced net population losses through the 1930s, and within affected states, the share of rural populations declined, a trend that began in the 1930s and continued throughout the twentieth century (Parton et al., 2007; McLeman et al., 2014).
Risks for Global Food Security
Following World War II, the United States shaped the postwar international food order, becoming a central player in international food aid and trade (Friedmann, 1982). Over the second half of the twentieth century, through the influence of US policies regarding grain exports, the direction of trade, particularly of grains, shifted to flow toward developing countries. Export subsidies created new markets for US agricultural goods and substantially increased the amount of food imports globally, most dramatically global imports of wheat from the United States and other developed nations (Winders, 2009). While the policies governing agricultural trade have changed over time, the United States remains central to international food trade, especially for staple commodities.
Because of the interconnected nature of the global food system and the role of the United States as a major exporter of agricultural products, disruptions to US production can have far-reaching impacts. The United States is a major exporter of staple foods, accounting for around 37, 17, and 16% of internationally traded soy, maize, and wheat, respectively, in 2013 (FAOSTAT, 2019c). From 2012 to 2016, the United States exported wheat and wheat products to 174 different countries (Figure 1) and maize and maize products to 162 countries over the same period (FAOSTAT, 2019b). Using the 2009 cereal trade network, Marchand et al. (2016) simulate the effects of production shocks in different origin countries. They found that the most substantial supply declines in trade partners are caused by shocks that induce a production drop in the United States.
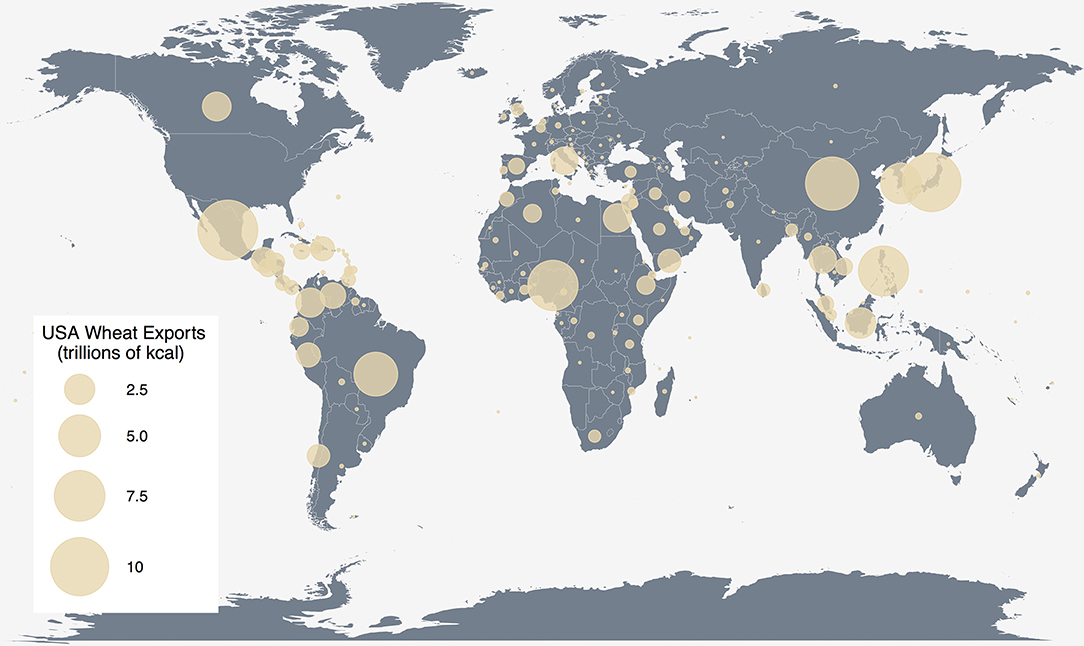
Figure 1. US wheat export destinations in trillions of kcal based on 2012–2016 yearly average from FAOSTAT detailed trade matrix.
US production of crops—particularly staple crops of wheat, maize, and soy—remains heavily centered in the Great Plains region (USDA, 2016). This region has experienced periodic drought throughout the twentieth century to present, including severe droughts in the 1950s, 1988, and 2012 (Rosenzweig et al., 2001; Schubert et al., 2004a; Hoerling et al., 2012). Agricultural production in the Great Plains shifted over the twentieth century to rely heavily on irrigation from the Ogallala aquifer, buffering the impacts of droughts on agricultural production since the Dust Bowl (Hornbeck and Keskin, 2014). However, variability in temperature and rainfall, both droughts and floods, as well as the related spread of agricultural pests and diseases, continues to affect agricultural production (Rosenzweig et al., 2001). Additionally, aquifer overexploitation occurring in the Great Plains, particularly during times of drought, threatens the ability of groundwater to continue buffering the effects of drought on American agricultural production (Scanlon et al., 2012). Given the central role of the United States in the international agricultural trade, the consequences of a large-scale production shock would extend far beyond US consumption and food security.
Quantitative studies that assess the implications of specific natural disasters on food security via food production and trade are particularly useful, yet scarce (exceptions include Puma et al., 2015; Gephart et al., 2016, and Suweis et al., 2015). Assessing the potential impact of extreme weather events not only on food production, but also on the global trade system, is critical for understanding the far-reaching effects of production shocks in a globalized economy. This article aims to contribute to the nascent literature connecting climate shocks to food supply and trade through modeling the changes in international trade and reserves in response to a Dust Bowl–sized shock on contemporary US production.
Methods
Our analysis uses historical data on global wheat production, trade, and reserves to create an initial state into which we introduce production shocks. We use the historical US Dust Bowl as a temporal analog event for US production declines (e.g., Puma and Gold, 2011). The sizes of the production declines are based on observed data of percentage declines in production during the Dust Bowl relative to a 1921–1930 baseline period, which is imposed on contemporary US production values. We then simulate the cascading effects of such a disruption through the international trade network of wheat.
Simulation Model
Similar to the model of Marchand et al. (2016), we simulate the cascading effects of a food production shock through the global food trade network using the Food Shock Cascade (FSC) model. In this model, a shortage in food supply can be either (a) absorbed at the national level (by spending reserves or reducing consumption of the particular commodity) or (b) propagated to trade partners by decreasing exports and increasing imports.
The model is initialized with a trade network that has a set of state variables defined at the national level (i.e., each node in the network): production P, reserves R, and domestic consumption C, as well as a trade matrix F, where Fij is the quantity exported from country i to country j. Total exports (E) and imports (I) by country correspond, respectively, to the row and column sums of F. The production, reserves, and trade data are based on public databases (see below), whereas consumption is set to match the initial net supply (S):
We further assume that the net transfer to reserves (ΔR) is zero initially, so that C = P + I - E for all countries at the start of the simulation.
The simulation is defined as a sequence of behaviors that starts with countries with supply shortages (S < C) making attempts to resolve shortages, where the initial shortage deficit is due to a specified drop in production. In simulating the effects of the production decline, we model two different potential pathways through which countries, after first accessing their available reserves, could adjust their trade flows. In the Proportional Trade Allocation (PTA) version of the FSC model, countries adjust their imports and exports simultaneously, increasing imports from trading partners without supply shortages themselves and decreasing exports across all links by an equal proportion of existing trade on each link. In this way, countries in the FSC-PTA model divide the shock absorption between their imports and exports, transmitting shocks both upstream (by increasing imports) and downstream (by decreasing exports). These trade adjustments are relative to initial trade, capping import increases at 100% of initial trade volume. In the Reserves-based Trade Allocation (RTA) version, any country with the production shock first reduces its exports only, propagating the supply shock downstream to all receiving trade partners. At this stage, all countries with a shortage increase their imports. The level of import increases in the FSC-RTA are not based on prior trade levels, as in the PTA version, but instead based on the amount of reserves trading partners have available.
The sequence of steps for each model is detailed below. Note that the national supply and shortage status of each country is updated after each step, and each step applies only to countries with an ongoing shortage.
FSC-PTA Model
1. Countries draw from their available reserves (a model parameter set to 50% of total reserves).
2. Where shortage remains,
a. If shortage is <0.001% of domestic consumption (a model parameter), countries reduce consumption to absorb shortage.
b. If shortage is >0.001% of domestic consumption, countries reduce their exports and increase their imports from countries with available reserves by X% (where X is as high as required to absorb shortage, up to 100%).
3. Repeat from (a) until no further changes occur in the trade matrix.
4. All remaining shortages are absorbed at the national level by reducing consumption.
FSC-RTA Model
1. Countries with production shocks draw from their available reserves (a model parameter set to 50% of total reserves).
2. Where shortage remains,
a. If shortage is <0.001% of domestic consumption (a model parameter), countries reduce consumption to absorb shortage.
b. If shortage is >0.001% of domestic consumption, countries reduce their exports proportionally (same % decrease for all outgoing trade links).
3. Countries with a shortage from trade changes in (2b) draw from their available reserves
4. Where shortage remains,
a. If shortage is <0.001% of domestic consumption, countries reduce consumption to absorb shortage.
b. If shortage is >0.001% of domestic consumption, countries request additional imports from incoming trade links (see below for a description of this process).
5. Countries with a shortage from trade changes in (4b) draw from their available reserves.
6. Where shortage remains,
a. If shortage is <0.001% of domestic consumption, countries reduce consumption to absorb shortage.
b. If shortage is <0.001% of domestic consumption, countries reduce their exports proportionally (same % decrease for all outgoing trade links).
7. Repeat from (3) until no further changes occur in the trade matrix.
8. All remaining shortages are absorbed at the national level by reducing consumption.
The consumption reduction steps were introduced to allow for very small shortages (0.001% of domestic consumption) to be absorbed locally rather than propagated through the network.
The process by which countries with a shortage can increase imports (step (4b) in FSC-RTA) is modeled as follows:
i. For each country, define the additional imports needed (= current shortage) or the amount available for additional exports (set as 20% of current reserves).
ii. Countries with available amounts offer them to importers with unmet need, proportionally to the existing quantity traded on each link.
iii. If step (ii) results in a requesting country receiving more than they need, they accept the same fraction of all offers to obtain needed amount.
iv. Repeat from (i) until all needs are met or all available amounts have been allocated.
For simulations of multiyear shocks, as in the Dust Bowl analog event, subsequent runs of the model use initial country-level production P and consumption C, as well as the initial trade matrix F. Reserve levels R are updated to reflect the declines in reserves from the previous model run.
From simulations of production shocks, we use changes in reserve levels to calculate the stocks-to-use (STU) ratio both globally and by country as a measure of the risk to food security from such shocks. The STU ratio indicates the quantity of reserve crop relative to the demand, calculated in our analysis as the total available reserves over the initial consumption needs:
Data
The initial state of the trade network into which Dust Bowl–size production anomalies are introduced is created from observed data of production, reserves, and trade over the 5-year period from 2012 to 2016. Production and bilateral trade data come from the FAOSTAT online database (FAOSTAT, 2019a,b). Wheat production values are converted from metric tons (MT) to kcal by commodity-specific calorie conversions (FAO, 2019) and averaged over 2012 to 2016 to smooth yearly fluctuations. Wheat trade data are aggregated for wheat and six wheat commodities by converting each to kcal and summing the values. The sum is assigned to a specific directed country-pair forming a weighted and directed network, where values are associated with each network link, and the links connect nodes in a specific direction (see Konar et al., 2011 for additional example). The weights are based on mean traded values over a 5-year interval to account for the dynamic nature of the trade network, proportioning the trade along links according to how active countries are within the 5-year period.
We obtain country-level wheat reserve data from the USDA Foreign Agricultural Service—Production, Supply, and Distribution database, using the mean “ending stocks” of wheat from 2012 to 2016 (USDA, 2019a). The USDA reserves data provide one aggregate value of wheat reserves for the European Union, which we apportion to European Union member countries proportional to their wheat production over the same time period.
To simulate the effects of a Dust Bowl–size production shock, we use historical data of wheat production from the USDA National Agricultural Statistics Service (USDA, 2019b). The values of production loss used in the simulation correspond to the percentage change in the production of wheat during the height of the Dust Bowl effects on wheat production: 1933, 1934, 1935, and 1936 (highlighted in red in Figure 2). The percent decline introduced into the model is calculated from the observed production each year relative to a baseline of the average yearly production in the decade preceding the Dust Bowl, 1921–1930 (Table 1).
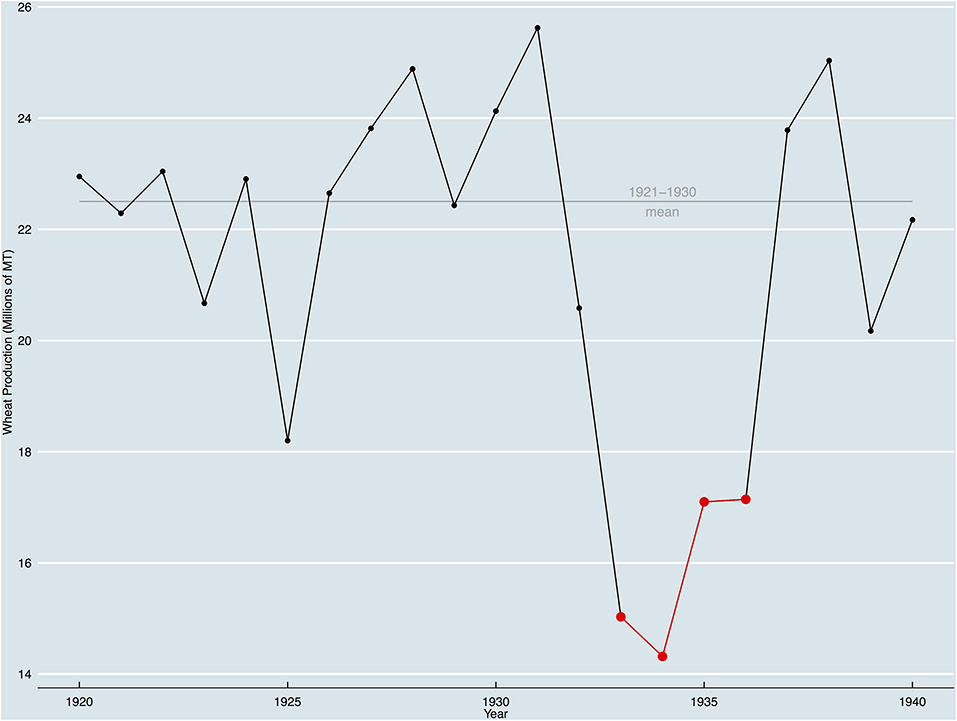
Figure 2. US wheat production from 1920 to 1940 in metric tons based on data from the USDA National Agricultural Statistics Service (USDA, 2019b).
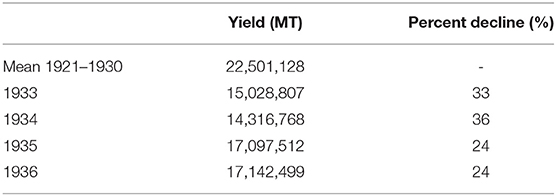
Table 1. US Dust Bowl Wheat Production USDA National Agricultural Statistics Service.
Results
We use the software R (R Core Team, 2019) to perform all data processing and simulations of the FSC model. Results from two model versions (the FSC-PTA model and the FSC-RTA model) are reported below, corresponding to two alternative ways that we propose countries could adjust trade flows in response to global supply shocks.
Global Effects
In simulating a US Dust Bowl–sized production shock, we introduce a decline in US wheat production for 4 consecutive years, keeping all other countries' production at their initial level. The initial production level of wheat for the United States, equal to the yearly mean from 2012 to 2016 observed production data, is 196 trillion kcal, or 58.7 million MT. In the first year of the Dust Bowl, US wheat production declined by 33%, equivalent to a contemporary supply shortage of 64.7 trillion kcal. Production declines peaked at 36% in year 2, leading to a shortage in our model of slightly over 70 trillion kcal. Years 3 and 4 experienced equal shock sizes of 24%, a shortage of 47 trillion kcal when applied to contemporary US production.
A production decline of this magnitude has major effects both domestically in the United States and internationally because of the central role of the United States in global wheat trade. In the initial state of the model, based on 2012–2016 observed data, the United States is the world's largest exporter of wheat and wheat products, exporting more than 90 trillion kcal a year on average to a total of 174 countries out of the 217 countries in the trade network. In addition, the United States is the 12th largest importer of wheat and wheat products, importing more than 15 trillion kcal per year. In the FSC-PTA model, the production decline in the United States is transmitted equally to countries to import and export partners, drawing more imports and reducing exports. With this model, in year 4 of the simulation, US wheat exports fall to 53.4 trillion kcal, and imports increase to 19 trillion kcal, moving the United States to the eighth largest importer of wheat globally. In the FSC-RTA model, after accessing available reserves, the United States addresses additional shortages by decreasing exports, resulting in US exports declining to 48.3 trillion kcal, whereas imports remain unchanged. For both model versions, the United States drops from the largest wheat exporter to the fifth largest exporter behind Canada, Russia, France, and Australia.
Table 2 presents key network metrics of the global wheat trade for the undisturbed trade network and at the end of the 4-year simulation for both the FSC-PTA and FSC-RTA models. The node degree is the number of trade partners of each country, a metric that indicates how central a node (i.e., country) is to the network (e.g., Konar et al., 2011). Node strength is the weight (in kilocalories) assigned to each link in the network. For both node degree and strength, we then distinguish among (1) the undirected node degree (k) and strength (s), (2) the outgoing or exporting node degree (kout) and strength (sout), and (3) the incoming or importing node degree (kin) and strength (sin). The changes in connectivity associated with each model version are significantly different. While both models lead to reductions in trade flows (as indicated by the six “strength” metrics), the FSC-RTA version does not have any changes to unweighted network connectivity (i.e., the number of links and “degree” metrics). Specifically, the FSC-RTA version maintains trade linkages, even though trade flows are reduced. In contrast, we find notable reductions in connectivity with the FSC-PTA version.
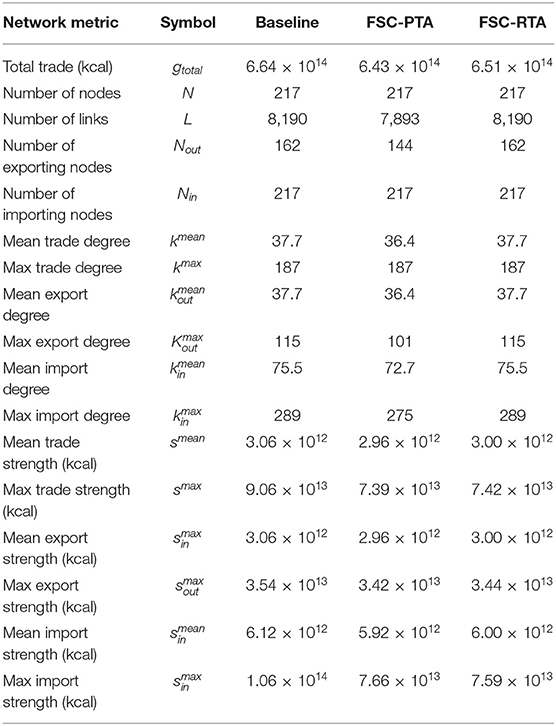
Table 2. Global wheat network metrics for the baseline state and after 4 years of simulation for the FSC-PTA model and the FSC-RTA model.
The central initial role of the United States in the global trade network causes large impacts on global reserves. As countries fill shortfalls in supply by accessing their wheat reserves (up to 50% per year), wheat reserves globally decline over the simulation by 229 trillion kcal, or 68.5 million MT. This is a loss of 31% of global wheat stocks over a 4-year period. The declines in reserves are captured in a decrease in the global STU ratio over the simulations. The global preshock STU ratio is 0.307, which means that before the production shock country reserves are 30.7% of global annual consumption needs. Following the 4-year production declines in the United States, the global STU decreases to 0.212, or 21.2% of global consumption.
In both model versions, when countries are unable to fill shortages through reserves or trade reallocation, they reduce consumption. Consumption reductions in the FSC-PTA total 10.5 billion kcal, and the FSC-RTA model, total 150 million kcal. In the event of subsequent year production declines or concurrent production shocks globally, in which reserve levels further decline, sharp decreases in consumption would follow. As it stands, initial reserve levels are sufficiently high to shield the global food system from significant consumption declines.
Country-Level Effects
At the country level, vulnerability to supply shocks and the ability to shield those shocks from impacting domestic consumption depend heavily on the initial quantity of reserves held by the country, as well as the trade links from which to receive a shock and upon which to draw additional supply. Of the 131 countries with wheat reserves in the initial state, all 131 used some portion of their reserves in response to the US shortage. Fifty-two countries used more than 75% of their reserves under FSC-PTA model assumptions, and 36 countries used more than 75% of their reserves in the FSC-RTA model, over the 4 years simulated (Figure 3). The United States, where the shock originated, fully utilized the 50% of reserves available at each year iteration before adjusting trade, resulting in a 93.75% total reduction in reserves over 4 years. An additional 16 and 17 countries maximally reduced their reserves with the FSC-PTA and FSC-RTA, respectively.
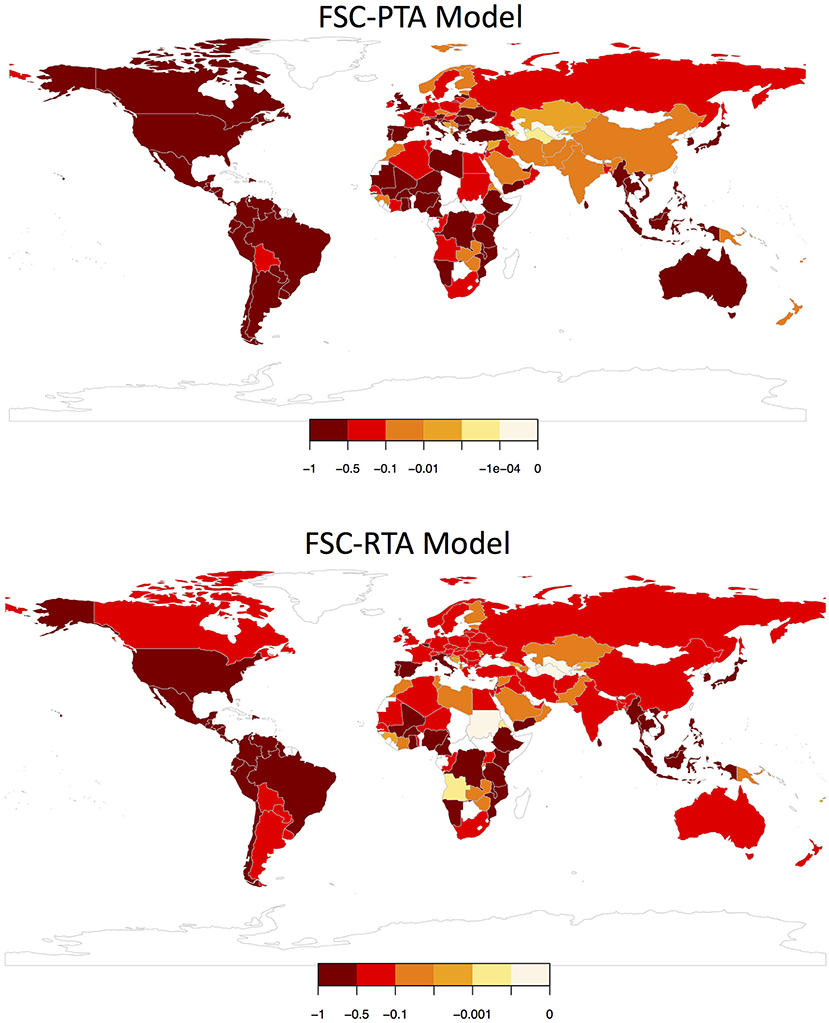
Figure 3. Total fractional change in reserves relative to initial reserves for the FSC-PTA and FSC RTA models.
Accordingly, the STU ratio declined substantially in many countries. Of those countries with nonzero initial STU (i.e., countries with initial reserves), countries' STU ratios declined on average 0.085 (FSC-PTA model) and 0.067 (FSC-RTA model). The 10 countries with the highest initial reserves, serving a critical role in absorbing shortages, experienced mean STU ratio declines of 0.219 in the FSC-PTA and 0.145 in the FSC-RTA model (Table 3). In the FSC-PTA, countries access their reserves to meet new trade demands relative to their existing trade levels with partner countries with a maximum of 100% increase to trade flows on a given link. In the FSC-RTA, countries will change trade relative to their reserve levels, accessing up to 20% of their reserves to meet increased demands from trade partners. Depending on the initial levels of trade, reserves, and consumption, as well as existing levels of trade with the United States, these alternative systems of trade reallocation result in differences in STU change between the two models.
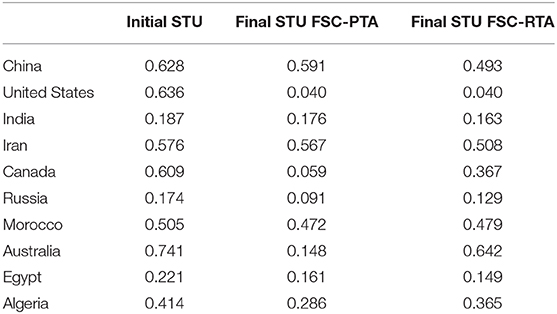
Table 3. Stocks to use in highest reserves countries.
Countries without reserves to buffer the effects of a shortage turn directly to trade adjustments followed by consumption declines to address the supply shock. Given the high initial starting point of global reserves, most supply shocks, even in countries without reserves, could be addressed through trade flow adjustments. Total decreases in consumption only exceeded the yearly 0.001% of supply threshold (which the models deduct from consumption rather than adjusting trade flows) in six countries in the FSC-PTA model and one country in the FSC-RTA model. Countries experiencing any consumption declines over the 4 years, both above and below the threshold, are shown in Figure 4.
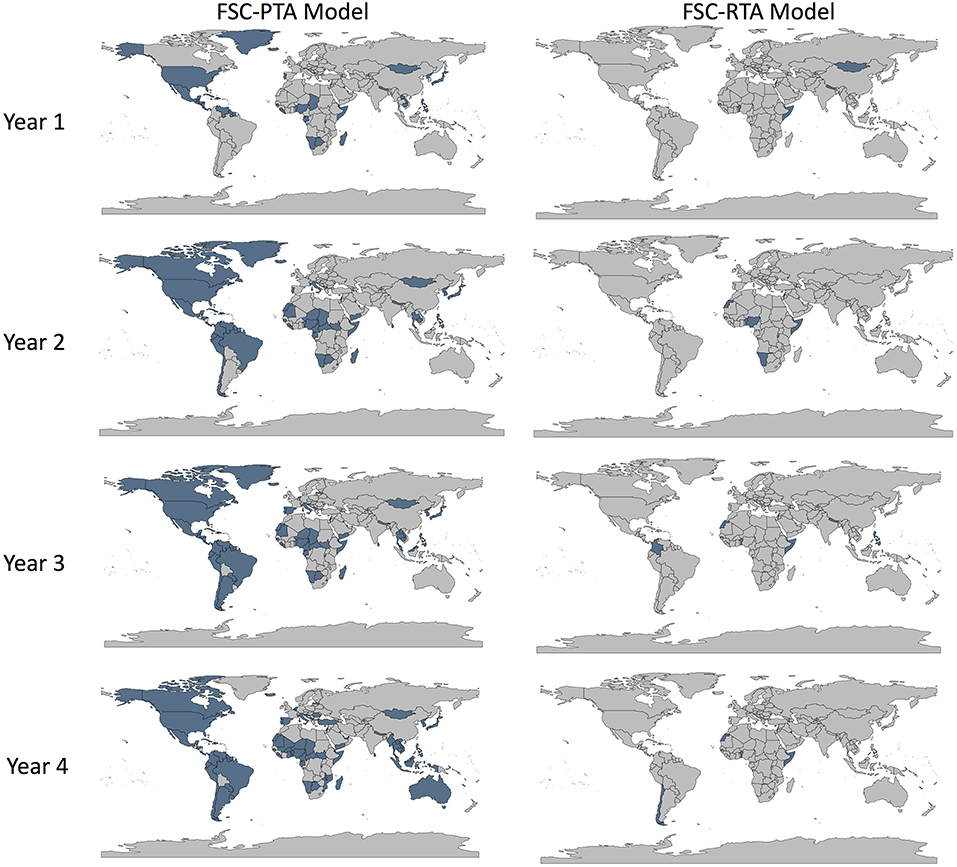
Figure 4. Countries with consumption declines from shock to US wheat production using the FSC-PTA and FSC-RTA models.
Discussion
In this study, we simulate the effects of a hypothetical multiyear production decline in US wheat production of equal magnitude to that which occurred during the US Dust Bowl of the 1930s. Historical data on crop yield in the United States provided the percentage of wheat lost during the height of the Dust Bowl relative to the prior decade baseline. Introducing shocks of this size into consecutive years of contemporary US production affects both US reserves and those of its trading partners.
We used two different model versions for the simulations, representing two potential pathways through which countries may adapt to shortages in supply. In both model versions, countries with shortages first draw from available reserves before adjusting their trade flows. Differences in trade reallocation affect the outcomes of the simulation for particular countries, while the overall post-shock picture is similar. In the FSC-PTA model, shocked countries decrease exports and increase imports simultaneously by an equal percentage of existing flows (as in Marchand et al., 2016). In FSC-RTA model, countries with production shocks first decrease their exports, after which countries that received supply shortages from trade changes increase imports from their other trade partners. In both model versions, countries increase and decrease trade flows on existing trade links, without establishing new trade partners. The FSC-RTA model introduced a more flexible trade reallocation that was not based on prior trade volume but instead on a percentage of the trade partners' available food stocks. With this simulation model, up to 20% of reserves could be offered to trade partners facing a shortage regardless of the prior trade flow with those partners. Because of this 20% cap on reserve use for trade, the distribution of reserve declines globally changes, whereas the overall reductions in global reserves are the same.
In the 4-year simulation, >30% of global wheat reserves are used in order to meet demand, with reserve decreases in every country holding wheat reserves in the initial state of the model. While countries may turn to trade as a means to address food insecurity domestically, trade exposes countries to foreign production shocks. Asia-Pacific Economic Cooperation countries, for instance, in their 2010 Ministerial Meeting on Food Security outlined the importance of globalization and open trade for ensuring access to food (APEC, 2010). In the initial period, APEC countries (excluding the United States) imported 150 trillion kcal of wheat per year and had a mean country STU ratio of 0.27 (ΣSTU0/n) and a total overall STU ratio of 0.48 (ΣR0/ΣC0). After the 4-year simulation, the mean country STU ratio in APEC countries (excluding the United States) fell from 0.27 to 0.08 (FSC-PTA model) and 0.12 (FSC-RTA model), and the total STU ratio fell from the initial 0.48 to 0.37 (FSC-PTA model) and 0.35 (FSC-RTA model). Although trade may serve to supplement domestic production and increase food security, it also exposes these populations to supply shocks in the United States, reducing regional wheat stocks by approximately 25%.
While countries throughout the trade network are affected by the cascading shock, the initial level of US wheat reserves decreases the effects of the shock on US trade partners' reserves and consumption. The United States in the initial state has the second largest wheat stocks in the world, and, by addressing production shocks first through reserves, the supply shortages passed from the United States into the global market are lower than in a scenario in which the United States has limited reserves. In absorbing so much of the shock domestically, the United States depletes nearly all of its wheat reserves. The decreases in post-shock levels of reserves, both in the United States and globally, have consequences for future shocks and global prices. Stocks-to-use ratios correlate more closely with global prices than production data (Bobenrieth et al., 2013). Such correlation implies that the effects of an extreme event on the global market may persist beyond production recovering in the form of price spikes and volatility due to a lower STU ratio. With lower global reserves of wheat, prices would be more volatile in response to subsequent production fluctuations throughout the global system (Wright and Cafiero, 2011). In addition to the role of reserves in influencing price increases, large demand surges in the trade network are also shown to increase global prices (Headey, 2011).
While our model and results have implications for the prices of such globally traded commodities, our simulation does not account for such changes in global prices when adjusting trade volumes. We recognize that changes in prices would likely affect the extent to which countries could increase imports during times of shortages, which, therefore, represents a limitation of the model. In such a scenario of increased prices, we would also expect consumption declines above those in our simulations. Additionally, the models function such that all countries with sufficient reserves are willing to increase exports to their trade partners with supply shortages. This does not account for other actor responses, such as hoarding, or for preferential trade relationships beyond those reflected in the initial trade volume on each link.
Importantly, we note that any changes to food production, trade, and reserves will lead to impacts that extend beyond reducing exposure to global food shocks. Indeed, a range of negative impacts are possible, including increased depletion of local water resources, reduced ecosystem services, larger rates of food spoilage, and increased exposure to local climate extremes. It is therefore essential not to consider “food self-sufficiency” as a binary decision; rather, it is a continuum where countries need to take a nuanced view, balancing trade-offs to identify the optimal solution for their context (Clapp, 2017).
Conclusion
Given the level of contemporary international trade in staple agricultural products, such as wheat, production declines in major exporting countries can have major consequences on the global food system. This study provides an example scenario of a production decline analogous to what occurred during the multiyear extreme weather event of the Dust Bowl, modeling the effects on global trade, reserves, and consumption. In our simulations, the United States nearly depletes its reserves and passes the shortage along to its many trading partners by decreasing exports.
Following such an extreme production decline, US consumption and trade partners are at increased risk of future production shocks, given the near-total depletion of reserves. In addition to the potential effects on future consumption, a severe production shock itself can have lasting impacts on producers from lost income and damaged cropland. Outside the directly impacted country, trade partners affected by reduced imports or increased export demands access reserves to address their supply shortages, also becoming more vulnerable to future shocks due to the lack (or reduction) of a buffer to insulate the population from future supply declines. Countries' strategic need for reserves to protect against future production and trade shocks may prompt increased import demands, decreased exports, or increased domestic production in the following years to replenish depleted grain stocks. Such production and trade changes carry economic and environmental consequences.
The Dust Bowl simulation, while a massive reduction in production levels, directly affected only one country, which began with comparatively high levels of reserves. With increasing global temperatures, the likelihood of simultaneous production losses in major producing countries increases (Tigchelaar et al., 2018). In such an event, with multiple producing countries decreasing exports, the trade system would exhaust available reserves, and countries would face consumption declines.
We use the example of the US Dust Bowl to model the effects of a contemporary shock of equivalent production declines; however, our approach can be applied to any shock scenario to test the resilience of the trade network and identify potential weaknesses in it. Simulating the effects of such production losses in different producing areas of the world can help in identifying vulnerabilities of food supply to extreme events and target reserve levels to protect populations from food supply crises.
Data Availability Statement
The datasets analyzed for this study can be found at FAOSTAT (http://www.fao.org/faostat/en/#data), the USDA Foreign Agricultural Service, Production Supply and Distribution (https://apps.fas.usda.gov/psdonline/app/index.html#/app/downloads), and the USDA National Agricultural Statistics Service (http://quickstats.nass.usda.gov/results/7AC5D32C-7149-3BC8-B661-34EE5F89645D?pivot=short_desc).
Author Contributions
AH and MJP conceived the study. AH and PM worked on the computational framework and code with input from MJP and JG. AH performed the calculations and analyzed the data with input from MJP and PM. AH wrote the manuscript with input from MJP, PM, JC, JD'A, PD'O, JG, MK, MP, MR, DS, SS, and AT.
Funding
The work reported here was funded by the Army Research Office under the Multidisciplinary University Research Initiative (Grant #W911NF1810267). The views and interpretations expressed in this document are those of the authors and should not be attributed to the US Army. Additional funding was received from European Research Council (ERC) under the European Union's Horizon 2020 research and innovation programme (grant agreement No. 819202). DS receives support from the Knut and Alice Wallenberg Foundation.
Conflict of Interest
The authors declare that the research was conducted in the absence of any commercial or financial relationships that could be construed as a potential conflict of interest. The handling Editor declared a past co-authorship with the MJP, PD'O, MK, and MP.
Acknowledgments
This paper was based on original model development supported by the National Socio-Environmental Synthesis Center (SESYNC) with funding received from the National Science Foundation DBI-1052875.
References
Allan, J. A. (1998). Virtual water: a strategic resource global solutions to regional deficits. Groundwater 36, 545–546. doi: 10.1111/j.1745-6584.1998.tb02825.x
APEC (2010). 2010 APEC Ministerial Meeting on Food Security. Niigata: Asia-Pacific economic cooperation. Available online at: https://www.apec.org/Meeting-Papers/Sectoral-Ministerial-Meetings/Food-Security/2010_food (accessed October 15, 2019).
Bell, J. D., Ganachaud, A., Gehrke, P. C., Griffiths, S. P., Hobday, A. J., Hoegh-Guldberg, O., et al. (2013). Mixed responses of tropical pacific fisheries and aquaculture to climate change. Nat. Clim. Change 3, 591–599. doi: 10.1038/nclimate1838
Bennett, H. H. (1938). Emergency and permanent control of wind erosion in the great plains. Sci. Monthly 47, 381–399.
Bobenrieth, E., Wright, B., and Zeng, D. (2013). Stocks-to-use ratios and prices as indicators of vulnerability to spikes in global cereal markets. Agr. Econ. 44, 43–52. doi: 10.1111/agec.12049
Boyer, J. S., Byrne, P., Cassman, K. G., Cooper, M., Delmer, D., Greene, T., et al. (2013). The U.S drought of 2012 in perspective: a call to action. Glob. Food Secur. 2, 139–143. doi: 10.1016/j.gfs.2013.08.002
Brander, K. M. (2007). Global fish production and climate change. Proc. Natl. Acad. Sci. U.S.A. 104, 19709–19714. doi: 10.1073/pnas.0702059104
Clapp, J. (2017). Food self-sufficiency: making sense of it, and when it makes sense. Food Policy 66, 88–96. doi: 10.1016/j.foodpol.2016.12.001
Cook, B. I., Miller, R. L., and Seager, R. (2009). Amplification of the North American ‘dust bowl' drought through human-induced land degradation. Proc. Natl. Acad. Sci U.S.A. 106, 4997–5001. doi: 10.1073/pnas.0810200106
Cottrell, R. S., Nash, K. L., Halpern, B. S., Remenyi, T. A., Corney, S. P., Fleming, A., et al. (2019). Food production shocks across land and sea. Nat. Sust. 2, 130–137. doi: 10.1038/s41893-018-0210-1
Distefano, T., Laio, F., Ridolfi, L., and Schiavo, S. (2018). Shock transmission in the international food trade network. PLoS ONE 13:E0200639. doi: 10.1371/journal.pone.0200639
D'Odorico, P., Carr, J. A., Davis, K. F., Dell'Angelo, J., and Seekell, D. A. (2019). Food inequality, injustice, and rights. Bioscience 69, 180–190. doi: 10.1093/biosci/biz002
Fader, M., Gerten, D., Krause, M., Lucht, W., and Cramer, W. (2013). Spatial decoupling of agricultural production and consumption: quantifying dependences of countries on food imports due to domestic land and water constraints. Environ. Res. Lett. 8:014046. doi: 10.1088/1748-9326/8/1/014046
FAO (2015). The Impact of Natural Hazards and Disasters on Agriculture, Food Security, and Nutrition. Rome: Food and Agriculture Organization of the United Nations.
FAO (2019). Nutritive Factors. Food and Agriculture Organization of the United Nations. Available online at: http://www.fao.org/economic/the-statistics-division-ess/publications-studies/publications/nutritive-factors/en/ (accessed October 15, 2019).
FAOSTAT (2019a). Crops. Food and Agriculture Organization of the United Nations. Available online at: http://www.fao.org/faostat/en/#data/QC (accessed October 15, 2019).
FAOSTAT (2019b). Detailed Trade Matrix. Food and Agriculture Organization of the United Nations. Available online at: http://www.fao.org/faostat/en/#data/TM (accessed October 15, 2019).
FAOSTAT (2019c). Food Balance Sheet. Food and Agriculture Organization of the United Nations. Available online at: http://www.fao.org/faostat/en/#data/FBS/metadata (accessed October 15, 2019).
Friedmann, H. (1982). The political economy of food: the rise and fall of the postwar international food order. Am. J. Sociol. 88, S248–S286. doi: 10.1086/649258
Gephart, J. A., Deutsch, L., Pace, M. L., Troell, M., and Seekell, D. A. (2017). Shocks to fish production: identification, trends, and consequences. Glob. Environ. Change 42, 24–32. doi: 10.1016/j.gloenvcha.2016.11.003
Gephart, J. A., Rovenskaya, E., Dieckmann, U., Pace, M. L., and Brännström, A. (2016). Vulnerability to shocks in the global seafood trade network. ERL 11:035008. doi: 10.1088/1748-9326/11/3/035008
Glotter, M., and Elliott, J. (2016). Simulating US agriculture in a modern dust bowl drought. Nat. Plants 3:16193. doi: 10.1038/nplants.2016.193
Hansen, Z. K., and Libecap, G. D. (2004). Small farms, externalities, and the dust bowl of the 1930s. J Polit. Econ. 112, 665–694. doi: 10.1086/383102
Headey, D. (2011). Rethinking the global food crisis: the role of trade shocks. Food Policy 36, 136–146. doi: 10.1016/j.foodpol.2010.10.003
Henry, B., Charmley, E., Eckard, R., Gaughan, J. B., and Hegarty, R. (2012). Livestock production in a changing climate: adaptation and mitigation research in Australia crop and pasture Science 63, 191–202. doi: 10.1071/CP11169
Hoerling, M. P., Eischeid, J. K., Quan, X. W., Diaz, H. F., Webb, R. S., Dole, R. M., et al. (2012). Is a transition to semipermanent drought conditions imminent in the U.S. Great Plains?. J. Clim. 25, 8380–8386. doi: 10.1175/JCLI-D-12-00449.1
Hornbeck, R. (2012). The enduring impact of the american dust bowl: short- and long-run adjustments to environmental catastrophe. Am. Econ. Rev. 102, 1477–1507. doi: 10.1257/aer.102.4.1477
Hornbeck, R., and Keskin, P. (2014). The historically evolving impact of the ogallala aquifer: agricultural adaptation to groundwater and drought. Am. Econ. Appl. Econ. 6, 190–219. doi: 10.1257/app.6.1.190
IPCC (2019). Climate Change and Land. Intergovernmental Panel on Climate Change. Available online at: https://www.ipcc.ch/report/srccl/ (accessed October 15, 2019).
Kearney, J. (2010). Food consumption trends and drivers. Philos. Trans. R. Soc. Lond. 365, 2793–2807. doi: 10.1098/rstb.2010.0149
Konar, M., Dalin, C., Suweis, S., Hanasaki, N., Rinaldo, A, and Rodriguez-Iturbe, I. (2011). Water for food: the global virtual water trade network. Water Resour. Res. 47, 1–17. doi: 10.1029/2010WR010307
Lobell, D. B., Schlenker, W., and Costa-Roberts, J. (2011). Climate trends and global crop production since 1980. Science 333, 616–620. doi: 10.1126/science.1204531
Lynch, A. J., Myers, B. J., Chu, C., Eby, L. A., Falke, J. A., Kovach, R. P., et al. (2016). Climate change effects on north american inland fish populations and assemblages. Fisheries 41, 346–361. doi: 10.1080/03632415.2016.1186016
Marchand, P., Carr, J. A., Dell'Angelo, J., Fader, M., Gephart, J. A., Kummu, M., et al. (2016). Reserves and trade jointly determine exposure to food supply shocks. Environ. Res. Lett. 11:095009. doi: 10.1088/1748-9326/11/9/095009
McLeman, R. A., Dupre, J., Ford, L. B., Ford, J., Gajewski, K., and Marchildon, G. (2014). What we learned from the dust bowl: lessons in science, policy, and adaptation. Popul. Environ. 35, 417–440. doi: 10.1007/s11111-013-0190-z
Nardone, A., Ronchi, B., Lacetera, N., Ranieri, M. S., and Bernabucci, U. (2010). Effects of climate changes on animal production and sustainability of livestock systems. Livestock Sci. 10th World Conference on Animal Production (WCAP), 130, 57–69. doi: 10.1016/j.livsci.2010.02.011
Pacetti, T., Caporali, E., and Rulli, M. C. (2017). Floods and food security: a method to estimate the effect of inundation on crops availability. Adv. Water Resour. 110, 494–504. doi: 10.1016/j.advwatres.2017.06.019
Parton, W. J., Gutmann, M. P., and Ojima, D. (2007). Long-term trends in population, farm income, and crop production in the great plains. BioScience 57, 737–747. doi: 10.1641/B570906
Porkka, M., Guillaume, J. H., Siebert, S., Schaphoff, S., and Kummu, M. (2017). The use of food imports to overcome local limits to growth. Earth's Future 5, 393–407. doi: 10.1002/2016EF000477
Porkka, M., Kummu, M., Siebert, S., and Varis, O. (2013). From food insufficiency towards trade dependency: a historical analysis of global food availability. PLoS ONE 8:e82714. doi: 10.1371/journal.pone.0082714
Puma, M. J., Bose, S., Chon, S. Y., and Cook, B. I. (2015). Assessing the evolving fragility of the global food system. Environ. Res. Lett. 10:024007. doi: 10.1088/1748-9326/10/2/024007
Puma, M. J., and Gold, S. (2011). Formulating Climate Change Scenarios to Inform Climate-Resilient Development Strategies: A Guidebook for Practitioners. New York, NY: United Nations Development Programme.
R Core Team (2019). R: A Language and Environment for Statistical Computing. Vienna: R Foundation for Statistical Computing. Available online at: https://www.R-project.org/
Renaudeau, D., Collin, A., Yahav, S., de Basilio, V., Gourdine, J. L., and Collier, R. J. (2012). Adaptation to hot climate and strategies to alleviate heat stress in livestock production. Animal 6, 707–728. doi: 10.1017/S1751731111002448
Riebsame, W., Changnon, S. A., and Karl, T. R. (1991). Drought And Natural Resources Management in The United States: Impacts And Implications Of The 1987-89 Drought. New York, NY: Routledge.
Rosenzweig, C., Iglesias, A., Yang, X. B., Epstein, P. R., and Chivian, E. (2001). Climate change and extreme weather events; implications for food production, plant diseases, and pests. Glob. Change Human Health 2, 90–104. doi: 10.1023/A:1015086831467
Scanlon, B. R., Faunt, C. C., Longuevergne, L., Reedy, R. C., Alley, W. M., McGuire, V. L., et al. (2012). Groundwater depletion and sustainability of irrigation in the US high plains and central valley. Procee. Natl. Acad. Sci. U.S.A. 109, 9320–9325. doi: 10.1073/pnas.1200311109
Schubert, S. D., Suarez, M. J., Pegion, P. J., Koster, R. D., and Bacmeister, J. T. (2004a). Causes of long-term drought in the U.S. great plains. J. Climate 17, 485–503. doi: 10.1175/1520-0442(2004)017<0485:COLDIT>2.0.CO;2
Schubert, S. D., Suarez, M. J., Pegion, P. J., Koster, R. D., and Bacmeister, J. T. (2004b). On the Cause of the 1930s. Dust Bowl. Sci. 303, 1855–1859. doi: 10.1126/science.1095048
Sundström, J. F., Albihn, A., Boqvist, S., Ljungvall, K., Marstorp, H., Martiin, C., et al. (2014). Future threats to agricultural food production posed by environmental degradation, climate change, and animal and plant diseases – a risk analysis in three economic and climate settings. Food Secur. 6, 201–215. doi: 10.1007/s12571-014-0331-y
Suweis, S., Carr, J. A., Maritan, A., Rinaldo, A., and D'Odorico, P. (2015). Resilience and Reactivity of global food security. Procee. Natl. Acad. Sci U.S.A. 112, 6902–6907. doi: 10.1073/pnas.1507366112
Tadesse, G., Algieri, B., Kalkuhl, M., and Braun, J. (2014). Drivers and triggers of international food price spikes and volatility. Food Policy 4, 117–28. doi: 10.1016/j.foodpol.2013.08.014
Tamea, S., Laio, F., and Ridolfi, L. (2016). Global effects of local food-production crises: a virtual water perspective. Sci. Rep. 6:18803. doi: 10.1038/srep18803
Tigchelaar, M., Battisti, D. S., Naylor, R. L., and Ray, D. K. (2018). Future warming increases probability of globally synchronized maize production shocks. Proc. Natl. Acad. Sci. U.S.A. 115, 6644–6649. doi: 10.1073/pnas.1718031115
Tu, C., Suweis, S., and D'Odorico, P. (2019). Impact of globalization on the resilience and sustainability of natural resources. Nat. Sust. 2, 283–289. doi: 10.1038/s41893-019-0260-z
USDA (2016). United States - Crop Production Maps 2012-2016 5-Year Average. United States Department of Agriculture - Foreign Agricultural Serve. Available online at: https://ipad.fas.usda.gov/rssiws/al/us_cropprod.aspx (accessed October 15, 2019).
USDA (2019a). Production, Supply and Distribution. Foreign Agricultural Service, United States Department of Agriculture. Available online at: https://www.fas.usda.gov/data (accessed October 15, 2019).
USDA (2019b). Wheat - Production Measured in BU. National Agricultural Statistics Service, United States Department of Agriculture. Available online at: https://quickstats.nass.usda.gov/results/7CE5ACD3-EFAB-382D-BC88-4BE7F38F2C82?pivot=short_desc (accessed October 15, 2019).
Wegren, S. K. (2011). Food security and Russia's 2010. Drought. Eur. Geogr. Econ. 52, 140–156. doi: 10.2747/1539-7216.52.1.140
Wheeler, T., and von Braun, J. (2013). Climate change impacts on global food security. Science 341, 508–513. doi: 10.1126/science.1239402
Winders, B. (2009). The Politics of Food Supply: U.S. Agricultural Policy in the World Economy. New Haven, CT: Yale University Press.
Worster, D. (2004). Dust Bowl: The Southern Plains in the 1930s. New York, NY: Oxford University Press.
Keywords: food systems, international trade, food crisis, drought, food security, extreme weather
Citation: Heslin A, Puma MJ, Marchand P, Carr JA, Dell'Angelo J, D'Odorico P, Gephart JA, Kummu M, Porkka M, Rulli MC, Seekell DA, Suweis S and Tavoni A (2020) Simulating the Cascading Effects of an Extreme Agricultural Production Shock: Global Implications of a Contemporary US Dust Bowl Event. Front. Sustain. Food Syst. 4:26. doi: 10.3389/fsufs.2020.00026
Received: 28 November 2019; Accepted: 24 February 2020;
Published: 20 March 2020.
Edited by:
Stefan Siebert, University of Göttingen, GermanyReviewed by:
Maite M. Aldaya, Public University of Navarra, SpainLa Zhuo, Northwest A&F University, China
Copyright © 2020 Heslin, Puma, Marchand, Carr, Dell'Angelo, D'Odorico, Gephart, Kummu, Porkka, Rulli, Seekell, Suweis and Tavoni. This is an open-access article distributed under the terms of the Creative Commons Attribution License (CC BY). The use, distribution or reproduction in other forums is permitted, provided the original author(s) and the copyright owner(s) are credited and that the original publication in this journal is cited, in accordance with accepted academic practice. No use, distribution or reproduction is permitted which does not comply with these terms.
*Correspondence: Alison Heslin, YWgzNjg0QGNvbHVtYmlhLmVkdQ==