 Corinne A. Jones1,2,3
 Ellen L. Meisner1,4Courtney K. Broadfoot1,2Sarah P. Rosen1Christine R. Samuelsen1Timothy M. McCulloch1,2*
- 1Division of Otolaryngology-Head & Neck Surgery, Department of Surgery, University of Wisconsin – Madison, Madison, WI, United States
- 2Department of Communication Sciences & Disorders, University of Wisconsin – Madison, Madison, WI, United States
- 3Neuroscience Training Program, University of Wisconsin – Madison, Madison, WI, United States
- 4Department of Physical Therapy, Mayo Clinic School of Health Sciences, Rochester, MN, United States
Any movement performed repeatedly will be executed with inter-trial variability. Oropharyngeal swallowing is a complex sensorimotor action, and swallow-to-swallow variability can have consequences that impact swallowing safety. Our aim was to determine an appropriate method to measure swallowing pressure waveform variability. An ideal variability metric must be sensitive to known deviations in waveform amplitude, duration, and overall shape, without being biased by waveforms that have both positive and sub-atmospheric pressure profiles. Through systematic analysis of model waveforms, we found a coefficient of variability (CV) parameter on waveforms adjusted such that the overall mean was 0 to be best suited for swallowing pressure variability analysis. We then investigated pharyngeal swallowing pressure variability using high-resolution manometry data from healthy individuals to assess impacts of waveform alignment, pharyngeal region, and number of swallows investigated. The alignment that resulted in the lowest overall swallowing pressure variability was when the superior-most sensor in the upper esophageal sphincter (UES) reached half its maximum pressure. Pressures in the tongue base region of the pharynx were least variable and pressures in the hypopharynx region were most variable. Sets of 3–10 consecutive swallows had no overall difference in variability, but sets of two swallows resulted in significantly less variability than the other dataset sizes. This study identified variability in swallowing pressure waveform shape throughout the pharynx in healthy adults; we discuss implications for swallowing motor control.
Introduction
Swallowing is a critical action in daily life. Oropharyngeal swallowing requires the coordinated engagement of 31 pairs of muscles and involvement of six cranial nerves [1], with goals of preparing food and liquid into a bolus, transporting the bolus quickly through the oral cavity and pharynx into the esophagus, and protecting the airway from the bolus. Oropharyngeal swallowing has both voluntary and reflexive components. For example, one has voluntary control over when to start and stop chewing, but once the stereotyped pharyngeal all-or-none response is triggered, it cannot be interrupted or reversed [2]. Many components of oropharyngeal swallowing are believed to be controlled by brainstem central pattern generators [3, 4], but some characteristics are cortically modulated [5–8]. Breakdown in any of the sensory or motor components of the oropharyngeal swallow can lead to inefficient and unsafe swallowing (dysphagia).
Oropharyngeal dysphagia impacts 1 in 25 adults in the United States [9] and is a consequence of many disease processes, such as Parkinson disease [10], amyotrophic lateral sclerosis [11], stroke [12], dementia [13], head and neck cancer [14], and age-related muscle degeneration [15]. Dysphagia is a risk factor for malnutrition, dehydration, aspiration pneumonia, and death [16, 17]. Additionally, dysphagia can have devastating effects on quality of life in patients and their families [16, 18, 19]. Dysphagia treatment is largely behavioral [20–22], but treatments are limited due to an incomplete understanding of swallowing motor control [23, 24]. Investigations of within-individual, swallow-to-swallow variability may give further insight into swallowing motor control. Whenever a motor action is performed repeatedly, there is inherent variability in the kinematics and the outcome of each movement [25, 26]. This variability can arise from noise or other subtle differences in neural and muscle activity [27–33] that can occur both during movement preparation [34–37] and execution [37–39]. Movement variability is sensitive to the sensorimotor and timing demands of a task. Tasks that have less complexity, fewer degrees of freedom, known expectations, and adequate time for preparation are less variable than conversely more difficult tasks (e.g., [35, 40, 41]).
Movement variability is an integral part of motor learning [29, 42–44]. We can modulate the degree of variability used during motor learning, as either part of a reward [45] or error-based learning process [46], and this modulation in variability eventually decreases once we master a new motor skill [47–49]. Movement variability is also critical for responding to permutations in the environment and producing on-line corrections [44, 50, 51]. On the other hand, pathologically increased movement variability has been characterized in many neurologic conditions, including Parkinson disease [52–56], stroke [39, 57], dystonia [41, 58], developmental coordination disorder [59, 60], and cerebral palsy [61, 62], to name a few.
To date, there have been very few investigations of swallowing movement variability [63–66]. Swallowing kinematics are difficult to measure, as most of the relevant musculature is located internally within the mouth and throat. Standard swallowing evaluation techniques involve capturing video using an x-ray or endoscopic approach [67, 68], which is limited by low temporal resolution (30 Hz), inadequate measurement reliability [69], and patient exposure to radiation [70]. Recent improvements in diagnostic technology have allowed for the quantification of contact pressures along the pharynx and esophagus at high-resolutions in time (50–100 Hz) and space (sensors spaced ≤ 1 cm apart) [71] (Figure 1). This high-resolution manometry technique allows for the quantitative and time-efficient evaluation of swallowing motor behavior that is well-suited for movement variability analyses.
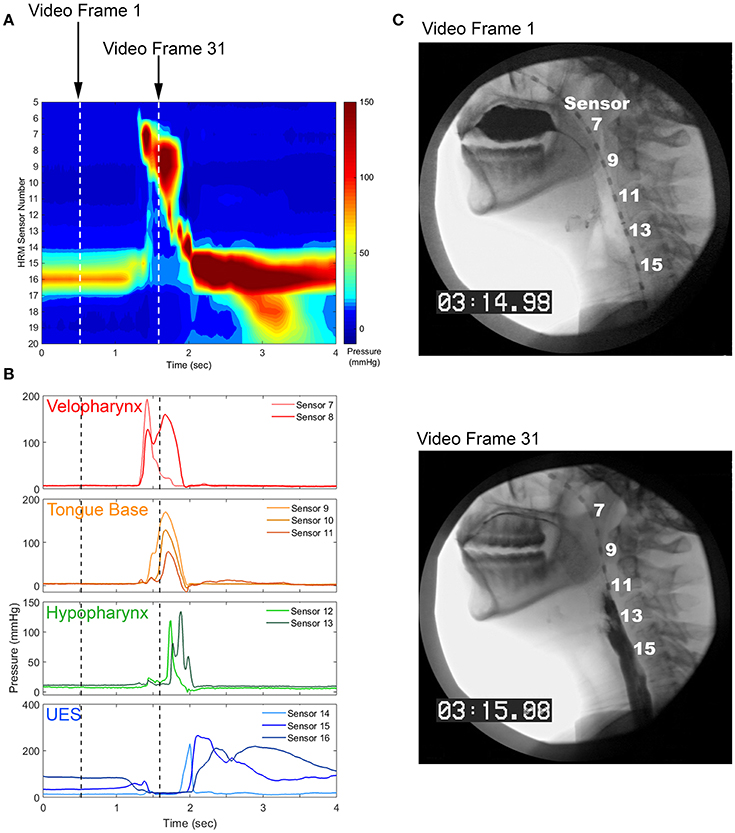
Figure 1. Pharyngeal high-resolution manometry probe in situ and pharyngeal regions of interest. (A) High-resolution manometry spatiotemporal plot from a healthy, 24 year-old female. (B) Pressure waveforms used for pressure variability analysis. (C) Still image from concurrent videofluoroscopy.
During the pharyngeal phase of swallowing, the soft palate closes against the walls of the nasopharynx to occlude the nasal cavity. The base of the tongue retracts against the pharyngeal constrictors, which puts a positive pressure on the tail of the bolus and propels it through the pharynx. At the same time, the upper esophageal sphincter (UES) is relaxed and the entrance to the airway is elevated and closed, creating a negative pressure gradient through which the bolus can enter the esophagus [16]. Thus, pharyngeal high-resolution manometry results in a set of 9–15, time-linked ballistic pressure waveforms, some of which are comprised of positive pressure values and others that have both positive and sub-atmospheric values [72]. Swallow-to-swallow differences in pressure amplitude, timing, and coordination may have drastic effects on swallowing safety and efficiency.
There are many metrics with which to measure biomedical, movement, or force variability at the waveform level (see Variability Metrics section). Most metrics compare the spread of waveforms compared to the mean (e.g., standard deviation, root mean square, coefficient of variation) [49, 62, 65, 73] or measure similarity between each waveform (e.g., correlation, linear regression, distance between two waveforms) [74, 75]. Non-linear dynamics have also been used to describe gait, voice, and robotic prosthesis control (e.g., [76–79]). Most reports of variability simply state the metric used to measure variability; few describe the construct validity in respect to the nature of the biomedical signals analyzed [49, 75, 80]. It is unclear how these metrics used to measure variability perform with modeled data and specifically with swallowing pressure data.
The aim of the present study was to determine an appropriate method for evaluating swallowing pressure waveform variability. A variability metric must be sensitive to known deviations in waveform amplitude, duration, and overall shape, without being biased by waveforms that have both positive and sub-atmospheric pressure profiles. A method by which to align swallowing pressures from trial to trial should keep pressure from different regions in the pharynx time-locked to a common event, to allow for consideration of swallowing pressure coordination. After a variability metric and an alignment method were chosen, we aimed to determine differences in pressure variability across pharyngeal regions and differences in pressure variability based on the number of swallow trials analyzed. We hypothesized that swallowing pressures from different regions in the pharynx would differ from each other, due to contrasts in muscular contractions responsible for generating such pressures. We also hypothesized that variability would increase with increased numbers of swallows analyzed, as more trials would allow more opportunities to be variable.
Materials and Methods
Literature Review
Instead of developing a novel variability metric, we reviewed extant literature and adapted metrics developed for other waveform types. We performed a search of the Medline database using the search terms “variability” OR “similarity” OR “stability” AND “waveform” OR “pressure” OR “gait” OR “action potential” OR “time series.” Variability metrics chosen for analysis must have been used to measure a biomedical waveform in series, as opposed to timing or amplitude of one aspect of a waveform. For example, heart rate variability is commonly evaluated on sinus beat-to-beat intervals [81] and as such, would not be a suitable parameter for the purposes of this study.
Variability Metrics
Signal-to-Noise Ratio
Johnson and colleagues used signal-to-noise ratio to capture variability of electromyography (EMG) activity from elbow flexor and extensor muscles [82]. After aligning EMG data from each trial into one vector with the inter-trial intervals removed and normalizing data to the overall mean, they calculated a signal-to-noise ratio by dividing the mean by the standard deviation:
Root Mean Square
Multiple groups have used root mean square, or some variation thereof, to quantify variability. For example, Stratton et al. [73] evaluated action potential waveforms with a conventional root mean square calculation, after aligning the data into one vector:
where k is the number of data points in the waveform.
Root mean square deviation has also been used [83] to compare each possible pair of waveforms:
where k is the number of data points in each waveform, x is data from one trial run waveform, and y is data from another trial run waveform. After comparing each possible pair of waveforms, the calculations from each pair are averaged.
Root mean square error [84] has also been used to evaluate joint angle kinematics:
where k is the number of data points in each waveform, x is data from one trial run waveform, and y is data from another trial run waveform. After comparing each possible pair of waveforms, the calculations from each pair are averaged.
Mean Absolute Error
Picerno et al. [84] calculated waveform similarity of joint angle kinematics using the mean absolute error of each waveform compared to the mean of all recorded waveforms:
where k is the number of data points in each waveform, and is the mean of all trial runs. After comparing each waveform to the mean, the mean absolute error calculations were averaged.
Mean absolute error can also be calculated between each possible pair of waveforms, in a mean absolute percent error [85]:
where k is the number of data points in each waveform, x is data from one trial run waveform, and y is data from another trial run waveform. After comparing each possible pair of waveforms, the calculations from each pair are averaged.
Standard Deviation
Bulea et al. [62], as well as Krüger et al. [39], used a non-corrected standard deviation (σ) to evaluate similarity of joint angle kinematics, averaging the values over the length of the waveform:
where k is the number of data points in each waveform.
Cyclic Spatiotemporal Index
Peladeau-Pigeon and Steele [65] evaluated tongue pressure variability using the cyclic spatiotemporal index. After normalizing for pressure duration and pressure amplitude, standard deviations are calculated over all trial runs for each 2% window. The 50 standard deviations from each 2% window are then summed:
A modification of this metric was also used that was not normalized for pressure duration or pressure amplitude (non-normalized cyclic spatiotemporal index).
Coefficient of Variation
Many adaptations of coefficient of variation (CV) have been used to examine waveform variability. Martens et al. [49] used two CV metrics to describe EMG waveform variability of shoulder and arm musculature during swimming. One-dimensional CV averages the standard deviation over all time points of the waveforms of all trial runs and divides by the grand mean of all data points:
where k is the number of data points in the waveform, and σ2 and were calculated over all trial runs. The authors believed that this calculation would allow for better comparison of a dataset with a large range of means and standard deviations [49].
Two-dimensional CV, conversely, computes the CV at each data point over the waveform and then calculates the mean:
where k is the number of data points in the waveform, and σ2 and were calculated over all trial runs. The authors posited that this calculation takes time into perspective as well as waveform shape [49].
O'Dwyer et al. [80] proposed calculating the CV of the waveform pattern by transforming the raw data so that the grand mean is zero:
where k is the number of data points in the modified waveform, and σ2 and were calculated over all trial runs, and the metric is multiplied by 100 to express as a percentage. The authors proposed this metric so the CV would not be biased by factors related to reference joint angle position and thus would reflect more of the trial-to-trial repeatability of motor performance [80].
Variance Ratio
Martens et al. [49] used a variance ratio, proposed by Hershler and Miller [86], to compare with their one- and two-dimensional CV:
where k is the number of data points in the waveform, n is the number of trial runs, and is the grand mean of all data points.
Coefficient of Quartile Variation
Martens et al. [49] additionally calculated the coefficient of quartile variation to measure variability in two dimensions:
where k is the number of data points in the waveform, Q1 is the first quartile over all trial runs, and Q3 is the third quartile over all trial runs.
Cosine
Hassanpour et al. [75] described a cosine metric as a way to compare angles of two waveforms:
where k is the number of data points in each waveform, x is data from one trial run waveform, and y is data from another trial run waveform. After comparing each possible pair of waveforms, the calculations from each pair are averaged.
Correlation
Correlations are a commonly-used approach in measuring waveform variability. Some have used a Pearson correlation coefficient to compare each possible pair of waveforms [74, 75, 87]:
where k is the number of data points in each waveform, x is data from one trial run waveform, and y is data from another trial run waveform. After comparing each possible pair of waveforms, the calculations from each pair are averaged. The corr function in Matlab (MathWorks, Natick, MA) was used to perform these calculations in the present study.
Cross-correlation is similar to the Pearson correlation, and has been used in kinesiology/biomechanics literature to compare force generated by knee extensors and flexors [83]:
where k is the number of data points in each waveform, x is data from one trial run waveform, and y is data from another trial run waveform. After comparing each possible pair of waveforms, the calculations from each pair are averaged.
The coefficient of multiple correlation has been used in analysis of gait kinematics [88, 89]:
where k is the number of data points in the waveform, n is the number of trial runs, and is the grand mean of all data points.
Intraclass correlation evaluating the degree of absolute agreement among measurements has been used to assess both somatosensory evoked potentials [90] and gait kinematics [91]:
where s represents between-cluster variance and s represents within-cluster variance. An ICC function in Matlab was used to perform these calculations, using the A-1 specification [92].
Distance Metrics
Hassanpour et al. [75] explored a variety of distance metrics that can be used to measure similarity in time-series biomedical signals. For each of the following distance metrics, each possible combination of waveforms was compared, with all calculations averaged.
where k is the number of data points in each waveform, x is data from one trial run waveform, and y is data from another trial run waveform.
Mechmeche et al. [93] used the Fréchet distance metric to measure similarity between two curves for evaluating joint kinematics. Due to the complexity of this algorithm, a Matlab package [94] was used to compute the Fréchet distances between each possible pair of waveforms; each measurement was then averaged.
Dynamic time warping is an algorithm that stretches two waveforms such that the Euclidean distances between corresponding points is minimized. This method has been used to measure similarity between two audio signals [95]. A Matlab package [96] was used to compute the dynamic time warping calculation between each possible pair of waveforms; each measurement was then averaged.
Linear Regression
Several studies have used an ordinary least squares estimation in a linear regression model to determine similarity between waveforms [75, 97–99]:
where y is data from one trial run waveform, and x is data from another trial run waveform. Horsak et al. [97] and Krüger et al. [39] both used the ordinary R2-value as their metric of strength of relationship between two waveforms, sometimes referred to as canonical correlation or coefficient of determination. Sarthein et al. [98] used the t-value of β1/standard error of β1 to describe the overall magnitude of difference between two waveforms. The Matlab function fitlm was used to linearly fit each possible combination of waveforms, and then R2- and t-values from each comparison were averaged.
Model Waveforms
To assess whether variability metrics are sensitive to known deviations in waveform amplitude, duration, or shape (i.e., time at which the waveform hits its peak), sets of 10 model waveforms were generated with a parabolic shape. A Gaussian random number generator [100] with a mean of 100 and standard deviations ranging between 5 and 20 was used to generate 200 sets of permutations (Figures 2A–C). The same 200 sets of permutations were used to adjust the maximum amplitude, duration of the waveform, and time at which the waveform peak occurred. Waveforms were comprised of 100 data points (unless the duration was manipulated), had a maximum amplitude of 100 (unless the amplitude was manipulated), and had waveform peak occur at 50% of its duration (unless the time at which the waveform hit its peak was deviated).
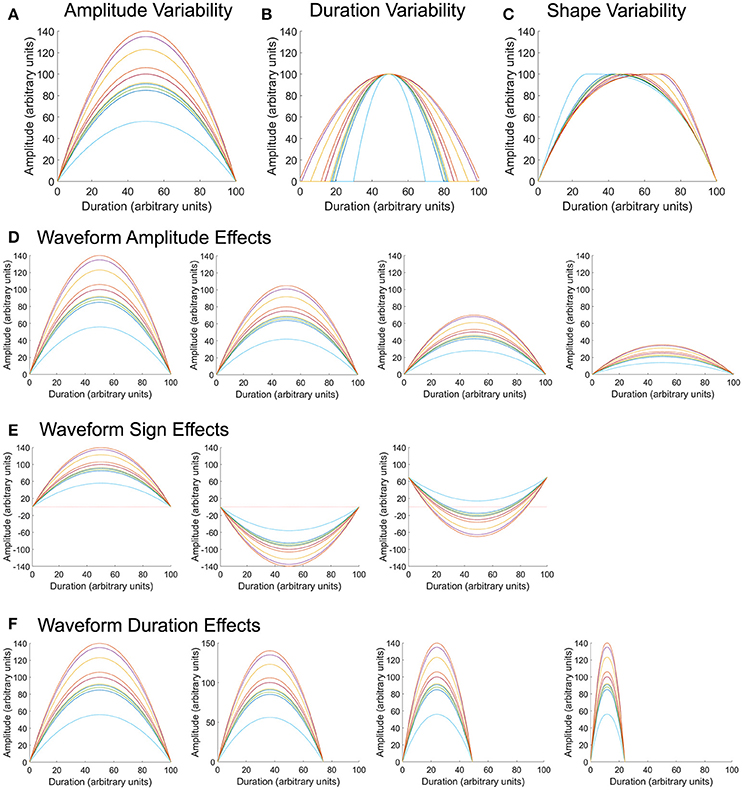
Figure 2. Model waveforms and permutations. Parabolic waveforms were generated with random permutations in amplitude (A), duration (B), and shape (C), or when in the waveform the maximum pressure occurred. Using the same amplitude permutations as in (A), the overall mean of the waveform was varied to center around 100, 75, 50, or 25 arbitrary units (D). Using the same amplitude permutations as in (A), waveforms were modified such that all values were positive, all values were negative, or had a combination of positive and negative values (E), to reflect properties of pharyngeal swallowing pressures. Finally, using the same amplitude permutations as in (A), the overall duration of the waveform was varied to equal 100, 75, 50, and 25 arbitrary units (F).
To assess whether waveform amplitude biased variability calculation, sets of 10 model waveforms were created with the same variation about the mean, but with overall mean values of 100, 75, 50, and 25 (Figure 2D). Two hundred permutations of each mean amplitude were evaluated. All waveforms were comprised of 100 data points and had each waveform peak occur at 50% of its duration.
To assess whether the relationship of the waveform to zero (all positive values, all negative values, or waveforms with positive and negative values) biased variability calculation, sets of 10 model waveforms were created with the same variation about the mean, but with all values positive, all values negative, or half-positive/half-negative values (Figure 2E). Upper esophageal sphincter pressure patterns typically fall in the sub-atmospheric range (Figure 1B) and often take a shape similar to the waveforms in the rightmost panel in Figure 2E. Two hundred permutations of each waveform sign were evaluated. All waveforms were comprised of 100 data points, had an overall amplitude difference of 100, and had each waveform peak occur at 50% of its duration.
Finally, to assess whether overall waveform duration biased variability calculation, sets of 10 model waveforms were created with the same variation about the mean, but with overall durations of 100, 75, 50, and 25 data points (Figure 2F). Two hundred permutations of each mean amplitude were evaluated. All waveforms had a mean amplitude around 100 and had each waveform peak occur at 50% of its duration.
Swallowing Pressure Data
Swallowing pressure data presented here are a secondary analysis from a normative database of pharyngeal swallowing pressures [101]. Data were collected from 103 healthy adults (47 male) between the ages of 21–89 (mean age 52.4 ± 21.3), without swallowing, gastrointestinal, or neurological disorders. All participants provided informed consent to participate in a research protocol approved by the University of Wisconsin—Madison Health Sciences Institutional Review Board and conducted under the principles in the Declaration of Helsinki.
All participants underwent a pharyngeal high-resolution manometry study. This involved placement of a 2.75 mm diameter catheter through the nose and into the pharynx and esophagus (Figure 1). After resting for approximately 5 min, participants swallowed 10 boluses of 10 cc thin-liquid barium contrast that was delivered via syringe with the head in a neutral position and a cue to swallow from the examiner. Simultaneous videofluoroscopy data were collected, but those data were not used in the present study. The manometric equipment used for this study was comprised of solid-state pressure sensors that recorded pressure circumferentially (ManoScan ESO, Medtronic, Minneapolis, MN). Pressure sensors were spaced 1 cm apart, and between 9 and 15 pressure sensors fell within the pharynx, depending on the size of the individual. The manometric system records pressure data at 50 Hz, ranging between −20 and 300 mmHg, with a resolution of 2 mmHg.
Pressure waveforms were separated into four regions of interest (Figure 1). The velopharynx is the superior-most region of pharyngeal swallowing-related pressure as the soft palate contacts the posterior and lateral portions of the nasal cavity to valve off this region and prevent liquid from entering. In this region, pressures rise from baseline prior to pressure in other pharyngeal regions and often have a bimodal or peak-plateau shape. The tongue base region is directly caudal to the velopharynx and reflects positive pressure put on the tail of the swallowed bolus from the tongue base, as well as the superior and middle pharyngeal constrictors. These pressure waveforms are typically unimodal in shape and have similar onsets and offset times within this region. The hypopharynx is a region between the tongue base and the UES. Pressure waveforms in this region consist of a primary pressure wave with an onset after those in the tongue base, with secondary irregularly-shaped peaks, likely a consequence of contact of the cartilaginous laryngeal and epiglottic structures against the pressure catheter. The UES separates the pharynx from the esophagus. It is closed tightly at rest and relaxes during swallowing to allow for bolus passage into the esophagus. Due to swallowing-related movement of multiple pharyngeal regions, pressures from the UES are captured over multiple pressure sensors, even those that have low pressure during baseline resting conditions [102]. All sensors in the UES region have relatively low, even sub-atmospheric pressures during bolus passage, which usually occur at a time of high pressure in the velopharynx, tongue base, and hypopharynx and are followed by a rapid increase in pressure with a gradual return to baseline pressure [72]. For a more thorough outline of regional pharyngeal swallowing pressure patterns, see the descriptions of McCulloch [72], Rosen [103], Jones [102], and Meyer [104].
To identify the window of swallowing pressures on which to calculate variability, swallowing pressure data were imported into Matlab (Figure 3A), sorted into regions of interest, and aligned with other swallows in the dataset (see waveform alignment section below). Swallowing pressures from one manometric sensor were plotted, and a researcher identified approximate onsets and offsets. A customized Matlab script then calculated the precise timing of onsets and offsets. For pressures in the velopharynx, tongue base, and hypopharynx regions, onsets were defined as the first swallowing pressure wave to rise more than 2 mmHg in one interval, and offsets were defined as the last pressure wave to fall more than 2 mmHg in one interval (Figures 3B–D). For pressures in the hypopharynx, secondary waves were excluded if they were temporally separated from the main pressure wave by 0.1 s or more (Figure 3D). In the UES, onsets were defined as the first pressure wave to fall more than 2 mmHg in one interval and the offsets were defined as the last pressure wave to rise more than 2 mmHg before its peak (Figures 3E,F). The 2 mmHg cutoff was chosen due to the pressure resolution of the ManoScan high-resolution manometry system.
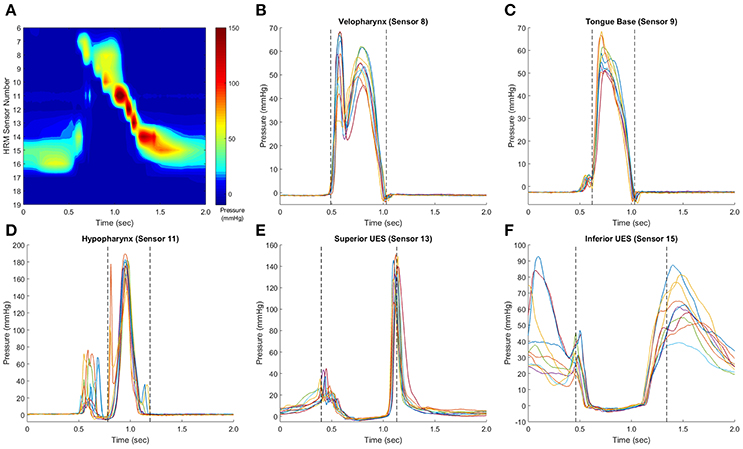
Figure 3. Identification of pressure waveform boundaries. Sample swallows from a healthy 32 year-old female, with a representative spatiotemporal plot (A). In pressure waveforms in the velopharynx, tongue base, and hypopharynx, pressure onset was defined as the first of the set of waves to rise from baseline pressure at a rate ≥2 mmHg/0.01 s, and pressure offset was defined as the last waveform to fall to baseline a rate equal to or ≥2 mmHg/0.01 s (B,C). Hypopharynx propagation pressures were separated from non-clearance pressures (D). In the upper esophageal sphincter (UES), the waveform boundary started when the first waveform fell at a rate ≥2 mmHg/0.01 s and ended when the last waveform rose at a rate ≥2 mmHg/0.01 s (E,F). This rate was determined as the pressure resolution of the ManoScan ESO system is 2 mmHg and the data output is 100 Hz. Pressure waveform boundaries were automatically detected by a customized Matlab script.
Swallowing Pressure Waveform Alignment
After variability metric selection, a key unanswered question was how to best align the swallowing pressure waves. It is of importance to have a stable reference time between sensors in different regions, as the precise coordination of pharyngeal pressure in different regions is important for a functional swallow [105–107]. On 50 randomly-selected datasets from the 103 healthy subjects, we evaluated swallowing pressure variability using the following methods of alignment:
1. Onset of superior-most pressure wave in the velopharynx, tongue base, hypopharynx, or UES
2. Maximum pressure of the superior-most pressure wave in the velopharynx, tongue base, hypopharynx, or UES
3. Time point of half-maximum pressure of the superior-most pressure wave in the velopharynx, tongue base, hypopharynx, or UES
4. Time point of peak 1st derivation (maximum pressure change) of the superior-most pressure wave in the velopharynx, tongue base, hypopharynx, or UES.
We chose to evaluate the superior-most sensor in each region, as there is considerable between-subject variability in the total number of pressure sensors in each region.
Pharyngeal Region
For analysis of swallowing pressure variability differences between the velopharynx, tongue base, hypopharynx, and UES, variability was calculated for each pressure wave and then averaged within region. The full dataset of 103 healthy participants was used for this analysis.
Number of Swallows Analyzed
Typical clinical and research protocols involve 3–5 swallows of each bolus type [e.g., [72, 108, 109]]. Using our dataset of 10 swallows, we calculated pressure variability from subsets containing 2–10 swallows. We used the swallows in the order they were collected for the limited datasets (e.g., swallow #1, #2, and #3 for analyzing variability from three swallows). The full dataset of 103 healthy participants was used for this analysis.
Statistical Analysis
To assess whether the variability metric matched with known model waveform permutations, Pearson product-moment correlations were calculated for each variability metric output and the permutation. Metrics with a correlation coefficient of >0.80 or <−0.80 were judged to be a good fit. Due to the high number of correlations calculated, p-values were not considered.
A subset of metrics that were highly correlated with known variability in amplitude, duration, and shape were further evaluated for bias. To assess whether the metric performed differently at each amplitude, sign, and duration, one-way analyses of variance (ANOVAs) were calculated for each metric to assess effects of mean (100 vs. 75 vs. 50 vs. 25), sign (all positive values, all negative values, or both positive and negative values), and duration (100 vs. 75 vs. 50 vs. 25). Post-hoc testing was done using Fisher's Least Significant Difference. A Bonferroni-corrected α-criterion of 0.05/(27 metrics × 3 ANOVAs) = 0.0006 was used to determine significance.
Three variability metrics that performed well on the above statistical tests were correlated with each other as well as with the known permutations using Pearson product-moment correlations. A Bonferroni-corrected α-criterion of 0.05/6 correlations = 0.008 was used to determine significance.
To evaluate the impact of different swallowing pressure alignment on pressure variability, we used a 4 × 4 repeated measures ANOVA with effects of alignment type (pressure onset, pressure peak, time of half-maximum pressure, and time of peak 1st derivation) and region (velopharynx, tongue base, hypopharynx, UES). A Greenhouse-Geisser correction was used for sphericity, and post-hoc testing was done using Fisher's Least Significant Difference. An alpha criterion of 0.05 was used to determine significance.
To evaluate the effect of pharyngeal region on swallowing pressure variability, we used a 1-way repeated measures ANOVA with a main effect of region (velopharynx vs. tongue base vs. hypopharynx vs. UES). A Greenhouse-Geisser correction was used for sphericity, and post-hoc testing was done using Fisher's Least Significant Difference. An alpha criterion of 0.05 was used to determine significance. A randomly-selected 20% of the 103 datasets were analyzed for swallowing pressure variability by a separate examiner, and intraclass correlation coefficient was used to calculate inter-rater reliability.
To evaluate the effect of number of swallows evaluated on pressure variability, 1-way repeated measures ANOVAs were calculated with a main effect of number of swallows (2–10) for pressure variability summed from all regions of interest. A Greenhouse-Geisser corrections was used for sphericity, and post-hoc testing was done using Fisher's Least Significant Difference. An α-criterion of 0.05 was used to determine significance.
Results
Model Waveforms
Most variability metrics had strong linear correlations between known deviations in waveform amplitude, duration, and shape (Figure 4). Metrics insensitive (r < 0.8) to deviation in waveform amplitude included root mean square, cyclic spatiotemporal index, cosine, Pearson correlation, cross correlation, coefficient of multiple correlation, linear regression t-shape, and linear regression R2. Those insensitive to different waveform durations included cyclic spatiotemporal index, cross correlation, coefficient of multiple correlation, and linear regression t-shape. Fewer metrics were insensitive to different waveform shapes: coefficient of multiple correlation and linear regression t-shape. Interestingly, signal-to-noise ratio was strongly negatively correlated with perturbations in waveform amplitude and duration, while also strongly positively correlating with perturbations in waveform shape. When correlating all three permutations together (amplitude, duration, and shape), those metrics that had the highest overall correlations with known deviations (r > 0.8) were Chebyshev distance and CVpattern.
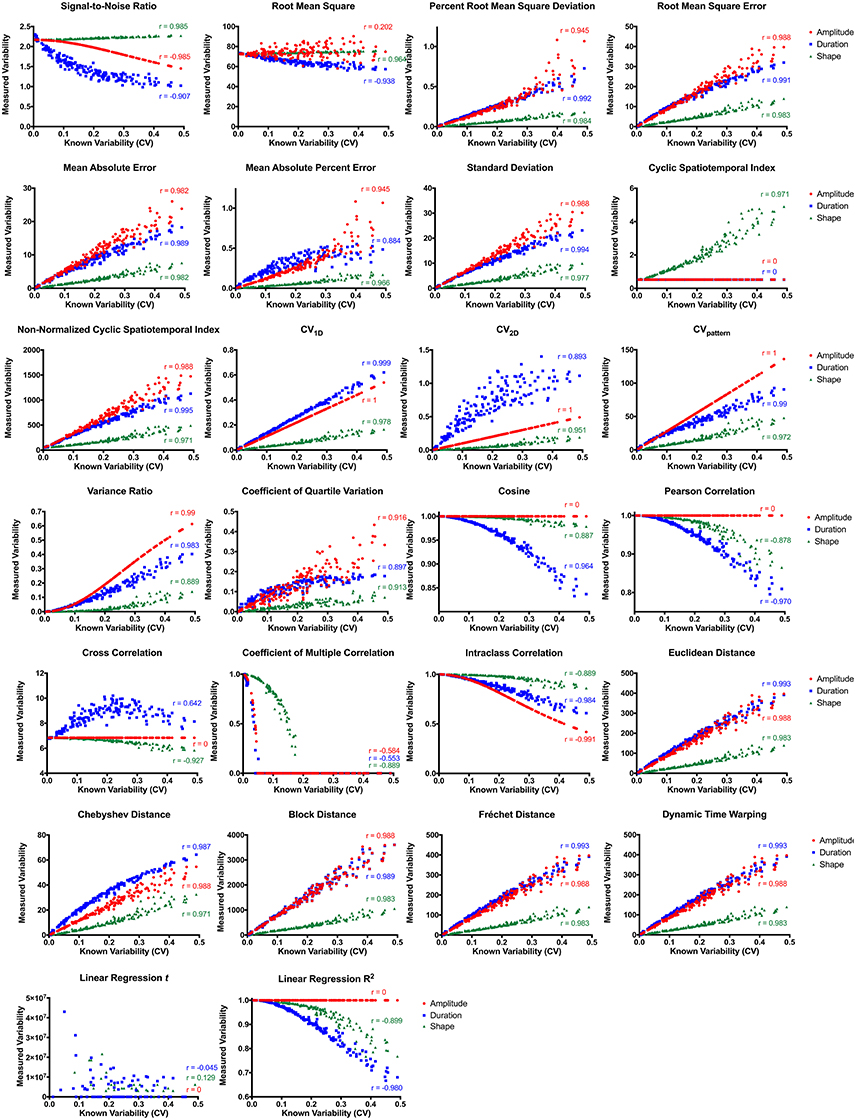
Figure 4. Variability metric correlations between known and measured variability with permutations in amplitude (red), duration (blue), and waveform shape (green). CV, coefficient of variability.
Of the 18 metrics sensitive to amplitude, duration, and shape permutations, nine were substantially biased by differences in mean amplitude (Table 1, Figure S1). Root mean square error, mean absolute error, standard deviation, non-normalized cyclic spatiotemporal index, and all of the distance metrics resulted in significantly different calculations between waveforms of different amplitudes (p < 0.0001). As mean amplitude decreased, measured variability decreased for root mean square error, mean absolute error, standard deviation, non-normalized cyclic spatiotemporal index, and all of the distance metrics. Alternatively, signal-to-noise ratio, percent root mean square deviation, CV1D, CV2D, CVpattern, variance ratio, coefficient of quartile variation, and intraclass correlation resulted in similar variability calculations between waveform sets with different amplitudes.
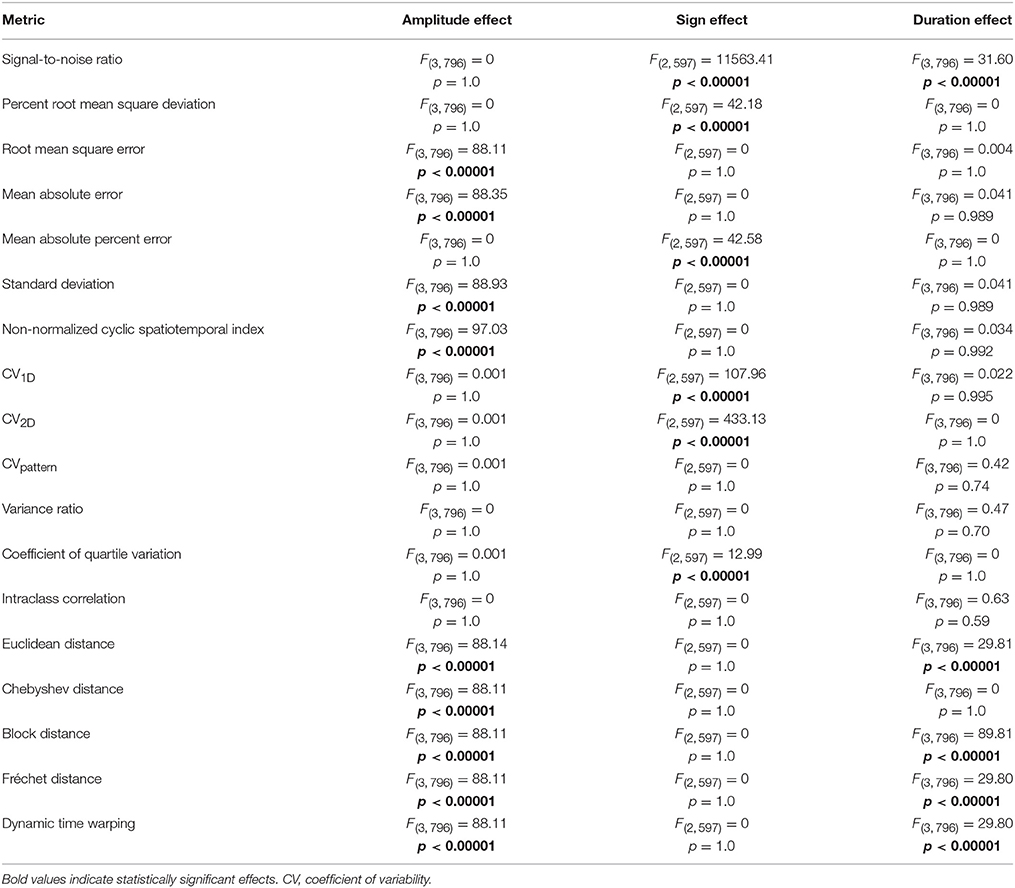
Table 1. ANOVA results comparing effect of waveform amplitude, waveform sign, and waveform duration on the subset of variability metrics that are sensitive to amplitude, duration, and shape permutations.
Of the 18 metrics sensitive to amplitude, duration, and shape permutations, six were considerably biased by differences in waveform sign (Table 1, Figure S2). When the waveform has positive and negative values, the relationship between measured and known variability disappears for signal-to-noise ratio, mean absolute percent error, and coefficient of quartile variation (p < 0.0001). Measured variability is significantly increased for waveforms with positive and negative values using the percent root mean square deviation and CV1D metrics (p < 0.0001). The direction of the correlation between measured and known variability flips when the waveform has negative values when using the CV2D metric (p < 0.0001). Metrics unbiased by neither waveform sets with different amplitudes nor waveform sets with different signs included CVpattern, variance ratio, and intraclass correlation.
Of the 18 metrics that are sensitive to amplitude, duration, and shape permutations, five were markedly biased by differences in waveform duration (Table 1, Figure S3). Variability significantly decreased as overall waveform duration decreased for signal-to-noise ratio, Euclidean distance, block distance, Fréchet distance, and dynamic time warping (p < 0.0001). Post-hoc pairwise comparisons for the distance metrics were all significant, and all pairwise comparisons besides 100 and 75 data points were significant for the signal-to-noise ratio (p < 0.0001). Metrics unbiased by waveform sets of different amplitudes, signs, and durations included CVpattern, variance ratio, and intraclass correlation.
CVpattern, variance ratio, and intraclass correlation were the only metrics not significantly biased by amplitude, sign, or duration (Table 1). Known variability permutations were correlated with measured variability from CVpattern, variance ratio, and intraclass correlation metrics over all manipulations of model waveforms (11 manipulations × 200 waveform sets). All metrics had very strong correlations (Table 2) with known variability. CVpattern had the strongest correlation by a slight amount, and it is the only parameter that appears to follow a linear pattern with increases in known variability (Figure 5). CVpattern, variance ratio, and intraclass correlation are also very highly correlated with each other. Given this high agreement and the pervasive use of CV as a metric describing movement variability in motor control literature, we decided to use CVpattern as our primary variability metric to evaluate swallowing pressure variability.
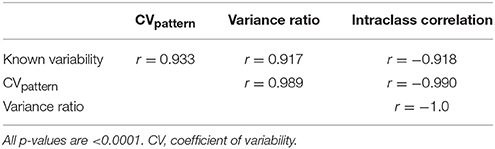
Table 2. Pearson correlation coefficients comparing known variability permutations, and CVpattern, variance ratio, and intraclass correlation outputs.
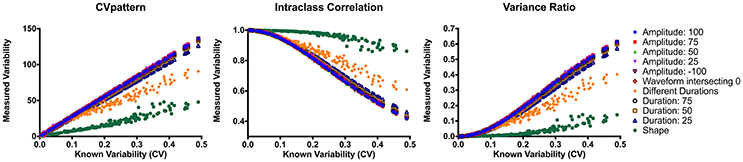
Figure 5. Correlations between CVpattern, variance ratio, and intraclass correlation on all model waveform permutations. CV, coefficient of variability.
Swallowing Pressure Waveform Alignment
To compare alignment of swallowing pressure data, we summed variability in the different regions: Total CV = velopharynx CV + tongue base CV + hypopharynx CV + UES CV. Repeated measures ANOVA comparing time-alignment at different time points in the pressure wave and at different regions in the pharynx revealed drastically different measures of variability using the CVpattern metric (Figure 6, Figures S4A–D). There was a significant interaction between alignment type and region [F(4.8, 237.5) = 5.5; p < 0.0001; pairwise comparisons in Supplementary Table 1]. When aligning by pressures in the velopharynx, variability was lowest when aligning at the time of peak pressure (p ≤ 0.04). However, when aligning by pressures in the tongue base, hypopharynx, or UES, variability was least when aligning at the time when pressure surpassed half of maximum pressure (p ≤ 0.01). Within pressures aligned at half of maximum pressure, variability was lowest when aligned by pressures in the UES and hypopharynx (p ≤ 0.002). As there was no statistical difference between pressure variability in the UES and hypopharynx when pressure waves were aligned at half-maximum height, we decided to pursue further testing when swallowing pressure waves reached half-maximum height on the UES. One additional reason for this decision was the relative ease at which to automatically detect this time point without user input or correction (Figure 6).
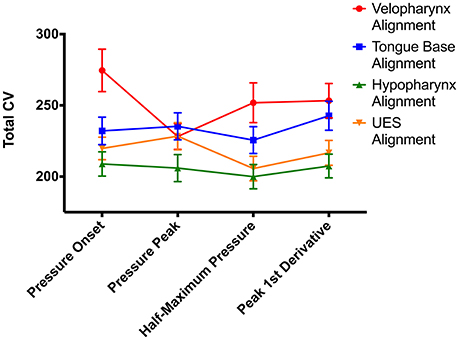
Figure 6. Impacts of swallowing pressure alignment on total coefficient of variability (CV) values. UES, upper esophageal sphincter; error bars indicate standard error of the mean.
Pharyngeal Region
Using the CVpattern metric on swallowing pressure waves aligned at half-maximum height on the superior-most sensor in the UES, ICC between two raters was between 0.92 and 0.99, reflecting an excellent level of agreement. We then evaluated pressure variability differences between regions in the pharynx (Figure 7). One-way repeated-measures ANOVA revealed a significant effect of region [F(2.3, 226.7) = 33.4; p < 0.0001]. Pressures in the tongue base were less variable than all other regions (p < 0.0001). Pressure variability in the velopharynx approximated that of the UES (p = 0.29), and both were less than pressure variability in the hypopharynx (p ≤ 0.001).
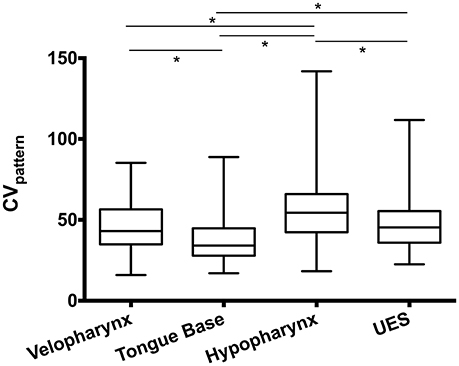
Figure 7. Swallowing pressure variability by region. Swallowing pressures were significantly less variable in the tongue base than all other regions (*p < 0.0001). Pressure variability in the hypopharynx was greater than all other regions (*p ≤ 0.001). An illustration of swallowing pressure variability by region is in Figure 3. CV, coefficient of variability; UES, upper esophageal sphincter.
Number of Swallows Analyzed
Finally, we evaluated the impact on number of swallows analyzed on variability. To do this, we calculated CVpattern on subsets of the original data in groups of 2–10 consecutive swallows (Figure 8). Repeated measures ANOVA revealed a significant main effect of number of swallows evaluated on Total CV [F(2.7, 71.8) = 2.8, p = 0.047]. When two swallows were evaluated, variability was significantly lower than for all other number of swallows (p ≤ 0.03). There were no other differences between combinations of other numbers of swallows (p ≥ 0.26).
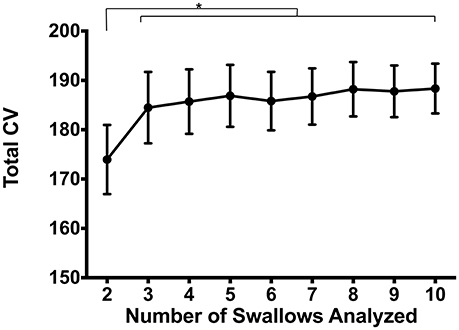
Figure 8. Impacts of number of swallows evaluated on total coefficient of variability (CV). Pressures were significantly less variable when evaluating sets of 2 swallows compared to any other number (*p ≤ 0.03). There were no pairwise differences between 3 and 10 swallows (p ≥ 0.26). Error bars represent standard error of the mean.
Discussion
There are a substantial number of metrics used to measure waveform variability in biological systems. These metrics perform quite differently from one another depending on which aspect of the waveform is varied (Figure 4). For pharyngeal swallowing pressures, we believe waveform amplitude, duration, and shape variations to be physiologically relevant to the safety and efficiency of swallowing. Systematic appraisal of published variability metrics revealed CVpattern, variance ratio, and intraclass correlation as ideal for measuring pharyngeal swallowing pressure variability due to high sensitivity and low bias to waveform amplitude, duration, and shape. CVpattern was chosen to analyze pharyngeal swallowing pressures, due to its potential for direct comparison with other reports of motor variability which often use CV as a metric. This metric may not be ideal for all applications; we therefore recommend consideration of specific waveform permutations that are applicable to each research question prior to choosing a variability metric.
The ideal time-alignment for pharyngeal swallowing pressures was determined to be at the time when the superior-most UES sensor reaches half of its maximum pressure. Pressures in the tongue base region are least variable and pressures in the hypopharynx region are most variable. Number of swallows analyzed had no impact on pressure variability measures, except when groups of two swallows were analyzed. Not only will these results will be useful in future studies of swallowing pressure variability, they will give insights on swallowing motor control.
Precise control of oral, pharyngeal, and laryngeal kinematics and pressures is necessary for a safe and efficient swallow. Thus, the magnitude of pressure variability difference was surprising when the same swallowing pressures were aligned at different points in the waveform and in different pharyngeal regions (Figure 6). Pressures in the velopharynx are valving pressures, thus a main purpose during swallowing is to close off the nasal cavity so that the bolus travels from the mouth into the oropharynx [16]. Additionally, the soft palate raises to close off airflow to the nasal cavity during the production of many speech sounds [110]. As such, the soft palate is under more voluntary control and may not have as rigid of timing requirements for pharyngeal swallowing motor patterns, resulting in higher variability calculations when all pressure waves are aligned by pressures in the velopharynx. However, when swallowing pressures are aligned by the maximum pressure in this region, the variability pattern resembles that of other regions in the pharynx. Conversely, pressures in the hypopharynx are erratic and have high variability compared to other regions in the pharynx [103] (Figure 7). Consequently, aligning by this region minimized the overall pressure variability throughout the pharynx.
Aligning pressures at time points when the pressure wave hit half of its maximum height generally resulted in lower variability values than other alignments (Figure 6, Supplemental Table 1, Figures S4A–D). Precise timing of pressure onsets may be influenced by small pressure traces imparted by the bolus itself [111, 112]. Measures of peak pressure and pressure change (1st derivative) might differ on a swallow-by-swallow basis based on the circumferential-averaging nature of the high-resolution manometry pressure sensors [103, 104]. That is, with the ManoScan ESO system used in this study, pressures are measured circumferentially around each sensor within the pharynx and averaged prior to being captured by the manometric software program. Although not directly tested in the present study, the half-maximum time point may be a more stable measure of pressure timing than a maximum or pressure change metric in the asymmetric pharynx.
Different magnitudes of variability in different pharyngeal regions may reflect the complexity of pressure contribution in a specific region. Closure of the velopharynx is achieved through contraction of the levator veli palatini, palatopharyngeus, musculus uvulae, and superior pharyngeal constrictor musculature [16]. Tongue base to posterior pharyngeal wall contact is generated by the palatoglossus, hyoglossus, and superior and middle pharyngeal constrictor muscles [16]. Pressures in the hypopharynx are generated through contraction of the middle and inferior constrictor muscles but also have non-muscular pressures with inversion of the epiglottis and contact with other cartilaginous structures of the larynx [103, 113]. Finally, UES pressures are comprised of muscular activity from the inferior constrictor, cricopharyngeus, and the circular skeletal muscles in the cervical esophagus [114–117]. The bolus also exerts a measurable pressure during passage through the UES [118–120], and there are additional pressure components from positioning of the larynx and other regional pharyngeal structures [114, 121]. Additionally, the high-pressure zone of the UES rises in the pharynx due to hyolaryngeal elevation and pharyngeal shortening [102, 120, 122, 123], and subtle differences in these muscular activations has the potential to influence the extent and timing of UES pressure activity on different manometric sensors. Of all pharyngeal regions measured using high-resolution manometry, pressures in the tongue base have a relatively simple pressure profile with fewer degrees of freedom than other regions. Thus, this relative simplicity may lead to pressures that are less variable.
Our hypothesis that a subset including more swallows would be more variable was not supported by the results. In fact, there was no statistical difference between swallowing pressure variability in sets of 3–10 swallows. Fortunately, it is not common for research or clinical swallowing protocols to be completed in sets of two swallows. Additionally, it is reasonable to compare swallowing pressure variability data from different studies without needing to correct for number of swallows analyzed. This finding gives support for future study design: it may be more feasible, especially in patients with dysphagia, to perform the least number of swallow trials to give an accurate picture of swallowing pressure variability. Capturing fewer swallowing trials may also spare exposure to radiation in studies that use a videofluoroscopic approach to swallowing evaluation [70].
There are some limitations associated with this study. We did not perform an exhaustive, systematic review of the literature on variability metrics. However, we evaluated a number of variability metrics and were able to identify three that satisfied our criteria of being sensitive and unbiased toward waveform amplitude, duration, and shape. We also investigated swallowing pressures with a small liquid bolus. Using the CVpattern metric, future work should address task differences on swallowing pressure variability. Additionally, the process of identifying and distinguishing pressures in pharyngeal regions is subjective in nature and may be more difficult when evaluating swallowing pressures in individuals with dysphagia. Nonetheless, our research team has had success in obtaining reliability in evaluating swallowing pressures, both with clinicians knowledgeable about swallowing function and in undergraduate research assistants without prior clinical training [124].
Conclusions
Deliberate analysis of variability metrics and alignment procedures on swallowing pressure variability culminated in an ideal metric of CV calculated over pressure waves that have been aligned such that the grand mean is 0, where all swallowing pressures are aligned to the time when the most superior sensor showing UES pressures reaches half its maximum pressure. This alignment and variability calculation technique has a high reliability and is stable on swallowing datasets between 3 and 10 swallows. Pharyngeal region has a significant effect on swallowing pressure variability; this should be taken into consideration in future work.
Future Recommendations
This work highlights the importance of testing the construct validity of variability metrics specific to the system in question. Future work in separate motor systems can use these findings when selecting metrics to use, depending on the specifics of the waveform that is important (e.g., differences in waveform duration, amplitude, or shape) and the nature of the movement (e.g., rhythmic movements such as gait vs. ballistic movements required for swallowing).
Further work is needed to quantify swallowing pressure variability as a result of different bolus characteristics (e.g., volume, consistency), voluntary swallowing maneuvers (e.g., chin tuck, effortful swallowing), and in patients with dysphagia. If we assume (1) that measuring swallowing pressure variability will help to understand impairments in motor control that lead to dysphagia; and (2) that a better understanding of swallowing motor control can improve treatment decisions; then continuing this line of research has the potential to impact the care of millions of people with dysphagia.
Data Availability Statement
The raw data supporting the conclusions of this manuscript will be made available by the authors upon request, without undue reservation, from any qualified researcher.
Author Contributions
CJ designed the study, analyzed data, performed the statistical analysis, interpreted the findings, and wrote the manuscript. EM designed the study, analyzed data, and critically revised the manuscript. CB and CS analyzed data and critically revised the manuscript. SR and TM interpreted the findings and critically revised the manuscript.
Funding
This work was supported by NIH grant R21 DC011130. CJ had additional support from NIH F31 DC015709 and T32 GM007507, and SR and CB had support from NIH T32 DC009401.
Conflict of Interest Statement
The authors declare that the research was conducted in the absence of any commercial or financial relationships that could be construed as a potential conflict of interest.
Acknowledgments
The authors would like to acknowledge support from Suzan Abdelhalim, MD, MPH and Chelsea Walczak, MPH for assistance with data collection and biostatistician Glen Leverson, Ph.D. for guidance on study design and statistical analysis.
Supplementary Material
The Supplementary Material for this article can be found online at: https://www.frontiersin.org/articles/10.3389/fams.2018.00023/full#supplementary-material
Abbreviations
UES, upper esophageal sphincter; CV, coefficient of variability.
References
1. Dodds WJ, Stewart ET, Logemann JA. Physiology and radiology of the normal oral and pharyngeal phases of swallowing. Am J Roentgenol. (1990) 154:953–63. doi: 10.2214/ajr.154.5.2108569
2. Doty RW, Bosma JF. An electromyographic analysis of reflex deglutition. J Neurophysiol. (1956) 19:44–60.
3. Jean A. Brain stem control of swallowing: neuronal network and cellular mechanisms. Physiol Rev. (2001) 81:929–69. doi: 10.1152/physrev.2001.81.2.929
4. Morquette P, Lavoie R, Fhima MD, Lamoureux X, Verdier D, Kolta A. Generation of the masticatory central pattern and its modulation by sensory feedback. Prog Neurobiol. (2012) 96:340–55. doi: 10.1016/j.pneurobio.2012.01.011
5. Hamdy S, Mikulis DJ, Crawley A, Xue S, Lau H, Henry S, et al. Cortical activation during human volitional swallowing: an event-related fMRI study. Am J Physiol. (1999) 277(1 Pt 1):G219–25.
6. Kern MK, Jaradeh S, Arndorfer RC, Shaker R. Cerebral cortical representation of reflexive and volitional swallowing in humans. Am J Physiol. (2001) 280:G354–60. doi: 10.1152/ajpgi.2001.280.3.G354
7. Michou E, Hamdy S. Cortical input in control of swallowing. Curr Opin Otolaryngol Head Neck Surg. (2009) 17:166–71. doi: 10.1097/MOO.0b013e32832b255e
8. Peck KK, Branski RC, Lazarus C, Cody V, Kraus D, Haupage S, et al. Cortical activation during swallowing rehabilitation maneuvers: a functional MRI study of healthy controls. Laryngoscope (2010) 120:2153–9. doi: 10.1002/lary.21125
9. Bhattacharyya N. The prevalence of dysphagia among adults in the United States. Otolaryngol Head Neck Surg. (2014) 151:765–9. doi: 10.1177/0194599814549156
10. Bird MR, Woodward MC, Gibson EM, Phyland DJ, Fonda D. Asymptomatic swallowing disorders in elderly patients with Parkinson's disease: a description of findings on clinical examination and videofluoroscopy in sixteen patients. Age Ageing (1994) 23:251–4. doi: 10.1093/ageing/23.3.251
11. Ruoppolo G, Schettino I, Frasca V, Giacomelli E, Prosperini L, Cambieri C, et al. Dysphagia in amyotrophic lateral sclerosis: prevalence and clinical findings. Acta Neurol Scand. (2013) 128:397–401. doi: 10.1111/ane.12136
12. Daniels S, Huckabee M–L. Dysphagia Following Stroke. 2nd Ed. San Diego, CA: Plural Publishing, Inc. (2013).
13. Feinberg MJ, Ekberg O, Segall L, Tully J. Deglutition in elderly patients with dementia: findings of videoflurographic evaluation and impact on staging and management. Radiology (1992) 183:811–4. doi: 10.1148/radiology.183.3.1584939
14. Starmer HM. Dysphagia in head and neck cancer: prevention and treatment. Curr Opin Otolaryngol Head Neck Surg. (2014) 22:195–200. doi: 10.1097/MOO.0000000000000044
15. Ney D, Weiss J, Kind A, Robbins J. Senescent swallowing: impact, strategies and interventions. Nutrit Clin Pract. (2009) 24:395–413. doi: 10.1177/0884533609332005
16. Logemann JA. Evaluation and Treatment of Swallowing Disorders. 2nd ed. Austin, TX: Pro-Ed (1998).
17. Langmore SE, Terpenning MS, Schork A, Chen Y, Murray JT, Lopatin D, et al. Predictors of aspiration pneumonia: how important is dysphagia? Dysphagia (1998) 13:69–81.
18. Miller N, Noble E, Jones D, Burn D. Hard to swallow: dysphagia in Parkinson's disease. Age Ageing (2006) 35:614–8. doi: 10.1093/ageing/afl105
19. Chen PH, Golub JS, Hapner ER, Johns MM III. Prevalence of perceived dysphagia and quality-of-life impairment in a geriatric population. Dysphagia (2009) 24:1–6. doi: 10.1007/s00455-008-9156-1
20. Ashford J, McCabe D, Wheeler-Hegland K, Frymark T, Mullen R, Musson N, et al. Evidence-based systematic review: oropharyngeal dysphagia behavioral treatments. Part III-Impact of dysphagia treatments on populations with neurological disorders. J Rehabil Res Dev. (2009) 46:195–204. doi: 10.1682/JRRD.2008.08.0091
21. McCabe D, Ashford J, Wheeler-Hegland K, Frymark T, Mullen R, Musson N, et al. Evidence-based systematic review: oropharyngeal dysphagia behavioral treatments. Part IV-Impact of dysphagia treatment on individuals' postcancer treatments. J Rehabil Res Dev. (2009) 46:205–14. doi: 10.1682/JRRD.2008.08.0092
22. Wheeler-Hegland K, Frymark T, Schooling T, McCabe D, Ashford J, Mullen R, et al. Evidence-based systematic review: oropharyngeal dysphagia behavioral treatments. Part V-Applications for clinicians and researchers. J Rehabil Res Dev. (2009) 46:215–22. doi: 10.1682/JRRD.2008.08.0093
23. Humbert IA, German RZ. New directions for understanding neural control in swallowing: the potential and promise of motor learning. Dysphagia (2013) 28:1–10. doi: 10.1007/s00455-012-9432-y
24. Michou E, Hamdy S. Dysphagia in Parkinson's disease: a therapeutic challenge? Exp Rev Neurother. (2010) 10:875–8. doi: 10.1586/ern.10.60
25. Harbourne RT, Stergiou N. Movement variability and the use of nonlinear tools: principles to guide physical therapist practice. Phys Ther. (2009) 89:267–82. doi: 10.2522/ptj.20080130
26. Stergiou N, Harbourne R, Cavanaugh J. Optimal movement variability: a new theoretical perspective for neurologic physical therapy. J Neurol Phys Ther. (2006) 30:120–9. doi: 10.1097/01.NPT.0000281949.48193.d9
27. Neishabouri A, Faisal AA. Axonal noise as a source of synaptic variability. PLoS Computat Biol. (2014) 10:e1003615. doi: 10.1371/journal.pcbi.1003615
28. Faisal AA, Selen LP, Wolpert DM. Noise in the nervous system. Nat Rev Neurosci. (2008) 9:292–303. doi: 10.1038/nrn2258
29. Chaisanguanthum KS, Shen HH, Sabes PN. Motor variability arises from a slow random walk in neural state. J Neurosci. (2014) 34:12071–80. doi: 10.1523/JNEUROSCI.3001-13.2014
30. Woolley SC, Rajan R, Joshua M, Doupe AJ. Emergence of context-dependent variability across a basal ganglia network. Neuron (2014) 82:208–23. doi: 10.1016/j.neuron.2014.01.039
31. Lisberger SG, Medina JF. How and why neural and motor variation are related. Curr Opin Neurobiol. (2015) 33:110–6. doi: 10.1016/j.conb.2015.03.008
32. Tracy BL, Maluf KS, Stephenson JL, Hunter SK, Enoka RM. Variability of motor unit discharge and force fluctuations across a range of muscle forces in older adults. Muscle Nerve (2005) 32:533–40. doi: 10.1002/mus.20392
33. Moritz CT, Barry BK, Pascoe MA, Enoka RM. Discharge rate variability influences the variation in force fluctuations across the working range of a hand muscle. J Neurophysiol. (2005) 93:2449–59. doi: 10.1152/jn.01122.2004
34. Churchland MM, Afshar A, Shenoy KV. A central source of movement variability. Neuron (2006) 52:1085–96. doi: 10.1016/j.neuron.2006.10.034
35. Oostwoud Wijdenes L, Ivry RB, Bays PM. Competition between movement plans increases motor variability: evidence of a shared resource for movement planning. J Neurophysiol. (2016) 116:1295–303. doi: 10.1152/jn.00113.2016
36. Haar S, Donchin O, Dinstein I. Individual movement variability magnitudes are explained by cortical neural variability. J Neurosci. (2017) 37:9076–85. doi: 10.1523/JNEUROSCI.1650-17.2017
37. Saberi-Moghadam S, Ferrari-Toniolo S, Ferraina S, Caminiti R, Battaglia-Mayer A. Modulation of neural variability in premotor, motor, and posterior parietal cortex during change of motor intention. J Neurosci. (2016) 36:4614–23. doi: 10.1523/JNEUROSCI.3300-15.2016
38. van Beers RJ, Haggard P, Wolpert DM. The role of execution noise in movement variability. J Neurophysiol. (2004) 91:1050–63. doi: 10.1152/jn.00652.2003
39. Kruger M, Straube A, Eggert T. The propagation of movement variability in time: a methodological approach for discrete movements with multiple degrees of freedom. Front Computat Neurosci. (2017) 11:93. doi: 10.3389/fncom.2017.00093
40. Mickeviciene D, Skurvydas A, Karanauskiene D. Is intraindividual variability different between unimanual and bimanual speed–accuracy movements? Percept Mot Skills (2015) 120:125–38. doi: 10.2466/25
41. Bertucco M, Bhanpuri NH, Sanger TD. Perceived cost and intrinsic motor variability modulate the speed–accuracy trade-off. PLoS ONE (2015) 10:e0139988. doi: 10.1371/journal.pone.0139988
42. Dhawale AK, Smith MA, Olveczky BP. The role of variability in motor learning. Ann Rev Neurosci. (2017) 40:479–98. doi: 10.1146/annurev-neuro-072116-031548
43. Woolley SC, Kao MH. Variability in action: contributions of a songbird cortical-basal ganglia circuit to vocal motor learning and control. Neuroscience (2015) 296:39–47. doi: 10.1016/j.neuroscience.2014.10.010
44. Wu HG, Miyamoto YR, Gonzalez Castro LN, Olveczky BP, Smith MA. Temporal structure of motor variability is dynamically regulated and predicts motor learning ability. Nat Neurosci. (2014) 17:312–21. doi: 10.1038/nn.3616
45. Pekny SE, Izawa J, Shadmehr R. Reward-dependent modulation of movement variability. J Neurosci. (2015) 35:4015–24. doi: 10.1523/JNEUROSCI.3244-14.2015
46. Barbado Murillo D, Caballero Sanchez C, Moreside J, Vera-Garcia FJ, Moreno FJ. Can the structure of motor variability predict learning rate? J Exp Psychol. (2017) 43:596–607. doi: 10.1037/xhp0000303
47. Oku T, Furuya S. Skilful force control in expert pianists. Exp Brain Res. (2017) 235:1603–15. doi: 10.1007/s00221-017-4926-3
48. Cohen RG, Sternad D. Variability in motor learning: relocating, channeling and reducing noise. Exp Brain Res. (2009) 193:69–83. doi: 10.1007/s00221-008-1596-1
49. Martens J, Daly D, Deschamps K, Fernandes RJ, Staes F. Intra-individual variability of surface electromyography in front crawl swimming. PLoS ONE (2015) 10:e0144998. doi: 10.1371/journal.pone.0144998
50. Stepanek L, Doupe AJ. Activity in a cortical–basal ganglia circuit for song is required for social context-dependent vocal variability. J Neurophysiol. (2010) 104:2474–86. doi: 10.1152/jn.00977.2009
51. Santuz A, Ekizos A, Eckardt N, Kibele A, Arampatzis A. Challenging human locomotion: stability and modular organisation in unsteady conditions. Sci Rep. (2018) 8:2740. doi: 10.1038/s41598-018-21018-4
52. Pradhan S, Scherer R, Matsuoka Y, Kelly VE. Grip force modulation characteristics as a marker for clinical disease progression in individuals with Parkinson disease: case-control study. Phys Ther. (2015) 95:369–79. doi: 10.2522/ptj.20130570
53. Vaillancourt DE, Slifkin AB, Newell KM. Inter-digit individuation and force variability in the precision grip of young, elderly, and Parkinson's disease participants. Mot Control (2002) 6:113–28. doi: 10.1123/mcj.6.2.113
54. Alberts JL, Saling M, Adler CH, Stelmach GE. Disruptions in the reach-to-grasp actions of Parkinson's patients. Exp Brain Res. (2000) 134:353–62. doi: 10.1007/s002210000468
55. Arias P, Robles-Garcia V, Espinosa N, Corral Y, Cudeiro J. Validity of the finger tapping test in Parkinson's disease, elderly and young healthy subjects: is there a role for central fatigue? Clinical Neurophysiology (2012) 123:2034–41. doi: 10.1016/j.clinph.2012.04.001
56. Baltadjieva R, Giladi N, Gruendlinger L, Peretz C, Hausdorff JM. Marked alterations in the gait timing and rhythmicity of patients with de novo Parkinson's disease. Eur J Neurosci. (2006) 24:1815–20. doi: 10.1111/j.1460-9568.2006.05033.x
57. Chang SH, Francisco GE, Zhou P, Rymer WZ, Li S. Spasticity, weakness, force variability, and sustained spontaneous motor unit discharges of resting spastic-paretic biceps brachii muscles in chronic stroke. Muscle Nerve (2013) 48:85–92. doi: 10.1002/mus.23699
58. Sadnicka A, Stevenson A, Bhatia KP, Rothwell JC, Edwards MJ, Galea JM. High motor variability in DYT1 dystonia is associated with impaired visuomotor adaptation. Sci Rep. (2018) 8:3653. doi: 10.1038/s41598-018-21545-0
59. Rosengren KS, Deconinck FJ, Diberardino LA 3rd, Polk JD, Spencer-Smith J, De Clercq D, et al. Differences in gait complexity and variability between children with and without developmental coordination disorder. Gait Posture (2009) 29:225–9. doi: 10.1016/j.gaitpost.2008.08.005
60. Smits-Engelsman BC, Wilson PH. Noise, variability, and motor performance in developmental coordination disorder. Dev Med Child Neurol. (2013) 55 (Suppl. 4):69–72. doi: 10.1111/dmcn.12311
61. Kurz MJ, Heinrichs-Graham E, Arpin DJ, Becker KM, Wilson TW. Aberrant synchrony in the somatosensory cortices predicts motor performance errors in children with cerebral palsy. J Neurophysiol. (2014) 111:573–9. doi: 10.1152/jn.00553.2013
62. Bulea TC, Stanley CJ, Damiano DL. Part 2: Adaptation of gait kinematics in unilateral Cerebral Palsy demonstrates preserved independent neural control of each limb. Front Hum Neurosci. (2017) 11:50. doi: 10.3389/fnhum.2017.00050
63. Jones CA, Ciucci MR. Multimodal swallowing evaluation with high–resolution manometry reveals subtle swallowing changes in early and mid–stage Parkinson disease. J Parkinson's Dis. (2016) 6:197–208. doi: 10.3233/JPD-150687
64. Jones CA, Hoffman MR, Lin L, Abdelhalim S, Jiang JJ, McCulloch TM. Identification of swallowing disorders in early and mid-stage Parkinson's disease using pattern recognition of pharyngeal high-resolution manometry data. Neurogastroenterol Motil. (2017) 30:e13236. doi: 10.1111/nmo.13236
65. Peladeau-Pigeon M, Steele CM. Age-related variability in tongue pressure patterns for maximum isometric and saliva swallowing tasks. J Speech Lang Hear Res. (2017) 60:3177–84. doi: 10.1044/2017_JSLHR-S-16-0356
66. Solomon NP, Robin DA, Luschei ES. Strength, endurance, and stability of the tongue and hand in Parkinson disease. J Speech Lang Hear Res. (2000) 43:256–67. doi: 10.1044/jslhr.4301.256
67. Logemann JA. Manual for the Videofluoroscopic Study of Swallowing. London: Taylor & Francis (1986).
68. Langmore SE, Schatz K, Olson N. Endoscopic and videofluoroscopic evaluations of swallowing and aspiration. Ann Otol Rhinol Laryngol. (1991) 100:678–81.
69. Baijens LW, Speyer R, Passos VL, Pilz W, Roodenburg N, Clave P. Swallowing in Parkinson patients versus healthy controls: reliability of measurements in videofluoroscopy. Gastroenterol Res Pract. (2011) 2011:380682. doi: 10.1155/2011/380682
70. Bonilha HS, Humphries K, Blair J, Hill EG, McGrattan K, Carnes B, et al. Radiation exposure time during MBSS: influence of swallowing impairment severity, medical diagnosis, clinician experience, and standardized protocol use. Dysphagia (2013) 28:77–85. doi: 10.1007/s00455-012-9415-z
71. Fox MR, Bredenoord AJ. Oesophageal high-resolution manometry: moving from research into clinical practice. Gut (2008) 57:405–23. doi: 10.1136/gut.2007.127993
72. McCulloch TM, Hoffman MR, Ciucci MR. High-resolution manometry of pharyngeal swallow pressure events associated with head turn and chin tuck. Ann Otol Rhinol Laryngol. (2010) 119:369–76. doi: 10.1177/000348941011900602
73. Stratton P, Cheung A, Wiles J, Kiyatkin E, Sah P, Windels F. Action potential waveform variability limits multi-unit separation in freely behaving rats. PLoS ONE (2012) 7:e38482. doi: 10.1371/journal.pone.0038482
74. Collins SM, Arzbaecher RC. An efficient algorithm for waveform analysis using the correlation coefficient. Comput Biomed Res. (1981) 14:381–9.
75. Hassanpour H, Darvishi A, Khalili A. A regression-based approach for measuring similarity in discrete signals. Int J Electron. (2011) 98:1141–56. doi: 10.1080/00207217.2011.589740
76. Herzel H, Berry D, Titze I, Steinecke I. Nonlinear dynamics of the voice: signal analysis and biomechanical modeling. Chaos (1995) 5:30–4. doi: 10.1063/1.166078
77. Dingwell JB, Cusumano JP. Nonlinear time series analysis of normal and pathological human walking. Chaos (2000) 10:848–63. doi: 10.1063/1.1324008
78. Alibeji NA, Kirsch NA, Sharma N. A muscle synergy-inspired adaptive control scheme for a hybrid walking neuroprosthesis. Front Bioeng Biotechnol. (2015) 3:203. doi: 10.3389/fbioe.2015.00203
79. Golestani M, Mobayen S, Tchier F. Adaptive finite–time tracking control of uncertain non-linear n-order systems with unmatched uncertainties. IET Control Theory Appl. (2016) 10:1675–83. doi: 10.1049/iet-cta.2016.0163
80. O'Dwyer N, Smith R, Halaki M, Rattanaprasert U. Independent assessment of pattern and offset variability of time series waveforms. Gait Posture. (2009) 29:285–9. doi: 10.1016/j.gaitpost.2008.09.005
81. Campos LA, Pereira VL Jr, Muralikrishna A, Albarwani S, Bras S, Gouveia S. Mathematical biomarkers for the autonomic regulation of cardiovascular system. Front Physiol. (2013) 4:279. doi: 10.3389/fphys.2013.00279
82. Johnson RE, Kording KP, Hargrove LJ, Sensinger JW. EMG versus torque control of human-machine systems: equalizing control signal variability does not equalize error or encertainty. IEEE Trans Neural Syst Rehabil Eng. (2017) 25:660–7. doi: 10.1109/TNSRE.2016.2598095
83. Almosnino S, Stevenson JM, Day AG, Bardana DD, Diaconescu ED, Dvir Z. Discriminating between maximal and feigned isokinetic knee musculature performance using waveform similarity measures. Clin Biomech. (2012) 27:377–83. doi: 10.1016/j.clinbiomech.2011.10.007
84. Picerno P, Cereatti A, Cappozzo A. Joint kinematics estimate using wearable inertial and magnetic sensing modules. Gait Posture. (2008) 28:588–95. doi: 10.1016/j.gaitpost.2008.04.003
85. Percentage, Difference Between Two Signals 2014 Available online at: http://dsp.stackexchange.com/questions/14306/percentagedifferencebetweentwosignals
86. Hershler C, Milner M. An optimality criterion for processing electromyographic (EMG) signals relating to human locomotion. IEEE Trans Biomed Eng. (1978) 25:413–20. doi: 10.1109/TBME.1978.326338
87. Derrick TR, Bates BT, Dufek JS. Evaluation of time-series data sets using the Pearson product-moment correlation coefficient. Med Sci Sports Ex. (1994) 26:919–28. doi: 10.1249/00005768-199407000-00018
88. Chan PY, Wong HK, Goh JC. The repeatablity of spinal motion of normal and scoliotic adolescents during walking. Gait Posture (2006) 24:219–28. doi: 10.1016/j.gaitpost.2005.09.003
89. Kadaba MP, Ramakrishnan HK, Wootten ME, Gainey J, Gorton G, Cochran GV. Repeatability of kinematic, kinetic, and electromyographic data in normal adult gait. J Orthopaedic Res. (1989) 7:849–60. doi: 10.1002/jor.1100070611
90. van de Wassenberg WJ, van der Hoeven JH, Leenders KL, Maurits NM. Quantifying interhemispheric symmetry of somatosensory evoked potentials with the intraclass correlation coefficient. J Clin Neurophysiol. (2008) 25:139–46. doi: 10.1097/WNP.0b013e31817759e2
91. Standing RJ, Maulder PS. The biomechanics of standing start and initial acceleration: reliability of the key determining kinematics. J Sports Sci Med. (2017) 16:154–62.
92. Salarian A. Intraclass Correlation Coefficient (ICC). 1.3.1 ed: MathWorks; p. Calculate any of 6 Different ICCs with Confidence Intervals (2016).
93. Mechmeche I, Mitiche A, Ouakrim Y, De Guise JA, Mezghani N. Data correction to determine a representative pattern of a set of 3D knee kinematic measurements. In: 38th Annual International Conference of the IEEE Engineering in Medicine and Biology Society. Orlando, FL (2016).
94. Danziger Z. Discrete Frechet Distance. MathWorks File Exchange (2013). Available online at: https://www.mathworks.com/matlabcentral/fileexchange/31922-discrete-frechet-distance (Accessed April 27, 2017).
95. Gasser M, Flexer A, Grill T. On computing morphological similarity of audio signals. In: Sound Music Computing. Padova (2011).
96. Wang Q. Dynamic Time Warping (DTW). MathWorks File Exchange (2014). Available online at: https://www.mathworks.com/matlabcentral/fileexchange/43156-dynamic-time-warping–dtw- (Accessed April 20, 2017).
97. Horsak B, Pobatschnig B, Baca A, Greber–Platzer S, Kreissl A, Nehrer S, et al. Within-assessor reliability and minimal detectable change of gait kinematics in a young obese demographic. Gait Posture (2017) 54:112–8. doi: 10.1016/j.gaitpost.2017.02.028
98. Sarnthein J, Andersson M, Zimmermann MB, Zumsteg D. High test-retest reliability of checkerboard reversal visual evoked potentials (VEP) over 8 months. Clin Neurophysiol. (2009) 120:1835–40. doi: 10.1016/j.clinph.2009.08.014
99. Iosa M, Cereatti A, Merlo A, Campanini I, Paolucci S, Cappozzo A. Assessment of waveform similarity in clinical gait data: the linear fit method. BioMed Res Int. (2014) 2014:214156. doi: 10.1155/2014/214156
100. Random.org. Gaussian Random Number Generator (2017). Available online at: https://www.random.org/gaussian-distributions/
101. McCulloch TM. Normative data and clinical value of pharyngeal high-resolution manometry: a technology and procedure development thesis. Triol Soc. (2015) 94:601–8. doi: 10.1055/s-0034-1395532
102. Jones CA, Ciucci MR, Hammer MJ, McCulloch TM. A multisensor approach to improve manometric analysis of the upper esophageal sphincter. Laryngoscope (2016) 126:657–64. doi: 10.1002/lary.25506
103. Rosen SP, Jones CA, McCulloch TM. Pharyngeal swallowing pressures in the base-of-tongue and hypopharynx regions identified with three-dimensional manometry. Laryngoscope (2017) 127:1989–95. doi: 10.1002/lary.26483
104. Meyer JP, Jones CA, Walczak CC, McCulloch TM. Three-dimensional manometry of the upper esophageal sphincter in swallowing and nonswallowing tasks. Laryngoscope (2016) 126:2539–45. doi: 10.1002/lary.25957
105. Juan J, Hind J, Jones C, McCulloch T, Gangnon R, Robbins J. Case study: application of isometric progressive resistance oropharyngeal therapy using the Madison Oral Strengthening Therapeutic device. Top Stroke Rehabil. (2013) 20:450–70. doi: 10.1310/tsr2005-450
106. Yano J, Aoyagi Y, Ono T, Hori K, Yamaguchi W, Fujiwara S, et al. Sequential coordination between lingual and pharyngeal pressures produced during dry swallowing. BioMed Res Int. (2014) 2014:691352. doi: 10.1155/2014/691352
107. Huckabee ML, Lamvik K, Jones R. Pharyngeal mis-sequencing in dysphagia: characteristics, rehabilitative response, and etiological speculation. J Neurol Sci. (2014) 343:153–8. doi: 10.1016/j.jns.2014.05.064
108. Szczesniak MM, Rommel N, Dinning PG, Fuentealba SE, Cook IJ, Omari TI. Optimal criteria for detecting bolus passage across the pharyngo-oesophageal segment during the normal swallow using intraluminal impedance recording. Neurogastroenterol Motil. (2008) 20:440–7. doi: 10.1111/j.1365-2982.2007.01053.x
109. Knigge MA, Thibeault S, McCulloch TM. Implementation of high-resolution manometry in the clinical practice of speech language pathology. Dysphagia (2014) 29:2–16. doi: 10.1007/s00455-013-9494-5
110. Nakayama E, Tohara H, Hiraba H, Sanpei R, Wakasa H, Ohno S, et al. Effects of reclining posture on velopharyngeal closing pressure during swallowing and phonation. J Oral Rehabil. (2013) 40:450–6. doi: 10.1111/joor.12050
111. Cook I, Dodds W, Dantas R, Kern M, Massey B, Shaker R, et al. Timing of videofluoroscopic, manometric events, and bolus transit during the oral and pharyngeal phases of swallowing. Dysphagia (1989) 4:8–15.
112. Kahrilas PJ, Logemann JA, Lin S, Ergun GA. Pharyngeal clearance during swallowing: a combined manometric and videofluoroscopic study. Gastroenterology (1992) 103:128–36. doi: 10.1016/0016-5085(92)91105-D
113. Olsson R, Nilsson H, Ekberg O. Simultaneous videoradiography and pharyngeal solid state manometry (videomanometry) in 25 nondysphagic volunteers. Dysphagia (1995) 10:36–41. doi: 10.1007/BF00261278
114. Asoh R, Goyal RK. Monometry and electromyography of the upper esophageal sphincter in the opossum. Gastroenterology (1978) 74:514–20.
115. Ertekin C, Pehlivan M, Aydogdu I, Ertas M, Uludag B, Celebi G, et al. An electrophysiological investigation of deglutition in man. Muscle Nerve (1995) 18:1177–86.
116. van Overbeek JJM, Wit HP, Paping RHL, Segenhout HM. Simultaneous manometry and electromyography in the pharyngoesophageal segment. Laryngoscope (1985) 95:582–4. doi: 10.1288/00005537-198505000-00011
117. Lang IM, Shaker R. An update on the physiology of the components of the upper esophageal sphincter. Dysphagia (1994) 9:229–32. doi: 10.1007/BF00301915
118. Bammer T, Salassa JR, Klingler PJ. Comparison of methods for determining cricopharyngeal intrabolus pressure in normal patients as possible indicator for cricopharyngeal myotomy. Otolaryngol Head Neck Surg. (2002) 127:299–308. doi: 10.1067/mhn.2002.128554
119. Jacob P, Kahrilas PJ, Logemann JA, Shah V, Ha T. Upper esophageal sphincter opening and modulation during swallowing. Gastroenterology (1989) 97:1469–78. doi: 10.1016/0016-5085(89)90391-0
120. Ghosh SK, Pandolfino JE, Zhang Q, Jarosz A, Kahrilas PJ. Deglutitive upper esophageal sphincter relaxation: a study of 75 volunteer subjects using solid-state high-resolution manometry. American Journal of Physiology-Gastrointestinal and Liver Physiology (2006) 291:G525–31. doi: 10.1152/ajpgi.00081.2006
121. Reynolds RP, Effer GW, Bendeck MP. The upper esophageal sphincter in the cat: the role of central innervation assessed by transient vagal blockade. Can J Physiol Pharmacol. (1987) 65:96–9. doi: 10.1139/y87-019
122. Cook IJ, Dodds WJ, Dantas RO, Massey B, Kern MK, Lang IM, et al. Opening mechanisms of the human upper esophageal sphincter. Am J Physiol. (1989) 257:G748–59. doi: 10.1152/ajpgi.1989.257.5.G748
123. Isberg A, Nilsson ME, Schiratzki H. Movement of the upper esophageal sphincter and a manometric device during deglutition: a cineradiographic investigation. Acta Radiol Diag. (1985) 26:381–8. doi: 10.1177/028418518502600404
Keywords: deglutition, pressure, variability, high-resolution manometry, pharyngeal pressure
Citation: Jones CA, Meisner EL, Broadfoot CK, Rosen SP, Samuelsen CR and McCulloch TM (2018) Methods for Measuring Swallowing Pressure Variability Using High-Resolution Manometry. Front. Appl. Math. Stat. 4:23. doi: 10.3389/fams.2018.00023
Received: 26 March 2018; Accepted: 08 June 2018;
Published: 02 July 2018.
Edited by:
Axel Hutt, German Meteorological Service, GermanyReviewed by:
Meysam Hashemi, INSERM U1106 Institut de Neurosciences des Systèmes, FranceSaleh Mobayen, University of Zanjan, Iran
Copyright © 2018 Jones, Meisner, Broadfoot, Rosen, Samuelsen and McCulloch. This is an open-access article distributed under the terms of the Creative Commons Attribution License (CC BY). The use, distribution or reproduction in other forums is permitted, provided the original author(s) and the copyright owner(s) are credited and that the original publication in this journal is cited, in accordance with accepted academic practice. No use, distribution or reproduction is permitted which does not comply with these terms.
*Correspondence: Timothy M. McCulloch, bWNjdWxsQHN1cmdlcnkud2lzYy5lZHU=