 John Violos
 Konstantinos Tserpes
 Iraklis Varlamis
 Theodora Varvarigou1
- 1Department of Electrical and Computer Engineering, National Technical University of Athens, Athens, Greece
- 2Department of Informatics and Telematics, Harokopio University of Athens, Athens, Greece
A prominent challenge in our information age is the classification over high frequency data streams. In this research, we propose an innovative and high-accurate text stream classification model that is designed in an elastic distributed way and is capable to service text load with fluctuated frequency. In this classification model, text is represented as N-Gram Graphs and the classification process takes place using text pre-processing, graph similarity and feature classification techniques following the supervised machine learning approach. The work involves the analysis of many variations of the proposed model and its parameters, such as various representations of text as N-Gram Graphs, graph comparisons metrics and classification methods in order to conclude to the most accurate setup. To deal with the scalability, the availability and the timely response in case of high frequency text we employ the Beam programming model. Using the Beam programming model the classification process occurs as a sequence of distinct tasks and facilitates the distributed implementation of the most computational demanding tasks of the inference stage. The proposed model and the various parameters that constitute it are evaluated experimentally and the high frequency stream emulated using two public datasets (20NewsGroup and Reuters-21578) that are commonly used in the literature for text classification.
Introduction
Text classification is a supervised machine learning technique that is being frequently used in the context of many applications such as event detection [1] and sentiment analysis [2]. Knowledge models are built from training data to make decisions regarding the label of newly arrived text. Text streams typically generate continuously small size texts, which can be sent simultaneously or frequently to a subscriber who then performs a continuous, low-latency processing on them. In this context, a single node classification approach can become a bottleneck under real time requirements, and therefore, distributed solutions or novel data models and algorithms are preferred at the expense of traditional approaches that assume fixed-size, historical datasets.
The majority of the applications processing text streams are subjected to the following four main constraints: Single-pass of observations, real-time response, bounded memory and concept drift as defined by Nguyen et al. [3]. The concept drift is an issue that has drawn the attention of researchers and many models have been proposed to tackle it [4, 5]. In this research we propose a streaming text classification method that uses the n-gram graph representation model and designed with the scalable, asynchronous, and highly reliable Beam programming model [6] (the programming model/SDK portion of Google Cloud Dataflow) in order to provide high accuracy predictions, in real time, in a single pass and using bounded memory.
Most text classification algorithms use the bag of words model in combination with Bayes probabilistic models [7], neural networks [8], and multidimensional hyperplane techniques [9] to estimate the probability of a text belonging in a class. An alternative representation model for text classification needs is the N-gram graphs (NGG), which uses graphs to represent text. In these graphs, a vertex represents a text's N-Gram and an edge joins adjacent N-grams. The frequency of adjacencies can be denoted as weights on the graph edges. Mapping text to this representation model allows for the capturing of significant text characteristics that go beyond mere vocabulary and grammar. Then, by comparing graphs, one can identify similar texts or the most relative topic class in which it belongs.
The proposed model is examined under multiple variations in order to conclude to the most accurate model. Such variations include weighted and unweighted graphs, N-grams ranks that span from 2 to 10, text pre-processing methods, different graph similarity techniques and eventually classification techniques. All those are examined exhaustively in order to conclude to the most accurate setup with the lowest computation and memory demands. Furthermore, in order to ensure that the dependencies between the various stages of the pipeline are minimized, the model is designed so as to operate in a distributed, asynchronous and scalable way.
The N-gram graph classification model combines the benefits of N-gram flexibility with the well-structured representation of directed graphs. Every extracted letter sequence from a text can be formed as N-gram and the relation of these N-grams can be reflected using a Graph. The text classification problem can be reduced in a graph theory and pattern matching problem. The use of NGG model overcomes some limitations of the Bag of Words model such as the word order omission [10] and misspelling [11]. The mapping of texts to N-gram graphs and the comparison between them reduces the dimensionality of the feature space and as consequence, it also reduces the complexity of the classification method.
This research has two main goals: on one hand to propose an innovative and highly accurate text classification technique and on the other to propose a distributed model that can process streaming predictions under real time constraints. We carried out the experimental evaluation on 20NewsGroup and Reuters-21578 datasets which are two of the most-widely used text classification datasets. These datasets were transformed to a text stream using the pub/sub model [12]. The stream is then fed to the NGG classification pipeline. The experimental results confirmed in a robust and generic manner the effectiveness of the theoretical proposed model. We used 10-fold cross-validation with Micro and Macro evaluation metrics to demonstrate the accuracy of categories' prediction. The results show that the proposed model is practical, effective and in many cases, outperforms other state of the art classification methods.
The rest of this document is structured as such: Section Related Work briefly reviews batch and streaming text classification methods and introduces the corresponding programming model with the computing infrastructure used in this research. The extensive presentation of the proposed model and its variants is following in section Contribution of our Work. Section Model and Approach explains the experimental setup and discusses the results when compared against other baseline text classification methods. Finally, in section Evaluation, we state the derived conclusions and the future work.
Related Work
The streaming text classification techniques are mainly variations or adaptations of batch text classification approaches with the objective to satisfy the streaming nature of data. Bayesian text classification in combination with a lifelong learner [7] has been applied as a continuous method to extract knowledge from newly arriving observations. Another lifelong text streaming classification that uses an SVM classifier has been proposed by Xing et al. [9]. Both models that adopt lifelong learners can estimate the distribution of novel classes much better than incremental learners.
Ensemble text streaming classification methods are widely used for their capability to combine merits from different classification techniques [13]. Iterative Boosting Streaming [14] is an ensemble method that automatically adjusts its model to new concepts by adding base learners according to its current accuracy. Learning and classifying multi-label data streams has been proposed based on a multi-label k-nn and an adjust weight function [15] which combined the predictions in an efficient and high-speed way. An ensemble of models for each class and each classifier model has been proposed [16] as a method to resolve the misclassifying trend of recurring classes, which are classes that disappear from the stream for a long time and reappear, from novel classes.
Decision trees have adapted the Hoeffding bound [17] to choose an optimal splitting attribute across the throughput of streaming data. Hoeffding bound quantifies the number of observations needed to gage the goodness of a text feature and has better performance than non-incremental learners who use unbounded observations. In the same way, Random forests have incorporated an adaptive algorithm [18] to effectively resample the streaming text in order to cope with the rapidly evolving content using a bootstrap aggregating process and limiting the leaf splits decisions to a subset of features. Text streaming processing software platforms are also available such as RapidMiner [19] and Massive Online Analysis (MOA) [20] providing a set of classification, clustering and regression techniques over streaming data. MOA also provides two classifiers that address specifically the concept drift phenomenon: Probabilistic Adaptive Windowing and Self-Adjusting Memory.
Deep learning has attracted substantial attention [21] as a prominent active learning technique concerning batch and streaming data [22]. Deep convolutional networks [23] show significant outcomes as the depth of the neural networks increases using small convolutions and pooling operations directly at a character level. Convolution neural networks with a Bidirectional Recurrent layer that use pre-trained word vectors reduce the loss of local information and capture the dependencies across the textual sequences [24]. Deep belief networks have also been combined with the softmax regression technique [8] in order to solve the high-dimensional computation problem of text data. Those deep learning techniques have quickly found their way in programming frameworks such as Apache Spark based on Sima et al. [25]. Furthermore, Read et al. [26] have proposed an adjustment of streaming classification using Boltzman Machines and Deep Belief networks.
A distributed, scalar and low latency model can support the text classification algorithms over high frequency data streams in terms of efficiency and efficacy. Cloud environments is a widely accepted solution satisfying computation, memory and throughput demands in cost-effective solutions. An overview of software tools and technologies for developing scalable data analysis on clouds is provided by Belcastro et al. [27]. A review on stream processing engine and tools provided as a service include Amazon Kinesis, Google dataflow and Azure stream analytics [28]. In this work challenges such as those posed by the data deluge, the placement of streams, the identification of bottlenecks, the application scheduling and adaption, and the resource allocation are investigated to match the demands of stream processing services in elastic data.
The N-gram graph classification method that was used in our work was based on the Beam programming model [6]. Beam holds distinct advantages compared to Spark and Hadoop as it unifies batch and streaming data and provides a comprehensive way for out-of-order processing with features such as event-time windows, watermarks and triggers. Beam also has great autoscaling capabilities [29] and very flexible, expandable and modular capabilities [30] to design data processing pipelines.
Finally, the N-gram graphs model that we employed, is a prominent representation model that differs from the widely used Bag of Words (BoW) model. In the BoW model, text is represented as a multiset of items such as words or n-grams disregarding the items' sequence. N-gram graphs can keep the item sequence and represent text in a more flexible and coherent way. The N-gram graphs representation model has been initially proposed for the evaluation of text summarization tasks [31]. It has also been applied to document clustering tasks [32], for sentiment analysis on twitter content [33] and it is still an open field for further research and applications.
Contribution of Our Work
The contribution of our research compared to the related work and the existed literature is 2-fold. Firstly, we apply the N-Gram Graph representation model to tackle the text classification problem and secondly we expanded the text classification process in a distributed way in order to address high-frequency text streams. The N-Gram Graph representation model involves a set of parameters such as the rank of N, the use of weighted or unweighted graphs, graph similarity metrics, and classification techniques. In this research, we made an extended analysis and experimental evaluation of all these parameters and show their impact in the classification accuracy. We concluded to a setup of parameters that overpass other text classification techniques.
In terms of high-frequency text streams, we present an efficient classification technique that is capable to provide timely response independently of the incoming text frequency using a distributed programmatic model and cloud computing infrastructures in an elastic way. This is an advantage of our work in comparison with other streaming classification techniques that are mainly capable to manipulate static frequency of text streams and cannot scale up or scale down in relation with the incoming text workload.
Most text classification algorithms use the BOW model, which denotes the words that are included in a text discarding the information about their sequence. This limitation of the BOW model can be resolved through the use of graph representations. Graphs are able to capture the vicinity of words or N-grams in a text, enabling them to outperform the BOW model. Word graphs have been used in the fields of topic modeling using words or N-grams as nodes [34]. Character N-grams is a better option than words because of their intrinsic capability to capture notions that surpass mere vocabulary and relate to the daily, even informal use of language, making them ideal for user generated content data models. A character N-gram can encompass the end of the first word and the beginning of the second reinforcing the representation of word sequence. Furthermore, they are tolerant in misspelling and the use of alternative styles to a word [35]. Word similarities can be detected even if prefixes or endings have been used or even if a word is written with an unusual way since N-grams decompose a complex word in its parts.
Partial word matching is not supported in most classification methods. If a word is misspelled even for one letter it is considered as a different word. A misspelled word happens by mistake or by intention (e.g., slang and neologisms). NGG can detect the word deviations and gage them as partial equal with a percentage of the generated N-grams be affected but some others be not. Another common issue in text classification methods is the polysemy of words, i.e., one word bearing various meanings. This problem can be resolved taking into consideration the context of the words. The neighboring words offer the information to detect the real meaning and shed light in the disambiguation of a word. The proposed model can mitigate the polysemy because NGG are based on the proximity of subsequent N-grams and never treat a word as a single extracted instance.
Model and Approach
Our approach employs a generic multiclass, graph based framework for text stream classification. The proposed methodology consists of five stages namely text pre-processing, graph construction, graph similarity, vector representation and classification. These stages have been designed as a sequence of distinct tasks and subtasks with the more resource demanding tasks to be able to scaled up or scaled down in relation with the workload of incoming text streams. All these stages are described in the following paragraphs in correlation with the intrinsic benefits of the N-Gram graphs representation model for the needs of text classification and their capability to be deployed in a distributed system.
Text and topic categories can be represented in a comprehensive and summarized way as N-gram Graphs. The comparison of these graphs can be quantified to provide a measure of similarity between a text with the corresponding topic categories as depicted in Figure 1. The proposed classification model can leverage on distributed solutions for transformations and comparisons, thus enhancing the predictions' accuracy and decreasing the processing latency in a scalar way.
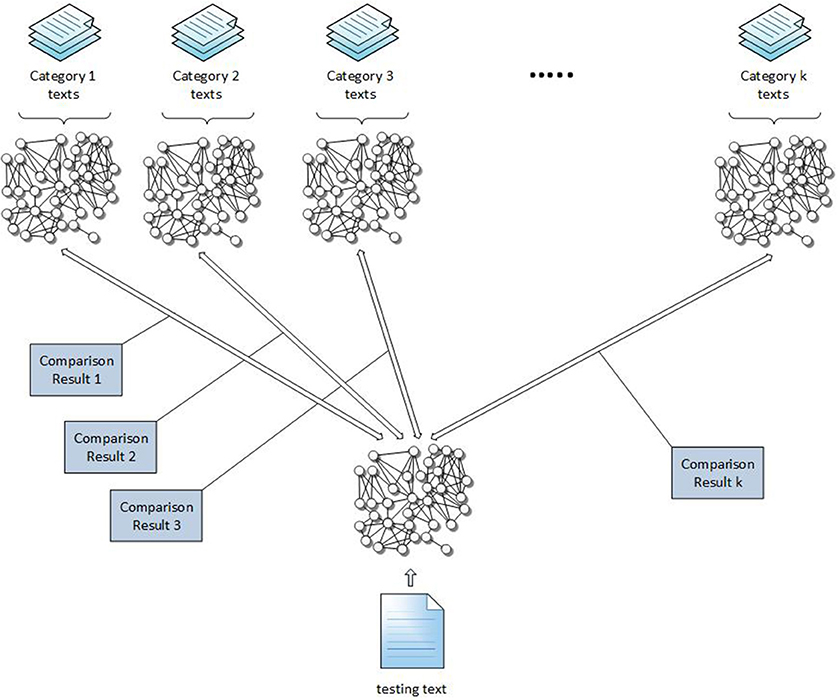
Figure 1. Graph representation and comparison between testing text and categories.
The NGG classification is a language agnostic model. The NGG can be constructed from text written in any language. In addition, the model can be used if a text combines words from two or more languages. For instance, it is quite common to use English words in documents that are written in different languages.
In terms of computational complexity, the NGG achieves a rather good performance for the construction and comparison tasks. The complexity for constructing a NGG is O(l) where l is the total number of text letters and the complexity of the graph similarity method is O(e1·e2) where e1 and e2 is the number of the edges in two comparing graphs.
The comparison result between a text graph with the graphs that represent the topic categories provides similarity values that can form a vector of k features where k denotes the number of categories. These k-dimension vectors are passed to a vector classifier to gage the most appropriate category in which the original text will be classified. The Beam pipeline to support the NGG classification model is split in embarrassingly parallel tasks, i.e., extraction, transformation and load operations. The classification process is decomposed into smaller tasks executed as transform operations which pass processed data in a form of PCollections, from stage to stage. In the most computational intensive stage, which is the graph comparison task, the data and the corresponding process are assigned to the workers in a parallel fashion. All the tasks include the autoscaling feature as provided by Dataflow in the infrastructure of Google Cloud, which guarantees the timely response, the availability, and the fault tolerance in the infinite length and randomly growing throughput of streaming text.
Our aim is to propose a method that it is generalizable and can be used in different text classification setups. It is evaluated against both an “unskewed” and a skewed dataset. The former is a dataset that the texts are distributed equally to all categories. The latter is a dataset that some categories have much more texts than others. As a consequence, many classification algorithms tend to assign texts that belong in small categories to larger ones. Even if some methods have tried to encounter this issue [36] it still remains one of the main challenges in text classification. The micro averages evaluation metrics cannot express this mis-prediction unlike macro averages evaluation metrics, which are capable to do so. The skewedness of a dataset is an issue that is taken in consideration in this research and we try to encounter it.
In what follows we provide the details regarding the main operations in the NGG classification pipeline, namely Graph construction, Graph similarity calculation, pre-processing, vector representation and classification. It also provides information about how those operations are placed within a distributed environment.
Graph Construction
The graph construction procedure can be divided into two main steps. First, all N-grams are extracted by sliding a window of N characters through the original text and are used as nodes in the NGG. The nodes are connected through an edge only if the respective N-grams meet some sort of proximity criterion (e.g., one follows or contains the other). This criterion is defined through the size of a sliding N-Gram frame, the details of which are provided in a following subsection that explains the process for the Edge Construction. The Graph edges are unidirectional (thus, we are referring to a directed Graph) in order to capture the sequence of N-grams as they exist in the original text. A weighted and an unweighted approach have been tested. Weights denote how often the abovementioned adjacency criterion is met for a pair of N-Grams. The NGG of a category is generated by the aggregation of the N-gram graphs that are known to belong to this category.
A text can be turned into an NGG but the reverse is not possible. The graph can represent if two N-grams are close the one another as well as their sequence. We cannot follow a path of edges to reconstruct the original text because an N-gram node may have many outgoing edges. In addition two or more text segments can have the same NGG making even more uncertain the recognition of source text.
An NGG has repetitive information since the N-1 characters of an N-gram node may be repeated based on the adjacency criterion in linked nodes. This seemingly redundancy is still very useful because all the similar textual tracks of the original text can be detected. In many occasions, a compound word encompasses the meanings of simple words. The relation between a simple word and a compound word can be captured by partial similarity techniques as graph similarities. Multiple graph similarities techniques are tested in the proposed model; for each of them we define the similarity metrics in a different way but all of them are based on the number and relation of the ordered characters that exist in the compared graphs.
Node Construction
All possible N-grams are extracted from a text and are represented as nodes. The characters of an N-gram may originate from one word or consequent words even including the space character that separates them, as seen in the example in Figure 2.
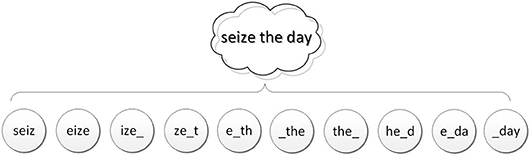
Figure 2. 4-Gram node construction of the sentence “seize the day”.
Depending on the application, the N-Grams can be case-sensitive or not. For example, in sentiment analysis applications the N-grams are case sensitive because capital or smaller letters may be used to express the emotions of the writer. In addition punctuation marks are important for the same reason [37]. The proposed NGG text classification method is a case in-sensitive method because in most applications, words do not differ in the use if they are written with uppercase or lowercase letters. In the worst case, the number of nodes is (#Chars)N where #Chars is the number of distinct characters and punctuation marks that can be used. In order to keep the Graph within a small, manageable size, the proposed model uses N-Grams only as a combination of lowered letters and the empty character. Even if an N-gram exists many times in the original text, only one node will be generated to represent it. Since there is no indication about the appropriate value of N, we investigated the options between 2 and 10.
In case of a long text, a large N can depict in a more accurate way the sequence of words but the graph and the complexity becomes higher. On the other hand, if N is small then the graph is smaller but the accuracy of the method is negatively affected. In short text, a small N can be more efficient than the use of large N. These conclusions were made through experimentation and are demonstrated in the evaluation section.
Edge Construction
The adjacency together with the order of appearance of two N-Grams in the original text is represented in the graph by an edge which joins the two corresponding nodes. So, each N-Gram node is connected to the following N-Gram node through a directed edge. The number of subsequent nodes which will be joined is determined by a frame. To define the notion of the frame we need to answer the question: Assuming a source N-Gram, how many subsequent N-Grams should we consider as adequately proximal so that we can denote this proximity with an edge in the graph? The answer to this question defines the value of the frame.
In this work, we experimented with frame sizes between 2 and 10 (ref. evaluation section). Larger frame sizes have not been tested because of the high computational overhead that they add whereas smaller sizes (i.e., size = 1) make no sense. The major conclusion is that when options toward the lower end are used, then the graph will represent in a strict way the relation between the words. On the other hand if a large frame is used then the graph will represent in a more flexible way the relation between words. Eventually, the dominant solution was to go with a frame size equal to N, i.e., the same number N as the number of characters in the N-grams at hand. The use of alternative frame sizes that differ from the rank N of N-Grams remains a future work.
The source N-Gram node and the frame which contains the target N-Gram nodes shifts an N-Gram each time. For each N-Gram node, N edges are made joining the N following N-Gram nodes. as it is illustrated in Figures 3, 4 in which each line represents a source node and the frame which includes the target nodes. The edges can be weighted or unweighted. Unweighted edges simply represent that some N-Grams are close in a text. Weighted edges can represent the frequency of the order of appearance between subsequent N-Grams. Despite the intuitive belief that weighted NGG can have better accuracy, the experiments as described in the Evaluation section proved in most of the cases the opposite. This is explained by the fact that many common N-Grams coexist very often in various texts from irrelevant categories. These common neighbor N-Grams lead on the failure to classify the texts based on the real important and informative word sequences but based on common and unimportant N-Gram sequences.
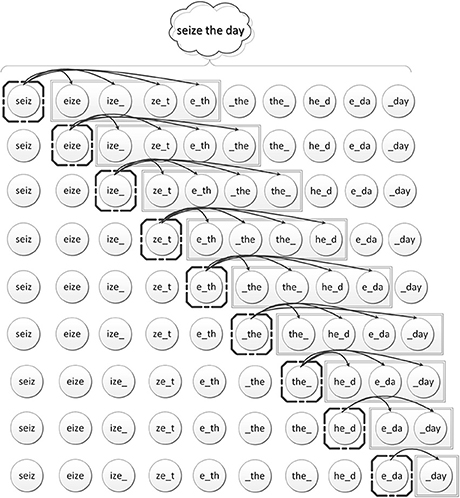
Figure 3. Edge construction sliding a window of rank 4.
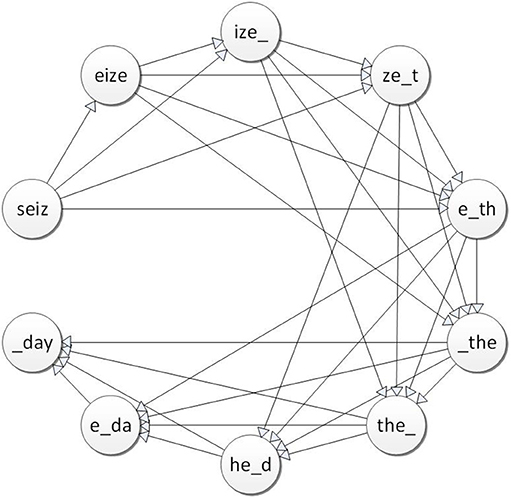
Figure 4. 4-Gram graph representation of the sentence “seize the day”.
To improve the use of weighted graphs, edge weights should be normalized in order to be independent of the text size and the text corpus. If a category consists of many texts, it will have a big graph and the important pairs of neighbor N-Grams will exist many times. On the other hand if a category includes only a few texts the important pairs of neighbor N-Grams may exist only two or three times. As a result the edge weights should be calculated taking into account both the number of times each edge exists and the total number of edges. The normalization of the weighted graphs can contribute to encounter the skewness of the dataset.
Graph Similarity
A key point of N-grams Graph classification method is the quantitative measurement of graph similarity. The graph similarity can indicate the degree that a text belongs in a category. Many methods to estimate the graph similarity exist in literature. One main aspect is to recognize the maximum common subgraph, like Rascal [38] which is based on the maximum clique between two graphs. Another aspect is based on the similarity between the nodes of graphs [39].
The total number of common edges between two N-gram graphs is a better criterion for similarity than just considering the common nodes. The reason is that there are discrete N-grams which appear frequently among different words, although without denoting any correlation between those words. But the adjacency and the sequence of N-grams denote the relations between the words. The criterion that should be used is a criterion based on the number of common edges.
Containment Similarity Aisopos et al. [40] is a measure that can be used in unweighted graphs and counts the number of edges which coexist in both graphs in comparison with the total number of edges of the minimum graph. An edge coexists in both graphs if the joined pair nodes have the same N-gram labels in both graphs. The equation of Containment Similarity is given below.
Where GT is the graph of a text and GC is the graph of a category, |GT|, |GC| is the number of edges of the graph GT and GC, respectively and e is an edge that belongs to the graph GT. The function μ(e, GC) is equal to 1 if the Graph GC contains the edge e and 0 otherwise.
In almost all cases, the graph of the text is smaller than the graph of the category. For this reason, it is more efficient to iterate the edges of the text graph and check if they exist in the Category graph. Note that since the graphs are directed, the edges e.g., “appl”–“pple” and “pple”–“appl” are considered different.
In the case of weighted graphs, the measure of Value Similarity (VS) and its normalized version (NVS) [40] can be used. The value similarity represents the sum of total common edges between two graphs taking account of their weights (Equation 2). The VS is high if the common N-grams are neighbors in the same frequency in both graphs and VS is low if the common N-grams have dissimilar frequencies.
Where wT is the weight of the edge e in the Text Graph and wC is the weight of the edge e in the Category Graph. The value similarity between a big graph and a small graph may not produce reasonable results. So a normalized factor should be used to divide the value similarity (Equation 3).
The normalized factor is the division between the minimum edges to maximum edges of two graphs.
The Normalized Value Similarity (NVS) Equation (4) denotes the similarity between two graphs decomposed by the graph sizes.
CS, VS, and NVS give as result a number between zero and one. Zero similarity declares that the graphs have nothing in common and similarity equal to one declares that GD, GC are identical graphs or subgraphs.
Both Containment Similarity and Normalized Value similarity have been used to compare NGG for sentiment analysis [40] and evaluation of automated summaries [31]. These metrics are appropriate to capture the textual similarity which is represented by the graphs.
Three variations of maximum common subgraphs have been implemented. The gage of unlabeled maximum common subgraph is NP-complete. Fortunately, N-gram graphs use labeled nodes and the complexity is polynomial. After the gage of the maximum common subgraph the quantification of the similarity can be estimated based on the number of common nodes or edges. The Equation (5) uses the number of nodes that contains the MCS while the Equations (6,7) are based on the number of edges.
MCSN(|Gt|, |GC|) stands for the number of nodes that are contained in the MCS of and graphs.
MCSUE(|GT|, |GC|) stands for the number of edges that are contained in the MCS of and graphs regardless of their direction.
MCSDES(|GT|, |GC|) stands for the number of nodes that are contained in the MCS and have the same direction in GT and GC.
MCSNS is based on the number of nodes that contains the MCS. This means that it considers the amount of different letter sequences that exist both in the original text and the corresponding topic category. The metrics MCSUES and MCSDES are based on the number of edges that contain the MCS. MCSUES does not take into consideration the direction of the edges while MCSDES requires the edges to be adjacent in source and terminal nodes with the same label. These metrics capture the notion of how strong is the relation of the letter sequences between a text and a topic category.
Pre-processing
Both category and text NGG contain many N-gram nodes and edges. A further question is if we can discern the informative nodes and edges from the “noisy” nodes and edges. Nodes and edges are regarded as noise if they exist in all categories or even worse if, they systematically have a negative contribution misclassifying the texts. There are two benefits from filtering out these parts of the graphs. Firstly, the graphs become smaller reducing the computation and memory demands. Secondly, the accuracy of the classification method can be increased.
Feature selection is the machine learning approach that is applied to quantify the importance of each feature. For the needs of Natural language processing, it is a common practice to remove the stop words and conduct lemmatization of the original text [41]. Even if some words are omitted or reformed in a pre-processing stage the sequence of the important words is kept. Stop words are the very common words which can be found in the whole corpus and are not related with specific topics. Lemmatization concerns the stemming and suffix stripping that reproduce the text in a more refined version representing every word to its stem.
Vector Representation and Classification
k-dimensional vectors whose dimensions comprise the graph similarity values between the N-gram graphs that represent testing texts with the N-gram graph that represent each of the k topic category are composed to train a vector classifier and in a similar way to classify the unlabeled texts. After the grouping of graph similarity values for each text into vectors, the text classification process is reduced to a vector space model task. The asset of this produced vector space model representation is that a low rank of features has inherited the properties of the N-gram graphs.
A vector classification model that uses the derivatives of the graph similarities as features is more efficient than a vector representation that uses any variation of the terms' frequencies as features. This is because of two reasons. Firstly, in most of the cases, the number of the topic categories are much less than the number of terms in a corpus. Consequently, the feature space has a much lower rank keeping the variance and the bias of the prediction model also low. Secondly, each of the k features already represents a very coherent estimation of the relation between a text with each topic.
Figure 5 depicts the process of vector construction and classification for the training and the prediction stage. In the training stage, the knowledge structures are built from labeled texts. While in the prediction stage, these knowledge structures are used for the classification of unlabeled texts. The knowledge structures derived by the training stage are the N-gram graph representations of the topic categories and the prediction function that assigns unlabeled text vectors into the appropriate topic categories.
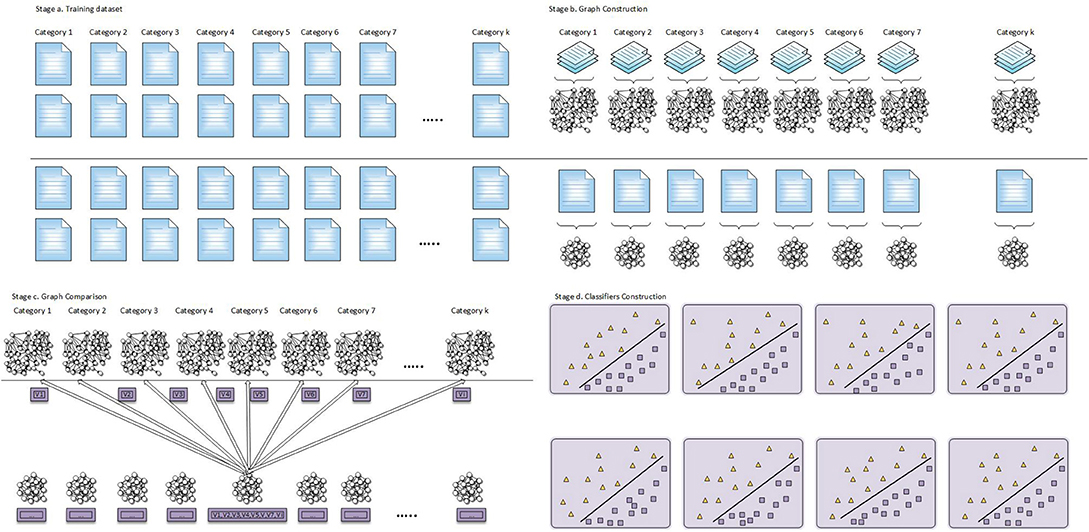
Figure 5. Stages for graph and vector construction and classification.
In the training stage, the text are split in two parts. In the one part, the text used for the construction of the k topic N-gram graph categories, while in the other part, each text is represented as a separate N-gram graph. The separate graphs of the individual texts are compared with the k topic categories graphs in order to be produced the vectors that represent them. Using these vectors, it is trained the vector classifier. From the whole process of the training stage, we keep only the categories N-gram graphs and the trained vector classification model, as knowledge structure, and use them in the prediction stage.
In the prediction stage, each text is represented as an N-gram graph and compared with the categories N-gram graphs that constructed in the training stage. This comparison produces vectors that represent the texts and they are passed to the trained vector classification model in order to be assigned to the most appropriate category. The pre-processing takes place in a similar way in the beginning of training and prediction, before the texts are used for the graph construction.
To select the vector classification method, we took into consideration the streaming and asynchronous nature of the N-gram graph classification model and proceed to experiments to evaluate them in a comparative study. The vector features are homogenous as all of them correspond to graph similarities numerical expressed to range [0, 1] interval. In addition, each of the features contribute to the output independently making a distance or a probabilistic classifier such as Support Vector Machine (SVM) and Bayes Classification a good option.
In the SVM model, decision planes are gaged in order to define decision boundaries that separate a set of observations in an N-dimensional space. These decision planes should be formed in the training stage and they should satisfy the constraint that the gap between the observations which belong to different categories should be as wide as possible. The classification process involves many classes so the SVM for multi-class classification was used. Specifically, it applied the linear SVC in an approach of one vs. one classification. In one vs. one classification a distinct binary classifier is trained for every pair of classes. In the inference stage, the model feeds an unobserved text to all binary classifiers and the class that has the highest number of predictions is the class in which the text is assigned.
Gaussian Bayes classifier is based on a conditional probability model in which texts are represented as a vectors as described in the previous paragraphs. The k dimensions of the vectors are independent variables and in our case of study are related with the outputs of the graph similarity metrics. In the Equation (8) the prediction class is the dependent variable y, ti the unobserved text and the σy, μy are estimated using the maximum likelihood, Equation (8).
Deep learning concerns multiple layers of a neural network. The vector of graph similarities between an unobserved text and the categories can be feed in the input layer of the deep neural network and using a propagation technique each layer transform the data into a more abstract and composite form until the activation of the last layer which denotes the category in which belong the text. Deep learning shows very good performance on problems trained with large amount of labeled data but If the trained dataset is not sufficient, likely other techniques outperform it.
Distributed Design of NGG for Text Streams
In the Batch text classification, the dataset is static and can be processed repeatedly many times with no time restrictions. The N-gram graph text stream classification is designed in order to satisfy more specific constraints such as the continuous generation of texts, the timely response, the scalability of the processing model, the high frequent and possible simultaneously arrival of observations. In order to cover all these challenges, we combined the N-gram graph classification with the assets of Apache Beam pipeline and the capabilities provided by the Google Cloud.
The N-gram graph classification model falls into the class of embarrassingly parallel problems concerning an easy separation of tasks with no need for interim data communication, and an independent and parallel processing. A task-pipeline is implemented using the Apache Beam programing model. This pipeline contains separate and modular tasks implemented as transform methods, they are illustrated in the Figure 6. This pipeline extends in nine stages with the most CPU consuming stage which is the graph comparison to be extended in k parallel nodes where k is the number of predefined categories (k is 5 in the Figure 6). In the last two stages take place the process of writing the labeled texts to the most relative stream outputs.
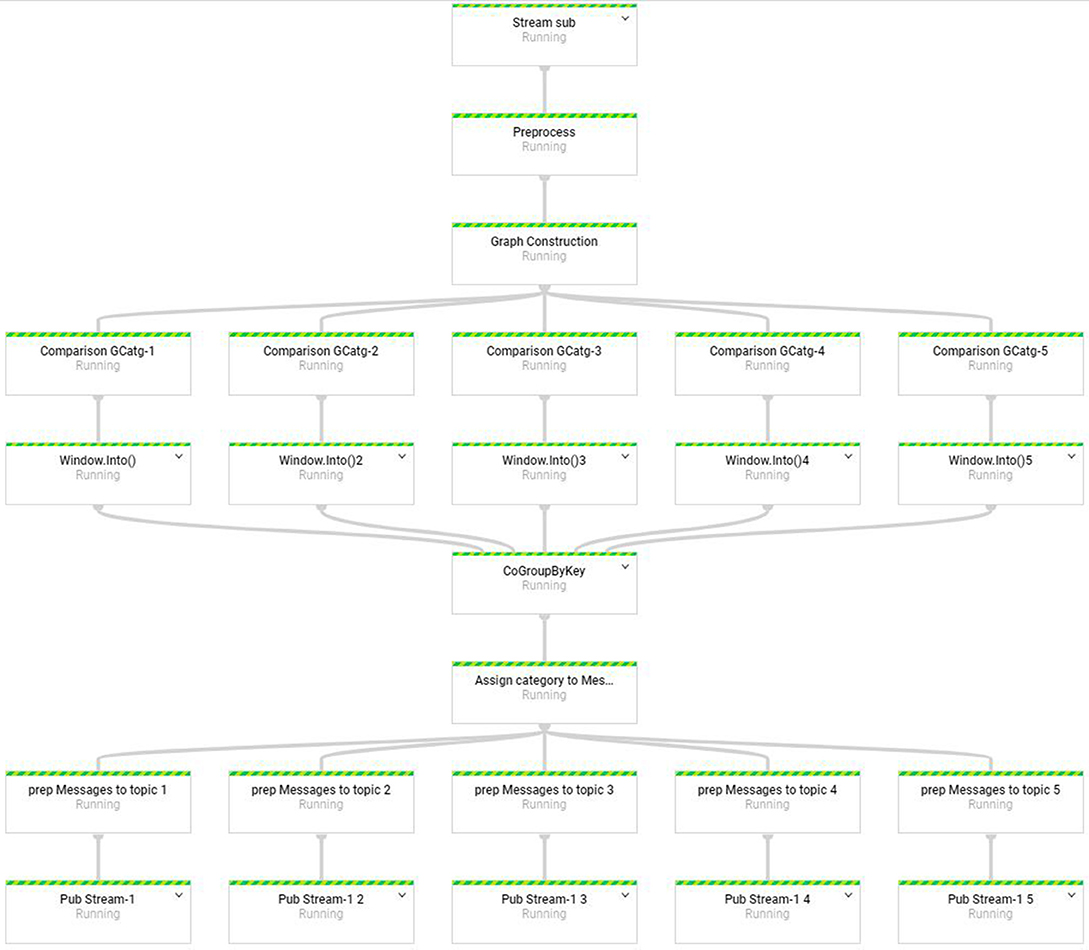
Figure 6. NGG classification over HFDS pipeline.
The Beam programming model utilizes pipelines in order to direct and process data. These pipelines are organized as directed acyclic graphs and facilitate a large-scale distributed data processing, in a fashion that unifies the batch and stream processing. The distributed data, to be consistent with the terminology of Beam, are called PCollections and can be created from an external data source or from in-memory data. The PCollections are constituted from elements of any type with the restriction that all elements that belong in a PCollection should be of the same type and random access is not supported. The elements are also associated with a timestamp that corresponds in most cases when the element was read or added.
These PCollections are processed and passed through the various stages of the pipeline. The processing that take place in a step of the pipeline is called PTransform and may concern change, filter, group, partition, parts extraction and analysis of the PCollection elements. PTransforms consider every element in a PCollection individually and should satisfy the criteria of serializability, thread-compatibility and idempotence. Three more characteristics of the Beam programming model is the windows that subdivides the elements of a PCollection base on their timestamps, the watermark, that is used to manage the late arrived elements, and the triggers to determine when some aggregation transforms should take place. Lastly, the use of the Beam pipeline provided from the Dataflow takes all the advantages of the Google cloud concerning the data persistence, the automate scale, low latency, and a serverless computing solution without having to think about availability, reliability, performance and network configurations in a cost effective way.
The N-gram Graph classification pipeline begins with a Stream Sub node. This node declares the subscription to an unclassified stream and a transformation of this stream to an unbounded PCollection where the elements stand for the individual unlabeled texts. The second node defines the pre-processing stage that refines each message with a lemmatization, stop words removal. The third node corresponds to the transformation of the textual elements to N-gram graphs. The fourth layer of the nodes is the most crucial stage of the pipeline making the graph comparison of the testing text with each N-gram graph that represents the corresponding category and produce the value of their similarity. Because these comparisons are data independent from each other and involve the heaviest processing workload are designed to be assigned into different nodes. The sixth layer is a windowing transform that is necessary in order the seventh layer to aggregate the value similarities and shape a k-dimensional vector that represents each text. The sixth layer takes all the graph similarity values and composes the text vectors based on their ID. The seventh layer declares the vector classification that assign a label to each text. The eight layer takes the labeled PCollection of seventh layer and directs each labeled element to the appropriate Publication stream. Lastly, the eighth layer consists of k publication that take a topic labeled PCollection and publish its messages as a text stream.
Evaluation
The NGG classification model has been tested and evaluated in two different data sets in order to demonstrate its applicability and effectiveness in a sequence of texts via a streaming format. Real time classification is critical application that involves two aspects, the accuracy of the classification predictions and the validity of the designed Beam pipeline to provide outcomes in scalar and high speed streaming texts. The N-gram graph classification model developed with the Java programming language and the Weka machine learning library concerning the SVM and Bayes classifiers. The Beam pipeline deployed and run on the Dataflow runner on the Google Cloud Platform. The classification evaluation has been done using the 10-fold cross-validation and micro–macro averaged evaluation metrics [42].
The NGG Classification model was applied in the 20 Newsgroup dataset (matlab/octave version) with texts equally partitioned across 20 different categories. Each of these 20 categories correspond to a newsgroup and all include texts about a specific topic, i.e., computer graphics, computer operating system Windows, autos, motorcycles, space, atheism etc. All of these categories are distinct, different and all texts belong just in one category although some categories are very closely related to each other e.g., pc hardware to mac hardware and religion to atheism. All the text in the dataset are used in the experiments and the evaluation except 12 instances that include less than two words.
Reuters-21578 is a collection of newswire articles which were gathered and indexed in categories by personnel from Reuters Ltd. The texts are not equally distributed in the topic categories. In our experiments we used the top 10 categories (earn, acq, money-fx, grain, crude, trade, interest, ship, wheat and corn) as described in Joachims [43] experiments. These 10 categories are highly-skewed with the biggest category to include 32 times more texts than the smallest. The skewness characteristic makes the classification a more challenging task because most of the classification methods tend to classify all the texts in the large categories leaving the small categories empty.
The purpose of the experiments is 2-fold. Firstly, to make a research to all parameters that affect the accuracy and the time responsiveness of the proposed model in order to conclude to the most well-tuned setup and secondly, for a comparison with other available state of the art text classification methods. The examined parameters are the rank of N-grams, the lemmatization, the stop words removal, the use of weighted or unweighted graphs, graph similarity metrics and vector classification techniques as described in the proposed model section.
Evaluation Method
In 10-fold cross-validation the dataset is partitioned into 10 equally subsets, the nine of them are used as training data and the one for testing. The method is repeated 10 times. Each time one different subset of texts is used for testing and the rest nine subsets are put together to construct the graph category representations.
Precision, Recall and their harmonic mean F-Measure express the quality of a classification. The precision for one class denotes the fraction of retrieved instances that are relevant and the recall denotes the fraction of relevant instances that are retrieved. The term Category is used for a category of texts as formed in the baseline dataset. The term Class A is used for the corresponding prediction of category A as estimated by a classification method. True Positives (TP) is the total number of the texts that correctly predicted in the Class A and they really belong in Category A. False Positives (FP) is the total number of texts that do not belong in Category A but they predicted wrongly to belong in the Class A. False Negatives (FN) is the total number of texts that do belong in the Category A but were not predicted to belong in the Class A. We now continue with defining the precision Equation (9), recall Equation (10) and F-Measure Equation (11) metrics.
Precision is a metric that describes the purity of a class.
The Recall shows the text completeness of a class.
F-Measure is a metric that equally combines Precision and Recall.
Macro-averaged Precision, Recall and F-Measures are estimated by the following three steps.
1. The metrics are estimated for each class in 1-fold based on the Equations (9–11).
2. The average metrics for all the classes in 1-fold are estimated from the step1.
3. The metrics of step 2 are averaged for all Folds.
Micro-averaged Precision, Recall and F-Measures are estimated by the following three steps.
1. The metrics are estimated for all texts based on the Equations (9–11) in 1-fold.
2. The average precision, recall and F-measure is estimated for all texts based on the step 1 independently of the class each text belong in 1-fold.
3. The metrics of step 2 are averaged for all Folds.
Macro-averaged metrics demonstrate the degree the classes are well-predicted while Micro-averaged metrics demonstrate the degree that the texts are well-assigned in classes. Macro averaged metrics evaluate the classification from the perspective of the classes while Micro averaged metrics from text perspective. The averaged macro precision, macro recall and macro F-Measure are three distinct numbers, while it can be proved that the averaged micro precision, micro recall and micro F-Measure are reduced to the same result [42].
Experimental Results
It is performed the classification experiments on the Reuters-21578 and 20 Newsgroup datasets as an Eclipse java project installed in a commodity computer with a Pentium 5 2.9 GHz CPU, 16GB ram and it deployed in the Google cloud via the Cloud Dataflow pipeline runner. From the text classification perspective of our research, we divided the dataset texts to the training and testing parts and carried out the experiments according to the 10-fold cross validations. From the perspective of a distributed model that process real-time streaming data, we deployed the N-gram graph classification model as a Dataflow service to the Google Cloud and validated its applicability, real time responsiveness and reliability of the model.
The dataset files are stored in a bucket on the Google Cloud Storage platform and transformed to a stream format with the Pub/Sub real-time messaging service. Each separate text of the dataset published to an incoming topic that the NGG text classification model is subscribed. Using the terminology of Google Cloud, topics are the Stream resources in which one or more publishers can publish messages into them and respectively one or more subscribers can consume them. Pub/Sub works as a message-oriented middleware that can provide text messages asynchronously and decouples the senders and the receivers services. In a similar way when the incoming stream texts labeled from the classification process, they will be directed to the corresponding publisher and published to the appropriate topic category. The Pub/Sub is scalable, reliable and delivers low-latency and durable messages.
The following paragraphs summarize the experimental results of the proposed NGG Classification model from the perspective of prediction accuracy. The subsection Vector Representation and Classification, contains a discussion about the prediction results, the time response, the applicability and the deployment of the Beam pipeline in the Google Cloud. The terms that are used in the following tables are listed below:
CS: Containment Similarity for Unweighted Graphs
VS: Value Similarity for Weighted graphs
NVS: Normalized Value Similarity for Weighted Graphs
MCSNS: Maximum Common Subgraph similarity that relies on the common nodes
MCSUES: Maximum Common Subgraph similarity that relies on the common undirected edges
MCSDES: Maximum Common Subgraph similarity that relies on the common directed edges
Stm: Stemming pre-process of the corpus using the Porter algorithm [44]
SWR: Stop Words Removal from the corpus based on the MySQL stop words list.
SWR and Stm: A combination of stop words removal and stemming.
SVM: Support Vector Machine Classifier
BayPr: Bayes Probabilistic Classifier
20Newsgroup
Both versions of graphs, weighted and unweighted are composed and tested for multiple ranks of N-Grams using the Bayes Gaussian Classifier. For unweighted graphs, Containment Similarity (CS), Maximum Common Subgraph with Common Nodes Similarity (MCSNS), Maximum Common Subgraph with common Undirected Edges Similarity (MCSUES), Maximum Common Subgraph with common Directed Edges Similarity (MCSDES). were used whereas for weighted graphs, two similarity measures were employed, namely, Value Similarity (VS) and Normalized Value Similarity (NVS), Table 1 summarizes the experimental results.
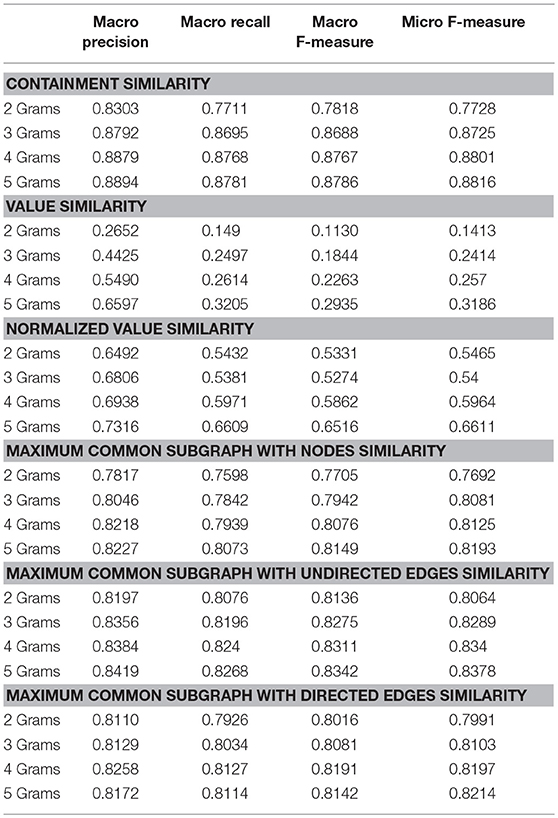
Table 1. Evaluating graph similarity metrics with 20NewsGroup.
From the first set of experiments we see that the NGG Classification method can have better results than other state of the art classification methods. Specifically, the accuracy of the NGG with unweighted graphs and N = 5 is 88.16%. The corresponding figure in a study using Error-Correcting Output Coding and Sub-class Partitions [45] reported a lower accuracy equal to 81.84%. Moreover, we can see that unweighted graphs with Containment Similarity outperform the weighted graphs and the use of 5 grams yields the best results.
Comparing Bayes Classifier with SVM and Deep learning, as we can see in the Figure 8, the Bayes Classifier had better prediction results. The reason that SVM shows a lower accuracy than Bayes Classifier is that it uses a low-dimensional feature space. Deep Learning requires a large amount of data to show good prediction results. In case of just thousands observations, it is unlikely to outperform Bayes Classifier.
Further experimental results with the weighted NGG will not be presented because their accuracy is much lower than the unweighted NGG. In the following experiments we kept Containment Similarity with Bayes Classifier and examined the pre-processing techniques using the lemmatization Porter's algorithm and the stop words removal as we can see in the Table 2.
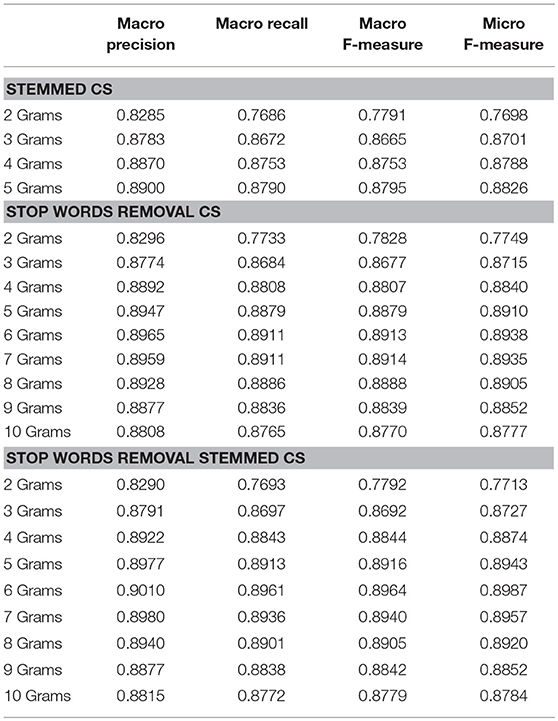
Table 2. Evaluating preprocessing techniques with 20Newsgroup.
The lemmatization pre-processing has an insignificant improvement <0.10% in both micro and macro F-Measures so we did not make further experiments with higher rank of N. After the removal of the stop words, there is an improvement of F-Measures that exceeds 1.20% for N = 6. The gradual improvement of the evaluation results with higher ranks of N make us to carry on our experiments with a higher rank of N. Our aim is to find the maximum evaluation metrics as function of N.
The last experimental setup that we investigated is the combination of stop-words removal with lemmatization. In this case we can see even better evaluation results for all metrics. In the pre-processing stage we made the stop words removal and next the lemmatization. The experiments in case of making first the lemmatization and next the stop words removal have slightly worst evaluations results.
The experimental results show that the unweighted 6-gram graph configuration where the stop words have been removed and it has been stemmed performs the best result so far with Micro F-Measure = 89.87% outperforming even more the figure of 81.84% in the research Error-Correcting Output Coding and Sub-class Partitions [45]. The pre-processing of stop words removal and lemmatization has one more important benefit as we mentioned. It decreases the data input i.e., the total characters of the corpus by a percentage of 44.5% making the classification method to demand less computation and memory resources.
Reuters-21578
Reuters-21578 dataset has a skew nature making texts that belong to small categories to be misclassified to the large ones. We made experiment again with both versions of graphs, weighted and unweighted, multiple ranks of N-Grams and graph similarity metrics using the Bayes Gaussian Classifier. As we can see in the Table 3 the normalized factor for low rank N has a positive effect in the classification macro Recall and F-Measure metrics. The best Micro F-Measure results are for the unweighted graphs using Containment Similarity with N = 5. The same setup was the best and in 20Newsgroup dataset.
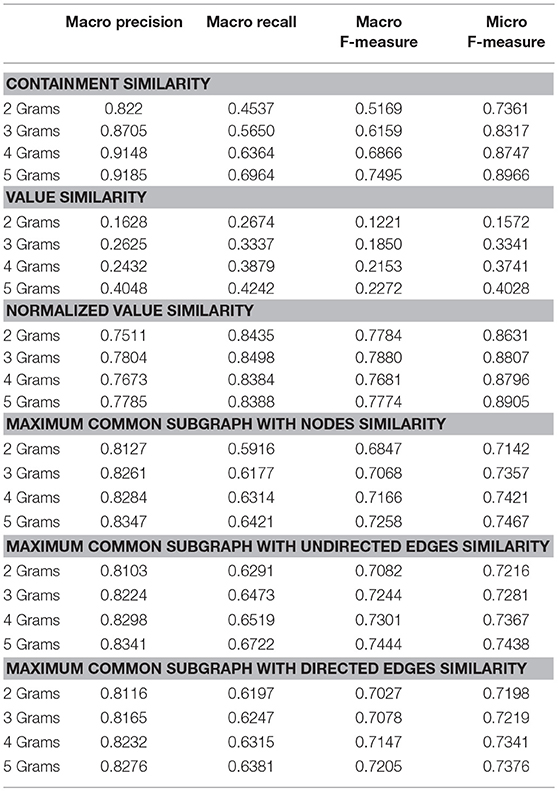
Table 3. Evaluating graph similarity metrics with Reuters-21578.
The Micro F-Measures denotes the amount of texts that are classified well. The texts that belong in large categories are more than the texts that belong in small categories so the normalized factor does not affect this result. On the other side, the Macro F-Measures results are better using weighted graphs and the normalized value similarity. The normalized factor improved considerably the degree of relevant items that are classified in a class (Macro Recall) while it had a decrease in the degree of the selected items that are relevant in a class (Macro Precision). The Macro F-Measure is also better using weighted graphs with normalized values similarity.
We compared Bayes Classifier with the SVM and the Deep Learning, as we did Figure 11, as we did in 20Newsgroup dataset. The Bayes Classifier had again the better prediction results and we kept it for the next experiments with the text pre-processing techniques.
The two pre-processing methods applied in unweighted and weighted NGG model and the outcomes are presented in the Tables 4, 5.
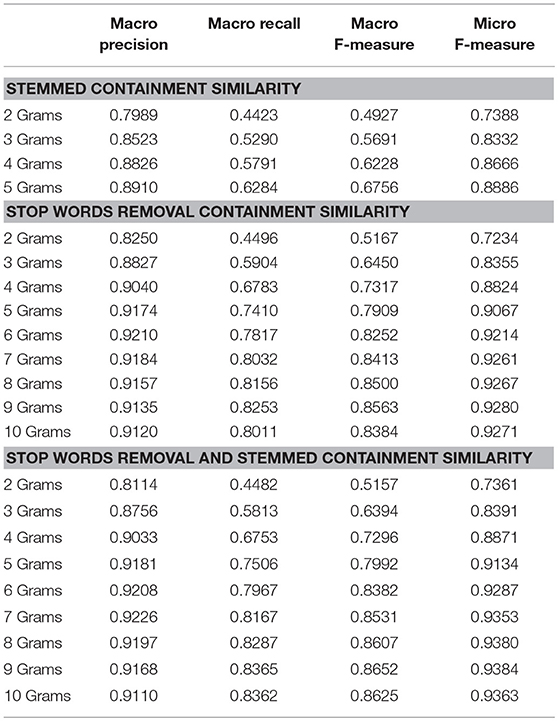
Table 4. Evaluating preprocessing techniques with Reuters-21578 and containment similarity.
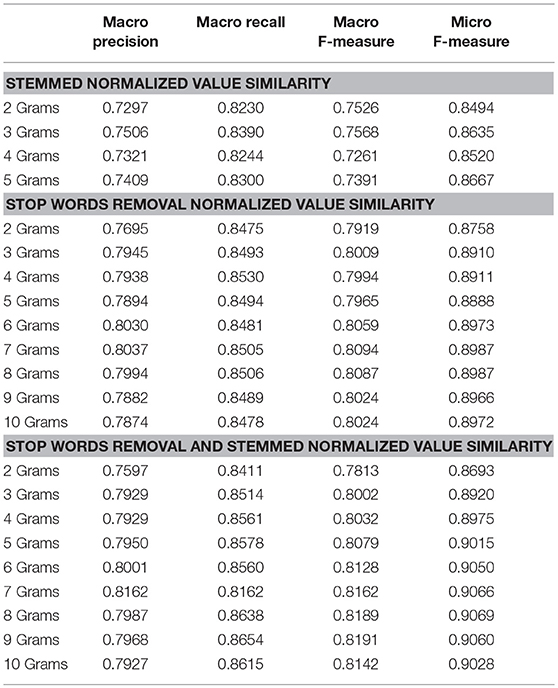
Table 5. Evaluating preprocessing techniques with Reuters-21578 and normalized value similarity.
The lemmatization pre-processing decreases the evaluation metrics in both weighted and unweighted models but the removing of stop words has a noteworthy positive impact on Micro and Macro F-Measures. Furthermore, the removing of stop words has a more important contribution in unweighted NGG model than the weighted.
The stop word removal increased the evaluation metrics more in the unweighted graphs than to weighted graphs. The maximum Micro and Macro F-Measure is for N = 9 in unweighted NGG. Even if the evaluation results are very good this is a large N that makes the method more resource-demanded. To further decrease the amount of data we filtered out the input data using the combination of stop words removal and lemmatization as in the 20 Newsgroup dataset. The experiments showed an improvement in the experimental results that reach 0.89% for Macro F-Measure and 1.04% for Micro F-Measure.
Discussion
The experimental results confirm that the NGG classification model can produce accurate classification predictions in a robust way and with low computational requirements. Unweighted graphs with Containment Similarity and rank N = 6 for N-Grams has the best Macro Precision results in both datasets as we can see in the Figures 7, 10. The rank N = 6 has also the best evaluation results in the other metrics for the no-skew dataset 20Newsgroup. In case of the skew dataset Reuters with Containment Similarity in unweighted graphs, the rank N equal to 9 mitigates the skewedness phenomenon.
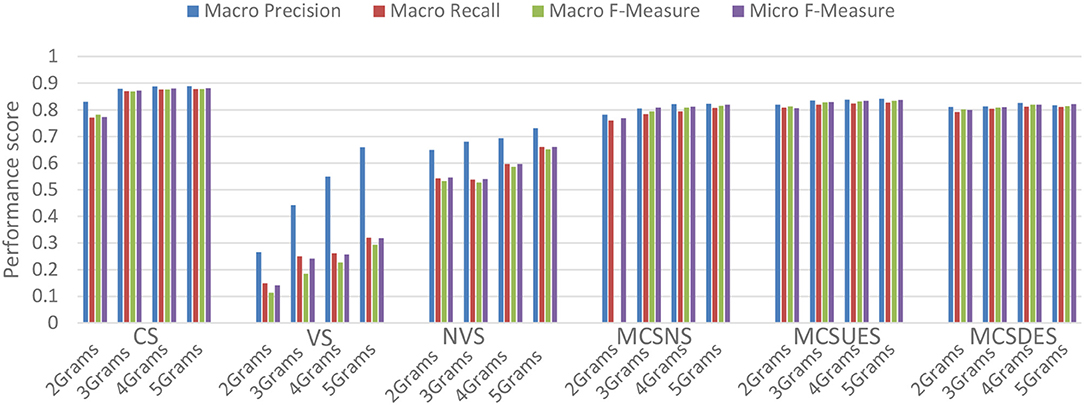
Figure 7. Evaluating graph similarity metrics with 20NewsGroup.
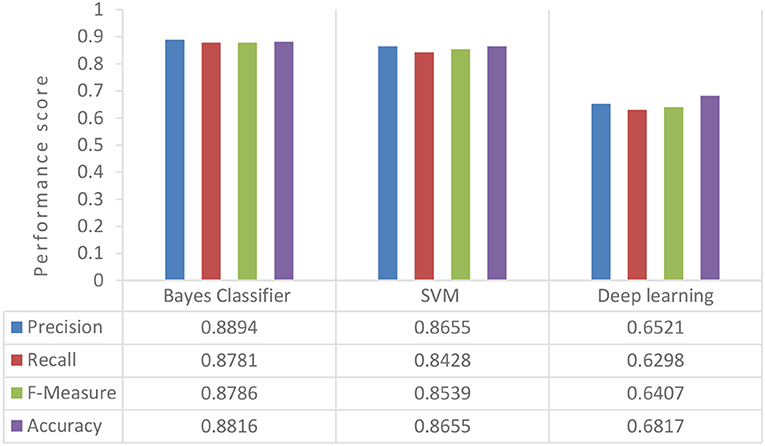
Figure 8. Evaluating classifiers performance with 20Newsgroup.
The use of unweighted N-gram graphs performs better than the use of weighted N-gram graphs in all the cases to the no-skew datasets. Extensive research has been done to justify the reasons of this inference. A text Graph consists of meaningful edges that reflect the meaning of the text and noise edges that exist in any random text as referred in the graph filtering section. The meaningful edges have smaller weights than the noise edges because the noise edges are repeated more often. Hence, the noise edges blur the accuracy.
Furthermore, the Value Similarity completely fails to compare in a sufficient way two graphs because it does not take into consideration the size of the graphs. The normalization of graph similarity obviously improves the prediction rate but does not outperform the Containment similarity of unweighted graphs in no-skewed datasets.
The use of weighted graphs does not show so good results as one would intuitively expect. However, the factors that contribute in the mis-prediction can be detected. This implies that with the use of feature selection criteria, the edges that systematically decrease the accuracy of the method can be omitted. This remains to be shown in future work.
In the case of skewed data we can see that the weighted graphs with the normalized value similarity can express better evaluation results especially in the Macro Recall metric. The normalized factor can contribute to the correct assignment of instances that belong in small categories.
Text preprocessing, as we can see in the Figures 9, 12, 13 turns out to contribute significantly to better results in all cases. The experiments in shorter texts (medieval dataset) reveal different results than the text that consist of some paragraphs. In short texts the word stemming improves the evaluation metrics while the stop words removal affects them negatively. In the experiments with texts consisting of quite a few paragraphs we have seen that the stemming either does not affect or decreases slightly the evaluation metrics whereas the stop words removal increased them significantly.
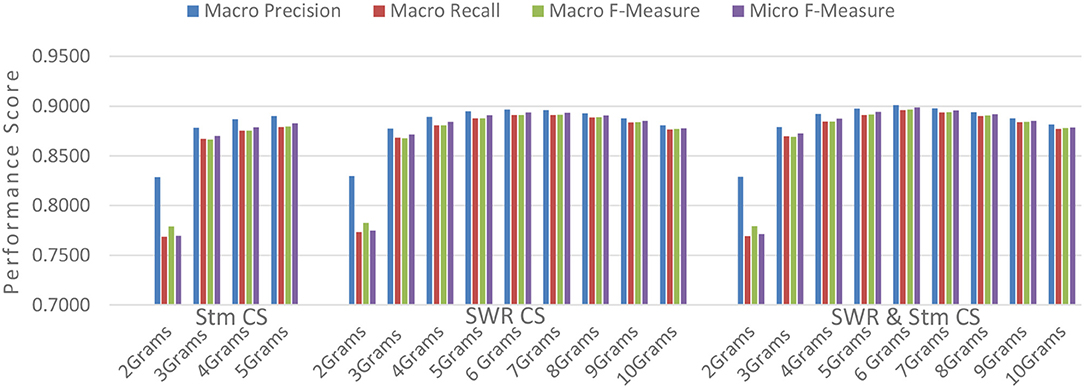
Figure 9. Evaluating preprocessing techniques with 20Newsgroup.
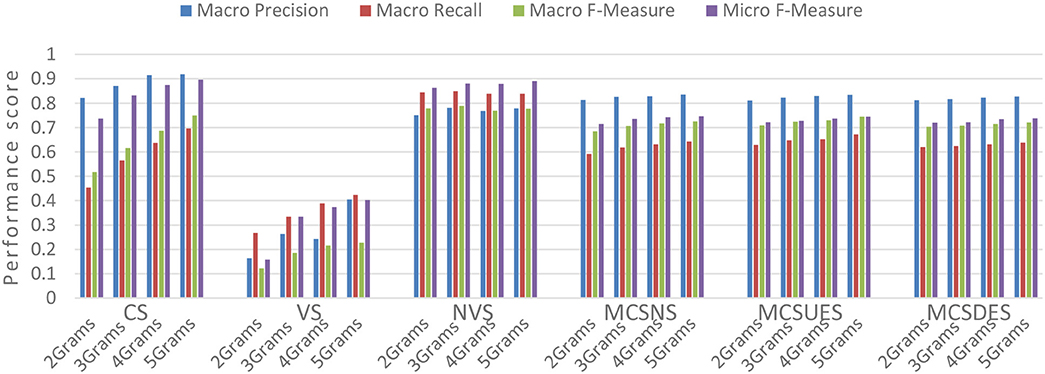
Figure 10. Evaluating graph similarity metrics with Reuters-21578.
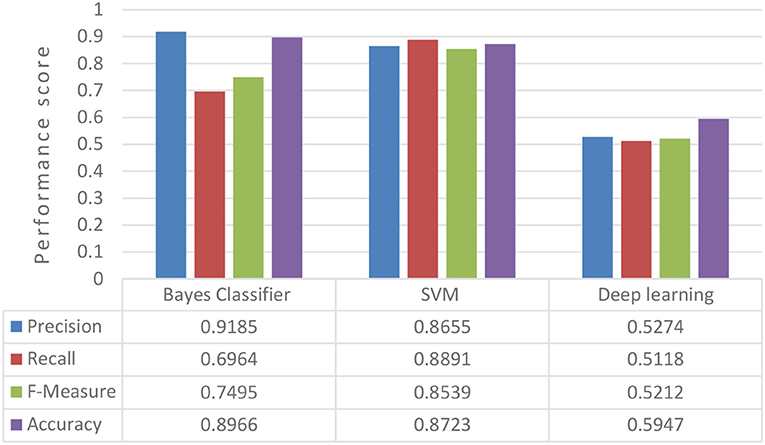
Figure 11. Evaluating classifiers performance with Reuters-21578.

Figure 12. Evaluating preprocessing techniques with Reuters-21578 and containment similarity.
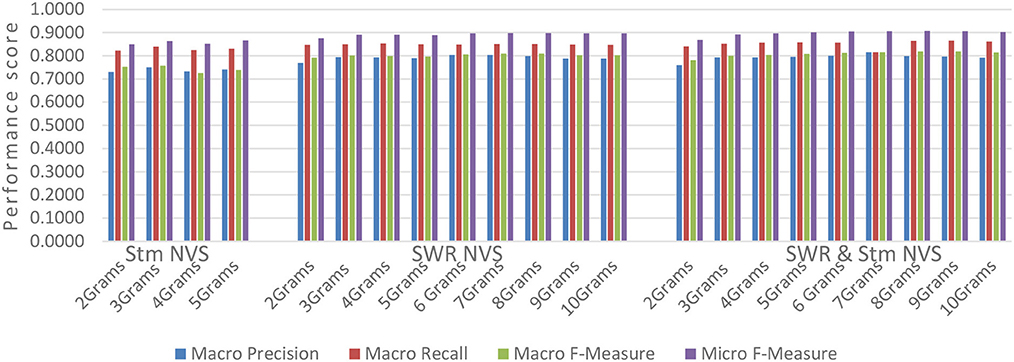
Figure 13. Evaluating preprocessing techniques with Reuters-21578 and normalized value similarity.
Using a combination of stop words removal with lemmatization as preprocessing can yield even better evaluation results. Moreover, the data input is reduced significantly decreasing the demand in computational resources.
The classification using unweighted 6-grams graph with stop words removal and lemmatization can produce Macro F-Measure equal to 0.8964 and Micro F-Measure equal to 0.8987 in the 20NewsGroup dataset. These results are better than the state of the art classification approaches for the same dataset as presented as we can see in the Figure 14. Using the SVM [46] the Micro F-Measure is 0.808. The hybrid discriminative RBM [47] has Micro F-Measure 0.762, the ECOC Naive Bayes [45] 0.818 and the regularized least squares classifier [48] 0.8486.
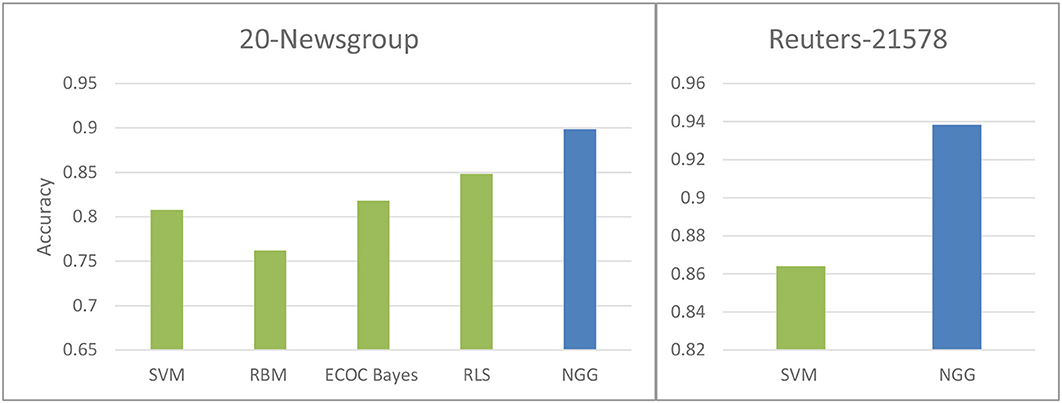
Figure 14. Comparison of text classification methods.
Reuter's dataset is a dataset that has been used with various ways in the literature. One of the best experimental setup which uses the same top 10 categories is the Text categorization with SVM [43] where the Micro F-Measure is 0.864. Using the NGG model the Micro F-Measure has reached to 0.9384 which is a great improvement.
Google Cloud can release us from the overhead of managing infrastructures, the persistence, and the scalability of a deployed service. Specifically for processes that can be divided in a sequence of tasks, it provides the Dataflow as a runner for the Beam programming model. The classification of high frequency text streams take place in real time without having to think about the hardware resources that should be allocated. We measured the time response of the model feeding it from 1 text per second up to 10,000 messages per second and in every case the Log files had recorded a stable processing time close to 24 ms for each text in the stream.
Conclusions and Future Work
In this paper, we have—to the best of our knowledge—followed a different path for text classification. N-gram graphs is a representation model that has been used in other machine learning techniques and it was a challenge to be extended for text streaming generated at high speed and classified in real time. The N-gram graph classification model has the intrinsic property to be performed in a sequence of separate tasks. It designed with the Beam programming model and deployed in the Google Cloud distributed among multiple workers in order to provide high scalability, durability, fault tolerance and low latency responsiveness.
Many variants of the N-gram graph classification method are proposed, implemented and evaluated in order to conclude to an optimal setup for a skew and a no-skew dataset. Weighted graphs, unweighted graphs, classification methods, and plenty graph similarity metrics are used in combination with text preprocessing techniques. The proposed model has characteristics that exploit the assets of graph representations and can give solution in tough text classification issues such as the sequence of words, and the misspelling. The experiments carried out with the 10-fold-cross validation method using the 20-NEwgroup and Reuters datasets and carefully compared with other state of the art methods that follow similar evaluation metrics and use of the datasets.
The frame size that was used during the evaluation tests was equal to the window size N but this is not a restriction. Various frame sizes for each N-gram should be investigated. Feature selection techniques can be used to estimate the importance of the edges in accordance with the fact that some edges contribute more in the right classification than others. In addition, the similarity criterion should be selected taking into consideration the classification importance of the edges and the noise edges should be filtered out from the graphs. The NGG representation model with its similarity metrics can be adapted and combined with various classification algorithms in order to achieve better evaluation results and solve more complex problems such as hierarchical multi-label classification.
Applications that use high frequency text streams constitute open ended learning environments. The incoming texts, topics and their statistical properties may change over time in unforeseen ways with consequence the inference become less accurate. The N-gram graph classification model can be adapted to tackle this phenomenon known as concept drift. The future research direction that should be explored is a dynamic change of the topic graph representations related with the fluctuations of incoming texts. In the case that a new bundle of texts is appeared with high inter-similarity and low similarity with the already existed topic graphs, the model should be capable to recognize a new emerged topic.
Author Contributions
JV, NLP, text classification, development of the model. KT, cloud Computing, experiments. IV, high frequency streams, evaluation. TV, cloud Computing.
Conflict of Interest Statement
The authors declare that the research was conducted in the absence of any commercial or financial relationships that could be construed as a potential conflict of interest.
The reviewer EP declared a shared affiliation, with no collaboration, with several of the authors, JV, KT, TV, to the handling editor at time of review.
Acknowledgments
This work has been supported by the BASMATI project. BASMATI (http://basmati.cloud) has received funding from the European Union Horizon 2020 research and innovation programme under grant agreement no. 723131 and from ICT R&D program of Korean Ministry of Science, ICT and Future Planning no. R0115-16-0001.
References
1. Gao Y, Zhang H, Zhao X, Yan S. Event classification in microblogs via social tracking. ACM Trans Intell Syst Technol. (2017) 8:35:1–35:14. doi: 10.1145/2967502
2. Rosenthal S, Farra N, Nakov P. Sentiment analysis in Twitter. In: E 11th International Workshop on Semantic Evaluation. SemEval-2017. Vancouver, BC (2017).
3. Nguyen H-L, Woon Y-K, Ng W-K. A survey on data stream clustering and classification. Knowl Inf Syst. (2015) 45:535–69. doi: 10.1007/s10115-014-0808-1
4. Song G, Ye Y, Zhang H, Xu X, Lau RYK, Liu F. Dynamic clustering forest: an ensemble framework to efficiently classify textual data stream with concept drift. Inf Sci. (2016) 357:125–43. doi: 10.1016/j.ins.2016.03.043
5. Xu S, Wang J. A fast incremental extreme learning machine algorithm for data streams classification. Expert Syst Appl. (2016) 65:332–44. doi: 10.1016/j.eswa.2016.08.052
6. Akidau T, Bradshaw R, Chambers C, Chernyak S, Fernández-Moctezuma RJ, Lax R, et al. The dataflow model: a practical approach to balancing correctness, latency, and cost in massive-scale, unbounded, out-of-order data processing. Proc VLDB Endow. (2015) 8:1792–803. doi: 10.14778/2824032.2824076
7. Chen Z, Ma N, Liu B. Lifelong Learning for Sentiment Classification. Beijing: Association for Computational Linguistics (ACL) (2018).
8. Jiang M, Liang Y, Feng X, Fan X, Pei Z, Xue Y, et al. Text classification based on deep belief network and softmax regression. Neural Comput Appl. (2018) 29:61–70. doi: 10.1007/s00521-016-2401-x
9. Xing Y, Shen F, Luo C, Zhao J. L3-SVM: a lifelong learning method for SVM. In: 2015 International Joint Conference on Neural Networks (IJCNN). Presented at the 2015 International Joint Conference on Neural Networks (IJCNN). Killarney (2015). p. 1–8.
10. Wallach HM. Topic modeling: beyond bag-of-words. In: Proceedings of the 23rd International Conference on Machine Learning, ICML'06. ACM, New York, NY, USA (2006). p. 977–84.
11. Sriram B, Fuhry D, Demir E, Ferhatosmanoglu H, Demirbas M. Short text classification in twitter to improve information filtering. In: Proceedings of the 33rd International ACM SIGIR Conference on Research and Development in Information Retrieval, SIGIR'10. New York, NY: ACM (2010). p. 841–2.
12. Krishnan SPT, Gonzalez JLU. Google Cloud Pub/Sub. In: Building Your Next Big Thing with Google Cloud Platform. Berkeley, CA: Apress (2015). p. 277–92.
13. Gomes HM, Barddal JP, Enembreck F, Bifet A. A survey on ensemble learning for data stream classification. ACM Comput Surv. (2017) 50:23:1–23:36. doi: 10.1145/3054925
14. Bertini Junior JR, Nicoletti M. do C. An iterative boosting-based ensemble for streaming data classification. Inf Fus. (2018) 45:66–78. doi: 10.1016/j.inffus.2018.01.003
15. Wang L, Shen H, Tian H. Weighted ensemble classification of multi-label data streams. in: Advances in Knowledge Discovery and Data Mining, Lecture Notes in Computer Science. Presented at the Pacific-Asia Conference on Knowledge Discovery and Data Mining, Cham: Springer (2017). p. 551–62.
16. Al-Khateeb T, Masud MM, Al-Naami KM, Seker SE, Mustafa AM, Khan L, et al. Recurring and novel class detection using class-based ensemble for evolving data stream. IEEE Trans Knowl Data Eng. (2016) 28:2752–64. doi: 10.1109/TKDE.2015.2507123
17. Bifet A, Zhang J, Fan W, He C, Zhang J, Qian J, et al. Extremely fast decision tree mining for evolving data streams. In: Proceedings of the 23rd ACM SIGKDD International Conference on Knowledge Discovery and Data Mining, KDD'17. New York, NY: ACM (2017). p. 1733–42.
18. Gomes HM, Bifet A, Read J, Barddal JP, Enembreck F, Pfharinger B, et al. Adaptive random forests for evolving data stream classification. Mach Learn. (2017) 106:1469–95. doi: 10.1007/s10994-017-5642-8
19. Data Science Platform [WWW Document]. RapidMiner (2018). Available online at: https://rapidminer.com/ (Accessed March 21, 2018).
20. Machine Learning for Data Streams [WWW Document]. MIT Press (2018). Available online at: https://mitpress.mit.edu/books/machine-learning-data-streams (Accessed March 21, 2018).
21. Zhang X, Zhao J, LeCun Y. Character-Level Convolutional Networks for Text Classification. Montreal, QC: Neural information processing systems foundation (2015).
22. Voulodimos A, Doulamis N, Doulamis A, Protopapadakis E. Deep learning for computer vision: a brief review. Comput Intell Neurosci. (2018) 2018:7068349. doi: 10.1155/2018/7068349
23. Glorot X, Bordes A, Bengio Y. Domain adaptation for large-scale sentiment classification: a deep learning approach. In: Proceedings of the 28th International Conference on International Conference on Machine Learning, ICML'11. Bellevue, WA (2011). p. 513–20.
24. Hassan A, Mahmood A. Efficient deep learning model for text classification based on recurrent and convolutional layers. In: 2017 16th IEEE International Conference on Machine Learning and Applications (ICMLA). Presented at the 2017 16th IEEE International Conference on Machine Learning and Applications (ICMLA). Cancun (2017). p. 1108–13.
25. Sima A-C, Stockinger K, Affolter K, Braschler M, Monte P, Kaiser L. A hybrid approach for alarm verification using stream processing, machine learning and text analytics. In: Presented at the International Conference on Extending Database Technology (EDBT), March 26–29, 2018. Vienna: ACM (2018).
26. Read J, Perez-Cruz F, Bifet A. Deep learning in partially-labeled data streams. In: Proceedings of the 30th Annual ACM Symposium on Applied Computing, SAC'15. New York, NY: ACM (2015). p. 954–9.
27. Belcastro L, Marozzo F, Talia D, Trunfio P. Big data analysis on clouds. In: Handbook of Big Data Technologies. Cham: Springer (2017). p. 101–42.
28. Dias de Assunção M, da Silva Veith A, Buyya R. Distributed data stream processing and edge computing: a survey on resource elasticity and future directions. J Netw Comput Appl. (2018) 103:1–17. doi: 10.1016/j.jnca.2017.12.001
29. Google Cloud Big Data and Machine Learning Blog. Comparing Cloud Dataflow Autoscaling to Spark and Hadoop [WWW Document]. Google Cloud Platf (2016). Available online at: https://cloud.google.com/blog/big-data/2016/03/comparing-cloud-dataflow-autoscaling-to-spark-and-hadoop (Accessed March 8, 2018).
30. Akidau T, Perry F. Dataflow/Beam and Spark: A Programming Model Comparison [WWW Document]. Google Cloud Platf (2016). Available online at: https://cloud.google.com/dataflow/blog/dataflow-beam-and-spark-comparison (Accessed March 8, 2018).
31. Giannakopoulos G, Karkaletsis V, Vouros G, Stamatopoulos P. Summarization system evaluation revisited: N-gram graphs. ACM Trans Speech Lang Process. (2008) 5:5:1–5:39. doi: 10.1145/1410358.1410359
32. Violos J, Tserpes K, Papaoikonomou A, Kardara M, Varvarigou T. Clustering documents using the 3-gram graph representation model. In: Proceedings of the 18th Panhellenic Conference on Informatics, PCI'14. New York, NY: ACM (2014). p. 29:1–29:5.
33. Aisopos F, Dimitrios T, John V, Theodora V. Using N-Gram Graphs for Sentiment Analysis: An Extended Study on Twitter–IEEE Conference Publication [WWW Document] (2016). Available online at: http://ieeexplore.ieee.org/abstract/document/7474354/ (Accessed March 8, 2018).
34. Ying Y, Qingping T, Qinzheng X, Ping Z, Panpan L. A graph-based approach of automatic keyphrase extraction. Proc Comput Sci. (2017) 107:248–55. doi: 10.1016/j.procs.2017.03.087
35. Caskey SP, Kanevsky, D, Kozloski, JR, Sainath, TN,. Text Auto-Correction via N-grams. US9779080B2 (2017). Available online at: https://patents.google.com/patent/US9779080B2/en
36. D'Addabbo A, Maglietta R. Parallel selective sampling method for imbalanced and large data classification. Pattern Recognit Lett. (2015) 62:61–7. doi: 10.1016/j.patrec.2015.05.008
37. Psomakelis E, Tserpes K, Anagnostopoulos D, Varvarigou T. Comparing Methods for Twitter Sentiment Analysis. Rome: International Joint Conference on Knowledge Discovery, Knowledge Engineering and Knowledge Management (2015). pp. 225–32.
38. Raymond JW, Gardiner EJ, Willett P. RASCAL: calculation of graph similarity using maximum common edge subgraphs. Comput J. (2002) 45:2002. doi: 10.1093/comjnl/45.6.631
39. Nikolić M. Measuring similarity of graph nodes by neighbor matching. Intell Data Anal. (2012) 16:865–78. doi: 10.3233/IDA-2012-00556
40. Aisopos F, Papadakis G, Tserpes K, Varvarigou T. Content vs. context for sentiment analysis: a comparative analysis over microblogs. In: Proceedings of the 23rd ACM Conference on Hypertext and Social Media, HT'12. New York, NY: ACM (2012). p. 187–96.
41. Jain DS, Sharma D. Evaluation of stemming and stop word techniques on text classification problem. Int J Sci Res Comput Sci Eng. (2015) 3:1–4.
42. Van Asch V. Macro- and Micro-Averaged Evaluation Measures (2013). Available online at: https://www.semanticscholar.org/paper/Macro-and-micro-averaged-evaluation-measures-[-[-]-Asch/1d106a2730801b6210a67f7622e4d192bb309303?tab=abstract
43. Joachims T. Text categorization with support vector machines: learning with many relevant features. In: Nédellec C, Rouveirol C, editors. Machine Learning: ECML-98, Lecture Notes in Computer Science. Chemnitz: Springer Berlin Heidelberg (1998). p. 137–42.
44. Porter MF. An algorithm for suffix stripping. Program (2006) 40:211–8. doi: 10.1108/00330330610681286
45. Li B, Vogel C. Improving multiclass text classification with error-correcting output coding and sub-class partitions. In: Farzindar A, Kešelj V, editors. Advances in Artificial Intelligence, Lecture Notes in Computer Science. Ottawa, ON: Springer-Verlag (2010). p. 4–15.
46. Lan M, Tan C-L, Low H-B. Proposing a new term weighting scheme for text categorization. In: Proceedings of the 21st National Conference on Artificial Intelligence–Volume 1, AAAI'06. Boston, MA: AAAI Press (2006). p. 763–8.
47. Larochelle H, Bengio Y. Classification using discriminative restricted Boltzmann machines. In: Proceedings of the 25th International Conference on Machine Learning, ICML'08. New York, NY: ACM (2008). p. 536–43.
Keywords: text classification, text streaming, N-gram graph, beam, cloud computing
Citation: Violos J, Tserpes K, Varlamis I and Varvarigou T (2018) Text Classification Using the N-Gram Graph Representation Model Over High Frequency Data Streams. Front. Appl. Math. Stat. 4:41. doi: 10.3389/fams.2018.00041
Received: 25 May 2018; Accepted: 10 August 2018;
Published: 11 September 2018.
Edited by:
Athanasios Voulodimos, University of West Attica, GreeceReviewed by:
Eftychios Protopapadakis, National Technical University of Athens, GreeceStelios Tsafarakis, Technical University of Crete, Greece
Copyright © 2018 Violos, Tserpes, Varlamis and Varvarigou. This is an open-access article distributed under the terms of the Creative Commons Attribution License (CC BY). The use, distribution or reproduction in other forums is permitted, provided the original author(s) and the copyright owner(s) are credited and that the original publication in this journal is cited, in accordance with accepted academic practice. No use, distribution or reproduction is permitted which does not comply with these terms.
*Correspondence: John Violos, dmlvbG9zQG1haWwubnR1YS5ncg==