 Kimberley M. Lek
 Rens Van De Schoot
A Corrigendum on
A Comparison of the Single, Conditional and Person-Specific Standard Error of Measurement: What do They Measure and When to Use Them?
by Lek, K. M., and Van De Schoot, R. (2018). Front. Appl. Math. Stat. 4:40. doi: 10.3389/fams.2018.00040
In the original article, there was a mistake in Figures 17A,B, and D as published. A small part of the cells should have a different color. Specifically, in Figure 17A 12 items in the “K = 2 & reliability 0.9” cell and 24 items in the “K = 2 & reliability 0.9” cell was incorrectly colored. In Figure 17B, 12 items in the “K = 2 & reliability 0.7” and “K = 2 & reliability 0.9” cells should have been colored differently. Finally, in Figure 17D, the cell “K = 2 & reliability 0.7” of 24 items was incorrectly colored. The corrected Figures 17A,B, and D appear below.
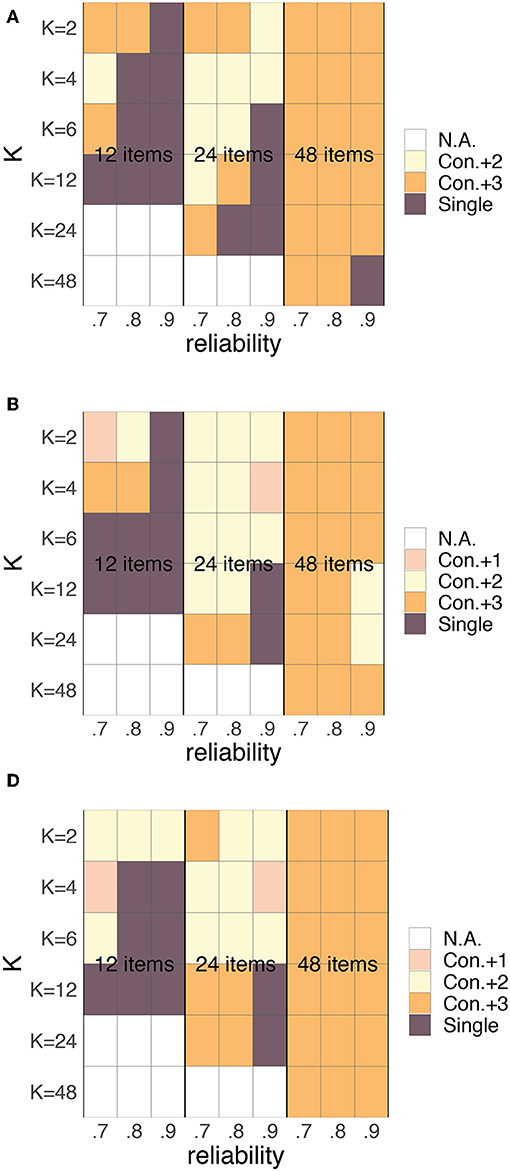
Figure 17. Preference for the person-specific SEm (green), the conditional SEm (pink), the conditional SEm “+1” (light pink), the conditional SEm “+2” (yellow), the conditional SEm “+3” (orange) or the single SEm (purple) based on the MSE for different K's, number of items and overall reliability. Plot (A) corresponds to the relationship between “true” scores and error variances as depicted in Figure 5A, (B) to the relationship of Figure 5B, (C) to the relationship in Figure 5C and (D) to the relationship in Figure 5D. All four plots are based on rounded and truncated parallel test scores.
Additionally, there was also a mistake in Figure 18A. The bars for “con+3,” “con+2,” and “con+1” have been altered. The corrected Figure 18A appear below.
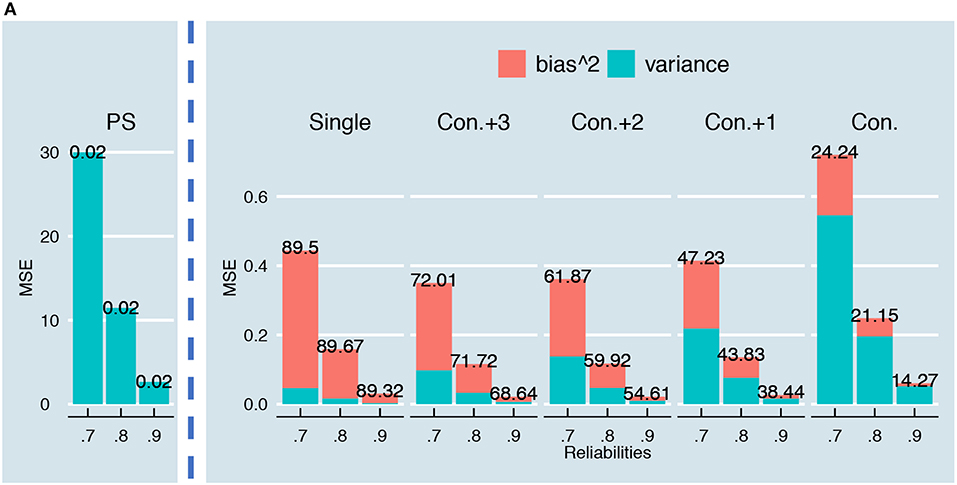
Figure 18. Bias2, variance and MSE for a test with 24-items and K = 2 (A), K = 4 (B), and K = 6 (C) parallel test parts. The overall reliability of the test is varied on the x-axis. The numbers on top of the bars show the percentage of the MSE “caused” by the bias2, which is also reflected in the size of the stacked pink bar. Note that these plots are based on the relationship in Figure 5A; similar plots for the other relationships can be requested from the first author.
The authors apologize for this error and state that this does not change the scientific conclusions of the article in any way. The original article has been updated.
Keywords: standard error of measurement, classical test theory, intra-individual variation, conditional standard error of measurement, parallel test parts
Citation: Lek KM and Van De Schoot R (2019) Corrigendum: A Comparison of the Single, Conditional and Person-Specific Standard Error of Measurement: What do They Measure and When to Use Them? Front. Appl. Math. Stat. 5:59. doi: 10.3389/fams.2019.00059
Received: 27 August 2019; Accepted: 12 November 2019;
Published: 20 December 2019.
Edited and reviewed by: Ioannis Tsaousis, University of Crete, Greece
Copyright © 2019 Lek and Van De Schoot. This is an open-access article distributed under the terms of the Creative Commons Attribution License (CC BY). The use, distribution or reproduction in other forums is permitted, provided the original author(s) and the copyright owner(s) are credited and that the original publication in this journal is cited, in accordance with accepted academic practice. No use, distribution or reproduction is permitted which does not comply with these terms.
*Correspondence: Kimberley M. Lek, QS5HLkoudmFuZGVTY2hvb3RAdXUubmw=