 Rachel Johnson1
 Jennifer Matthews
 Norou Diawara
- 1Department of Communication Disorders and Special Education, Old Dominion University, Norfolk, VA, United States
- 2Department of Mathematics, U.S. Naval Academy, Annapolis, MD, United States
- 3Department of Mathematics and Statistics, Old Dominion University, Norfolk, VA, United States
- 4Department of Mathematics and Statistics, University of North Carolina Wilmington, Wilmington, NC, United States
Apraxia of speech is an impairment in the planning and programming of speech typically accompanied by aphasia (language impairment) secondary to a left hemisphere stroke. It is unknown if the structural and functional connections to the damaged area implicate the integrity of the cognitive functions of the prefrontal cortex (PFC). The present study examines the feasibility of measuring hemodynamic activity in the PFC in response to the structure of practice and during treatment. This multiple-baseline single case-design study involving two individuals with chronic acquired apraxia of speech measured the hemodynamic changes in PFC activity during treatment across the intervention period using functional near-infrared spectroscopy (fNIRS). Two models—a generalized linear model and a spatial varying coefficient model—are used to distinguish the repeated measures of PFC activity differences corresponding to the stage of practice and time of intervention. There were significant differences in the pattern of PFC activity associated with the structure of practice and the time of intervention. The outcomes from this pilot study demonstrate the utility of fNIRS to identify cognitive effort during speech motor learning. The implications include consideration for statistical methods used for fNIRS analysis and its potential use as a clinical tool to complement behavior changes to guide patient-directed intervention to optimize patient outcomes.
Introduction
The complex neurobiology of speech involves distributed networks in cortical and subcortical brain regions [1]. A compromise to networks of interconnected regions following a stroke can result in apraxia of speech (AOS; is a sensorimotor impairment in the planning and programming for speech), aphasia (language disorder), and/or dysarthria (a disorder of speech execution and control) [2, 3]. The anatomical location and size of the lesion can affect the processing of regions functionally and structurally connected to the damaged area, [3–5] including the prefrontal cortex (PFC) [6]. Consequently, post-stroke communication deficits often involve concomitant speech, language and cognitive impairments. In general, behavioral interventions for AOS are efficacious; however, there is limited evidence to support a particular treatment [7–9].
One of the contributing factors to the limited evidence for AOS, treatment methods is the incomplete understanding of the underlying neural mechanisms responsible for motor planning and programming for typical and disordered speech. Advancements in functional neuroimaging and computational modeling have resulted in two widely recognized models for speech motor control, Directions into Velocities of Articulators (DIVA), and speech sequencing, Gradient Order DIVA (GODIVA) [10, 11]. The core characteristics of AOS, as explained in the DIVA model, are the result of impaired feedforward control and difficulty integrating feedback to correct or refine motor programs [12]. The GODIVA model explains suprasegmental characteristics of AOS, result from errors within the higher-level mechanisms involving temporary phonological buffer (working memory) and sequential activation in longer utterances for fluent speech [12]. Although the combined models have a limited explanation of motor planning, they do provide a framework to guide the interpretation of behavior and neuroimaging studies for AOS cases involving multiple sites.
Functional near-infrared spectroscopy (fNIRS) is an established neuroimaging technique to non-invasively monitor concentration changes of oxygenated hemoglobin (HbO) and deoxygenated hemoglobin (HbR) evoked neural activity in the cerebral cortex using light in the infrared spectrum [13]. The wavelength absorption signal correlates spatially and temporally with the functional magnetic resonance imaging (fMRI) blood oxygen-level dependent signal during cognitive tasks [14–16]. The resistance to motion artifact and the ability to use in a natural therapeutic setting makes fNIRS ideal for repeated measures of the brain's underlying cognitive processes during learning and performance across the course of treatment [17]. Investigations using fNIRS during language and cognitive tasks across the age span report changes in PFC activity between persons with aphasia, persons without aphasia, and healthy adults during confrontation naming tasks, [18] verbal fluency, [19, 20], and memory learning [21] are related to age and cortical integrity. To our knowledge there are no investigations involving persons with AOS during a speech, cognitive, or learning task over time.
The cognitive functions and its implications in the rehabilitation in persons with post-stroke acquired AOS is an understudied area, despite its potential influence on patient outcomes. The dual-process learning theory explains that a high level of bilateral PFC activity indicates a reliance on cognitive control processes during the initial stages of practice [22]. The areas of the prefrontal cortex associated with the cognitive control processes for cognitive flexibility are the dorsal lateral prefrontal cortex (DLPFC) and medial prefrontal cortex (MPFC). Specifically, Brodmann's Area (BA) 9, 10, and 46 are associated with tasks involving salience detection and attention, working memory, inhibition, and task switching for efficient adaption and response to changing environments [23, 24]. In the case of AOS, a heavy reliance on the PFC cognitive control processes are likely for speech motor learning during rehabilitation [5]. This information has clinical benefits to structure patient-centered interventions to maximize treatment outcomes.
One treatment protocol for AOS, Motor Learning Guided (MLG), structures the practice and schedules the feedback based on on the principles of motor learning framework found to foster acquisition and learning of a limb motor skill [25]. The three-stage treatment protocol uses a distributed, random order, practice schedule of variable whole task stimuli, and provides delayed terminal summary knowledge of results feedback at a 20% frequency rate. The measure of speech motor changes is the retention of learning from one session to the next. At the beginning of each treatment session prior to initiating the treatment protocol, productions are elicited using a written prompt of the stimuli. The rating of these productions using a Likert scale is the behavior indicator for speech motor learning. Multiple single-case treatment studies report positive outcomes [26–29]. A recent single-case treatment study involving two individuals with chronic AOS and aphasia, report positive treatment effects on treated items while comparing two methods to measure speech motor learning [27]. This study highlights the challenges clinicians face to measure changes in speech production in the presence of aphasia.
This same study investigated the utility of using fNIRS to detect PFC activity associated with the structure of practice during the treatment across the intervention period. In this pilot study, we use a computational modeler framework to identify brain activity measured using fNIRS in these two individuals with chronic acquired AOS and aphasia during each treatment day across the intervention period. First, a generalized linear model (GLM) was used to detect differences in participants' PFC neural activity across the intervention period [30–33]. Upon detection, a novel statistical method involving spatial correlation presents the structural connectivity in the brain [34].
Methods
Participants
The participants in this study are a 68-year-old male (P1), 91 months post-onset of a left hemisphere stroke, and a 61-year-old male (P2), 86 months post-onset of a left hemisphere stroke. Both participants are right-handed. They met the inclusion criteria of normal or corrected-to-normal vision, sufficient unaided hearing, and functional reading competency to participate in the study. Both participant's speech characteristics include sound distortions and distorted sound substitutions increasing with articulatory complexity or increased rate of speech. They both had an overall slow rate of speech with longer segmental and intersegmental durations and equal stress across syllables. Please see Johnson et al. [27] for a complete description of participants, stimuli, and behavioral outcome measures. Prior to participation in this study, written informed consent according to IRB approval was obtained.
Experimental Procedure
Stimuli
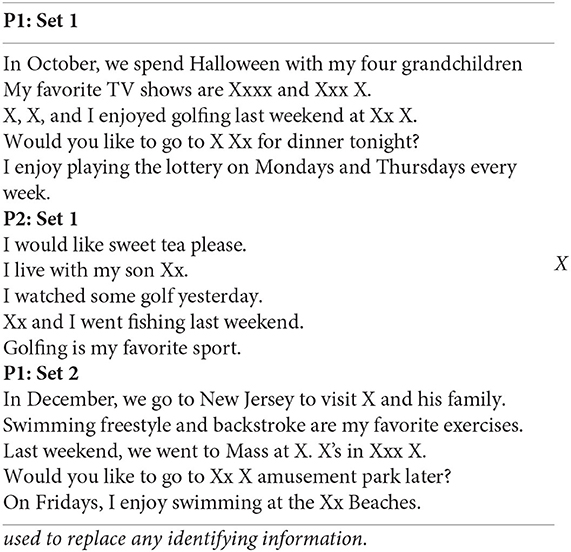
The stimuli practiced during each treatment session consisted of 5 phrases (Appendix). A structured interview identified the specific content, and the severity of AOS determined the length and complexity of the stimuli.
Experimental Design
This was a multiple baseline single-case design study across participants and behaviors performed according to recommended procedures [35]. Treatment sessions occurred for 30 min, two times a week, across 9 weeks for a total of 18 treatment sessions.
Participants were seated comfortably at ~5 m distance from a computer monitor. Each session began with an oral reading task used as a measure of speech motor learning, proceeded by the intervention following the Motor Learning Guided (MLG) treatment protocol, as previously described [36]. There are three stages in the MLG protocol, each stage differing by practice structure. Each practice session presented stimuli in random order and imposed a two-minute break between each stage of practice. The fNIRS recorded the prefrontal cortex activity during each treatment session. Each stage began with a blank screen and the 30 s fNIRS baseline measure. After the baseline measure, the written prompt for the stimuli was provided one at a time using a programmed PowerPoint presentation with a set-pause time between each production (Figure 1).
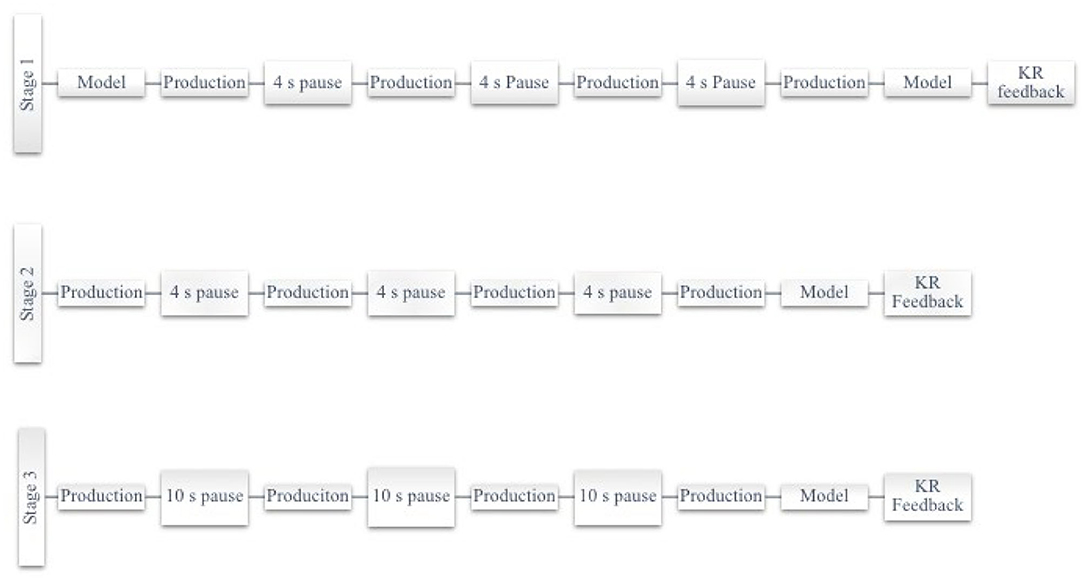
Figure 1. Schematic of practice schedule according to motor learning guided treatment protocol.
The differences between the stages of practice in the MLG protocol are the method to elicit productions and the delay time between productions. Stage 1 elicits productions using a written prompt and clinician verbal model, while Stage 2 and Stage 3 elicit productions using a written prompt only. The delay imposed between productions in Stage 1 and Stage 2 is 4 s, while in Stage 3, it is 10 s. The 18 days of intervention trained stimuli according to behavior outcomes; P1 practiced set 1 for days 1–12 and set 2 for days 13–18, whereas P2 practiced the same set for the 18 days [27].
Data Acquisition
A 16-channel continuous-wave fNIRS system (fNIR Imager Model 1100; fNIR Devices, LLC) recorded changes in hemodynamic activity of oxygenated (HbO) and deoxygenated (HbR) hemoglobin levels of the anterior PFC [37, 38], as previously described [39] and shown in Figure 2. The data were recorded and processed using COBI Studio software version 1.5.0.51 and fNIRSoft version 4.9.6716.18813 (BioPac TM systems).
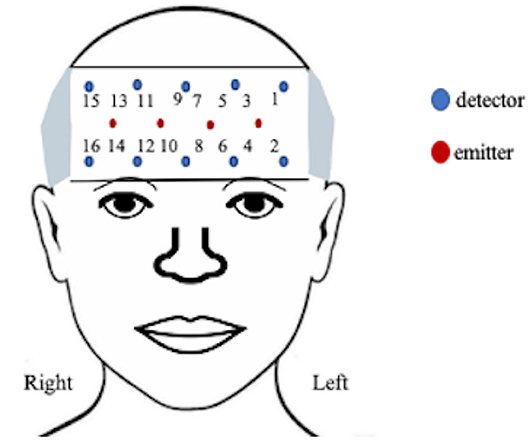
Figure 2. Functional near-infrared configuration.
The positioning of the headpiece followed the standard sensor placement procedure [37, 40] and secured using an adjustable headband and a dark cap to reduce ambient light. The sensor has a source-detector distance of 2.5 cm and a sampling rate of 2 Hz. Manual markers indicate the beginning and end of each stimulus presentation and participant production. The markers ware labeled by phrase presentation to account for the random presentation of stimuli.
fNIRS Data Processing
The modified Beer-Lambert law converted the fNIRS raw light intensity signals to changes in oxygenated hemoglobin (HbO) and deoxygenated hemoglobin (HbR) concentrations. The sum of HbO and HbR yields the change in total hemoglobin (HbT) described as an indicator of variations in the regional cerebral blood volume. The automated sliding-window artifact rejection algorithm uses a coefficient-of-variation approach to assess the signal quality and reject problematic channels with bad contact or saturated raw light intensity [13]. The algorithm resulted in the rejection of 6.3% of the data secondary to artifacts. Following the application of the sliding-window artifact rejection algorithm, the changes in HbO and HbR time series for each channel were bandpass filtered at 0.1 Hz to reduce the slow signal drift and remove the physiological artifacts. Lastly, Correlation Based Signal Improvement was used to improve signal quality [41]. For statistical analysis, the mean value [HbO, HbR, HbT] was calculated by averaging the recorded [HbO, HbR, HbT] values during each stimulus block, and subtracting the mean change in HbO, HbR, and HbT of the recorded global baseline (first 30 s) for each stage of the treatment protocol. Imputation from the previous and next values' average replaced the missing values. With more than 600 observations per subject, we had sufficient statistical power to study the PFC activity.
Analysis
The goal of this analysis is to identify any significant differences between the participant's intensity and response amplitude by patterns of activity during practice and the number of days performing the task. The locations of interest in the PFC included the left and right hemisphere and isolated Brodmann area (BA) 9, 10, and 46. The channels assigned to each group were determined based on the Montreal Neurological Institute (MNI) cortical virtual spatial registration for the 16-channels for older adults [42]. The first grouping associated with the DLPFC (BA 9 and 46), contained channels 1, 2, and 15, and the second grouping of the MPFC (BA 10) contained channels 3–14 and 16 (Figure 3). The two models considered, are a GLM and a Spatial Varying Coefficients Model. These analyses were performed in SAS using proc GLM and in R using the spatstat package.
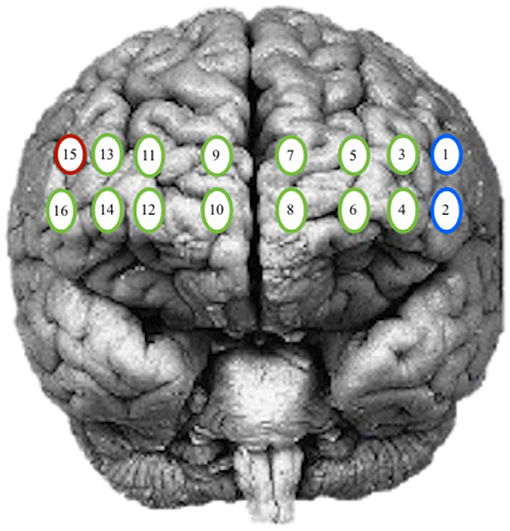
Figure 3. Optode grouping for regions of interest. Red, Broadmann's Area 9; Green, Broadmann's Area 10; Blue, Broadmann's Area 46.
Generalized Linear Model
In a conventional study, effects of participants, days, and location, a GLM is based on the fact that intensity, is a function of many sources, including nuisance or errors. Many authors have proposed the GLM model for similar PFC data [30–33]. A mixed-effect model can also be used. Such a model can be described as follows:
• where:
• μ is the overall intensity
• αi represents the effect due to location, i = 1, …, I
• γt represents the effect due to day, t = 1, …, T
• τk represents the effect due to participant, k = 1, …, K
• δl represents the effect due to stage, l = 1, …, L
The model can be expressed as
• Y = Xβ + ε,
where Y is the vector of measured intensity by location and day, X is the design matrix, β is the vector of regression coefficients and ε is the vector of error terms. Here, the design matrix X includes information about location, day, participant, and stage. The assumptions that the errors are independent and normally distributed will be made and validated in the investigations.
Estimation of the parameter set β is such that assuming that the design matrix X is invertible. If not, using the generalized equation will allow us to obtain a solution, even though they will not be unique. Normality is a strong assumption, and there are other techniques that have been proposed to remedy and avoid biases [32]. Huppert [43] mentions that errors in fNIRS are not independent. Tools are currently under consideration to analyze data under region based interest however, no standard recommendation exists at this time [44].
As previously described in section Analysis, two groupings of channels were considered for this analysis and four different comparisons were of interest within the groupings. Groupings and comparisons of interest are:
• Grouping 1: L (channels 1 and 2) and R (channels 15)
• Grouping 2: L (channels 3–8) and R (channels 9–14, 16)
• Case 1: Compare P1 day 1–12 to P2 day 1–12
• Case 2: Compare P1 day 13–18 to P2 day 1–6
• Case 3: Compare P2 day 1–6 to P2 day 13–18
• Case 4: Compare P1 day 1–6 to P1 day 13–18
Spatial Varying Coefficients Model
To assess the spatial connectivity between the channels, a model parcellation of the channel network is adapted. The advantages of this approach include: biological interpretability, reduction in the parameters to estimate, and quantification of the measure of spatial correlation [34, 42]. However, this model does require precise locations and a distance locator. To take advantage of the data, the model should incorporate:
a) Limited assumptions
b) Dependent component analysis
c) Spatio-temporal correlation approach
To reveal the structure of the functioning of the channels, interaction of the patterns in the brain activity is studied such that the impact is associated with the distance of the blood flow between the channels' proximities. A general framework for the spatial model is that the regions of the brain interact after adjustment on the distance between them such that closer regions are more alike. The goal is to identify any regions of the brain that have strong correlation(s). Since the regions are spatial representations (based on MNI coordinates), we adopted the spatial correlation proposed by Moran [45] and further developed by many authors such as Chen et al. [46] We provide additional benefits in the stage of practice and day (temporal) parameters which substantially describe the complex spatial signal control in the brain image data for the two participants. The 16 channels observed were depicted as regions determined by some coordinate system denoted as the pair (xi, yi), we rewrite as (xit, yit) to include day/time information for the change in HbO, HbR, and HbT signals.
We define the model of the Moran intensities as follows:
• represents the spatial weight between regions i and i′ for the tth day at each stage and will be defined as , the geographical weight, where d is the average of distances between all possible pairs of points i and i′.
• for the distance matrix, , distance is measured as one step (up, down, left, right) along the shortest distance path between regions and when the regions coincide, (i.e., i = i′), the distance is taken from a central node (along the brain stem).
• can be seen as the absolute value of the difference in observed intensities at regions i and i′ for the tth day and for each stage. Generally, the value of this function is smaller for closer regions.
If we ignore the then we will have a symmetric matrix function of the locations only, and we can consider it as a design matrix, and call it M:
In presenting the autocorrelation between the channel locations, we recall the Pearson correlation coefficient. In the spatial setting, the correlation is formulated as:
where S is the sum of all weights wi, j between the i and j observations capturing the closeness of those observations from the channel locations to the main blood and oxygenation supply line. These correlations can be calculated for each day and lead to higher correlations for closer regions.
Model Results
The analysis provides estimations of the PFC activity for two participants across the intervention period. The significant difference in PFC activity in the regions of interest was associated with parameters of the schedule of practice and time of intervention. The analysis considered two groupings of channels, and five comparisons were of interest within the groupings.
Generalized Linear Model
Grouping 1 looked at hemodynamic activity in BA 9 and 46. The overall models for Grouping 1 were all significant (Table 1). Case 1 compared the hemodynamic activity for both participants according to the left and right hemispheres (location) and stages across 12 treatment days. There was a significant difference in oxygenation between the left and right hemispheres across treatment days and between participants. However, the mean HbO was not significantly different for stage (Figure 4). The HbR was significantly different across treatment days, between the left and right hemispheres, and stage. The HbT (total blood volume) was significantly different between participants across treatment days and stages. For all cases compared, HbT differed significantly across treatment days, remaining steady and consistent between the left and right hemispheres. In case 2, the HbT did not differ between participants for stage only when comparing the first six treatment days on P2's second set of stimuli and P1's first (and only) set of stimuli.
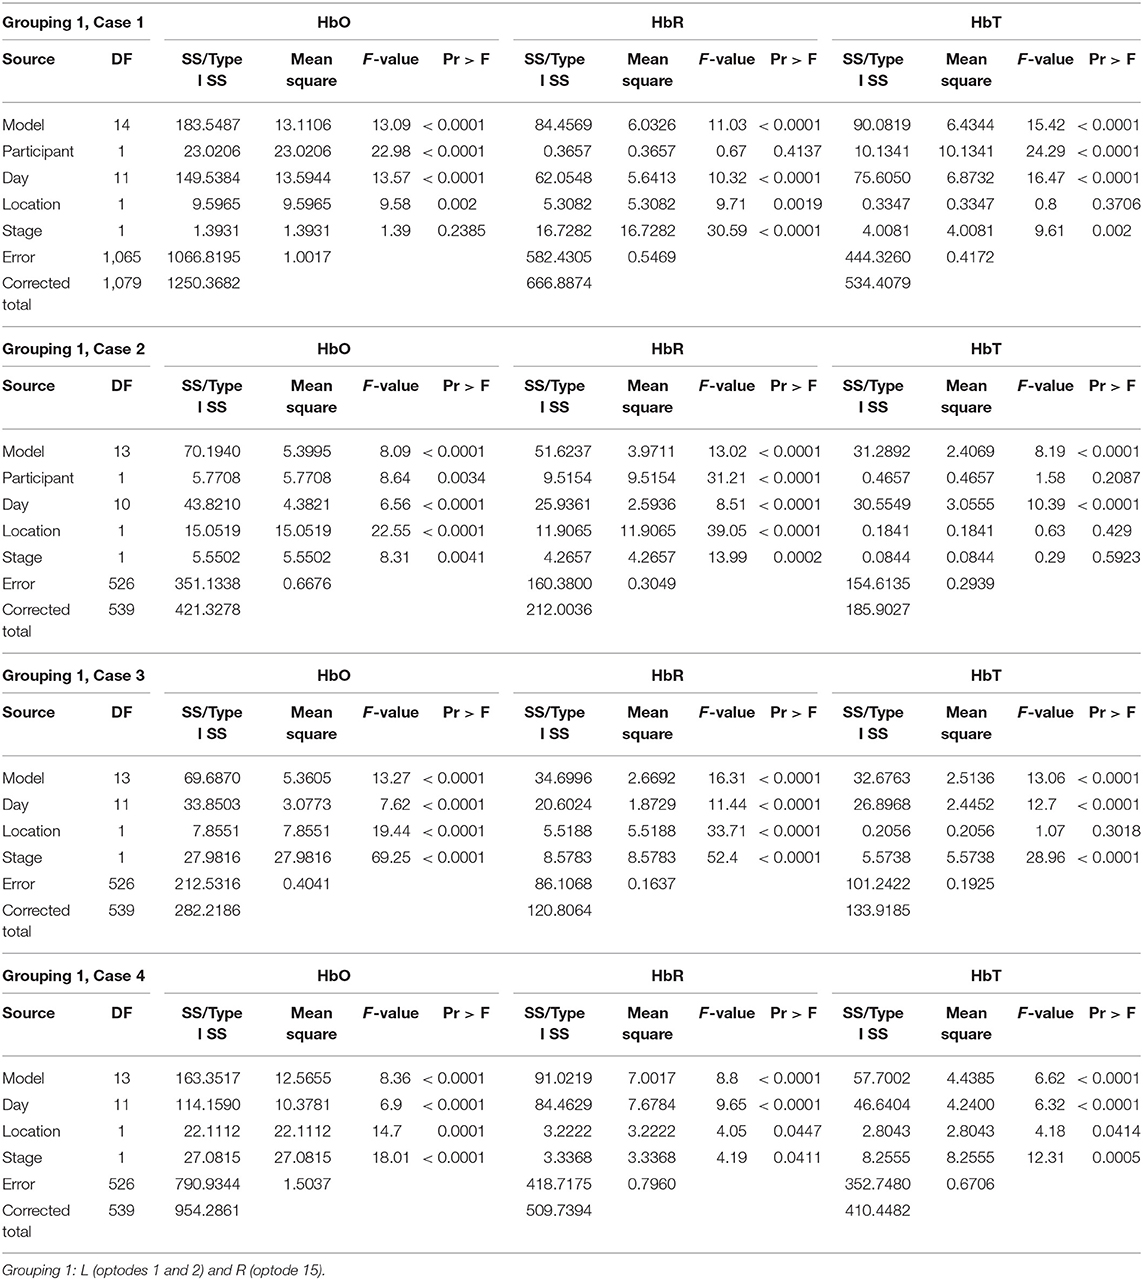
Table 1. GLM results for Grouping 1.
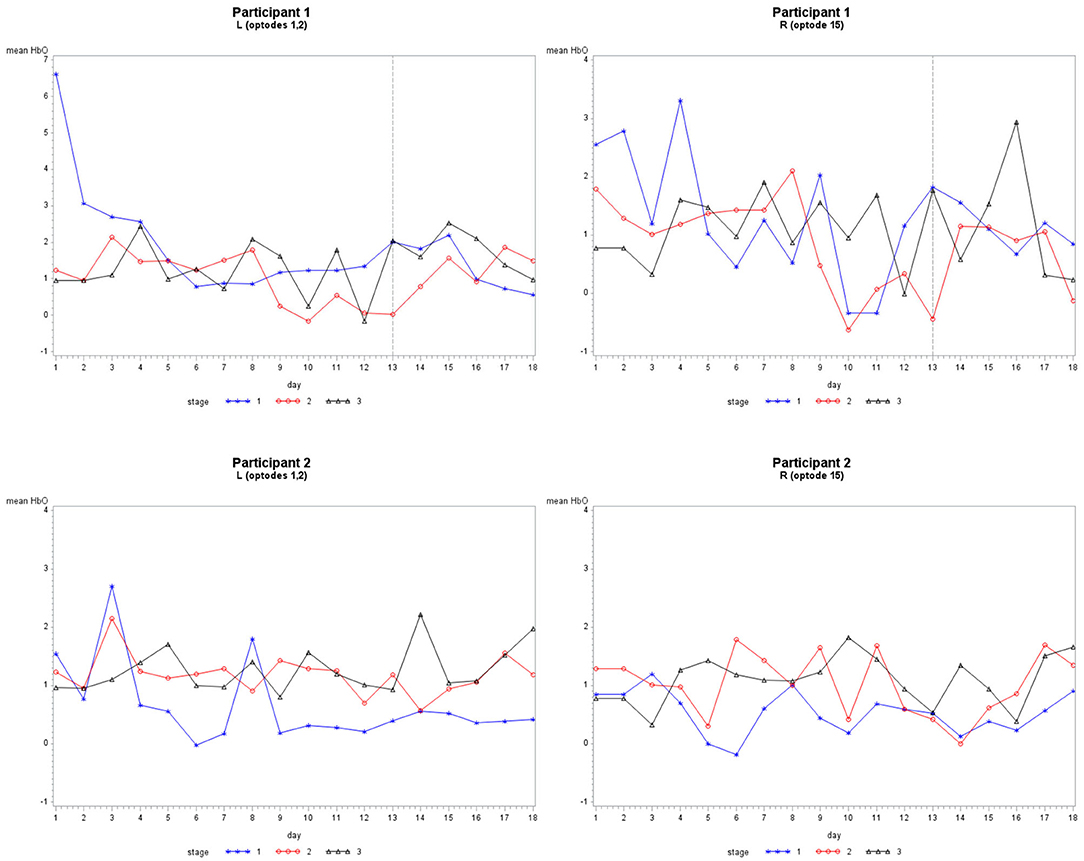
Figure 4. The mean HbO activity for Grouping 1 by stage for each participant. The vertical line at day 13 for participant 1 indicates set 1 to the left and set 2 to the right.
Grouping 2 looked at hemodynamic models of BA 10. The overall models for Grouping 2 were all significant (Table 2). In case 1, HbO was significant for all covariates; however, the HbR for the location was not significant, and the HbR and HbT for stages were not significant. The hemodynamic activity was significant for all covariates during the first six training days for P2 on set 2 and P1. The HbO and HbT were not significant between the left and hemispheres for P1 during the first six treatment days on both sets of stimuli, or P2 during the first and last six treatment days. As illustrated in Figure 5, there was bilateral BA 10 activity for all stages of practice. For P1 in Stage 1, there was a higher bilateral BA 10 activity during the initial treatment days with both sets of stimuli. The activity for P2 was similar in each stage; a decrease occurred only in Stage 1 (clinician model) across treatment days.
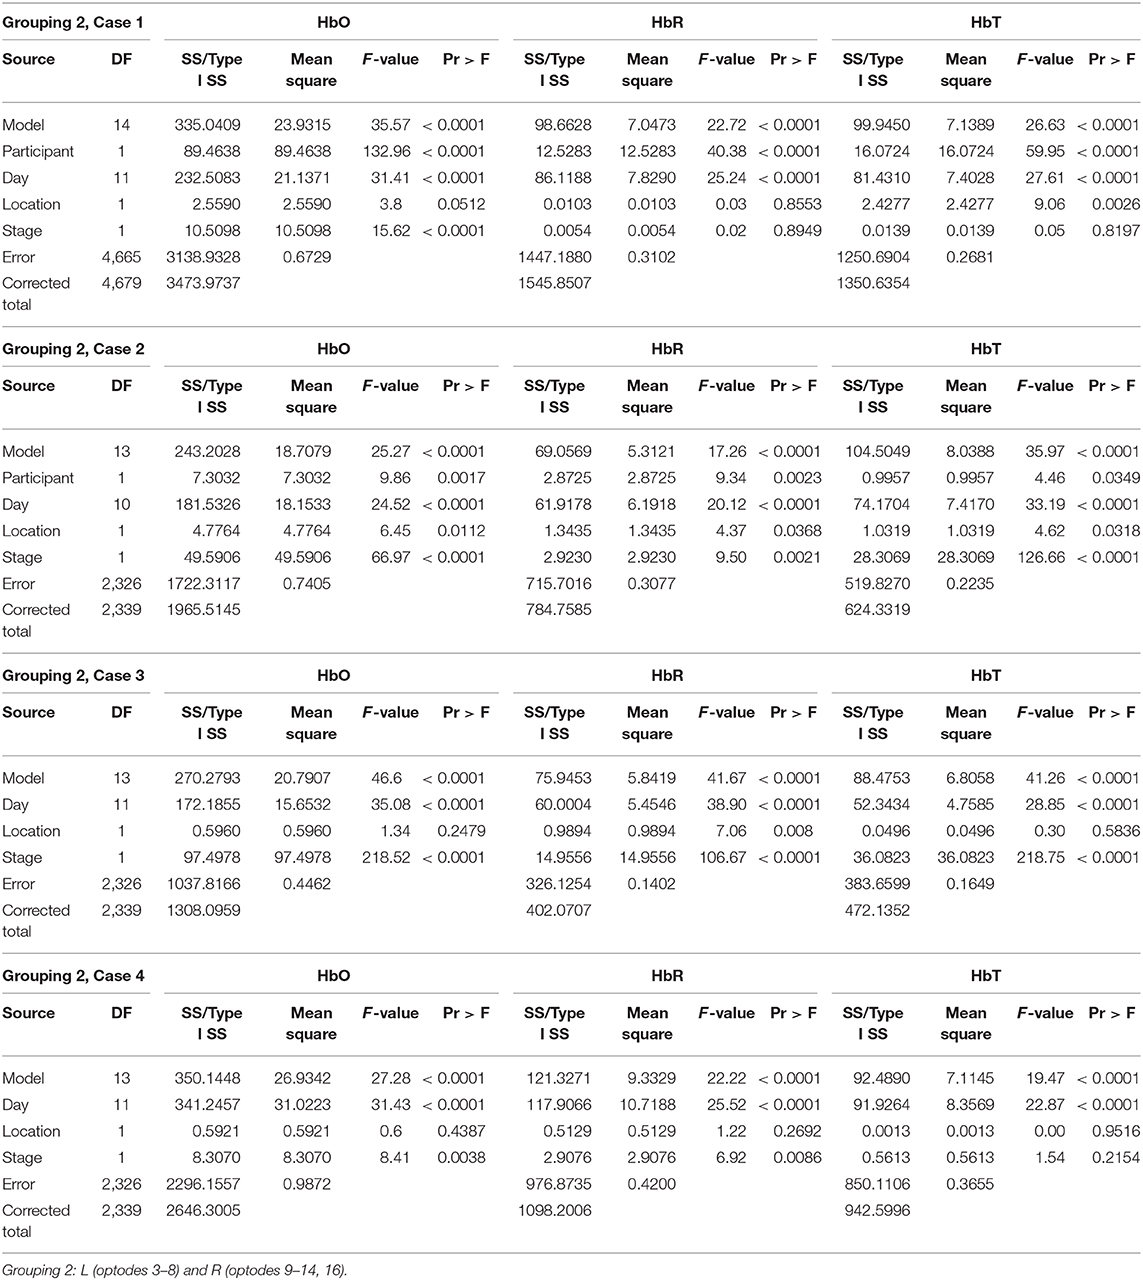
Table 2. GLM results for Grouping 2.
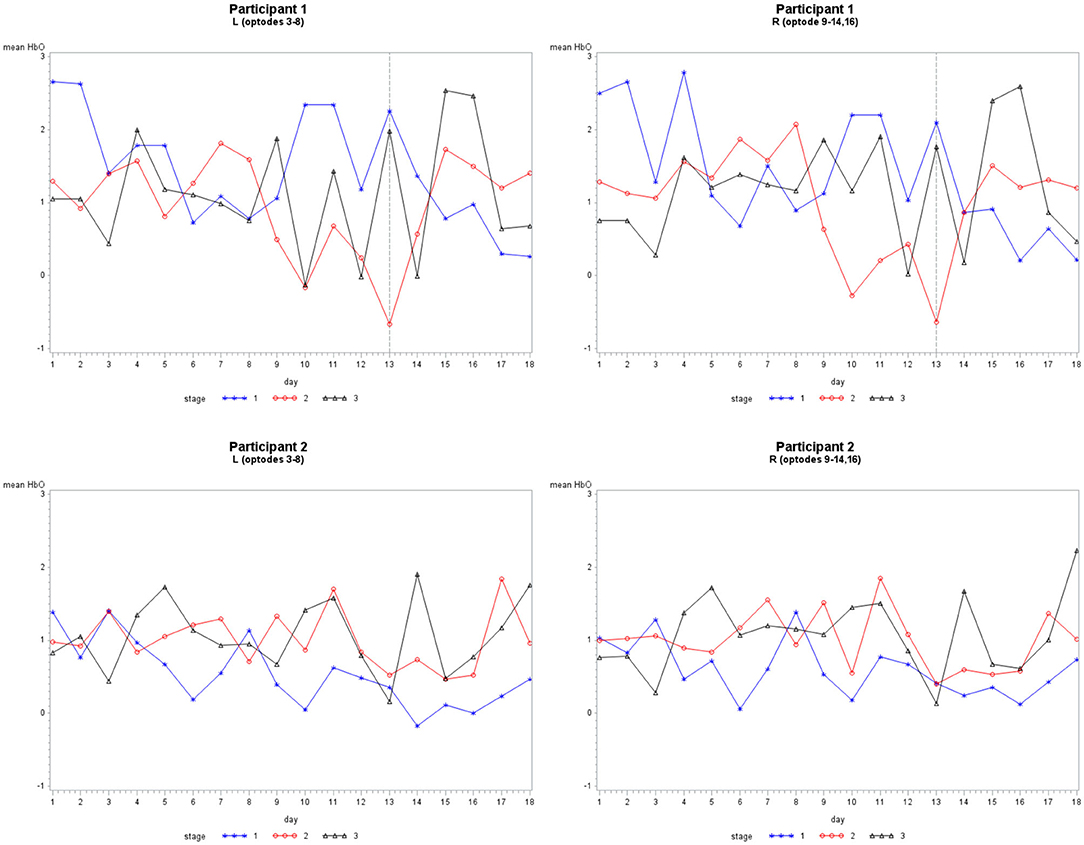
Figure 5. The mean HbO activity for Grouping 2 by stage for each participant. The vertical line at day 13 for participant 1 indicates set 1 to the left and set 2 to the right.
As illustrated in Figure 6, there was a consistent HbO level in channels 1 (inferior frontal gyrus, IFG), 5 (superior frontal gyrus, SFG), 12 (SFG), and 14 (middle frontal gyrus, MFG) for P1 during each stage. The HbO levels during Stage 2 (no model) were higher in channels 12 and 14, while channels 1 and 5 had lower levels. In Stage 3 (no model, 10 s delay), there were distributed HbO levels across multiple channels in the left and right hemispheres. For P2, there was a consistent level of HbO measured in channels 4 (MFG), 10, and 12 in all stages. The HbO concentration became increasingly distributed in the left and right hemispheres across each stage of practice. Active only during Stage 2 and Stage 3 was a cluster of channels 1–4 (IFG and MFG). Channels 13, 14, 15, and 16 (IFG and MFG) recruited during Stage 3, mirrored the left PFC activity pattern.
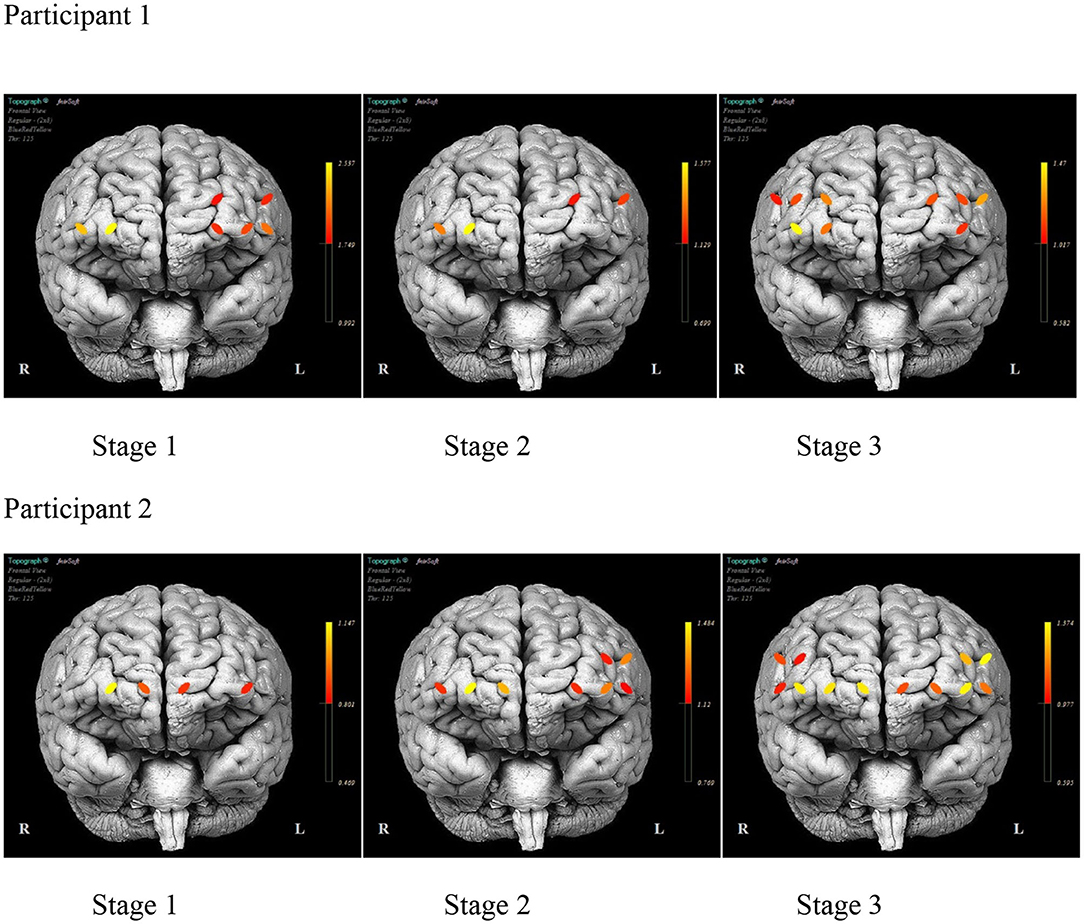
Figure 6. The mean prefrontal cortex activity by optode during each stage of practice during training days 1–12 for each participant.
Figure 7 illustrates the differences in the pattern of PFC activity between the participants across the training days. A similar distribution pattern of PFC activity during the initial days of practice for both sets of stimuli is evident for P1. The activity localized in channels 5, 12, and 14 (bilateral SFG and right MFG) with practice. The activity pattern for P2 remains fairly distributed across the duration of the treatment with consistent activity noted in channels 1, 4, and 12 (left IFG and MFG and right SFG).
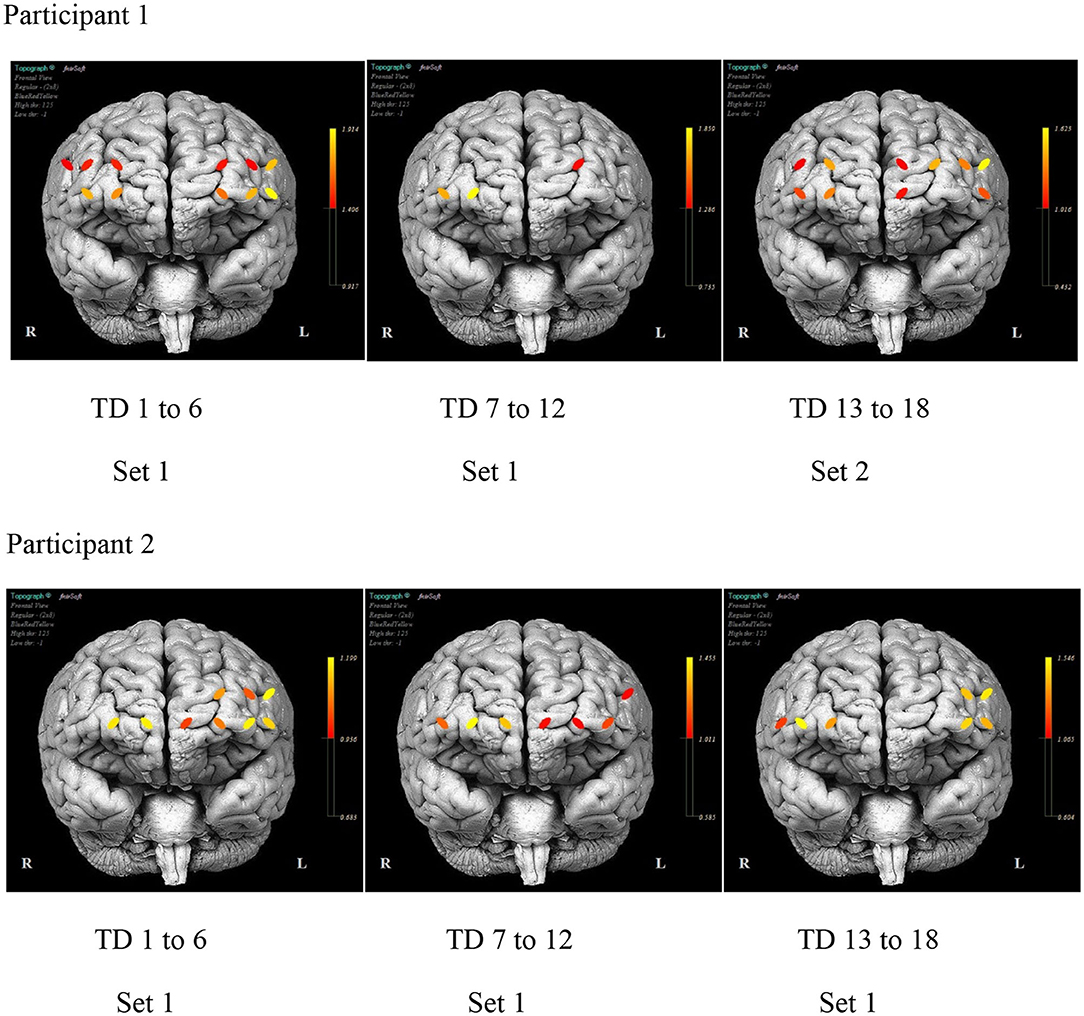
Figure 7. The mean prefrontal cortex activity by optode for selected day ranges for each participant.
Spatial Varying Coefficients Model
For the spatial model, we first focus on the absolute value of the HbO intensity observed in three regions: channels 1, 2, and 15. The resulting distance matrix utilizing the distance as described in section Spatial Varying Coefficients Model is:
Next, we calculate the geographical weights, , defined as , where is the average of distances between all possible pairs of points i and i′ [47].
Then we calculate the Moran statistics for each participant at each stage. Figure 8 are the graphs of the Moran statistics; a Loess smoothing curve has been added to easily detect trends between participants.
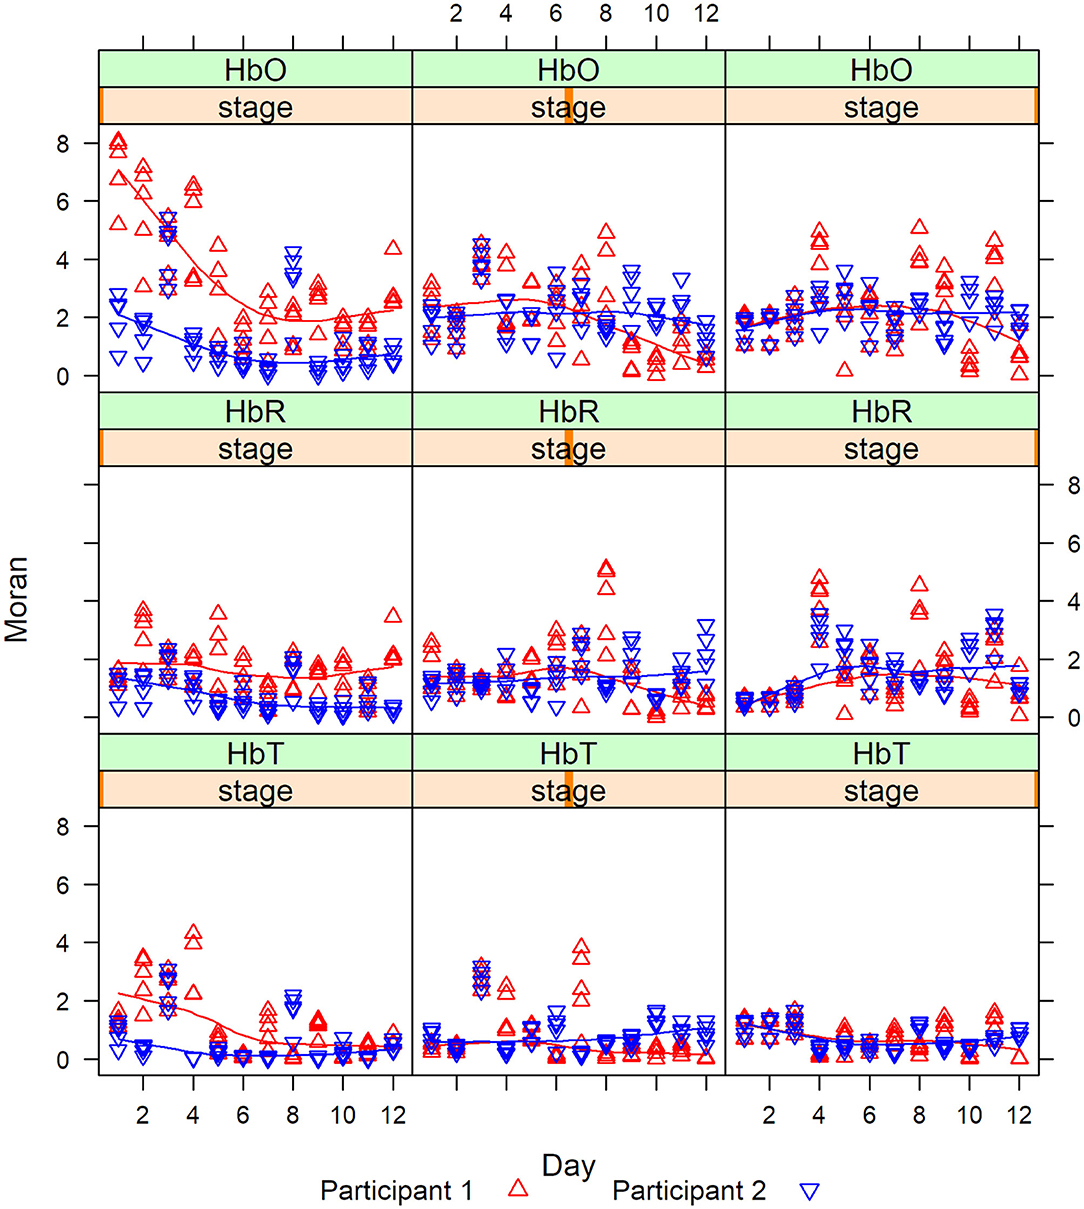
Figure 8. Moran statistic for Grouping 1 for HbO, HbR, and HbT by stage for days 1–12.
The degree of correlation measured by the Moran statistics between the participants indicated that the correlation between channels 1 and 2 vs. channel 15 was always higher for P1 (red) in Stage 1, whereas, in Stages 2 and 3, the correlations cross. This last remark was especially visible in Stage 2 after day 6. This shows that there was a magnitude of PFC activity (HbO, HbR, and HbT) represented in Stage 1 (clinician model) that lessened in Stage 2 (no model) and 3 (no model, 10 s delay) overtime.
The Pearson correlation of HbO values and differences during each stage and channel for each participant were significant, revealing regional variations in the level of HbO activity in the PFC (Figure 9). The darkened main diagonal shape is evidence of the identity autocorrelation. The plot shades close to the main diagonal correspond to short range correlation, while the plot shades distant from the main diagonal correspond to long range correlations. The level of HbO activity in Stage 1 was higher for channels 5, 14, and 16 for P1, while channels 1, 2, 12, and 15 were higher for P2. In stage 2, the level of HbO activity for all channels was consistently higher for P1 compared to P2. In Stage 3, the level of HbO activity was dominant in the left hemisphere for P1; whereas, the right hemisphere was dominant for P2.
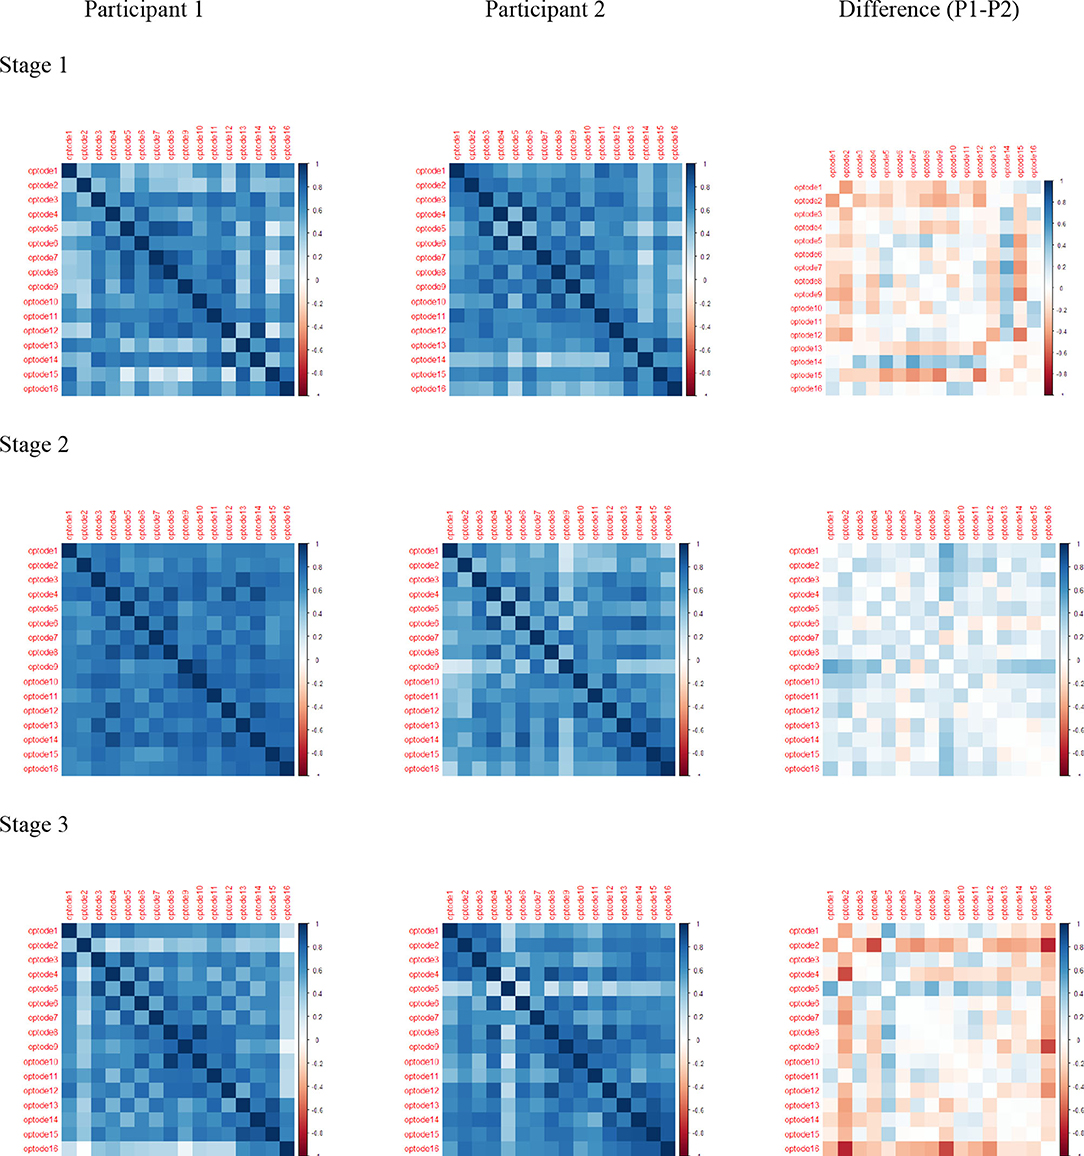
Figure 9. Pearson correlations for HbO: rows are stage 1, stage 2, and stage 3; columns are Participant 1, Participant 2, and Difference (P1–P2).
Discussion
This study investigated the utility of using fNIRS to measure the hemodynamic activity in the PFC during AOS treatment. Of interest was the hemodynamic PFC activity in response to the different methods for eliciting speech and the length of the delay between productions in the treatment protocol. Differences in the PFC activity for regions of interest associated with the schedule of practice in each stage of the treatment protocol and the spatial connectivity of the pattern of activity were determined using two statistical methods. Overall, the results of the GLM model confirm the involvement of cognitive control processes during speech motor learning and the association of cognitive demands and the schedule of practice while learning.
Previous studies reporting a task associated with PFC activity guided the groupings for the comparisons. The GLM model investigated the areas of the PFC associated with higher-order cognitive planning tasks (BA 9 and 46) in the first grouping and working memory tasks (BA 10) in the second grouping. Consistent with prior research, there was a high level of bilateral PFC activity associated with new learning [22–24]. The level of activity in the right hemisphere decreased across treatment days for P1, while the left hemisphere remained steady [20]. This pattern of activity is consistent with previous reports of left hemisphere dominance with speaking tasks [18, 19] and the dual-processing theory [22]. The speech behavior during retention measures for P1 characterized speech productions as consistent decrease occurrences of segmental and intersegmental durations with fewer long durations compared to baseline [27]. However, for P2, the PFC activity remained bilateral, indicating the involvement of cognitive control processes throughout the intervention period. The speech behavior during retention measures was characterized as inconsistent day to day performance related to distortions and lengthened segmental and intersegmental duration [27]. These findings, combined with behavior outcomes for the retention of learning [27], provide initial evidence of cognitive control processes associated with speech motor learning during the rehabilitation of AOS. Replication of these findings across more participants would assist in the further interpretation of these findings and its potential use as a clinical tool.
The three stages in the MLG treatment protocol differ in the speech elicitation methods and length of time between each production. The verbal model used in Stage 1 is a common prompt for eliciting speech in persons with AOS. Novel to the MLG treatment protocol is eliciting speech with a written prompt only in Stage 2 and Stage 3. The rationale for using this method is the low reliance on external prompts and proximity to independent productions. The GLM, along with the mapping of the functional connectivity interpreted under a spatial-temporal correlation measure using the Spatial Varying Model, presents the activity at the channel level. The regions active during Stage 1 were active during all speech tasks, similar to the activity reported during standard speech production [48]. The pattern of activity, during Stage 2, for P2, and both participants in Stage 3, was similar to the activity pattern in the first six treatment days. The decreased magnitude of activity in the IFG after treatment day 6 for P1, paired with the behavior retention outcome characterizing no lengthened segmental or intersegmental speech characteristics [27], provides evidence for the association between speech motor learning and cognitive control processes during the rehabilitation of AOS. Further, the dominant activity for P1 during Stage 2 in left hemisphere activity during Stage 3 compared to P2 are of great interest in understanding the implications the structure of practice has on the cognitive demands during rehabilitation. The model distinguishes a shift in the magnitude of activity in the left and right IFG and differentiates the regional variation of PFC activity associated with the structure of practice and speech motor learning in these two participants.
The delay between productions and the augmented schedule of feedback in the MLG protocol elicits metacognitive skills for self-reflection, comparing the internal representation of the intended outcome while maintaining the desired outcome representation. The extended length of the delay in Stage 3 compared to Stage 1 and 2, is associated with high bilateral activity in both participants. This neurophysiological evidence explains that the extended delay increases the complexity and cognitive function during the task [49, 50]. The behavior retention outcomes paired with the pattern of neural activity during the training are evidence of the potential use for fNIRS as a tool to guide clinical decisions during rehabilitation in persons with AOS and aphasia.
While this study provides evidence that the length of time between productions engages cognitive functions for learning, without specific characteristics of the speech production during the practice activity, interpretation for clinical application is limited. The lesion size and location for the participants were unavailable and would have contributed information regarding the neural reorganization. One cannot avoid the possibility of individual anatomical differences, or those associated with aging, and consistent placement using anatomical markers [42, 51]. The objective of this study was to examine the utility of using fNIRS and proof of concept for a structural equation to identify individual differences in brain connectivity associated with AOS outcomes during rehabilitation. Probabilistic interpretations in a Spatio-temporal context illustrate common regions of activity associated with the presumed function in healthy subjects for cognitive control processes.
The outcomes of this study provide pilot data to support further investigation of the use of functional imaging to advance clinical practices. The difference in the neural activity of the two participants in this study in response to different aspects of the practice schedule warrants further investigation. The pairing of behavioral and neural functioning data has the potential to advance translational clinical research. While the study is limited in its generalization to the patient population, the evidence presented supports future rigorous investigation of the statistical methods. The trend in neuroimaging research is the use of multimodal imaging techniques. The reality is that studies of this capacity are limited to large scale research institutions. The ability to use statistical methods in lieu of multimodal imaging techniques has the potential to extend contributions to the body of literature at a broader scale from all clinical research institutions.
Data Availability Statement
The datasets generated for this study are available on request to the corresponding author.
Ethics Statement
The studies involving human participants were reviewed and approved by the Old Dominion University Institutional Review Board for Human Subjects. The patients/participants provided their written informed consent to participate in this study.
Author Contributions
RJ and ND designed the study. RJ collected data. JM and ND performed the analysis of the data. RJ, JM, and ND wrote the paper. RC added input and organizational flow for the manuscript. All authors contributed to the article and approved the submitted version.
Conflict of Interest
The authors declare that the research was conducted in the absence of any commercial or financial relationships that could be construed as a potential conflict of interest.
References
1. Skipper JI, Devlin JT, Lametti DR. The hearing ear is always found close to the speaking tongue: review of the role of the motor system in speech perception. Brain Lang. (2017) 164:77–105. doi: 10.1016/j.bandl.2016.10.004
2. Duffy JR. Motor Speech Disorders: Substrates, Differential Diagnosis, and Management. 3rd ed. St. Louis, MO: Mosby (2013).
3. Basilakos A. Contemporary approaches to the management of post-stroke apraxia of speech. Semin Speech Lang. (2018) 39:25–36. doi: 10.1055/s-0037-1608853
4. Moser D, Basilakos A, Fillmore P, Fridriksson J. Brain damage associated with apraxia of speech: evidence from case studies. Neurocase. (2016) 22:346–56. doi: 10.1080/13554794.2016.1172645
5. Ballard KJ, Tourville JA, Robin DA. Behavioral, computational, and neuroimaging studies of acquired apraxia of speech. Front Hum Neurosci. (2014) 8:892. doi: 10.3389/fnhum.2014.00892
6. Hillis AE, Work M, Barker PB, Jacobs MA, Breese EL, Maurer K. Re-examining the brain regions crucial for orchestrating speech articulation. Brain. (2004) 127(Pt 7):1479–87. doi: 10.1093/brain/awh172
7. Ballard KJ, Wambaugh JL, Duffy JR, Layfield C, Maas E, Mauszycki S, et al. Treatment for acquired apraxia of speech: a systematic review of intervention research between 2004 and 2012. Am J Speech Lang Pathol. (2015) 24:316–37. doi: 10.1044/2015_AJSLP-14-0118
8. Wambaugh JL, Duffy JR, McNeil MR, Robin DA, Rogers MA. Treatment guidelines for acquired apraxia of speech: treatment descriptions and recommendations. J Med Speech Lang Pathol. (2006) 14:35–66.
9. Wambaugh JL, Duffy JR, McNeil MR, Robin DA, Rogers MA. Treatment guidelines for acquired apraxia of speech: a synthesis and evaluation of the evidence. J Med Speech Lang Pathol. (2006) 14:Xv–Xxxiii.
10. Bohland JW, Bullock D, Guenther FH. Neural representations and mechanisms for the performance of simple speech sequences. J Cogn Neurosci. (2010) 22:1504–29. doi: 10.1162/jocn.2009.21306
11. Tourville JA, Guenther FH. The DIVA model: a neural theory of speech acquisition and production. Lang Cogn Process. (2011) 26:952–81. doi: 10.1080/01690960903498424
12. Miller HE, Guenther FH. Modelling speech motor programming and apraxia of speech in the DIVA/GODIVA neurocomputational framework. Aphasiology. (2020) 1–18. doi: 10.1080/02687038.2020.1765307
13. Ayaz H, Izzetoglu K, Shewokis PA, Onaral B. Sliding-window motion artifact rejection for functional near-infrared spectroscopy. Conf Proc IEEE Eng Med Biol Soc. (2010) 2010:6567–70. doi: 10.1109/IEMBS.2010.5627113
14. Wijeakumar S, Huppert TJ, Magnotta VA, Buss AT, Spencer JP. Validating an image-based fNIRS approach with fMRI and a working memory task. Neuroimage. (2017) 147:204–18. doi: 10.1016/j.neuroimage.2016.12.007
15. Cui X, Bray S, Bryant DM, Glover GH, Reiss AL. A quantitative comparison of NIRS and fMRI across multiple cognitive tasks. Neuroimage. (2011) 54:2808–21. doi: 10.1016/j.neuroimage.2010.10.069
16. Sato H, Yahata N, Funane T, Takizawa R, Katura T, Atsumori H, et al. A NIRS-fMRI investigation of prefrontal cortex activity during a working memory task. Neuroimage. (2013) 83:158–73. doi: 10.1016/j.neuroimage.2013.06.043
17. Scarapicchia V, Brown C, Mayo C, Gawryluk JR. Functional magnetic resonance imaging and functional near-infrared spectroscopy: insights from combined recording studies. Front Hum Neurosci. (2017) 11:419. doi: 10.3389/fnhum.2017.00419
18. Sakatani K, Xie Y, Lichty W, Li S, Zuo H. Language-activated cerebral blood oxygenation and hemodynamic changes of the left prefrontal cortex in poststroke aphasic patients: a near-infrared spectroscopy study. Stroke. (1998) 29:1299–304. doi: 10.1161/01.STR.29.7.1299
19. Chaudhary U, Hall M, DeCerce J, Rey G, Godavarty A. Frontal activation and connectivity using near-infrared spectroscopy: verbal fluency language study. Brain Res Bull. (2011) 84:197–205. doi: 10.1016/j.brainresbull.2011.01.002
20. Kahlaoui K, Di Sante G, Barbeau J, Maheux M, Lesage F, Ska B, et al. Contribution of NIRS to the study of prefrontal cortex for verbal fluency in aging. Brain Lang. (2012) 121:164–73. doi: 10.1016/j.bandl.2011.11.002
21. Matsui M, Tanaka K, Yonezawa M, Kurachi M. Activation of the prefrontal cortex during memory learning: near-infrared spectroscopy study. Psychiatry Clin Neurosci. (2007) 61:31–8. doi: 10.1111/j.1440-1819.2007.01607.x
22. Chein JM, Schneider W. Neuroimaging studies of practice-related change: fMRI and meta-analytic evidence of a domain-general control network for learning. Brain Res Cogn Brain Res. (2005) 25:607–23. doi: 10.1016/j.cogbrainres.2005.08.013
23. Niendam TA, Laird AR, Ray KL, Dean YM, Glahn DC, Carter CS. Meta-analytic evidence for a superordinate cognitive control network subserving diverse executive functions. Cogn Affect Behav Neurosci. (2012) 12:241–68. doi: 10.3758/s13415-011-0083-5
24. Dajani DR, Uddin LQ. Demystifying cognitive flexibility: implications for clinical and developmental neuroscience. Trends Neurosci. (2015) 38:571–8. doi: 10.1016/j.tins.2015.07.003
25. Schmidt RA, Lee T. Motor Control and Learning: A Behavioral Approach. 5th ed. Champaign, IL: Human Kinetics (2011).
26. Johnson RK, Lasker JP, Stierwalt JAG, MacPherson MK, LaPointe LL. Motor learning guided treatment for acquired apraxia of speech: a case study investigating factors that influence treatment outcomes. Speech Lang Hear. (2017) 21:213–23. doi: 10.1080/2050571X.2017.1388488
27. Johnson RK, Lott A, Prebor J. A comparison of outcome measures for speech motor learning in acquired apraxia of speech using motor learning guided treatment. Clin Arch Commun Disord. (2018) 3:1–13. doi: 10.21849/cacd.2018.00304
28. Lasker JP, Stierwalt JAG, Hageman CF, LaPointe LL. Using motor learning guided theory and augmentative and alternative communication to improve speech production in profound apraxia: a case example. J Med Speech Lang Pathol. (2008) 16:225–33.
29. Lasker JP, Stierwalt JAG, Spence M, Cavin-Root C. Using webCam interactive technology to implement treatment for severe apraxia: a case example. J Med Speech Lang Pathol. (2010) 18:71–6.
30. Qureshi NK, Naseer N, Noori FM, Nazeer H, Khan RA, Saleem S. Enhancing classification performance of functional near-infrared spectroscopy- brain-computer interface using adaptive estimation of general linear model coefficients. Front Neurorobot. (2017) 11:33. doi: 10.3389/fnbot.2017.00033
31. Schroeter ML, Bücheler MM, Müller K, Uludag K, Obrig H, Lohmann G, et al. Towards a standard analysis for functional near-infrared imaging. Neuroimage. (2004) 21:283–90. doi: 10.1016/j.neuroimage.2003.09.054
32. Tak S, Ye JC. Statistical analysis of fNIRS data: a comprehensive review. Neuroimage. (2014) 85(Pt 1):72–91. doi: 10.1016/j.neuroimage.2013.06.016
33. Ye JC, Tak S, Jang KE, Jung J, Jang J. NIRS-SPM: statistical parametric mapping for near-infrared spectroscopy. Neuroimage. (2009) 44:428–47. doi: 10.1016/j.neuroimage.2008.08.036
34. Huertas I, Oldehinkel M, van Oort ESB, Garcia-Solis D, Mir P, Beckmann CF, et al. A Bayesian spatial model for neuroimaging data based on biologically informed basis functions. Neuroimage. (2017) 161:134–48. doi: 10.1016/j.neuroimage.2017.08.009
35. Kratochwill TR, Hitchcock JH, Horner RH, Levin JR, Odom SL, Rindskopf DM, et al. Single-Case intervention research design standards. Rem Spec Educ. (2013) 34:26–38. doi: 10.1177/0741932512452794
36. Johnson RK. Motor learning guided treatment for acquired apraxia of speech. Speech Lang Hear. (2017) 21:202–12. doi: 10.1080/2050571X.2017.1379721
37. Ayaz H, Shewokis PA, Curtin A, Izzetoglu M, Izzetoglu K, Onaral B. Using MazeSuite and functional near infrared spectroscopy to study learning in spatial navigation. J Vis Exp. (2011). doi: 10.3791/3443
38. Izzetoglu M, Izzetoglu K, Bunce S, Ayaz H, Devaraj A, Onaral B, et al. Functional near-infrared neuroimaging. IEEE Trans Neural Syst Rehabil Eng. (2005) 13:153–9. doi: 10.1109/TNSRE.2005.847377
39. Chance B, Anday E, Nioka S, Zhou S, Hong L, Worden K, et al. A novel method for fast imaging of brain function, non-invasively, with light. Opt Express. (1998) 2:411–23. doi: 10.1364/OE.2.000411
40. Liu Y, Piazza EA, Simony E, Shewokis PA, Onaral B, Hasson U, et al. Measuring speaker-listener neural coupling with functional near infrared spectroscopy. Sci Rep. (2017) 7:43293. doi: 10.1038/srep43293
41. Cui X, Bray S, Reiss AL. Functional near infrared spectroscopy (NIRS) signal improvement based on negative correlation between oxygenated and deoxygenated hemoglobin dynamics. Neuroimage. (2010) 49:3039–46. doi: 10.1016/j.neuroimage.2009.11.050
42. Chen M, Blumen HM, Izzetoglu M, Holtzer R. Spatial coregistration of functional near-Infrared spectroscopy to brain MRI. J Neuroimaging. (2017) 27:453–60. doi: 10.1111/jon.12432
43. Huppert TJ. Commentary on the statistical properties of noise and its implication on general linear models in functional near-infrared spectroscopy. Neurophotonics. (2016) 3:010401. doi: 10.1117/1.NPh.3.1.010401
44. Santosa H, Zhai X, Fishburn F, Huppert TJ. The NIRS brain AnalyzIR toolbox. Algorithms. (2018) 11:73. doi: 10.3390/a11050073
45. Moran PAP. Notes on coinuous stochastic phenomena. Biometrika. (1950) 37:17–23. doi: 10.1093/biomet/37.1-2.17
46. Chen Y. On the four types of weight functions for spatial contiguity matrix. Lett Spat Resour Sci. (2012) 5:65–72. doi: 10.1007/s12076-011-0076-6
47. Murakami D, Yoshida T, Seya H, Griffith DA, Yamagata Y. A Moran coefficient-based mixed effects approach to investigate spatially varying relationships. Spat Stat. (2017) 19:68–89. doi: 10.1016/j.spasta.2016.12.001
48. Hoffman P, Jefferies E, Haffey A, Littlejohns T, Ralph MAL. Domain-specific control of semantic cognition: a dissociation within patients with semantic working memory deficits. Aphasiology. (2013) 27:740–64. doi: 10.1080/02687038.2012.751578
49. Fishburn FA, Norr ME, Medvedev AV, Vaidya CJ. Sensitivity of fNIRS to cognitive state and load. Front Hum Neurosci. (2014)8:76. doi: 10.3389/fnhum.2014.00076
50. Baker CM, Burks JD, Briggs RG, Conner AK, Glenn CA, Morgan JP, et al. A connectomic atlas of the human cerebrum-chapter 2: the lateral frontal lobe. Oper Neurosurg. (2018) 15(Suppl. 1):S10–74. doi: 10.1093/ons/opy254
51. Amyot F, Zimmermann T, Riley J, Kainerstorfer JM, Chernomordik V, Mooshagian E, et al. Normative database of judgment of complexity task with functional near infrared spectroscopy–application for TBI. Neuroimage. (2012) 60:879–83. doi: 10.1016/j.neuroimage.2012.01.104
Appendix
Stimuli Trained for P1 and P2
Keywords: fNIRS, prefrontal cortex activity, generalized linear model, spatial varying, Moran statistics, apraxia of speech
Citation: Johnson R, Matthews J, Diawara N and Carroll R (2020) Statistical Analysis of fNIRS Data: Consideration of Spatial Varying Coefficient Model of Prefrontal Cortex Activity Changes During Speech Motor Learning in Apraxia of Speech. Front. Appl. Math. Stat. 6:32. doi: 10.3389/fams.2020.00032
Received: 23 January 2020; Accepted: 10 July 2020;
Published: 24 September 2020.
Edited by:
Shao-Bo Lin, Xi'an Jiaotong University, ChinaReviewed by:
Anca Maria Hanea, The University of Melbourne, AustraliaJinshan Zeng, Jiangxi Normal University, China
Copyright © 2020 Johnson, Matthews, Diawara and Carroll. This is an open-access article distributed under the terms of the Creative Commons Attribution License (CC BY). The use, distribution or reproduction in other forums is permitted, provided the original author(s) and the copyright owner(s) are credited and that the original publication in this journal is cited, in accordance with accepted academic practice. No use, distribution or reproduction is permitted which does not comply with these terms.
*Correspondence: Norou Diawara, bmRpYXdhcmFAb2R1LmVkdQ==