 Omar El Deeb1,2*
- 1Faculty of Technology, Lebanese University, Aabey, Lebanon
- 2Department of Mathematics and Physics, Lebanese International University, Beirut, Lebanon
In this paper we study the spatial spread of the COVID-19 infection in Lebanon. We inspect the spreading of the daily new infections across the 26 administrative districts of the country, and implement the univariate Moran’s I statistics in order to analyze the tempo-spatial clustering of the infection in relation to various variables parameterized by adjacency, proximity, population, population density, poverty rate and poverty density. We find out that except for the poverty rate, the spread of the infection is clustered and associated to those parameters with varying magnitude for the time span between July (geographic adjacency and proximity) or August (population, population density and poverty density) through October. We also determine the temporal dynamics of geographic location of the mean center of new and cumulative infections since late March. The understanding of the spatial, demographic and geographic aspects of the disease spread over time allows for regionally and locally adjusted health policies and measures that would provide higher levels of social and health safety in the fight against the pandemic in Lebanon.
1 Introduction
The spread of COVID-19 pandemic has practically affected the entire planet, and created enormous challenges on every aspect of human life and organization, starting with the health sector and with far reaching consequences on the economy, education, sports, transportation and politics. Since the first cases were registered in Wuhan, China in December 2019 [1], the global spatial dynamics of the infection have been changing as the disease swiftly moved toward the West [2] into Europe then into the United States, South America, and eventually to the whole world, with nearly 38.1 million cases and 1.1 million deaths registered until October 12, 2020 [3].
Given the global geographic spread of the virus and the local wide spread in many countries, and the nature of the transmission of the virus, it is important to understand the spatial mechanisms of this spread and its dependence on proximity, demographics and social characteristics of infected areas. Spatial analysis provides a better understanding of the routes of transmission of infections [4], consequently, it allows the decision-makers to draft and implement effective health and mitigation measures to reduce risks associated with the pandemic.
In Lebanon, the first case was registered on February 21, 2020 [5] and by October 12, 54,624 cases and 466 deaths were registered [6]. The first few weeks witnessed a relatively rapid increase but it sharply declined as a result of the strong mitigation measures enforced by the beginning of March. The lift of the international travel ban and the partial easing of measures led to the revival of higher spread rates since July. Only 1,788 cases were registered by July 1, 2020 before a sharp rise from July through October. The cases were mainly concentrated in Beirut, its suburbs and its neighboring areas in Mount Lebanon. On August 4, a huge explosion rattled the port of Beirut and destroyed thousands of houses and buildings in the surrounding areas. People were rushed into hospitals, with thousands of injuries recorded on that day [7]. On such a horrible incident, hundreds of volunteers and civil defense teams were involved in rescue work for several days. The social distancing measures were largely neglected in such an emergency situation. The spread accelerated in the upcoming weeks, with sharp rise in Beirut and its surroundings and with a national widespread reaching all regions and major towns and cities [8].
Related Literature: Spatial autocorrelation is the statistical analysis of data studied in space or in space-time aiming for the identification and estimation of spatial processes [9, 10]. It has been implemented to study and analyze the spread of various diseases and infections including cancer, diabetes, SARS, influenza virus, COVID-19, etc. [11–14]. The concept of geographical spatial autocorrelation has been expanded into the study of clustering of infections, including that of the Coronavirus, among regions sharing similar (neighboring) demographic or social features [4, 15, 16]. Recent studies also inspected the effect of city size, population, transportation systems and demographics on the disease spread and its mortality rate [17–21]. The understanding of spatial spread dynamics is essential for drafting and implementing preventive measures in the fight against infectious diseases including the most recent spread of COVID-19 [22, 23].The determination of the mean center of a population (centroid) was discussed in Refs. [24–26] and extending the concept to the determination of the mean center of wealth and infections allowed for a spatial analysis of the temporal dynamics of wealth distribution, economic growth and infectious diseases [27]. The dynamics of the outbreak of COVID-19 in Lebanon and its reproduction number dynamics were studied in Refs. [28–31]. Recent publications explored other aspects of the spread in Lebanon on the preventive level [32] as well as on the level of psychological, pharmaceutical and mental needs and responses to face the consequences of the infection [33–35].
Despite the accelerating spread in Lebanon (see Figure 1), there are no relevant studies analyzing the spatial dynamics of the Coronavirus infections in the country. In this paper, we study the clustering and spatial progression of new infections in Lebanon by applying the methods of spatial autocorrelation with different model parameterizations of geographic, demographic and social variables including adjacency, proximity, population, population density, poverty rate and poverty density. Locating the mean center of the epidemic spread as a function of time is used to analyze the temporal geographic development of the spread. The methods used are general, but our current work is focused on spatial dynamics only in Lebanon. The paper has many novel aspects as it addresses and studies the spatial spread of COVID-19 in Lebanon covering the existing gap in current literature. It also introduces the analysis of spread in relation to social characteristics of infected regions by analyzing the effects of poverty rate and poverty density, and applies the concept of the mean center of infection on the spread of the Coronavirus. The obtained results provide a solid basis for the concerned policy makers to draw well-grounded and scientifically based local and regional measures that would contribute to controlling the infection spread in the country.
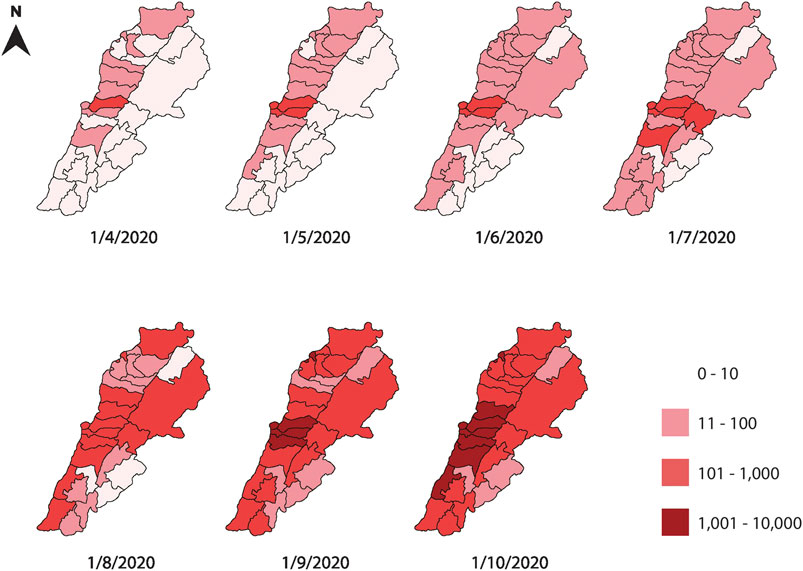
FIGURE 1. A monthly map of the regional cumulative number of infections in Lebanese districts between April and October 2020. The figure shows a time series of the infection spread, using a logarithmic scale to account for the rapid increase in the number of infections. The central neighboring districts of Beirut and Mount Lebanon are the most infected throughout the time span studied.
The paper is organized as follows: in section 2 we introduce the implemented analytic mathematical and statistical methods and tools. Results are presented and discussed in section 3, and section 4 concludes the paper.
2 Analytic Methods and Tools
2.1 Moran’s I Index
Moran’s I index is a univariate inferential statistic used to measure the spatial autocorrelation based both on locations and feature values simultaneously. It is defined as Ref. [9]:
where Wij represents different types of adjacency between region i and region j, corresponding to different models of infectious spread. N is the number of regions under consideration and Xi represents the number of new daily infections in district i.
The
where the expected value E[I] and the variance V[I] are defined in the Appendix. The z-score or the corresponding p-value of the statistic are used to reject the null hypothesis, eliminate the possibility of a random pattern leading to the obtained value of the Moran I statistic and ensuring the normality of the distribution under consideration.
2.1.1 Methodology
In this paper, we take a confidence level corresponding to
We consider a model with six different cases of parameterization of the adjacency matrix Wij corresponding to geographic adjacency (case I), proximity (case II), population (case III), population density (case IV), poverty rate (case V) and poverty density (case VI). The first four cases follow analogous parameterizations to those implemented in Refs. [4, 16], while cases V and VI introduce a new parameterization in order to inspect possible effects of poverty rate and poverty density on the viral spread. Table 1 summarizes relevant data from the Lebanese districts.
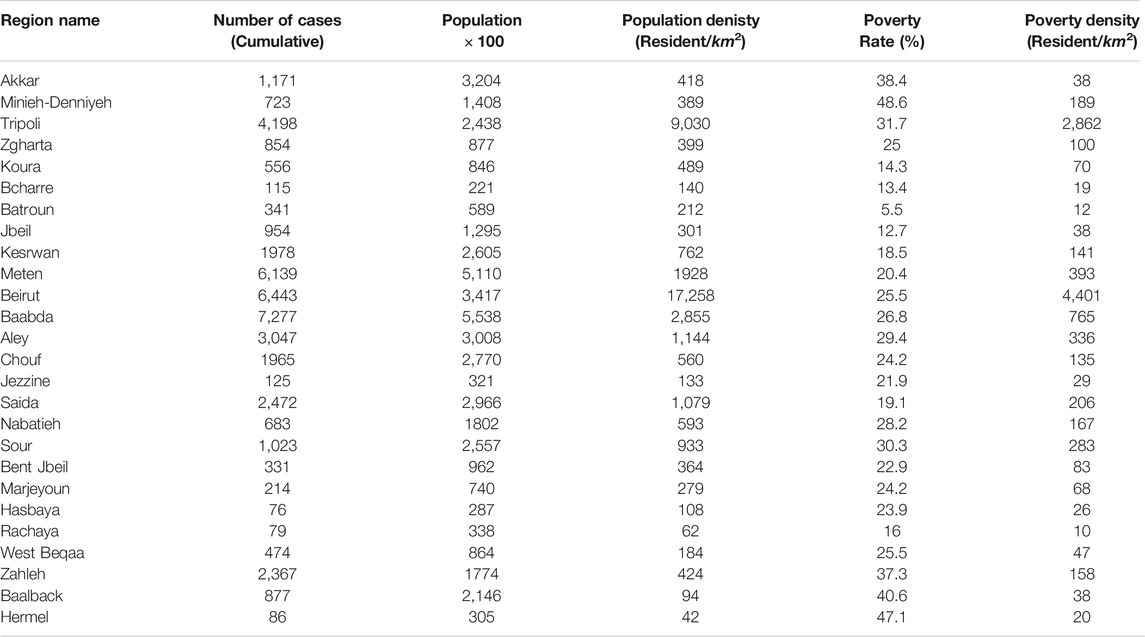
TABLE 1. The table shows the distribution of the cumulative number of cases among the 26 Lebanese districts on October 12, 2020, with their respective populations, population densities, poverty rates and poverty densities.
In case I, we take Wij = 1 for districts sharing common borders, and contributing to spatial spread, and Wij = 0 otherwise assuming that the spread does not occur directly between non-neighboring districts. In case II we determine
In case III and case IV, we analyze the effects of population and population density on the spread of the disease since the virus is carried by people and its spread is supposed to be related to their interaction. We sort the districts by the number of their residents (obtained from Ref. [36]) and then by the density of their residents relative to their areas, inspecting spread between districts according to similarities in their inhabitants’ number and density respectively. Using the sorted order of residents and densities, districts of consecutive number of residents and population densities are assigned a factor of Wij = 1, and Wij = 0 otherwise. This provides a statistic about the clustering of infections according to population and population density respectively.
Lastly, in cases V and VI, we introduce new parameters, namely the poverty rate and the poverty density in different districts and we analyze their effect on infection clustering. We sort the districts by their poverty rates and poverty density [36] and assign Wij = 1 for regions of consecutive order of poverty rate or poverty density, and Wij = 0 otherwise, in a similar methodology to cases III and IV in order to infer the effect of similarities in poverty rate and density on patterns of infection spread.
2.2 Mean Center of Infection
The mean center of infection (henceforth MCI) is a geographic location that represents the weighted mean of the positions of infected individuals on the surface of Earth, assumed to be spherical. Assigning the value of Earth’s radius to unity, the two spherical coordinates that determine the unique position of a point are its latitude
The Cartesian position vector
We denote the district number of infections (new or cumulative) by Xi as defined above, and the Cartesian positions of the administrative centers by (xi,yi,,zi). Then, the Cartesian position of the weighted mean of infections
As suggested by Ref. [24], the precise position on the surface of a sphere can be determined from the normalized position vector defined by
Consequently, we can recover the spherical position of the mean center of infections by calculating the mean latitude and longitude as:
The latitude and the longitude can be located and plotted on maps and geographic information systems. We employ the spherical coordinates of geographic locations of the capitals of the 26 administrative districts in Lebanon and the number of daily and cumulative infections in each region in order to determine the daily MCI accordingly. This provides a tool to analyze the temporal dynamics of the mean geographic spread of the disease.
3 Results and Discussions
The determination of the Moran’s I index and its corresponding p-value for the effect of adjacency and proximity of cases I and II on the clustering of daily new infections of COVID-19 in Lebanon shown in Figure 2, leads to the conclusion that since July 2020, there is strong clustering of infections in regions sharing common borders and among nearer regions. There were only few days when new infections were not clustered in adjacent regions, and only one day where distance was not shown to be a detrimental effect in the spatial spread of new cases. The maximum value of Moran’s I reached 0.660 for case I and 0.380 for case II indicating a high level of geographic clustering of the disease spread since July. The infections before July had a high p-value, indicating a high probability for random geographic spread.
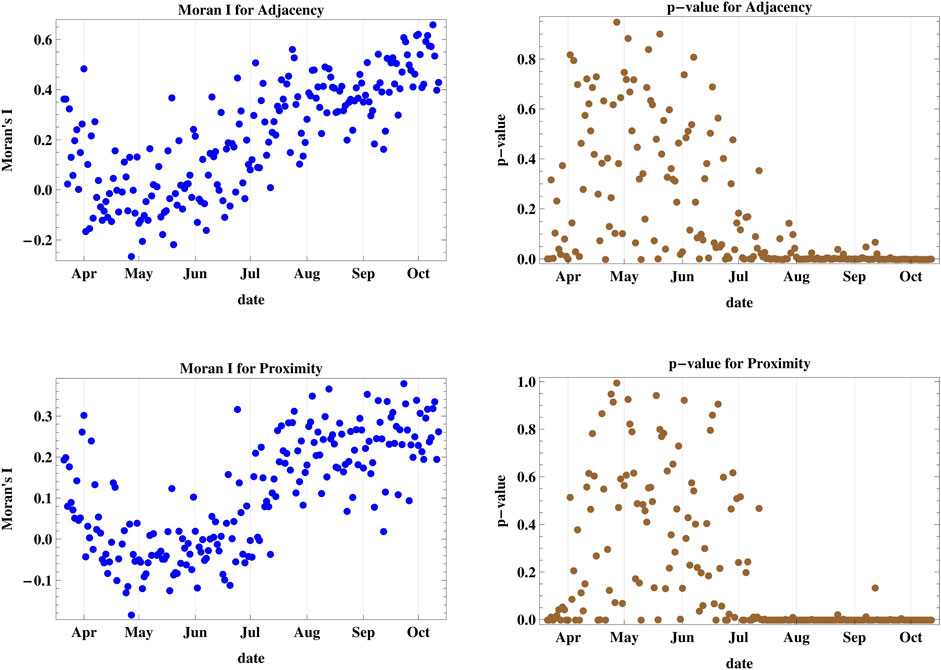
FIGURE 2. The figure shows Moran’s I index and its corresponding p-value for cases I and II accounting for adjacency and proximity of new infections registered in Lebanese districts. Since July, there is a strong clustering of daily infections in regions sharing common borders and among nearer regions.
The results of the spatial spread dynamics in relation to population and population density adjacency as shown in Moran’s I and p-value of cases III and IV depicted in Figure 3 reveal that the spread was not clustered with respect to the regional population until late August 2020, where it started achieving a positive value of I with p < 0.05 indicating spatial clustering between regions of adjacent population rank, with several days showing a probability of random spread. The maximum attained I was 0.666. However, the statistics for districts with adjacent rank of population density show very strong spatial clustering since the middle of August with I attaining a maximum value of 0.832, which is the highest among all six studied cases.
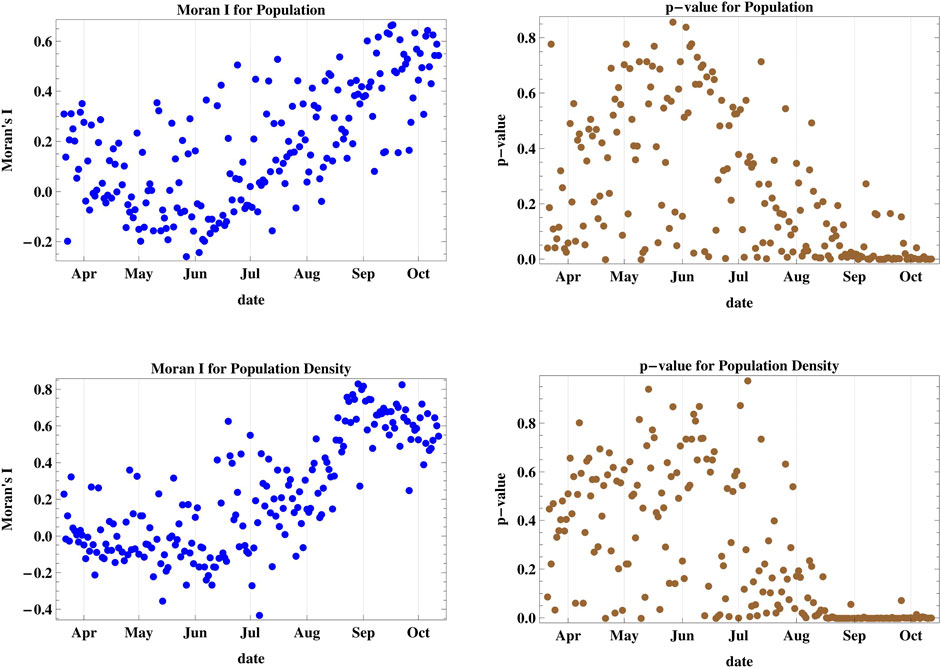
FIGURE 3. Moran’s I index and its corresponding p-value for cases III and IV accounting for population and population density of different districts. The daily spread was not clustered with respect to district population and density until late August 2020, where it started achieving strong spatial clustering between districts of adjacent population ranks.
The results of case V (Figure 4) show that the spatial spread cannot be attributed to adjacent ranking of poverty rates among the districts since the p-values remain above the 5% level of confidence up until October 2020, hence no spatial clustering occurs. But when we consider the poverty density in case VI, we obtain positive values for Moran’s I since the end of August, with p < 0.05 except for five days. Hence, spatial clustering among regions with adjacent ranking of poverty density occurs. The maximum attained I in this case is 0.666.
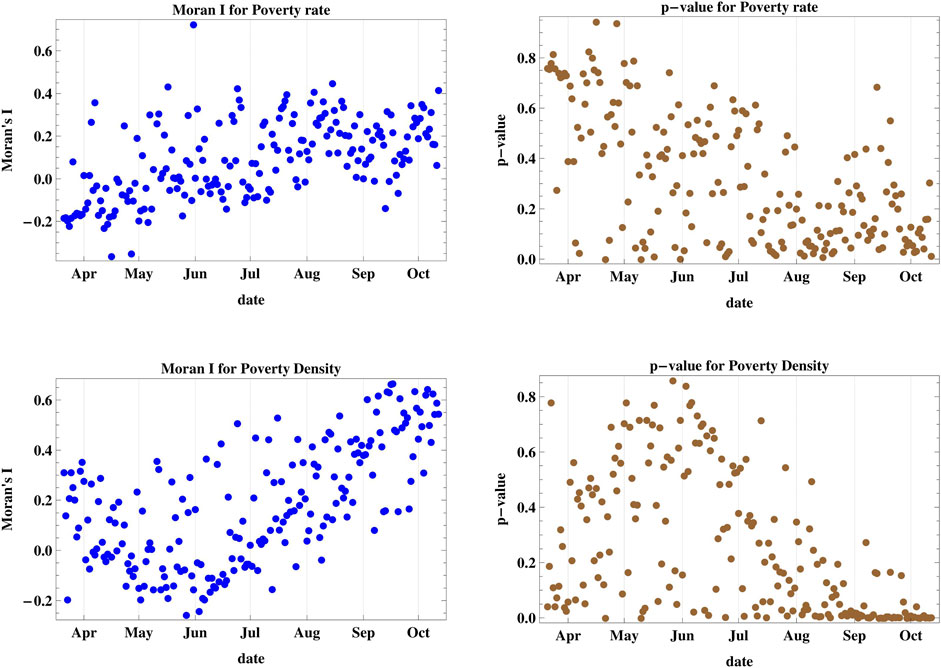
FIGURE 4. Moran’s I index and its corresponding p-value for cases V and VI accounting for regional poverty rate and poverty density. The poverty rate is not a decisive factor for spatial spread but when we consider the poverty density, we obtain spatial clustering starting on the end of August.
In comparison, we find out that clustering of new infections occurs starting on different dates between July and August for all considered cases except for case V corresponding to district populations. The strongest level of spatial clustering (highest I) occurs for model IV of population density after mid-August, while clustering associated to geographic adjacency and proximity (cases I and II) has the longest time span (since early July) and the highest levels of confidence.
By construction, spatial autocorrelation and its corresponding Moran’s I index are defined in terms of univariate data observations [10, 38, 39]. Multivariate spatial analysis implies a compromise between multivariate analysis (relations among variables) and autocorrelation (spatial structure) [40, 41], and it was not employed in the context of this work, which was based on Moran’s univariate statistics.
The location of the MCI was determined as a function of time as shown in Figure 5. The mean latitude and longitude of the infection were determined according to the methods described in Equation 6. The location of the cumulative MCI is plotted on the geographic map of Lebanon during the same period in Figure 6, together with the mean center of population of the country. It started near the city of Jounieh, north-west of the mean center of population, but it has moved southward since May through August, where it started moving northward again. The location of the MCI of new infections was quite geographically distributed before July as the lower plot of Figure 5 shows, before becoming more homogenous afterward.
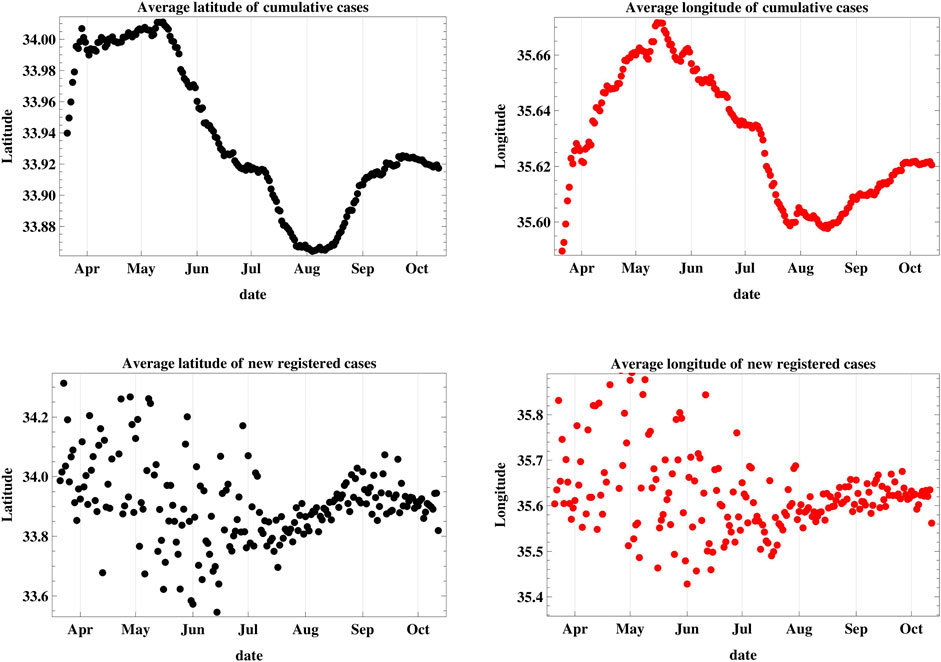
FIGURE 5. This figure is a plot of the latitude and longitude of the weighted geographic center of COVID-19 infections in Lebanon. The upper graphs represent the temporal progression of the cumulative number of infections while the lower graphs represent that of the new daily cases.
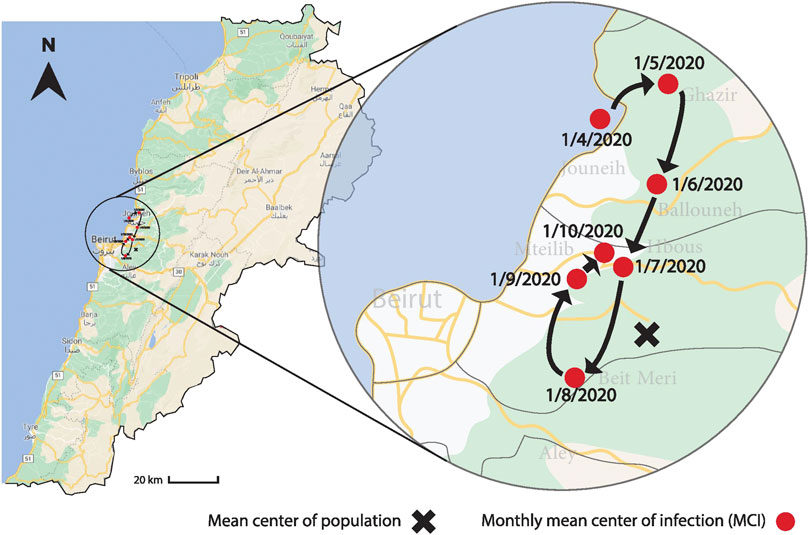
FIGURE 6. The figure shows the variation of the geographic location of the MCI on a monthly basis between April 1 and October 1, 2020, together with the mean center of the population. The MCI started near the city of Jounieh, north-west of the mean center of population, but it has moved southward since May until August, when it started moving northward again.
The reproduction number R (which has maintained a relatively high rate in Lebanon since June [28, 29]) and the rate of the infection spread correlate with people’s mobility [42]. Geographic clustering occurs because people’s motion and local travel is higher in their close neighborhoods, especially in a country like Lebanon where with the absence of national public transportation throughout the country [43] diminishes nationwide mobility. Higher levels of social interaction among people in dense regions also contribute to the spread of the disease, and this has shown the strongest clustering effect.
In this study, we employed Moran’s I statistics with various parameterizations, in addition to the mean center of infection which is a measure of the centrality of the infections, with its dynamic temporal changes. The two approaches are complementary, and allow us to visualize the dynamics of spread, with its temporal geographical clustering characteristics. In addition, spatial autocorrelation provides unique information about demographic and social characterization of the spread.
Our statistical tests and results correspond to the number of registered cases, which might differ from the actual infections in case of under-reporting, under-testing or in case of asymptomatic infections.
4 Conclusion
In this paper we introduced the Moran’s I index with its associated z-score and p-value to study the spatial autocorrelation of registered new infections of COVID-19 in Lebanon. We introduced six different cases of parameterization of the spread related to adjacency, proximity, population, population density, poverty rate and poverty density. We discovered that poverty rate is not statistically relevant to the spatial spread of the disease while geographic bordering, distance between district centers, number and density of residents and poverty density lead to clustering of the disease, with varying strengths and level of confidence since July and August through October. We also introduced methods to determine the geographic coordinates of the mean center of the infection, and determined this center since April 2020, and plotted its variations over time up until October.
One of the major limitations that prohibit a more detailed analysis is the public unavailability of data on the municipal or sub-district level that would allow a more detailed spatial analysis, and consequently more locally-specific policies and measures to slow down its spread.
The study of the spread of the infection allows relevant authorities to draw appropriate country-specific and regional measures to curb the spread. The understanding of the spatial, demographic and geographic aspects of the disease spread over time provides an essential basis for to take more efficient decisions of local and inter and intra-regional measures, thus contributing to increased social and health safety and security in the fight against the pandemic.
Data Availability Statement
The raw data supporting the conclusions of this article will be made available by the author, without undue reservation.
Author Contributions
The author confirms being the sole contributor of this work and has approved it for publication.
Conflict of Interest
The author declares that the research was conducted in the absence of any commercial or financial relationships that could be construed as a potential conflict of interest.
Appendix
The expected value of Moran’s I statistic is given by:
while its variance is defined as:
where
and A and B are given by:
consequently, the
References
1.World Health Organization Archived: WHO timeline - COVID-19, World Health Organization (2020). Available from: https://www.who.int/news-room/detail/27-04-2020-who-timeline—covid-19 (Accessed October 10, 2020).
2. Mathys, N, and Grether, J A plague rushing to the West: the Coronavirus center of gravity. CCG (2020).
3.Worldometer COVID-19 coronavirus pandemic 2020. Worldometer (2020). Available from: worldometers.info/coronavirus (Accessed October 11, 2020).
4. Meng, B, Wang, J, Liu, J, Wu, J, and Zhong, E. Understanding the spatial diffusion process of severe acute respiratory syndrome in Beijing. Publ Health (2005). 119:1080–87. doi:10.1016/j.puhe.2005.02.003
5.Ministry of Public Health COVID-19 Coronavirus disease 2019. Republic of Lebanon: Ministry of Public Health (2020). Available from: https://www.moph.gov.lb/ar/DynamicPages/index/2.
6.Lebanese Government Disaster risk management unit (2020). Available from: http://drm.pcm.gov.lb (Accessed October 12, 2020).
7.BBC News Beirut explosion: what we know so far. BBC News (2020). Available from: https://www.bbc.com/news/world-middle-east-53668493 (Accessed September 25, 2020).
8. Aridi, R. Absolutely horrendous.” Scientists discuss Beirut’s blast and how they are coping with its aftermath. Science (2020). [Epub ahead of print]. doi:10.1126/science.abe6531
11. Glick, B. The spatial autocorrelation of cancer mortality. Soc Sci Med Med Geogr (1979). 13:123–30. doi:10.1016/0160-8002(79)90058-3
12. Hipp, JA, and Chalise, N. Spatial analysis and correlates of county-level diabetes prevalence, 2009–2010. Prev Chronic Dis (2015). 12:140404. doi:10.5888/pcd12.140404
13. Lai, P, Wong, C, Hedley, A, Lo, SV, Leung, PY, Kong, J, et al. Understanding the spatial clustering of severe acute respiratory syndrome (SARS) in Hong Kong. Environ Health Perspect (2004). 112:1550–6. doi:10.1289/ehp.7117
14. Stark, J, Sharma, R, Ostroff, S, Cummings, DA, Ermentrout, B, Stebbins, S, et al. Local spatial and temporal processes of influenza in Pennsylvania, United States: 2003–2009. PloS One (2012). 7:e34245. doi:10.1371/journal.pone.0034245
15. Alkhamis, M, Al Youha, S, Khajah, M, Ben Haider, N, Alhardan, S, Nabeel, A, et al. Spatiotemporal dynamics of the COVID-19 pandemic in the State of Kuwait. Int J Infect Dis (2020). 98:153–60. doi:10.1016/j.ijid.2020.06.078
16. Kang, D, Choi, H, Kim, J-H, and Choi, J. Spatial epidemic dynamics of the COVID-19 outbreak in China. Int J Infect Dis (2020). 94:96–102. doi:10.1016/j.ijid.2020.03.076
17. Ribeiro, H, Sunahara, A, Sutton, J, Perc, M, and Hanley, QS. City size and the spreading of COVID-19 in Brazil. PloS One (2020). 15(9):e0239699. doi:10.1371/journal.pone.0239699
18. Li, X, Zhou, L, Jia, T, Peng, R, Fu, X, Zou, Y, et al. Associating COVID-19 severity with urban factors: a case study of Wuhan. Int J Environ Res Publ Health (2020). 17(18):6712. doi:10.3390/ijerph17186712
19. Xie, Z, Qin, Y, Li, Y, Shen, W, Zheng, Z, Liu, S, et al. Spatial and temporal differentiation of COVID-19 epidemic spread in mainland China and its influencing factors. Sci Total Environ (2020). 744:140929. doi:10.1016/j.scitotenv.2020.140929
20. Carteni, A, Di Francesco, L, and Martino, M. The role of transport accessibility within the spread of the Coronavirus pandemic in Italy. Saf Sci (2021). 133:104999. doi:10.1016/j.ssci.2020.104999
21. Sangiorgio, V, and Parisi, F. A multicriteria approach for risk assessment of Covid-19 in urban district lockdown. Saf Sci (2020). 130:104862. doi:10.1016/j.ssci.2020.104862
22. Zhou, C, Su, F, Pei, T, Zhang, A, Du, Y, Luo, B, et al. COVID-19: challenges to GIS with big data, Geogr Sustainability (2020). 1(1):77–87. doi:10.1016/j.geosus.2020.03.005
23. Li, H, Li, H, Ding, Z, Hu, Z, Chen, F, Wang, K, et al. Spatial statistical analysis of coronavirus disease 2019 (Covid-19) in China. Geospat Health (2020). 15(1):867. doi:10.4081/gh.2020.867
24. Aboufadel, E, and Austin, D. A new method for computing the mean center of population of the United States. Prof Geogr (2006). 58:65–9. doi:10.1111/j.1467-9272.2006.00512.x
25. Bachi, R. New methods of geostatistical analysis and graphical presentation. New York: Kluwer (1999).
26. Barmore, FE. Where are we? Comments on the concept of “Center of Population”. Wisconsin Geogr (1991). 7:40–50.
27. Grether, JM, and Mathys, N. Is the world’s economic centre of gravity already in Asia?. Area (2010). 42(1):47–50. doi:10.1111/j.1475-4762.2009.00895.x
28. El Deeb, O, and Jalloul, M. The dynamics of COVID-19 spread: evidence from Lebanon. Math Biosci Eng (2020). 17(5):5618–32. doi:10.3934/mbe.2020302
29. El Deeb, O, and Jalloul, M. Forecasting the outbreak of COVID-19 in Lebanon (2020). medRxiv. doi:10.1101/2020.09.03.20187880
30. Mourad, A, and Mroue, F. Modeling and simulation of the spread of coronavirus disease (COVID-19) in Lebanon (2020). arXiv. 2008.03264.
31. Kharroubi, S. Modeling the spread of COVID-19 in Lebanon: a bayesian perspective. Front. Appl. Math. Stat (2020). 6:40. doi:10.3389/fams.2020.00040
32. Kabakian-Khasholian, T, Makhoul, J, and Bardus, M. To wear or not to wear a mask in the COVID-19 era? The broken bridge between recommendations and implementation in Lebanon. J. Glob. Health (2020). 10(2):020311. doi:10.7189/jogh.10.020311
33. Khoury, B, Khoury, J, and Ammar, J. Psychological needs and response during the COVID-19 pandemic in Lebanon. Psychol Trauma (2020). 12(5):497–8. doi:10.1037/tra0000757
34. Chammay, R, and Roberts, B. Using COVID-19 responses to help strengthen the mental health system in Lebanon. Psychol Trauma (2020). 12 (Suppl. 1):S281–3. doi:10.1037/tra0000732
35. Zeenny, R, Ramia, E, Akiki, Y, Hallit, S, and Salameh, P. Assessing knowledge, attitude, practice, and preparedness of hospital pharmacists in Lebanon towards COVID-19 pandemic: a cross-sectional study. J Pharm Policy Pract (2020). 13:54. doi:10.1186/s40545-020-00266-8
36.Labour Force and Household Living Conditions Survey 2018-2019 Lebanon: All Publications, Central Administration of Statistics (2020). Available from: http://www.cas.gov.lb/index.php/all-publications-en (Accessed October 2, 2020).
38. Moran, P. The interpretation of statistical maps. J Roy Stat Soc B (1948). 10:243–51. 10.1111/j.2517-6161.1948.tb00012.x
39. Moran, P. Notes on continuous stochastic phenomena. Biometrika (1950). 37:17–23. doi:10.1093/biomet/37.1-2.17
40. Wartenberg, D. Multivariate spatial correlation: a method for exploratory geographical analysis. Geogr Anal (1985). 17(4):263–83. doi:10.1111/j.1538-4632.1985.tb00849.x
41. Dray, S, Said, S, and Debias, F. Spatial ordination of vegetation data using a generalization of Wartenberg’s multivariate spatial correlation. J Veg Sci (2008). 19(1):45–56. doi:10.3170/2007-8-18312
42. Santamaria, C, Sermi, F, Spyratos, S, Iacus, SM, Annunziato, A, et al. Measuring the impact of COVID-19 confinement measures on human mobility using mobile positioning data. A European regional analysis. Saf Sci (2020). 132:104925. doi:10.1016/j.ssci.2020.104925
Keywords: COVID-19, spatial autocorrelation, mean center of infection, Lebanon, mathematical modelling
Citation: El Deeb O (2021) Spatial Autocorrelation and the Dynamics of the Mean Center of COVID-19 Infections in Lebanon. Front. Appl. Math. Stat. 6:620064. doi: 10.3389/fams.2020.620064
Received: 21 October 2020; Accepted: 23 November 2020;
Published: 13 January 2021.
Edited by:
Magdalena Klimczuk-Kochańska, University of Warsaw, PolandReviewed by:
David Alfredo Medina Ortiz, University of Chile, ChileCheng-Fang Yen, Kaohsiung Medical University, Taiwan
Chaosheng Zhang, National University of Ireland Galway, Ireland
Marieme Ngom, Argonne National Laboratory (DOE), United States
Copyright © 2021 El Deeb. This is an open-access article distributed under the terms of the Creative Commons Attribution License (CC BY). The use, distribution or reproduction in other forums is permitted, provided the original author(s) and the copyright owner(s) are credited and that the original publication in this journal is cited, in accordance with accepted academic practice. No use, distribution or reproduction is permitted which does not comply with these terms.
*Correspondence: Omar El Deeb, b21hci5kZWViQGxpdS5lZHUubGI=