 Salman Hussain Raza
 Bibhya Nand Sharma
 Kaylash Chaudhary
- School of Computing, Information and Mathematical Sciences, The University of the South Pacific, Suva, Fiji
While the recent technological advancements have enabled instructors to deliver mathematical concepts and theories beyond the physical boundaries innovatively and interactively, poor performance and low success rate in mathematic courses have always been a major concern of educators. More specifically, in an online learning environment, where students are not physically present in the classroom and access course materials over the network, it is toilsome for course coordinators to track and monitor every student’s academic learning and experiences. Thus, automated student performance monitoring is indispensable since it is easy for online students, especially those underperforming, to be “out of sight,” hence getting derailed and off-track. Since student learning and performance are evolving over time, it is reasonable to consider student performance monitoring as a time-series problem and implement a time-series predictive model to forecast students’ educational progress and achievement. This research paper presents a case study from a higher education institute where interaction data and course achievement of a previously offered online course are used to develop a time-series predictive model using a Long Short-Term Memory network, a special kind of Recurrent Neural Network architecture. The proposed model makes predictions of student status at any given time of the semester by examining the trend or pattern learned in the previous events. The model reported an average classification accuracy of 86 and 84% with the training dataset and testing dataset, respectively. The proposed model is trialed on selected online math courses with exciting yet dissimilar trends recorded.
Introduction
Students are the main stakeholders in any educational institute [1, 2] and their academic excellence determines the extent to which they have achieved their academic goals [3–5]. While educational institutes are responsible for providing a conducive learning environment and effective support services for their students, they are invariably accountable for their students’ performance. As a result, the educators are made responsible for ensuring every student’s achievement and success and providing additional support to students at risk of academic failure [6, 7]. Thus, educators and, more recently, the administrators of educational institutes continuously monitor and track students’ performance to evaluate the effectiveness of their teaching and learning practices and add timely support interventions for students to succeed. In other words, effective student progress and performance monitoring assist institutions and educators in determining students’ proficiency and growth throughout their academic journey, derive reasonable conclusions for decision making [2, 7–10] and identify and support those who require extra assistance to succeed [7, 11]. Nonetheless, the students’ performance concerns the educators and administrators and the industry seeking quality graduates who contribute to the country’s social and economic growth [1, 2]. Hence, academic progress and achievement monitoring is a critical component of modern education and student support services.
Traditionally, instructors rely on curriculum-based measurements which are the most validated form of student progress monitoring [12–15]. It consists of standard assessments for evaluating the learning of individual students, for measuring the extent to which learners have demonstrated the intended learning, and for identifying low performing students who may require additional support to improve their performance. This type of progress monitoring is widely adopted across educational institutes because student learning is an ongoing process and evidence of achievement is visible over time through assessments. However, earlier studies indicate that diversified academic and non-academic factors influence the students’ academic performance, such as demographic characteristics, family backgrounds, socio-economic status, psychological factors, previous academic and social experiences, educational environment and engagements [8, 10, 16–19]. Therefore, the contemporary educators are challenged to efficiently monitor student progress while considering their personal attributes and engagements and other factors affecting their success, irrespective of the modality of the courses and programs.
Student performance monitoring is more critical in an online environment than face-to-face settings when addressing issues such as tracking underperforming students and planning timely interventions for controlling the risk of student dropouts. However, identifying and tracking at-risk learners in online learning space is a tedious and challenging task. While online learning extends educational opportunities beyond the physical locations offering more flexibility at a lower cost, the asynchronous instructor-to-student setup imposes difficult and possibly unpleasant challenges for virtual educators to monitor and assess online students’ progress and performance. Thus, in such a learning context, educators consider a variety of other parameters, including participation and engagements, to make an appropriate judgment about the learner’s performance.
Moreover, during the recent COVID-19 pandemic, local and international health authorities in most countriesannounced a temporary closure of schools and universities to control the virus’s spread to the wider community, affecting more than 300 million students worldwide [20, 21]. Schools and universities have witnessed similar educational disruptions previously at the time of natural disasters and epidemics; however, not to such an extent where 90 percent of the world’s student population is affected [22]. Unlike in the past, technological advancements and availability of distance and online learning options have supported schools and universities to mitigate the impact of closures and lockdowns by continuing education remotely. Nonetheless, the sudden change in the learning environment may have been difficult and challenging for students who have not previously experienced online learning. Therefore, demanding effective progress and performance monitoring to track these students and assisting them with additional support services.
In the past, technological advancements and computational intelligence applications in higher education have helped educators identify underperforming students at an early stage of the course [1, 2, 7, 8, 23, 24]. Artificial Intelligence (AI) has enabled the HEI to gain a competitive advantage of monitoring and assessing students efficiently and conveniently [23–25]. Previously, data mining and machine learning techniques have also been used to provide predictive analytics regarding the ’students’ performance and facilitate more meaningful pedagogical analysis for stakeholders. Nonetheless, recently, there has been an increasing interest in studying the student performance as a time-series problem [26–28]. This is because student learning and engagement are ongoing, and student performance is evolving. Hence, student performance monitoring can be considered a time-series problem. Students’ performance at any given time in a series depends on all the previous events in the series, and computational intelligence could be utilized to forecast students’ performance in real-time.
The recent work in the literature presented a motivation to consider the interaction data and course achievement of online courses offered at an HEI in the South Pacific region and develop a time-series predictive model to make predictions regarding the students’ status at any given time interval. The model implemented in this research is based on Long Short-Term Memory (LSTM) network, a special kind of Recurrent Neural Network (RNN) architecture. This research verifies and validates LSTM network’s potential to identify and support students who are at-risk of either failing a course or dropping out of online courses.
This paper’s structure is as follows: Related Work documents and discusses the related work from the literature. Methodology describes the research data and methods applied to this research. Experimental results are discussed in Results and Discussion, followed by a conclusion in References.
Related Work
Researchers have previously explored the combinations of data mining and AI techniques to discover useful knowledge from educational repositories and derive predictive patterns for informed decision-making. Luan [29] reported the potential of data mining in higher education and explained how data mining enables educational institutions to uncover hidden trends and patterns to gain intrinsic knowledge about students and predict the likelihood of various outcomes, including persistence, retention, course success, and similar characteristics. It was concluded that data-driven understanding could provide greater transparency and accountability of resources, while proactively monitoring student outcomes. Likewise, a white paper by Noel-levitz [30] documented the history of predictive modeling in student recruitment, marketing, student retention, and strategic enrollment management. The paper concluded that data mining techniques used to study prospective students’ behavior allow colleges and universities to shape their enrolments more precisely.
The student data are also explored to study various aspects of student persistence and retention in higher education. Yu et al. [16] studied the factors affecting student retention using classification trees, multivariate adaptive regression splines (MARS), and neural networks. The enrolments and withdrawal of 6690 students at Arizona State University were compiled and mined to extract patterns and relationships in the given data. Similarly, Kovačić [31] in his study examined the socio-demographic variables (age, gender, ethnicity, education, work status, and disability) and study environment (course program and course block) that may influence persistence or dropout of students at the Open Polytechnic of New Zealand. Data mining techniques (such as feature selection and classification trees) were applied on a sample of 450 students enrolled in a specific course from 2006 to 2009.
Ma et al. [32] developed a data mining application for the Ministry of Education in Singapore to identify weak students who require further academic assistance. The researchers argued that student selection for remedial classes based on a cut-off mark is inefficient and undesirable for both students and educators. They presented SBA (Scoring Based on Associations) technique to precisely identify underperforming learners. Similarly, Ramaswami and Bhaskaran [33] designed a data mining model to identify the slow learners and the factors influencing their academic performance. The data of 772 students from five different Tamil Nadu schools were collected and used to construct a prediction model. The model reported satisfactory accuracy and concluded that medium of instruction, marks obtained in secondary education, school location, living area, and type of secondary education as the strongest performance indicators.
Cortez and Silva [17] applied four data mining algorithms - Decision Trees, Random Forest, Neural Networks and Support Vector Machines to predict student failure in the Mathematics and the Portuguese language courses offered to secondary school students in Alentejo region of Portugal. The 788 students’ data were collected and processed to derive 33 input variables concerning student grades, demographic, social and school-related characteristics. The explanatory analysis confirmed that student achievement was highly affected by past evaluations. Similarly, Kotsiantis et al. [34] examined the usage of machine learning techniques in distance learning for dropout prediction. The research compared the prediction accuracy of six commonly used machine learning techniques: Naive Bayes (NB) algorithm, Instance-Based Learning algorithm, Decision Trees, Neural Networks, Logistic Regression and Support Vector Machines. The comparison showed that NB algorithms had the highest prediction accuracy in recognizing at-risk students based on demographic characteristics. Also, the case study presented by Dekker et al. [35] focused on predicting students’ dropout and success-factors in an Electrical Engineering program offered at Eindhoven University of Technology. The study reported accuracies between 75 and 80%.
Bharadwaj and Pal [36] applied Decision Tree technique to evaluate and analyze the academic performance of 50 students enrolled in the Master of Computer Applications program offered at Veer Bahadur Singh Purvanchal University. The data variables used for this study included “Previous Semester Marks,” “Class Test Grade,” “Seminar Performance,” “Assignments,” “General Proficiency,” “Attendance,” “Lab Work” and “End Semester Marks.” A decision tree was constructed by ID3 decision tree learning algorithm and used to classify students based on the IF-THEN rules. The rationale for this research work was to correctly classify students and identify learners who require additional assistance to succeed.
Kabakchieva [37] published the methodology and results of a data mining project implemented at the University of National and World Economy, in Bulgaria. The project was initiated to discover knowledge from the available student data to support university management in marketing and development strategies. The research dataset contained 10,330 students’ records, each described by 14 attributes, including age, gender, place and profile of previous education, final secondary education score, university admission year, and achieved admission score. Six different classification algorithms–namely a common decision tree algorithm C4.5 (J48), a Naïve Bayes classifier, a Bayes Network classifier, a k-Nearest Neighbor algorithm (IBk), a OneR classifier and a JRip classifier–were applied to categorize the students into the five distinct classes (categories) – “excellent,” “very good,” “good,” “average” and “bad. The classification accuracy varied between 52 and 67%.
Oladokun et al. [25] offered a prediction tool for estimating the likely performance of a candidate seeking admission into a university of Ibadan. The tool used Artificial Neural Network (ANN), which was trained using previously graduated engineering students’ data. The tool was tested and evaluated for 112 students and achieved an accuracy of over 74%. Similarly, Kongsakun and Fung [38] presented an Intelligent Recommendation System for universities in Thailand to investigate possible associations between the students’ historical records and final results. The proposed system was designed to help counsellors provide appropriate academic advising to students, thereby increasing their chances of success. This recommendation system was trained and tested with the dataset of 3,550 student records and reported reasonable accuracy with the average mean absolute error of 0.142. In another related study, Livieris et al. [24] designed and implemented a software tool for predicting the students’ performance in a Mathematics course at Lyceum University in Greece. The software was based on a neural network classifier and allowed educators to identify students who were likely to have low achievements. The neural network trained using the dataset of 279 records reported an average accuracy of 73.5 percent.
In a more recent work, Okubo et al. [28] proposed a method for predicting learners’ final grades by using a variant of the neural network, called Recurrent Neural Network (RNN). The researchers used the learning log of 108 students registered for “Information Science” course at Kyushu University. The results from RNN were compared with multiple regression analysis and showed a prediction accuracy of above 90 percent in the early weeks of course progression. Later, the researchers published another paper [27], where the RNN model was used to predict grades for 937 students from six courses led by two different teachers and presented ways to identify important learning activities to achieve a specific final grade. Similarly, Liu [26] presented a model based on RNN-LSTMs for predicting learning status in open online course resources. This research data includes the back-end records of six courses provided by the Chinese University MOOCs Platform. The research also explained how clickstream data can be treated as time-series data and how it can be explored to study students’ learning behavior. Researchers reported an average accuracy of 90% for their RNN-LSTM model.
Furthermore, the University of the South Pacific (USP) has also implemented an Early Warning System (EWS) plugin on Moodle to allow students to self-monitor their progress during the semester [7]. It is an interaction-based monitoring tool that reports the students’ academic performance by considering behavioral (interaction and participation) data accumulated in the Learning Management System (LMS). A variant of EWS demonstrated by Singh [39] uses a machine learning technique on accumulated interaction logs and predictions regarding students’ academic performance. The tool successfully identified students at risk of failing a course in real-time and was marked as an effective and efficient tool compared to the traditional practice of generating mid-semester reports for each course.
Methodology
Research Settings
This research was conducted at the the University of the South Pacific (USP), which is a multi-modal, multi-cultural and multi-campus higher education institution comprising of a vibrant and culturally diverse community of staff and students from its 12 member countries: Cook Islands, Fiji, Kiribati, Marshall Islands, Nauru, Niue, Samoa, Solomon Islands, Tokelau, Tonga, Tuvalu and Vanuatu, spreads across 33 million square kilometres of ocean. Since its establishment in 1968, USP has produced more than 50,000 graduates and has awarded more than 70,000 qualifications [40], thus empowering Pacific Islanders with knowledge and skills in various disciplines and enabling them to contribute to lead cohesive, resilient and sustainable communities in the region. An ethical clearance was attained from the University Research Ethics Committee to conduct this research.
Problem Statement
The problem studied in this research is a classification and forecasting one. A particular student is predicted to be in an at-risk or not an at-risk category. Among the several ways to address this problem, including some statistical methods and machine learning techniques, studies consider the understudied classification and prediction problem as a time-series classification and prediction problem [26–28]. This research also abstracts the given problem as a time-series problem. It constructs the prediction model by transforming the student interaction and course achievement data into time-dependent sequential data.
A time-series is a series of events indexed in successive order. Any variable that changes over time can be considered as a time-series attribute [40]. A time-series classification and prediction problem is when the past observation of a series and associated patterns is examined to predict future values for the series. In a nutshell, it is an act of predicting upcoming events by understanding the past [41]. Hence, it is reasonable to consider the student performance data as a time-series data as it is evolving and performance monitoring as a time-series problem where the performance status at any stage depends on the previous observations in the series. For this case study, a week is regarded as a time-step and activities offered in any week are the particular week’s features.
Definition of Student’s Status
A student’s status in a course is defined by “whether a student will perform well and is likely to pass the course in the exam week?”. Since the primary focus is to predict whether a student is likely to succeed in the exam week and to assign him/her a respective label, a student’s status is encoded as a binary value i.e., a student will be an underperforming student or is likely to succeed. Both of these statuses are determined based on the trend observed in the given sequences. The binary labels are referred to as
Environment Setup
The open-source Anaconda Distribution is used to develop, train and test the LSTM model. The platform includes pre-installed libraries and packages related to data science. It enables researchers to quickly manage libraries, dependencies, and environments to perform machine learning, data processing and predictive analytics on a single machine. The presented model is coded using python programming, a high-level, general-purpose programming language widely used for implementing machine learning algorithms. The code is compiled and executed using the TensorFlow framework and Keras library. TensorFlow is a core open-source library, provided by Google to assist in building and deploying the ML models whereas, Keras is the high-level neural network API that runs on top of TensorFlow, enabling easy and fast prototyping [42]. Results are plotted using a Matplotlib plotting library.
Data Collection
Initially, interaction logs and course achievements of students enrolled in one of the most recent offerings of the online computer literacy course (UU100) at USP were utilized for training, validating and testing the model. Interaction logs were mined in the Moodle system, recording every click a user makes while navigating through the course shell. Course achievements were also available through the Moodle marksheet. This particular course was accessed by a total of 2,412 users, out of which 2,380 were students and the remaining 32 users were course designers, teaching staff, mentors and the course coordinator. The Moodle system mined approximately 50 million interactions (49,912,313 records) of all users. For every week in a semester, a simple SQL query was executed to filter and extract the collective number of interactions made by every student with available Moodle components. For each user, interaction logs were grouped and counted based on the component. Figure 1 illustrates the process of data extraction and the list of all avaialable Moodle components.
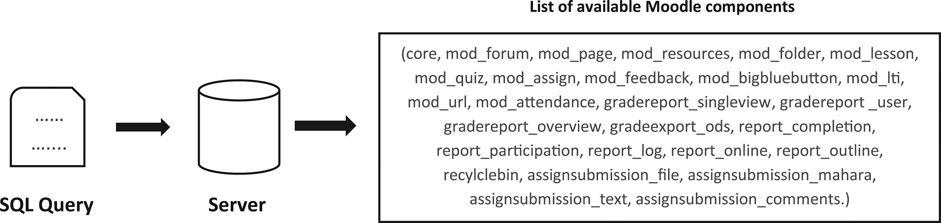
FIGURE 1. Process of extracting raw data from moodle server.
Later, the same model is trained and tested with the interaction logs and achievement data of online and face-to-face deliveries of a mathematic course (MA111). Since the online offering of the selected course only included 266 students with a total number of 452,480 interactions, and the face-to-face offerings had 551 enrolments with approximately 1 million interactions (1,021,148 records), 80 percent of data from both offerings were combined into one single training dataset and rest into one test dataset. This is because the face-to-face offering was shifted into an online mode during the course progression due to COVID safety measures and both offerings included equal and same assessments.
Feature Selection
Feature selection reduces the dimensionality of a dataset by eliminating irrelevant or partially relevant features from the data, and only including valuable features that contribute to predicting the target variable [43, 44]. Since each record obtained from the raw data contains multiple attributes, the feature selection technique reduces the number of attributes, speeds up the modeling process by reducing the training time and the testing time, and results in simple and easy to maintain models. The model presented in this chapter uses a simple approach to feature selection, where feature filtering is done using a correlation matrix. A correlation matrix tabulates each feature’s importance in the dataset. Features related to the target variable are selected and used for the modeling. Each feature’s correlation coefficient is calculated dynamically in the code and a simplified feature subset is obtained for every week. For instance, feature subset for week two may include quiz interactions and forum engagements only, whereas, in week three, assignment and lab submissions may also correlate with the performance and hence, the feature set for week three may also include these features. Based on the correlation coefficients, the top most features are used for predicting a learner’s status at any given point of time.
Data Transformation
After applying data pre-processing and feature selection techniques to the raw data, the cleaned dataset is transformed into time-series data before proceeding to the modeling stage. The interaction profile for week 1 is transformed into the first time-step of the series, interaction profile for week 2 into the second time-step and so on. Since there are usually limited teaching activities happening during the first week and students are still going through the registration process, the prediction was carried out from week 2. Thus, in order to forecast students’ status in week 2, both first and second time-step covering interaction profile for week 1 and week 2 are analyzed. For prediction in week 3, all three time-steps are considered. In general, predicting a learner’s status in week
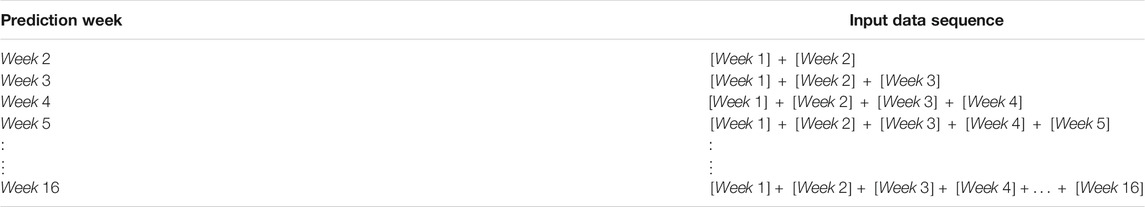
TABLE 1. Data required for prediction in various weeks input.
RNN-LSTM Model
The RNN-LSTM model was implemented as a sequence of layers comprising a single hidden layer of LSTM units, a dropout layer and a dense layer. The input layer, which is the LSTM layer, takes the input sequence and maps to label data in the output layer (density layer). A dropout layer is placed in between to prevent overfitting in the neural network. The number of hidden nodes in the LSTM layer was determined using a trial-and-error approach. Also, Adam optimiser was utilized to compute adaptive learning rates for each network parameter.
The python application that implements the presented model reads the weekly interaction logs extracted from Moodle, dynamically evaluate the correlation coefficients of features, prepares a subset of correlating features and divides the final data into three subsets–training dataset (60%), validation dataset (20%) and testing dataset (20%). The training dataset is used to fit the model, i.e., the network adapts the weights on a training dataset. The validation dataset, which is achieved using a hold-out technique, is utilized to validate the model and to optimize the hyperparameters i.e., model is tuned until a minimal validation loss is achieved. The model accuracy is assessed using the test dataset. The model is retrained every week to include recent data sequence in the training and validation process. The model’s training and testing accuracy at different weeks is documented and discussed in the next section.
Results and Discussion
Nowadays, student performance monitoring and prediction is an integral part of the modern educational system, especially in higher learning institutes. Predicting students’ academic performance has always been critical to improve graduates’ quality, assist at-risk students, ensure their retention, and facilitate timely educational intervention during a course. However, predicting performance in online courses has been a long-standing challenge for educators and administrators for many universities such as USP due to the variability in deliveries, student diversity, and campuses’ remoteness. To predict students’ success in online courses, especially in mathematic courses, a RNN-LSTM based prediction and classification model was implemented. Initially, the model was verified and validated with a university wide computer literacy course and later was trained and tested for a mathematic course. The performance of the implemented model is as follows:
Model Performance With Computer Literacy Course Data
The presented model reports an average accuracy of 86% with training data and 84% accuracy with the testing data. As listed in Table 2 and shown in Figure 2, for this particular dataset, the accuracy of the proposed model with training dataset increased progressively over the time from 74 to 92% and the accuracy of the model with testing dataset gradually increased over the time from 75 to 91%. Since the classification accuracy is not a good metric for evaluating the performance of the classifiers, F1 score is also considered to measure how well the proposed model is performing, and based on the progressive increase in F1 score from 0.4 to 0.86 over the time it can be inferred that model’s performance and prediction ability improves as the course progress.
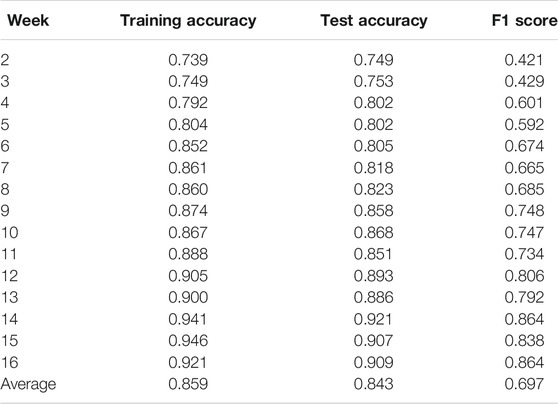
TABLE 2. Weekly performance of the RNN-LSTM model trained and validated using the interaction and achievement data of UU100.
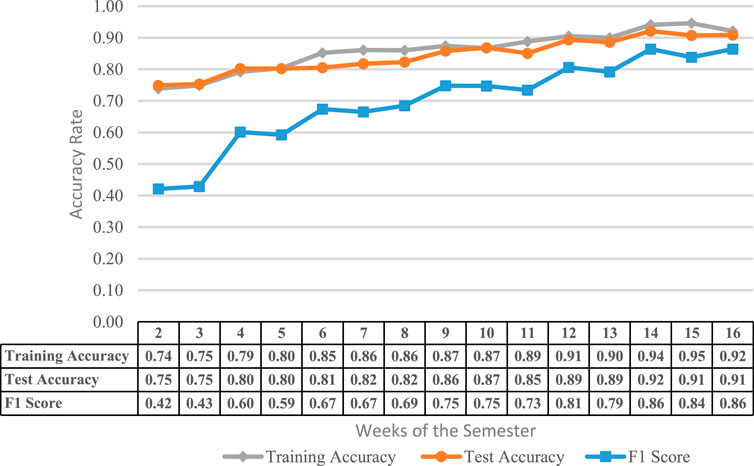
FIGURE 2. Line graph showing the training accuracy, test accuracy and F1 score recorded for UU100 dataset at the different weeks of semester.
As listed in Table 2, In week 2 and week 3, the F1 score is less than 0.50, indicating that the classifier’s performance is below average, i.e., ability to predict at-risk students is poor. The reason for such poor prediction results could be the less or limited availability of knowledge about student’s behavior and achievements. Literature supports this claim as the student performance prediction suffers from the “cold start” problem, where new students’ performance is to be predicted with limited information. Therefore, it leads to poor prediction results [45–47]. However, from week 4 and onwards, the F1 score increased above 0.50, which indicates that the model’s performance improved as more data was available to the model. This is because the proposed model utilizes the data from previous time-steps to predict the learners learning status in the future time-step, i.e., identifies and analyses the trend in learner’s behavior to forecast their overall performance, and the availability of more data allows the model to predict and flag the at-risk students more precisely and accurately.
Similarly, as listed in Table 2 and illustrated in Figure 2, in the mid-semester week (week 8), the proposed model recorded the F1 score of 0.69. This is the week where course coordinators are asked to prepare and submit a mid-semester report containing the list of identified at-risk students. The proposed model assists in identifying at-risk students before the mid-semester reporting deadline and provides an opportunity to continuously monitor and update this list of students weekly instead of reporting at a single point in the semester.
Based on the improved performance in the final few weeks of the semester, it can be said that the presented model can successfully flag the majority of the at-risk students before the end of the course. Also, it can be concluded that the proposed model presents a trustable performance for the given test data as it continuously considers student’s interaction and their learning behavior in an online environment and not just assessment scores.
Model Performance With a Mathematic Course Data
The presented model recorded an average train and test accuracy of 93 and 88% with the given mathematic training and testing datasets. As illustrated in Figure 3, and listed in Table 3, both training and test accuracy fluctuated between 78 and 100% over the weeks. The classification accuracy alone is not enough to conclude the model’s performance as it does not indicate the fraction of correct and incorrect predictions, the success of the prediction model is measured through F1-score, which progressively increased from 0.0 in week 1 to 0.91 in the final week of the semester, indicating an improvement in prediction performance over the time.
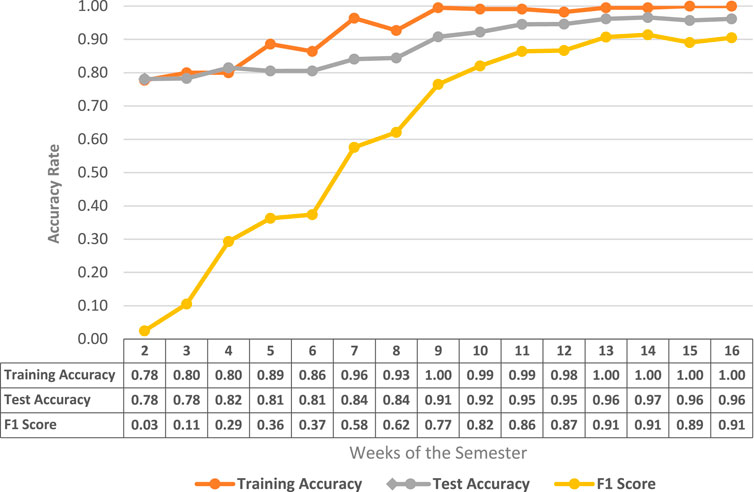
FIGURE 3. Line graph showing the training accuracy, test accuracy and F1 score recorded for MA111 dataset at the different weeks of semester.
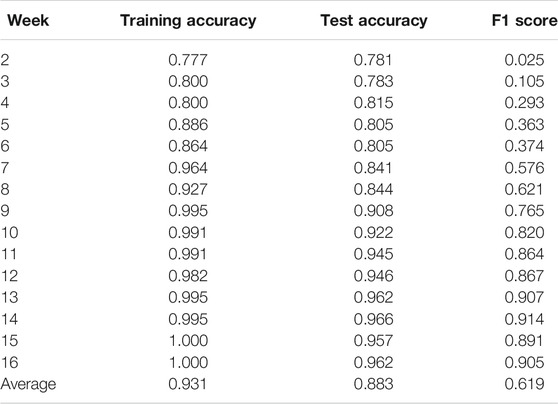
TABLE 3. Weekly performance of the RNN-LSTM model trained and validated using the interaction and achievement data of MA111.
As previously mentioned, in initial weeks of the courses no or limited knowledge about student’s behavior and achievements is available [45–47], imposing limitations on making a correct judgment about the future status and thus justifying poor F1-scores in the initial weeks until week 7 (listed in Table 3; Figure 3). Moreover, the dataset prepared for training and testing included combinations of data instances from face-to-face and online courses and was significantly skewed with data points from face-to-face delivery. Nevertheless, the face-to-face delivery was converted into online delivery in week 8 of the semester [48], and until then, the course was delivered traditionally with limited interactivity on course shell. Hence, data aggregation of different deliveries until week 7 could have led to poor results. Lastly, unlike the computer literacy course dataset, the dataset’s overall size obtained after combining both mathematic course modes was 817 data points. As published in the literature, the training dataset’s size influences the model’s accuracy and performance. Large training sets deliver much better and long-lasting results [49]. It can be inferred that increasing the data instances during the training process could yield more accurate and reliable predictions. Despite all complications, the model could reasonably classify in week 8 (F1-score: 0.62), the time when course coordinators manually identify and list students who are at risk of academic failure. Therefore, it can be said that the presented model could assist educators in decision makings and taking informed actions.
Conclusion
Student performance monitoring is the process of measuring a learner’s progress toward attaining his/her learning goals. A continuous student academic progress tracking allows flagging an at-risk student at the early stage of the course progression and take timely interventions. The technological advancements in the ICT sector, availability of a variety of machine learning and data mining techniques have allowed the data scientists to explore the educational domain and implement systems that offer real-time progress tracking capabilities. Similarly, this research presents a case study of classification and forecasting in computer literacy and mathematic courses where students’ performance is forecasted using the RNN-LSTM neural network. The RNN-LSTM model implemented in this study estimated the students’ status by exploiting the timely interactions and participation knowledge accumulated in the LMS.
Interaction logs and course achievement of a literacy course and mathematic course were extracted, cleaned, transformed, reshaped and subsequently fed into RNN-LSTM network consisting of three layers–a LSTM layer, a dropout layer and a density layer. The proposed model reports an average classification accuracy of 86 and 84% with training dataset and testing dataset obtained from literacy course logs. The average training and test accuracy recorded with the mathematic course data were 93 and 88%. In addition, the f-score measure reported the test accuracy of 70 and 62% for literacy and mathematic course data, respectively. Is the course progressed, the proposed model’s performance and prediction improved for both the courses and fairly flagged majority of the at-risk student. The model’s main essence is that it examines past observations of a series and associated patterns to forecast learner’s status in the upcoming weeks. The proposed model is designed to work with any online discipline course at any level of education, given the conditions that course includes activities that contribute to final achievement, and weekly interactions counts and achievement data are available to the model.
However, there are some limitations and assumptions involved with this model. Firstly, the model is based on the supervised learning approach; hence, sufficient data should be available to train the model. Secondly, model performance entirely depends on the quality of data, i.e., type of correlated activities employed in a course; therefore, the model can only perform well if there are correlating activities. Otherwise, the proposed model is implemented in such a way to extract interaction logs, find a correlated feature, transform and reshape data into time-series for any course in any discipline.
All in all, this research aimed to explore the LMS interaction logs and presents a robust solution based on time-series modeling. The output of this research directly benefits the real stakeholders of the university. It enables the educator to use the presented predictive model to identify underperforming learners in real-time, proceed with timely intervention, and enhance learning and teaching services for student excellence. Future research intends to enhance the proposed model and include other social and non-social factors which could influence the student learning in an online environment.
Data Availability Statement
The original contributions presented in the study are included in the article/Supplementary Material, further inquiries can be directed to the corresponding author.
Ethics Statement
Written informed consent was obtained from the individual(s) for the publication of any potentially identifiable images or data included in this article.
Author Contributions
BS and KC encouraged SR to conducted the presented research. SR developed the model and performed the computations. BS and KC verified the analytical methods. All authors discussed the results and contributed to the final manuscript.
Conflict of Interest
The authors declare that the research was conducted in the absence of any commercial or financial relationships that could be construed as a potential conflict of interest.
References
1. Daud, A, Aljohani, NR, Abbas, RA, Lytras, MD, Abbas, F, and Alowibdi, JS, Predicting student performance using advanced learning analytics. In: 26th international conference on world wide web companion; Apr 2017; Perth, Australia (2017). 415–421. doi:10.1145/3041021.3054164
2. Yadav, SK, Bharadwaj, BK, and Pal, S. Data mining applications: a comparative study for predicting student’s performance. Int J Innovative Tech Creat Eng (2012). 1(12):13–9. arXiv:1202.4815
3. Mcgowen, RS. The impact of school facilities on student achievement, attendance, behavior, completion rate and teacher turnover rate in selected Texas high schools. Texas: Texas A&M University (2007).
4. Ahmodu, OL, Sheu, AA, and Adeyemi, AB. Impact of school facilities on students’ academic performance in oshodi-isolo L. G. A. Senior secondary schools. Lagos State (2018).
5. Ayres, QW, and Bennett, RW. University characteristics and student achievement. J Higher Educ (1983). 54(5):516–32. doi:10.2307/1981625
6. Jovanović, O, Plazinić, L, Joksimović, J, Komlenac, J, and Pešikan, A. Developing the early warning system for identification of students at risk of dropping out using a collaborative action research process. Psihološka istraživanja (Psychological Research) (2017). 20:107–25. doi:10.5937/PsIstra1701107J
7. Jokhan, A, Sharma, B, and Singh, S. Early warning system as a predictor for student performance in higher education blended courses. Stud Higher Educ (2018). 44:1900. doi:10.1080/03075079.2018.1466872
8. Ogor, EN. Student academic performance monitoring and evaluation using data mining techniques. In: Electronics, robotics and automotive mechanics conference (CERMA 2007); 2007 Sept 25–28; Cuernavaca, Mexico (2007). p. 354–9. Morelos (2007). doi:10.1109/CERMA.2007.4367712
9. Isljamovic, S, and Suknovic, M. Predicting students’ academic performance using artificial neural network : a case study from faculty of organizational sciences. In: Icemst 2014: international conference on education in mathematics, science & technology. Konya, Turkey: ISRES Publishing (2014). p. 68–72.
10. Saa, AA. Educational data mining & students’ performance prediction. Int J Adv Computer Sci Appl (2016). 7(5):212–20. doi:10.14569/IJACSA.2016.070531
11. Sharma, B, Nand, R, Naseem, M, and Reddy, E. Effectiveness of online presence in a blended higher learning environment in the pacific. Stud Higher Educ (2019). 45:1547–65. doi:10.1080/03075079.2019.1602756
12.Project 10. Curriculum-based measurement and curriculum-based assessment. (2020). Available from: http://project10.info/DPage.php?ID=159 (Accessed May 26, 2020).
13. Fuchs, LS, and Fuchs, D. What is scientifically-based research on progress monitoring? Washington, DC: NationalCenter on Student Progress Monitoring (2001).
14. Fuchs, LS. The past, present and future of curriculum-based measurement research. Sch Psychol Rev (2004). 33(3):188–92. doi:10.1080/02796015.2004.12086241
15. Stecker, MP, Lembke, ES, and Foegen, A. Using progress-monitoring data to improve instructional decision making, Preven School Failure (2008). 52. 48–58. doi:10.3200/PSFL.52.2.48-58
16. Yu, CH, DiGangi, S, Jannasch-Pennell, A, and Kaprolet, C. A data mining approach for identifying predictors of student retention from sophomore to junior year. J Data Sci (2010). 8:307–25.
17. Cortez, P, and Silva, A. Using data mining to predict secondary school student performance. In: Proceedings of 5th Annual Future Business Technology Conference; Porto, Portugal (2008).
18. Dixson, MD. Measuring student engagement in the online course: the online student engagement scale (OSE). Online Learn (2015). 19:4. doi:10.24059/olj.v19i4.561
19. Sharma, B, Jokhan, A, and Prasad, A. Online learning environment in mathematics via a pedagogical progression model of Moodle. Melbourne, Australia: Association for the Advancement of Computing in Education (AACE) (2011).
20. Coronavirus, R. Deprives nearly 300 million students of their schooling. UNESCO (2020). Available from: https://www.reuters.com/article/us-health-coronavirus-education-idUSKBN20S1F9 (Accessed June 14, 2020).
21. Besheer, M. UNESCO: nearly 300 million students out of class due to coronavirus. Voice of America (2020). Available from: https://www.voanews.com/science-health/coronavirus-outbreak/unesco-nearly-300-million-students-out-class-due-coronavirus (Accessed September 10, 2020).
22.UNESCO.International Commission releases joint statement on education and the COVID-19 crisis (2020). Available from: https://en.unesco.org/futuresofeducation/news/international-commission-releases-joint-statement-education-and-covid-19-crisis.
23. Rashid, TA, and Aziz, NK. Student academic performance using artificial intelligence. ZANCO J Pure Appl Sci (2016). 28(2):56–69. doi:10.21271/zjpas.v28i2.544
24. Livieris, IE, Drakopoulou, K, and Pintelas, P. Predicting students’ performance using artificial neural networks. In: 8th PanHellenic conference with international participation information and communication technologies in education; 2012 Sept 28–30; Greece. (2012).
25. Oladokun, V, Adebanjo, AT, and Charles-Owaba, OE. Predicting students’ academic performance using artificial neural network: a case study of an engineering course. Pac J Sci Tech (2008). 9(1):72–9.
26. Liu, Z, Xiong, F, Zou, K, and Wang, H. Predicting learning status in MOOCs using LSTM. Shanghai, China: Cornell University (2018).
27. Okubo, F, Yamashita, T, Shimada, A, and Si, K. Students’ performance prediction using data of multiple courses by recurrent neural network. In: 25th international conference on computers in education; 2017 Apr; New Zealand: Asia-Pacific Society for Computers in Education (2017). doi:10.1145/3027385.3029479
28. Okubo, F, Yamashita, T, Shimada, A, and Ogata, H. A neural network approach for students’ performance prediction. In: The seventh international learning analytics & knowledge conference Mar 2017; Vancouver, British Columbia, Canada; (2017). p. 595–9. doi:10.1145/3027385.3029479
30.Noel-Levitz. Qualifying enrollment success: maximizing student recruitment and retention through predictive modeling. Lowa, US: Noel-Levitz, Inc. (2008).
31. Kovačić, ZJ. Early prediction of student success: mining students enrolment data. In: Proceedings of informing science & IT education conference; 2010 Jun 21–24. Cassino, Italy; (2010).
32. Ma, Y, Liu, B, Wong, CK, Yu, PS, and Lee, SM. Targeting the right students using data mining. In: Proceedings of the sixth ACM SIGKDD international conference on knowledge discovery and data mining; 2000 Aug 20–23. Boston, MA; (2000).
33. Ramaswami, M, and Bhaskaran, R. A CHAID based performance prediction model in educational data mining. Int J Computer Sci Issues (2010). 7:1.
34. Kotsiantis, SB, Pierrakeas, CJ, and Pintelas, PE. Preventing student dropout in distance learning using machine learning techniques. Berlin, Heidelberg: Springer Berlin Heidelberg (2003).
35. Dekker, GW, Pechenizkiy, M, and Vleeshouwers, JM. Predicting students drop out: a case study. In: Proceedings of the 2nd international conference on educational data mining; 2009 Jul 1–3; Cordoba, Spain; (2009). 41–50.
36. Bharadwaj, BK, and Pal, S. Mining educational data to analyze students’ performance. Int J Adv Comput Sci Appl (2011). 2(6): 63–9. doi:10.14569/IJACSA.2011.020609
37. Kabakchieva, D. Predicting student performance by using data mining methods for classification. Cybernetics Inf Tech (2013). 13(1):61–72. doi:10.2478/cait-2013-0006
38. Kongsakun, K, and Fung, CC. Neural network modeling for an intelligent recommendation system supporting SRM for universities in Thailand. WSEAS Trans Comput (2012). 11(2):34–44.
39. Singh, S. Intelligent student progress monitoring in an e-learning environment using neural network trained with memetic algorithm. Suva, Fiji: The University of the South Pacific (2014).
40.Investopedia. Time series. (2018). Available from: https://www.investopedia.com/terms/t/timeseries.asp (Accessed August 14, 2020).
41. Adhikari, R, and Agrawal, RK. An introductory study on time series modeling and forecasting. Germany: LAP Lambert Academic Publishing (2013).
42.Keras. Keras: the python deep learning library (2019). Available from: https://keras.io/.
43. Shaikh, R. Towards data science. (2018). Available from: https://towardsdatascience.com/feature-selection-techniques-in-machine-learning-with-python-f24e7da3f36e (Accessed July 11, 2020).
44. Kaushik, S. Introduction to feature selection methods with an Example 2016. Available from: https://www.analyticsvidhya.com/blog/2016/12/introduction-to-feature-selection-methods-with-an-example-or-how-to-select-the-right-variables/ (Accessed September 10, 2020).
45. Su, Y, Liu, Q, Liu, Q, Huang, Z, Yin, Y, Chen, E, et al. Exercise-enhanced sequential modeling for student performance prediction. In: The thirty-second AAAI conference on artificial intelligence; 2018 Feb 2–7; Hilton New Orleans Riverside, New Orleans, Louisiana; (2018). p. 2435–43.
46. Sweeney, M, Rangwala, H, Lester, J, and Johri, A. Next-term student performance prediction: a recommender systems approach. J Educ Data Mining (2016). 1–27. doi:10.5281/zenodo.3554603
47. Wilson, KH, Xiong, X, Khajah, M, Lindsey, RV, Zhao, S, Karklin, Y, et al. Estimating student proficiency: deep learning is not the panacea. In: Neural information processing systems, workshop on machine learning for education. 30th Conference on Neural Information Processing Systems (NIPS 2016); Barcelona, Spain (2016).
48.USP. Staff and student advisory. (2020). Available from: https://www.usp.ac.fj/index.php?id=23729 (Accessed September 10, 2020).
Keywords: mathematics, online learning, student performance monitoring, student performance prediction, artificial intelligence
Citation: Raza SH, Sharma BN and Chaudhary K (2021) A New Pair of Watchful Eyes for Students in Online Courses. Front. Appl. Math. Stat. 7:620080. doi: 10.3389/fams.2021.620080
Received: 21 October 2020; Accepted: 27 January 2021;
Published: 09 March 2021.
Edited by:
Sergei Pereverzyev, Johann Radon Institute for Computational and Applied Mathematics (RICAM), AustriaReviewed by:
Steve Warner, University of the Southern Caribbean, Trinidad and TobagoMudasser Naseer, University of Lahore, Pakistan
Copyright © 2021 Raza, Sharma and Chaudhary. This is an open-access article distributed under the terms of the Creative Commons Attribution License (CC BY). The use, distribution or reproduction in other forums is permitted, provided the original author(s) and the copyright owner(s) are credited and that the original publication in this journal is cited, in accordance with accepted academic practice. No use, distribution or reproduction is permitted which does not comply with these terms.
*Correspondence: Salman Hussain Raza, aHJhemFzYWxtYW5AZ21haWwuY29t