 Giacomo Cacciapaglia
 Francesco Sannino
- 1Institut de Physique des Deux Infinis de Lyon (IP2I), Villeurbanne, France
- 2University of Lyon, Université Claude Bernard Lyon 1, Lyon, France
- 3CP3-Origins and the Danish Institute for Advanced Study, University of Southern Denmark, Odense, Denmark
- 4Dipartimento di Fisica E. Pancini, Università di Napoli Federico II and INFN Sezione di Napoli, Complesso Universitario di Monte S. Angelo, Napoli, Italy
Mathematical models used in epidemiology to describe the diffusion of infectious diseases often fail to reproduce the recurrent appearance of exponential growth in the number of infections (waves). This feature requires a time-modulation of some parameters of the model. Moreover, epidemic data show the existence of a region of quasi-linear growth (strolling period) of infected cases extending in between waves. We demonstrate that this constitutes evidence for the existence of near time-scale invariance that is neatly encoded via complex fixed points in the epidemic Renormalization Group approach. As a result, we obtain the first consistent mathematical description of multiple wave dynamics and its inter-wave strolling regime. Our results are tested and calibrated against the COVID-19 pandemic data. Because of the simplicity of our approach that is organized around symmetry principles, our discovery amounts to a paradigm shift in the way epidemiological data are mathematically modelled. We show that the strolling period is crucial in controlling the emergence of the next wave, thus encouraging the maintenance of (non)pharmaceutical measures during the period following a wave.
Highlights
• Traditional mathematical modelling used for describing the diffusion dynamics of infectious diseases cannot describe the multi-wave pattern of pandemics without an ad-hoc modulation of the parameters.
• Within the symmetry-based framework of the epidemic Renormalization Group (eRG), we propose a consistent mathematical model where multi-waves arise naturally.
• The strolling period, characterized by a linear increase of infections between two waves, is associated to the presence of complex fixed points in the flow of the system.
• Our results demonstrate the key role of the strolling period in regulating the diffusion of the pandemic, and delaying or avoiding a future wave.
• As a consequence, pharmaceutical and non-pharmaceutical interventions are needed during the strolling period, at the end of a wave, as the number of infections during this time controls when the next wave will appear.
Pandemics are a threat to humanity. Understanding their spreading dynamics is, therefore, paramount to controlling it. The disease diffusion dynamics is traditionally described via compartmental models [1] or complex network diffusion techniques [2–4], providing an accurate description of the initial time evolution of the number of affected individuals. Another symmetry-based approach is the epidemic Renormalization Group (eRG) framework [5–7], shown to provide robust prognoses for the time evolution of a pandemic across different regions of the world.
Viral pandemics often feature multiple episodes of exponentially growing infections, called “waves”: it has been the case of the 1918 “Spanish” flu, which hit the world in at least three consecutive waves [8], and of the 2020 COVID-19, which is currently in its second or third wave in various regions of the world. The common flu, now endemic to the human population, also occurs in seasonal waves. An extremely important period for any pandemic is the one bridging two waves, whose striking feature is a strolling increase of infections. It is a challenge to consistently model strolling as part of the inter-wave dynamics within the current approaches. Typically, the wave pattern is generated by an ad-hoc time-modulation of the parameters of the model, without any insight provided on the dynamics generating such pattern. In this work we will address this issue in the eRG framework, with the aim of finding a dynamical explanation for the waves and for the strolling period of linear growth in the number of infections. The goal is to find a consistent mathematical characterization of these phenomena.
Here we demonstrate that strolling data constitute evidence for the existence of near time-scale invariance that is efficiently encoded in complex fixed points of the eRG beta function. As a result we achieve an economic and profound understanding of the wave dynamics and the bridging period between waves. COVID-19 pandemic data are used to confirm, test and calibrate the complex eRG framework (CeRG). A more detailed and quantitative analysis of the epidemiological data is presented in a companion publication [9]. Because of the simplicity of the CeRG that is organized around symmetry principles the discovery amounts to a paradigm shift in the way epidemiological data are mathematically modelled, classified and understood. The CeRG or strolling pandemic framework is applicable to a wide range of infectious disease dynamics because it provides the bedrock of consistent mathematic modelling based on symmetry principles. It also offers a guiding principle to unveil the underlying microscopic dynamics.
Introduction
Pandemics are becoming a growing threat to our society [10], with COVID-19 being the latest example [11–13]. It is therefore of paramount importance to understand the diffusion of the virus in order to design effective protocols to control its spreading in the population [14–17]. Data collected in various instances show that the number of infected people in a limited region grows exponentially at the beginning, while then subsiding after a period of time characteristic of each type of virus. This feature can be effectively described by various mathematical models, including compartmental ones [1, 18–21], complex network diffusion techniques [2–4], the eRG approach [5–7] and other infection models [22]. Going beyond the first wave is however a challenge [23].
Epidemic data for multi-wave pandemics show the existence of a region of quasi-linear growth of infected cases extending in between consecutive waves. In this period of time, the number of new infected cases grows much slower than the exponential growth in each wave, thus we refer to it as the region of strolling epidemic regime. The scope of our work is to demonstrate that:
i)modelling the strolling regime is important to achieve a deep understanding of the underlying epidemic dynamics, in a unified way within and between waves;
ii)near time-scale invariance is key to such an understanding;
iii)the eRG approach [5, 6], when extended to include complex fixed points, is the ideal framework to explain and model strolling dynamics.
Evidence for the above comes from applying the novel framework to COVID-19 data in the world [9]. Here, strolling dynamics eminently explains the pandemic diffusion data showing that the novel approach achieves a better characterization of the data compared to the original eRG with real fixed points. Thus the resulting framework constitutes a paradigm shift in our understanding of epidemic diffusion dynamics.
The eRG framework [5–7] is based on a single differential equation describing the time evolution of the total number of infected cases, inspired by particle physics methods [24, 25]. It has been shown to be highly effective when describing how the pandemic spreads across different regions of the world [6], and to be able to effectively predict the time frame of a second wave [26, 27]. Due to the presence of real fixed points, in the original eRG approach the onset of the second wave had to be modelled independently alongside the region bridging the waves. The link between the eRG and traditional compartmental approaches [1] has also been established [28, 29]. In this article we propose the novel strolling paradigm as a unified way to model and understand epidemic data, within and between waves, that stems from the emergence of complex zeros of the eRG beta function.
The strolling regime in epidemiology has an important counterpart in particle and condensed matter physics. It has to do with the loss of near-scale invariance. In particle physics, the latter is married to special relativity, thus yielding what is known as conformal invariance. Depending on the underlying mechanism behind the loss of conformality, one can envision several scenarios like a Berezinski–Kosterlitz–Thouless (BKT)-like phase transition, first discovered in two dimensions [30]. A similar mechanism was than envisioned to occur in four dimensions in [31–37], unless a jumping (non-continuous) phase transition [38] occurs. This dynamics underlies time-honored models of composite Higgs boson. Evidence for the BKT transition has been found in various two-dimensional materials and physical systems [39–42]. A large body of numerical and analytical work has followed the discovery that one can achieve (near) conformal dynamics in four dimensions with a small number of matter fields [43]. The work culminated in the well-known conformal window phase diagram [44] that serves as road map for first-principle lattice studies, as summarized in [45], and for building phenomenologically relevant models of composite Higgs.
In this work we demonstrate that an approximate scale-invariant dynamics can explain the emergence of the strolling regime as well as of a new wave, in epidemiological data. Our approach is organized around symmetry principles, which allow for a compact and efficient way to analyse the data. Our discovery amounts to a paradigm shift in the way epidemiological data will be modelled in the future. This discovery offers also a precious guideline in unveiling underlying models aimed at a microscopic understanding of multi-wave diffusion of the pandemics, inspired by the work done in particle and condensed matter physics.
The key equation of the strolling framework is the complex eRG (CeRG, pronounced as Serge) beta function:
The solutions of this differential equation,
corresponding to time-scale invariant fixed points of the theory. This implies that if α equals any of these values, at any given time, its value will remain fixed (i.e., constant in time). For positive δ and an initial value of α between zero and
For negative δ, the two non-trivial fixed points become complex and therefore can’t be reached. Nevertheless the dynamics still feels their presence for sufficiently small
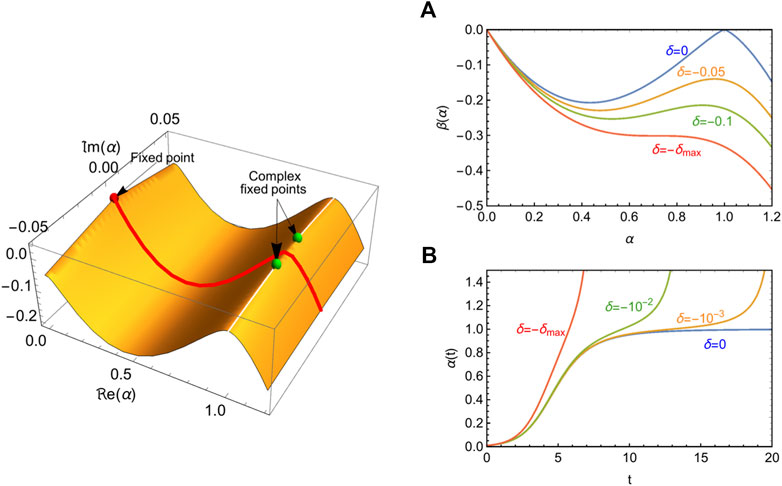
FIGURE 1. Emergence of the strolling dynamics from the CeRG beta function. Left panel: illustration of the beta function (
The solutions of Eq. 1 constitute a two parameter family of functions that we use to efficiently model the COVID-19 epidemic data. To do so we can identify
Mathematical Modelling
Review of the Epidemic Renormalization Group
In the original eRG approach [5], rather than the number of cases, it was used its natural logarithm
More specifically, as the renormalization group equations in high energy physics are expressed in terms of derivatives with respect to the energy μ, it is natural to identify the time as
The pandemic beta function able to represent an isolated region of the world [5] can be parametrized as
whose solution, for
The dynamics encoded in Eq. 4 is that of a system that flows from an Ultra-Violet fixed point at
The rate with which the fixed points are approached is determined by a universal quantity termed scaling exponent:
At
A negative (positive) exponent means that the fixed point is repulsive (attractive).
The presence, however, of a truly interacting fixed point at large times predicts that the number of new cases drops to zero. This is, however, not what is observed for COVID-19 for most of the countries. The system does not reach a time-scale invariant state. What it is generally observed is the occurrence of a temporal region of roughly constant number of new infected cases. After this time, if there is no herd immunity, the system will start a new epidemic wave. The extent to which the system remains in this state in between two waves depends on the intrinsic dynamics of the virus as well as social distancing measures. The point we will now address is how this important phenomenon can be encapsulated in a mathematically consistent way as a controllable deformation of a symmetry limit of the model, i.e., a phenomenon emerging as near time-dilation.
Complex Epidemic Renormalization Group (CeRG): Strolling Region of Pandemics
Here we propose the CeRG model for which the beta function in Eq. 4 becomes:
with δ and p real numbers and p positive. One can rescale the time by
with each complex zero of order p. The zero at the origin corresponds to a repulsive fixed point, meaning that a deformation around it (initial infections) drives the beginning of the pandemic, while the other two zeros control the dynamics at large times, as discussed above. For
As shown in Figure 1, the beta function has a local maximum at values of
For small
The strolling regime occurs because the real beta function develops a maximum near
The results as a function of δ, for different values of p, are shown in Figure 2. For fixed p, the strolling time grows like an inverse power law of δ, while for fixed and sufficiently small δ it increases exponentially with p.
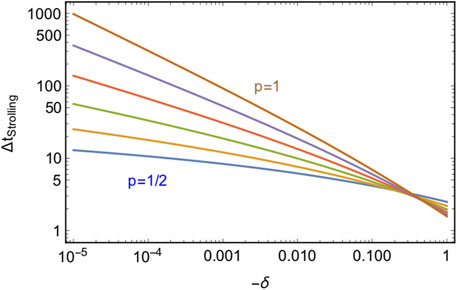
FIGURE 2. Values of
Multi-Wave Dynamics
The CeRG model can be easily extended to include multiple waves, with their strolling regime in between consecutive waves. For a pandemic with w waves, the multi-wave CeRG equation reads [9]:
in terms of normalized α and time. Here, the inverse of the parameters
(where
which measure the severity of the strolling period after the ρth wave.
In Figure 3 we illustrate the behavior of the solution in the case of two waves,
The extremes of integration correspond to zeroes of the derivative of the beta function. For
In panel B) of Figure 3, we show
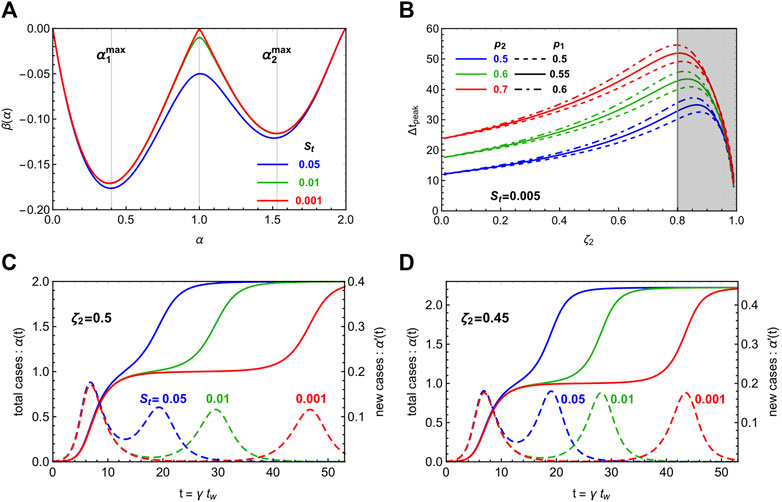
FIGURE 3. Illustration of the multi-wave CeRG model, with two waves. In panel (A), we show the beta function for three different values of the strolling parameter
In Figure 4 we show the beta function and sample solutions for a multi-wave CeRG model with three waves. Here we chose the two waves to contain the same number of total infected, and the same strolling parameter
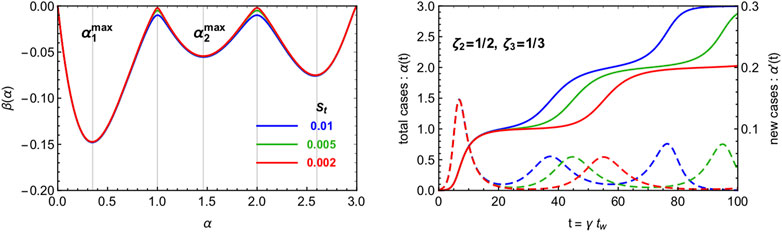
FIGURE 4. Illustration of the multi-wave CeRG model, with three waves. We show the beta functions (right) and the solutions (left) for three values of
Results
The CeRG model can effectively describe a single wave and the subsequent strolling period, characterized by a linear growth in the total number of infected cases. The solutions of Eq. 1 contain five parameters that can be fitted on the epidemiological data: the two parameters characterizing the family of solutions, p and δ, two normalization factors a and γ, and the initial condition. The latter determines the beginning of the infection spread. Following the original eRG formulation [5], here we identify α with the logarithm of the total number of infected cases. The normalizations appear as
where
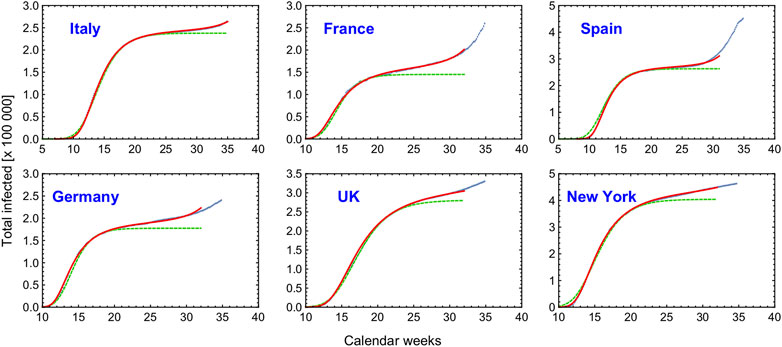
FIGURE 5. Fit of the CeRG solutions (red curves) compared to the total number of infected cases (blue dots) adjourned to the 28th of August. For comparison, in dashed green we show the eRG first wave fits obtained in [26], which do not feature the strolling dynamics. The epidemiological data is from www.worldometer.info.
The figure clearly demonstrates that the CeRG model provides an excellent description of the data. As a comparison, in dashed green we also show the fit from the original eRG model, which has only 3 parameters. The values of the parameters used in the plots are listed in Table 1. For the eRG, the parameters are obtained via a
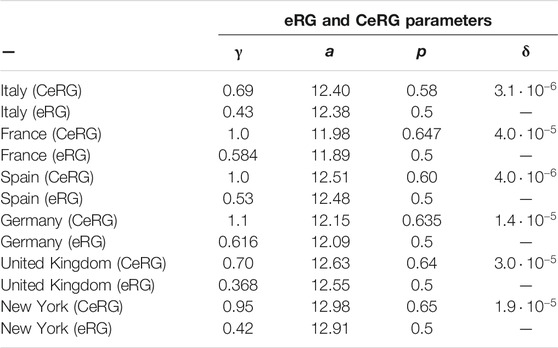
TABLE 1. CeRG and eRG parameters used to obtain the curves in Figure 5.
Most regions of the world are currently experiencing a second or third wave of the COVID-19 pandemic. The multi-wave CeRG could then be used to model this structure [9]. One first remark is that the multi-wave model works better for the total number of infected cases,
Discussion
We provided a new physical paradigm for describing pandemic dynamics, which is able to naturally account for the observed strolling phase in between waves. It is based on the realization that the strolling phase appears as a manifestation of near time-scale invariance of the underlying pandemic diffusion theory. In the CeRG framework this is encoded in the emergence of complex fixed points of its beta function. The discovery is supported by the COVID-19 data that we accurately reproduce with solutions of the CeRG beta function. In comparison, traditional approaches like compartmental models can reproduce the multi-wave behavior only via time-dependence of some parameters, like the effective infection rate. In practice, a modulated increase in the infection rate is modelled in, which thus generates the exponential increase of the number of infections in waves. This pattern is, therefore, introduced ad-hoc, while in our model it naturally emerges from the complex fixed point structure of the equation. As such, our model has a stronger predictive power than traditional approaches as it allows to correlate the global time-evolution of the virus spreading to the emergence of the next wave.
Limitations
The mathematical approach to pandemics we propose here is based on symmetry principles instead of the underlying mechanism of diffusion of infectious diseases. The eRG framework is based on the time-invariance symmetry, i.e. the property of a system that remains constant in time (steady states). In the case of pandemics, the emergence of an exponential increase in the number of infections (pandemic wave) can be understood as a transition between a steady state (with zero infections) to another steady state with a non-zero total number of infections. The multi-wave structure and the strolling period in between waves, therefore, emerge when the second steady state cannot be reached and the system starts a new exponential growth after spending a sizeable time around an approximate steady state. This phase is characterized by a linear increase in the number of infections. The limitation of this approach is that it does not include the details of the mechanism of the infections. Thus, it is not possible to study in detail the effect of various (non)pharmaceutical interventions, nor variations in the virus dynamics.
In fact, the philosophy of the eRG approach is to “integrate out” the details and study the overall time evolution of the pandemic: the effect of social distancing, different policies, pharmaceutical interventions, and the presence of strains with different infectious power are contained in the value of the parameters characterizing the solution (5 for the CeRG model, and three for the eRG one). In particular, the effective infection rate γ is the most sensitive one, together with the total cumulative number of infections. It would be interesting to apply this mathematical framework to numerical simulations that are sensitive to the complexity of the system [46] and see how they influence the parameters of the model. Results for the effect of vaccinations can be found in [27]. Psychological factors, like trust and the perceived gravity of the situation [47], also influence the values of the parameters of the model, as well as the impact of social media [48, 49]. An analysis of the impact of strains is under way.
We apply the framework to the cumulative number of infected, with caveats already stated in the text, which offers the most accurate description of the time evolution of the pandemic. In principle, the same formalism can be applied to the hospitalizations and deaths. However, they crucially depend on the demographics of the region, and on the presence of comorbidity in the infected individuals. Thus, the time structure of the number of hospitalizations and deaths would be biased by factors that go beyond the virus infectious power and measures taken to curb the epidemic diffusion.
The model can also be used to forecast the evolution of the pandemic. In particular, by fitting the strolling period, the occurrence of a next wave can be predicted, with extensive results presented in [9]. These predictions, however, can be affected by changes in the policies and the effect of extensive vaccinations of the population. For this reason, they should be considered as a guideline for the implementations of measures that can prevent or delay the emergence of a future wave.
Conclusion
The new approach we propose here correctly describes, in a better way than the eRG, the exponential growth of the first wave. This is so because it allows for larger values of γ, as shown in Table 1, which better reproduce the initial data of the exponential epidemic growth. The fact that the initial data needed a larger infection rate γ was already observed in early data fits [5]. Additionally, allowing the parameter p to be greater than
The CeRG approach, which is based on the implementation of important symmetries of the pandemic, is a macroscopic realization that serves as a guiding principle to unveil its microscopic dynamics. A natural step in this direction is to consider a possible realization in terms of a BKT-like theory [30]. The strolling period of pandemic raise in between waves is now explained by an elegant yet profound mechanism that once was sought to underly certain time-honored composite Higgs boson theories.
Our discovery amounts to a paradigm shift in the way epidemiological data are mathematically modelled, classified and understood, and we further believe that the CeRG framework can be applied to a wide range of diffusion-based social dynamics. In the case of infectious diseases, like COVID-19, our new approach highlights the importance of the inter-wave period, where a constant number of new infected cases is recorded. To control and delay the next wave of the pandemic, it is crucial to control this phase and limit the number of new daily cases as much as possible. It has been established that limiting to 10–20 new daily cases per million inhabitants is necessary [27, 50], and decision makers should implement suitable social measures to achieve this goal. In practice, this means that social distancing measures should be maintained even after the number of new daily infections decrease. This includes hygiene measures, mask wearing, sanitization of enclosed environments and respect of distances between individuals. In addition, vaccination campaigns should be deployed during the strolling phase in order to reduce the population susceptible to infections.
Data Availability Statement
The original contributions presented in the study are included in the article/supplementary material, further inquiries can be directed to the corresponding authors.
Author Contributions
All authors listed have made a substantial, direct, and intellectual contribution to the work and approved it for publication.
Conflict of Interest
The authors declare that the research was conducted in the absence of any commercial or financial relationships that could be construed as a potential conflict of interest.
References
1. Kermack, WO, McKendrick, A, and Walker, GT. A Contribution to the Mathematical Theory of Epidemics. Proc R Soc A 115 (1927) 700–21. doi:10.1098/rspa.1927.0118
2. Perc, M, Jordan, JJ, Rand, DG, Wang, Z, Boccaletti, S, and Szolnoki, A. Statistical Physics of Human Cooperation. Phys Rep 687 (2017) 1 – 51. doi:10.1016/j.physrep.2017.05.004
3. Wang, Z, Andrews, MA, Wu, ZX, Wang, L, and Bauch, CT. Coupled Disease–Behavior Dynamics on Complex Networks: A Review. Phys Life Rev 15 (2015) 1 – 29. doi:10.1016/j.plrev.2015.07.006
4. Wang, Z, Bauch, CT, Bhattacharyya, S, d’Onofrio, A, Manfredi, P, Perc, M, et al. Statistical Physics of Vaccination. Phys Rep 664 (2016) 1 – 113. doi:10.1016/j.physrep.2016.10.006
5. Della Morte, M, Orlando, D, and Sannino, F. Renormalization Group Approach to Pandemics: The COVID-19 Case. Front Phys 8 (2020) 144. doi:10.3389/fphy.2020.00144
6. Cacciapaglia, G, and Sannino, F. Interplay of Social Distancing and Border Restrictions for Pandemics (COVID-19) via the Epidemic Renormalisation Group Framework. Sci Rep 10 (2020) 15828. doi:10.1038/s41598-020-72175-4
7. McGuigan, M. Pandemic Modeling and the Renormalization Group Equations: Effect of Contact Matrices, Fixed Points and Nonspecific Vaccine Waning. arXiv:2008.02149 (2020).
8. Taubenberger, JK, and Morens, DM. 1918: The Mother of All Pandemics. Rev Biomed 17(1) (2006) 69–79. doi:10.3201/eid1209.05-0979
9. Cacciapaglia, G, Cot, C, and Sannino, F. Multiwave Pandemic Dynamics Explained: How to Tame the Next Wave of Infectious Diseases. Scientific Rep 11 (2021) 6638. doi:10.1038/s41598-021-85875-2
10. Morens, DM, Daszak, P, Markel, H, and Taubenberger, JK. Pandemic Covid-19 Joins History’s Pandemic Legion. mBio (2020) 11. doi:10.1128/mBio.00812-20
11. Perc, M, Gorišek Miksić, N, Slavinec, M, and Stožer, A. Forecasting Covid-19. Front Phys 8 (2020) 127. doi:10.3389/fphy.2020.00127
12. Zhou, T, Liu, Q, Yang, Z, Liao, J, Yang, K, Bai, W, et al. Preliminary Prediction of the Basic Reproduction Number of the Wuhan Novel Coronavirus 2019-nCoV. J Evid Based Med 13 (2020) 3–7. doi:10.1098/rspa.1927.0118
13. Hâncean, MG, Perc, M, and Juergen, L. Early Spread of Covid-19 in Romania: Imported Cases from Italy and Human-To-Human Transmission Networks. R Soc Open Sci 7 (2020) 200780. doi:10.1098/rsos.200780
14. Lai, S, Ruktanonchai, NW, Zhou, L, Prosper, O, Luo, W, Floyd, JR, et al. Effect of Non-pharmaceutical Interventions for Containing the Covid-19 Outbreak in china. Nature 585 (2020) 410–3. doi:10.1038/s41586-020-2405-7
15. Flaxman, S, Mishra, S, Gandy, A, Unwin, HJT, Mellan, TA, Coupland, H, et al. Estimating the Effects of Non-pharmaceutical Interventions on Covid-19 in Europe. Nature 555 (2020) 257–61. doi:10.1038/s41586-020-2293-x
16. Chinazzi, M, Davis, JT, Ajelli, M, Gioannini, C, Litvinova, M, Merler, S, et al. The Effect of Travel Restrictions on the Spread of the 2019 Novel Coronavirus (Covid-19) Outbreak. Science 368 (2020) 395–400. doi:10.1126/science.aba9757
17. Scala, A, Flori, A, Spelta, A, Brugnoli, E, Cinelli, M, Quattrociocchi, W, et al. Time, Space and Social Interactions: Exit Mechanisms for the Covid-19 Epidemics. Sci Rep 10 (2020) 13764. doi:10.1038/s41598-020-70631-9
18. Sarkar, K, Khajanchi, S, and Nieto, JJ. Modeling and Forecasting the Covid-19 Pandemic in India. Chaos, Solitons & Fractals 139 (2020) 110049. doi:10.1016/j.chaos.2020.110049
19. Nda irou, F, Area, I, Nieto, JJ, and Torres, DF. Mathematical Modeling of Covid-19 Transmission Dynamics with a Case Study of Wuhan. Chaos, Solitons & Fractals 135 (2020) 109846. doi:10.1016/j.chaos.2020.109846
20. Khajanchi, S, and Sarkar, K. Forecasting the Daily and Cumulative Number of Cases for the Covid-19 Pandemic in India. Chaos 30 (2020) 071101. doi:10.1063/5.0016240
21. Khajanchi, S, Sarkar, K, Mondal, J, Nisar, KS, and Abdelwahab, SF. Mathematical Modeling of the Covid-19 Pandemic with Intervention Strategies. Results Phys 25 (2021) 104285. doi:10.1016/j.rinp.2021.104285
22. Khajanchi, S, Bera, S, and Roy, TK. Mathematical Analysis of the Global Dynamics of a Htlv-I Infection Model, Considering the Role of Cytotoxic T-Lymphocytes. Mathematics Comput Simulation 180 (2021) 354–78. doi:10.1016/j.matcom.2020.09.009
23. Scudellari, M. How the Pandemic Might Play Out in 2021 and beyond. Nature (2020) 584:22–5. 10.1038/d41586-020-02278-5.
24. Wilson, KG. Renormalization Group and Critical Phenomena. 1. Renormalization Group and the Kadanoff Scaling Picture. Phys Rev B 4 (1971) 3174–83. doi:10.1103/PhysRevB.4.3174
25. Wilson, KG. Renormalization Group and Critical Phenomena. 2. Phase Space Cell Analysis of Critical Behavior. Phys Rev B 4 (1971) 3184–205. doi:10.1103/PhysRevB.4.3184
26. Cacciapaglia, G, Cot, C, and Sannino, F. Second Wave Covid-19 Pandemics in Europe: A Temporal Playbook. Sci Rep 10 (2020) 15514. doi:10.1038/s41598-020-72611-5
27. Cacciapaglia, G, Cot, C, Islind, AS, Óskarsdóttir, M, and Sannino, F. Impact of US Vaccination Strategy on Covid-19 Wave Dynamics. Scientific Rep 11 (2021) 10960. doi:10.1038/s41598-021-90539-2
28. Della Morte, M, and Sannino, F. Renormalisation Group Approach to Pandemics as a Time-dependent SIR Model. Front Phys 9 (2021) 583. doi:10.3389/fphy.2020.591876
29. Cacciapaglia, G, Cot, C, Della Morte, M, Hohenegger, S, Sannino, F, and Vatani, S. The Field Theoretical ABC of Epidemic Dynamics. arXiv:2101.11399 (2021).
30. Kosterlitz, J. The Critical Properties of the Two-Dimensional X Y Model. J Phys C (1974) 7:1046–60.
31. Miransky, V. Dynamics of Spontaneous Chiral Symmetry Breaking and Continuum Limit in Quantum Electrodynamics. Nuovo Cim A 90 (1985) 149–70. doi:10.1007/BF02724229
32. Miransky, V, and Yamawaki, K. Conformal Phase Transition in Gauge Theories. Phys Rev D 55 (1997) 5051–66. doi:10.1103/PhysRevD.56.3768
33. Holdom, B. Raising Condensates beyond the Ladder. Phys Lett B 213 (1988) 365–9. doi:10.1016/0370-2693(88)91776-5
34. Holdom, B. Continuum Limit of Quenched Theories. Phys Rev Lett 62 (1989) 997. doi:10.1103/PhysRevLett.62.997
35. Cohen, AG, and Georgi, H. Walking beyond the Rainbow. Nucl Phys B 314 (1989) 7–24. doi:10.1016/0550-3213(89)90109-0
36. Appelquist, T, Terning, J, and Wijewardhana, L. The Zero Temperature Chiral Phase Transition in SU(N) Gauge Theories. Phys Rev Lett 77 (1996) 1214–7. doi:10.1103/PhysRevLett.77.1214
37. Gies, H, and Jaeckel, J. Chiral Phase Structure of QCD with many Flavors. Eur Phys J C 46 (2006) 433–8. doi:10.1140/epjc/s2006-02475-0
39. Hadzibabic, Z, Krüger, P, Cheneau, M, Battelier, B, and Dalibard, J. Berezinskii–Kosterlitz–Thouless Crossover in a Trapped Atomic Gas. Nature 441 (2006) 1118 – 21. doi:10.1038/nature04851
40. Tutsch, U, Wolf, B, Wessel, S, Postulka, L, Tsui, Y, Jeschke, H, et al. Evidence of a Field-Induced Berezinskii–Kosterlitz–Thouless Scenario in a Two-Dimensional Spin-Dimer System. Nat Commun 5 (2014) 5169. doi:10.1038/ncomms6169
41. Situ, G, and Fleischer, JW. Dynamics of the Berezinskii–Kosterlitz–Thouless Transition in Photon Fluid. Nat Photon 14 (2020) 517 – 22. doi:10.1038/s41566-020-0636-7
42. Li, H, Liao, YD, Chen, BB, Zeng, XT, Sheng, XL, Qi, Y, et al. Kosterlitz–Thouless Melting of a Magnetic Order in the Triangular Quantum Ising Material Tmmggao4. Nat Commun 11 (2020) 1111. doi:10.1038/s41467-020-14907-8
43. Sannino, F, and Tuominen, K. Orientifold Theory Dynamics and Symmetry Breaking. Phys Rev D 71 (2005)051901. doi:10.1103/PhysRevD.71.051901
44. Dietrich, DD, and Sannino, F. Conformal Window of SU(N) Gauge Theories with Fermions in Higher Dimensional Representations. Phys Rev D 75 (2007) 085018. doi:10.1103/PhysRevD.75.085018
45. Cacciapaglia, G, Pica, C, and Sannino, F. Fundamental Composite Dynamics: A Review. Phys Rept 877 (2020) 1–70. doi:10.1016/j.physrep.2020.07.002
46. Holling, C. Understanding the Complexity of Economic, Ecological, and Social Systems. Ecosystems 4 (2001) 390–405. doi:10.1007/s10021-001-0101-5
47. Chan, HF, Brumpton, M, Macintyre, A, Arapoc, J, Savage, DA, Skali, A, et al. How Confidence in Health Care Systems Affects Mobility and Compliance during the Covid-19 Pandemic. PloS one 15 (2020) e0240644. doi:10.1371/journal.pone.0240644
48. Rai, RK, Khajanchi, S, Tiwari, PK, Venturino, E, and Misra, AK. Impact of Social media Advertisements on the Transmission Dynamics of Covid-19 Pandemic in India. J Appl Mathematics Comput (2021). doi:10.1007/s12190-021-01507-y
49. Khajanchi, S, Sarkar, K, and Mondal, J. Dynamics of the Covid-19 Pandemic in India. arXiv:2005.06286(2021).
Keywords: COVID-19, multi-wave pattern, mathematical modelling, health decision making, renormalization group equations, scale invariant dynamics
Citation: Cacciapaglia G and Sannino F (2021) Evidence for Complex Fixed Points in Pandemic Data. Front. Appl. Math. Stat. 7:659580. doi: 10.3389/fams.2021.659580
Received: 01 April 2021; Accepted: 11 June 2021;
Published: 25 June 2021.
Edited by:
Subhas Khajanchi, Presidency University, IndiaReviewed by:
Pankaj Tiwari, University of Kalyani, IndiaSanat Kumar Mahato, Sidho Kanho Birsha University, India
Kankan Sarkar, Malda College, India
Copyright © 2021 Cacciapaglia and Sannino. This is an open-access article distributed under the terms of the Creative Commons Attribution License (CC BY). The use, distribution or reproduction in other forums is permitted, provided the original author(s) and the copyright owner(s) are credited and that the original publication in this journal is cited, in accordance with accepted academic practice. No use, distribution or reproduction is permitted which does not comply with these terms.
*Correspondence: Giacomo Cacciapaglia, Zy5jYWNjaWFwYWdsaWFAaXBubC5pbjJwMy5mcg==; Francesco Sannino, c2Fubmlub0BjcDMuc2R1LmRr