 Szabolcs Suveges
 Raluca Eftimie
 Dumitru Trucu
- 1Department of Mathematics, University of Dundee, Dundee, United Kingdom
- 2Laboratoire Mathématiques de Besançon, UMR-CNRS 6623, Université de Bourgogne Franche-Comté, Besancon, France
Cancer invasion of the surrounding tissue is a multiscale process of collective cell movement that involves not only tumour cells but also other immune cells in the environment, such as the tumour-associated macrophages (TAMs). The heterogeneity of these immune cells, with the two extremes being the pro-inflammatory and anti-tumour M1 cells, and the anti-inflammatory and pro-tumour M2 cells, has a significant impact on cancer invasion as these cells interact in different ways with the tumour cells and with the ExtraCellular Matrix (ECM). Experimental studies have shown that cancer cells co-migrate with TAMs, but the impact of these different TAM sub-populations (which can change their phenotype and re-polarise depending on the microenvironment) on this co-migration is not fully understood. In this study, we extend a previous multi-scale moving boundary mathematical model, by introducing the M1-like macrophages alongside with their exerted multi-scale effects on the tumour invasion process. With the help of this model we investigate numerically the impact of re-polarising the M2 TAMs into the anti-tumoral M1 phenotype and how such a strategy affects the overall tumour progression. In particular, we investigate numerically whether the M2→M1 re-polarisation could depend on time and/or space, and what would be the macroscopic effects of this spatial- and temporal-dependent re-polarisation on tumour invasion.
1. Introduction
The last few decades have seen a shift in the focus of cancer research: from a research that was focused on individual tumour cells to a research that is now focused on collective cancer cells movement within the tumour microenvironment (TME) and the complex interactions between tumour cells and other types of cells inside the TME [1]. These processes are key for each of the stages of tumour progression, from the early development of the avascular tumour and its local invasion to angiogenesis and subsequent metastasis stages [2, 3].
The TME is formed of tumour's vasculature, connective tissue, infiltrating immune cells and the extracellular matrix (ECM). In recent years the ECM has received considerable attention due to its role in cancer evolution and response to therapies [1]. The ECM is a complex network of macromolecules (such as fibrous proteins, water and minerals), which is an essential part of any healthy tissue [4]. To maintain its functionality, the ECM is subject to continuous remodelling via synthesis and degradation. The degradation of ECM is related to the over-secretion of several enzymes, such as the matrix metalloproteinases (MMPs), which are not explicitly tied to cancer cells, but can also be secreted by other stromal cells [5].
One of these stromal cell populations is the macrophages, which can form up to 50% of the tumour mass [6, 7]. They are often classified into pro-inflammatory anti-tumour M1-like macrophages and anti-inflammatory pro-tumour M2-like macrophages. A specific class of macrophages that is present in TME is called tumour-associated macrophages (TAMs). Since in established tumours TAMs have a phenotype that resembles M2 cells [8], they are in general correlated with poor prognosis in various cancers [9–14]. These TAMs are also involved in the active remodelling of ECM [8]. Experimental and clinical studies over the last two decades have shown that re-educating TAMs to exhibit anti-tumour responses, by switching cell phenotype from M2-like to M1-like cells, can lead to successful anti-cancer treatment protocols [8]. An example of such a treatment protocol involving macrophage re-polarisation, which was shown to be successful in human pancreatic cancer, involved the use of agonist anti-CD40 mAb [15]. Finally, an overview of the complex effects of macrophages within cancer progression and their interaction with the TME is provided in Aras and Zaidi [16].
Nutrients (e.g., oxygen and glucose) are essential for any cells to live and function properly, including cancer cells and macrophages. Nutrients are extravasated from the blood flow and diffuse through the ECM. In avascular solid tumours, nutrients diffuse into the tumour through the tumour boundary, and therefore tumour progression leads to the formation of regions inside the tumours with very low nutrient levels. These regions first become hypoxic and then necrotic, and cells in these regions undergo cell death being deprived of nutrients. Hypoxic conditions can also modify the polarisation of macrophages and influence the malignant behaviour of some cancer cells [17]. Biological evidence also suggests that specifically targeting these hypoxic regions and the metabolic activities of cells within these areas might be a beneficial therapeutic option [18, 19].
Therefore, understanding the complex dynamic interactions between macrophages and tumour cells (direct anti-tumour/pro-tumour interactions, or indirect interactions via the degradation/remodelling of ECM), as well as their nutrient consumption patterns, could help us generate new hypotheses regarding the collective cancer cells invasion of surrounding tissue and the mechanisms involved in tumour progression and control.
Over the last decade, there have been substantial advances in mathematical modelling to understand the dynamics of the cancer cell populations as well as their interactions with their surroundings; see [20–33] and references therein. Although these models mainly focused on the interplay between the cancer cells and the neighbouring ECM, the importance of the macrophages during tumour development cannot be overlooked and as a consequence, some mathematical models started to investigate the role of macrophages on the overall tumour progression [26, 28, 30, 34–39]. Initially, these models [37–39] focused only on the anti-tumour role of the macrophages, and only later models started to explore also their pro-tumour role [26, 28]. Furthermore, most of these initial mathematical models investigated tumour progression only at one spatio-temporal scale [20–22, 31]. Since the relevance of various biological processes occurring on different scales could not be ignored, more recent models started to capture these multiscale interactions [23, 24, 29, 30, 32, 40]. However, due the novelty of these multiscale approaches, they have not been extended to capture also the complex roles of macrophages in the tumour development.
In this work, we further extend an existing multi-scale moving boundary modelling platform [29, 30, 32]. To this end, we build upon a mathematical model [30] that accounts not only for the proteolytic processes occurring at the leading edge of the tumour but also for the fibre and non-fibre components of ECM, as well as for the presence of M2-like macrophages. In the new mathematical model introduced in this study we include the contribution of M1 TAMs to the overall tumour dynamics, by considering the impact of these cells on both macro- and micro-scales. We pay special attention to the dynamics of M1 and M2 cells near the tumour interface, and their interactions with the tumour and with the ECM. We also focus on the M1→M2 tumour-induced polarisation (in the presence/absence of nutrients) and on the M2→M1 re-polarisation as induced by various treatment protocols (e.g., the agonist anti-CD40 mAb mentioned above [15]). In this new study we also, model the potential role of nutrients on the proliferation/death of M1 and M2 macrophages and cancer cells.
With the help of this new extended multi-scale model, we aim to investigate whether an effective macrophage M2→M1 re-polarisation strategy (within a fibrous tissue environment which impacts macrophage dynamics) is spatial and/or temporal dependent. To our knowledge, this question has never been addressed experimentally, even if the spatial heterogeneity of the TME and the ECM is known to impact the polarisation/re-polarisation of macrophages, and therefore any potential anti-tumour treatment involving re-polarisation protocols.
The structure of the paper is as follows. In Section 2.1 we present the extended macro-scale dynamics. Then, in Section 2.2 we outline the two micro-scale processes. We present our numerical simulations in Section 4, by focusing especially on the spatial and temporal dependency of the macrophage re-polarisation. At last, we summarise and discuss the results in Section 5.
2. Multi-Scale Modelling of the Tumour Dynamics
Building on the multi-scale moving boundary framework initially introduced in Trucu et al. [32] and later expanded in Shuttleworth and Truc [29] and Suveges et al. [30], in this work, we explore not only the M2-like macrophages [30] but also the M1 phenotype, by assessing the impact that these bring within the interlinked tissue-scale (macro-scale) and cell-scale (micro-scale) tumour dynamics. Moreover, the biological context of the cancer macro-dynamics is further broadened by considering the presence of the nutrients, such as glucose and oxygen, which are key constituents of the tumour microenvirnment and play an impotan role within overall tumour progression.
2.1. Macro-Scale Dynamics
As this work extends the modelling framework introduced in Shuttleworth and Trucu [29], Suveges et al. [30], and Trucu et al. [32], we start this section by introducing some of its key features. Thus, on the macro-scale we focus on the expanding tumour region Ω(t) that progresses within a maximal tissue cube Y ⊂ ℝd, for d = 2, 3 and over the time interval [0, T] (i.e., Ω(t) ⊂ Y, ∀t ∈ [0, T]). In this context, at any macro-scale spatio-temporal point (x, t) ∈ Ω(t) × [0, T], we consider a mixed cell population consisting of distributions of: (a) cancer cells c(x, t); (b) M1-like macrophages, M1(x, t), briefly addressed here as M1 TAM; and (c) M2-like macrophages, M2(x, t), which are briefly referred to as M2 TAM. This mixture of cancer cells and macrophages exercise their naturally multiscale dynamics within an extracellular matrix, which, as in Shuttleworth and Trucu [29, 41, 42], is regarded as consisting of two major phases, namely a fibrous and a non-fibrous one. Specifically, on the one hand, we have the fibre ECM phase, accounting for all major fibrous proteins (such as collagen and fibronectin), whose micro-scale structure enables a spatial bias for withstanding incoming spatial cell fluxes, inducing this way an intrinsic ECM fibres spatial orientation [29, 30, 41, 42]. Therefore, the spatio-temporal distribution of the oriented ECM fibres at the macro-scale point (x, t) is described by a vector field θf(x, t), where , with its Euclidean norm F(x, t): = ∥θf(x, t)∥2 representing the amount of fibres at (x, t). Then, on the other hand, besides these fibrous proteins, the ECM also contains many other components such as non-fibrous proteins (for instance amyloid fibrils), enzymes, polysaccharides and extracellular Ca2+ ions. Hence, in the second ECM phase, we bundle together these constituents and refer to it as the non-fibre ECM phase, and its distribution at each (x, t) ∈ Ω(t) × [0, T] is denoted by l(x, t). Therefore, for compactness, we denote the global five-dimensional tumour vector by u that is given by
as well as denoting the total space occupied at (x, t) by ρ(u) and define it as
for all (x, t) ∈ Ω(t) × [0, T]. Furthermore, the last component of the macro-scale dynamics is the nutrients density σ(x, t), whose level within the tumour microenvironment is depleted by the invading cancer.
Finally, the macrophages are considered to infiltrate the tumour through the outer boundary [30], which is denoted by ∂Ωo(t) ⊂ ∂Ω(t) (see Figure 2), and is defined in Appendix B.
2.1.1. Nutrient
In this study we focus on an avascular tumour mass, whose growth is supported by an influx of nutrients that diffuse through the outer boundary of the tumour. To incorporate this aspect into our mathematical model, we consider the overall influx of a generic nutrient through the outer tumour boundary ∂Ωo(t) by using Dirichlet boundary conditions. Although different cell types uptake the supplied nutrients at different rates, for simplicity here we assume that all present cell populations (cancer cells, M1 and M2 TAMs) uptake nutrients at the same constant rate dσ > 0. The spatial transport of the nutrients is modelled by a diffusion term with constant coefficient Dσ > 0. Since this diffusion occurs more rapidly than cell diffusion (i.e., cell random walk), we use a quasi steady state reaction-diffusion equation (similar to the one for instance in Macklin et al. [27]) for the generic nutrients σ(x, t):
Here, σnor is the normal level of nutrients along the tumour interface, which is considered here to be a constant.
Since cells require nutrients to function properly, here we introduce four smooth bounded effect-functions that we use to model the effects of the nutrients on the different cell functions that considers the following critical nutrients levels:
• the necrotic minimal threshold σn > 0 (i.e., if σ ≤ σn this leads to necrotic tumour cell death in that area [43];
• the intrinsic nutrient level sufficient for cells to function properly: σp > 0;
• the normal level of nutrients: σnor (threshold value that is used also as the Dirichlet boundary condition in Equation 3).
Hence, we have the following relationship between these three values, namely: σnor > σp > σn.
Starting with the effect of nutrients on cell proliferation, we first assume that this effect is relatively similar for cancer cells and both macrophage populations, in the sense that very low nutrient level impedes cell proliferation and extremely high nutrient level cannot increase cell proliferation rate above a certain maximum. We consider a maximal proliferation enhancement rate Ψp,max > 0 which corresponds to nutrient levels σ ≥ σp. Also, we assume no proliferation in the necrotic regions. Thus, we define the proliferation effect-function:
where Φ(σ, ·, ·, ·) is a generic cosine function that describes a smooth transition between the two extrema, i.e., for any level σn < σ < σp. Thus, Φ(σ, ·, ·, ·) is defined by
where Φmin is the minimum, Φmax is the maximum and ΦL controls the phase shift of the cosine function. We illustrate the proliferation effect-function, defined in Equation (4) in Figure 1.
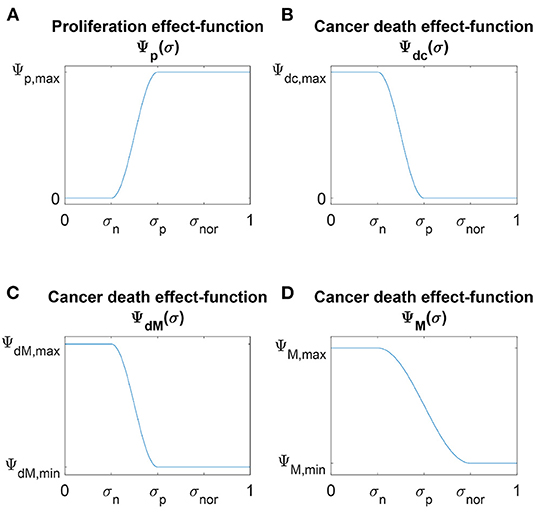
Figure 1. Schematic plots of the four nutrients effect-functions (A) Ψp(σ), (B) Ψdc(σ), (C) ΨdM(σ) and (D) ΨM(σ) defined in Equations (4), (6), and (7), respectively.
As opposed to cell proliferation, we distinguish between the death of cancer cells and the death of macrophages, since cancer cells resist death [3] while macrophages do not. Moreover, experimental studies have shown that macrophages can die in the absence of nutrients [44]. Also, it is known that following hypoxia-induced chemo-attractant signals, macrophages position themselves into pre-necrotic regions to clear out dead cells in the necrotic regions [45]. Therefore, we consider a maximal enhancement death rate Ψd,max > 0 in necrotic regions for both populations, and while we assume no death for cancer cells, we consider a minimal level of macrophage enhancement death rate ΨdM,min > 0 in regions where the nutrient level is σ ≥ σp. Hence, cancer cell death and macrophage death effect-functions are defined as (using the transition function Equation 5):
These death effect-functions are illustrated in Figure 1.
Finally, it was shown experimentally [46] that the nutrient level affects the macrophages polarisation rate giving rise for instance to hypoxia-inducible factors generated by the link with the TME. Therefore, here we consider also a polarisation effect-function by which we ensure a smooth transition between levels of maximal enhancement rate ΨM,max > 0 in necrotic regions and levels of minimal enhancement rate ΨM,min > 0 in regions with normal nutrient amounts. Using the smooth transition function (Equation 5), we define the polarisation effect-function ΨM(σ) by
This function is illustrated in Figure 1.
2.1.2. Dynamics of both M1 and M2 TAMs
Focusing now on the macrophage population, specifically to the two extreme phenotypes, M1 and M2 TAMs, in this paper we focus on the dynamics of the two TAMs populations exclusively inside the tumour domain Ω(t), the evolution of the macrophages distribution in the surrounding tumour stroma being beyond the scope of this current work. Hence, since macrophages are recruited to tumour sites as an immune response through the peritumoral vasculature, here this influx is represented by a source of M1 TAMs that is localised along the outer tumour boundary ∂Ωo(t), which is enabled by the immediate activation of macrophages into M1 TAMs as they enter the tumour [30]. For simplicity, we assume that both profile and maximal magnitude M0 > 0 of this source are identical along the tumour interface, and so this influx term is given by
Here, ψρ is the standard mollifier with appropriately chosen range ρ > 0, “*” is the convolution operator [47] and χ∂Ωo(t) is the characteristic function of the outer boundary ∂Ωo(t).
Experimental studies have shown that resident macrophages can proliferate in situ, which can lead to the accumulation of tumour-associated macrophages inside various tumours [48]. Moreover, as in Suveges et al. [30], we recognise that the stiffness of the ECM plays a role in the proliferation of the macrophages [49] and that according to several biological studies [50–52], cancer cells trigger the proliferation of macrophages by producing survival and proliferation factors. Hence, we denote by μMF > 0 the macrophages proliferation enhancement rate due to the fibres while the proliferation effect-function Ψp(σ) defined in Equation (4) accounts for the effect of nutrients on the macrophage proliferation. For simplicity, both the fibre enhancement rate and the effect-function are assumed to remain unchanged for both phenotype. Thus, we formulate the proliferation laws for the M1 and M2 TAMs as
respectively. In Equation (9), μM is the positive baseline proliferation rate while the term (1 − ρ(u))+: = max(0, 1 − ρ(u)) ensures that there is no overcrowding.
Experimental studies have shown that macrophages' death can be induced by nutritional starvation [44]. Thus, for both M1 and M2 TAMs, we consider a natural death rate dM > 0 that is regulated by the available nutrients through the death effect-function ΨdM(σ) introduced in Equation (6b), and so the death terms for each of the two phenotypes are defined by
for the M1 and M2 TAMs populations, respectively.
Due to the versatility of the macrophages, their phenotype can be switched from one to another [53, 54]. In the present work, we focus on two factors that drive the polarisation of M1 TAMs into M2 TAMs, which are detailed as follows. On the one hand, cytokines secreted by the cancer cells were shown [55, 56] to trigger the polarisation process. On the other hand, the nutrient level was also shown [46] to affect this process. As a consequence, we describe the polarisation of M1 TAMs to M2 TAMs by
where p12 > 0 is a constant proliferation rate, and ΨM is the polarisation effect-function defined in Equation (7). Further, in vitro, it has been demonstrated [57] that the M2-like macrophages can be re-polarised back into the M1 phenotype which may be a viable strategy against tumour development. To that end, we explore here mathematically the possibilities of the re-polarisation strategy through a re-polarisation term of the form
Here, p21 > 0 is the constant re-polarisation rate, tp > 0 is the activation time and χΩp(t,Rp) is the characteristic function of the re-polarisation domain Ωp(t, Rp) that is defined in Appendix C and illustrated in Figure 2. This re-polarisation term Equation (12) allows us to examine whether or not we would need to account for spatio-temporal dependencies through the domain Ωp(t, Rp) and activation times tp > 0 in order to obtain an effective re-polarisation strategy.
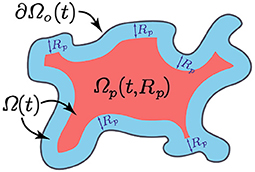
Figure 2. Schematic of the re-polarisation domain Ωp(t, Rp) that is highlighted with red.
The motility of both macrophages phenotypes is driven both by random and directed movement. Based on recent biological evidence [49], increased stiffness of the substrate leads to an increase in macrophages' speed, aspect explored in our modelling through a diffusion enhancement that corresponds to with the level of ECM fibres. To that end, we consider a stiffness-dependent macrophage diffusion coefficient DM(u) of the form
where DM > 0 is the baseline macrophage diffusion rate, and DMF > 0 is the diffusion enhancement rate due to the presence of fibres. On the other hand, besides random movement, macrophages also exercise directed migration due to a both adhesive interactions with the surrounding cells and the ECM as well as an underlying cross-talk between themselves and the cancer cells. A similar “non-local flux term" to the one introduced in Suveges et al. [30] is used here to explore the complex interactions of the cells distributed at x ∈ Ω(t0) with other cells within a sensing region B(0, R), and this accounts for: (1) cell-cell TAMs self-adhesion [58]; (2) nutrients level mediated movement [59]; and (3) the contribution of the cancer cells to the directional movement of the macrophages [60–63]. Specifically, the contribution of the cancer cells to the directional movement of the macrophages account not only for the biological evidence that cancer cells can bind themselves to TAMs [60] but also for the fact that cancer cells can attract TAMs [61–63] by secreting various chemokines. Although we neither model explicitly the involved chemokine activities within this cross-talk nor the chemo-attractant activities involved with the nutrients, here we appropriately account for both of them through the following non-local flux term:
where R represents the radius of the sensing region B(0, R). Further, SMc > 0 is the combined strength of the macrophage-cancer adhesion, and SMσ > 0 denotes strength of the macrophage-nutrient relationship, with both SMc and SMσ being assumed to maintain their individual values unchanged when considering the cases of M1 and M2 TAMs populations. Furthermore, SMM denotes the self-adhesion strength that differs for M1 and M2 TAMs [58], i.e.,
• for M1 TAMs SMM = SM1M > 0, and
• for M2 TAMs SMM = SM2M > 0,
with SM1M ≠ SM2M. Finally, to account in Equation (14) for the gradual weakening of these different adhesions as we move away from the centre x within B(x, R), we use a radially symmetric kernel that is given by
where ψ(·) is the standard mollifier. Moreover, in Equation (14), [1 − ρ(u)+ ensures that overcrowded tumour regions do not contribute to macrophage migration and n(·) is the unit radial vector given by
Thus, aggregating now all these cell movement aspects explored in Equations (8)–(14), the dynamics of the two distinct macrophages phenotypes are mathematically formulated as
where SM1M > 0 and SM2M > 0 are the self-adhesion strengths of M1 and M2 TAMs, respectively.
2.1.3. Dynamics of the Cancer Cell Population
The third cell population that we consider at macro-scale is the cancer cell population. Crucially important for cancer development and invasion, the cancer cell proliferation is a complex process that is regulated by several processes involving nutrients and macrophages. From the modelling perspective, while we consider the proliferation process as being of logistic type [64–66], we explore the influence of nutrients and macrophages as follows. On the one hand, similar to both TAMs populations, we consider the proliferation effect-function Ψp(σ) defined in Equation (4) to explore the influence of the available nutrients on the rate of cancer cell proliferation. On the other hand, biological evidence shows that while M2 TAMs promote cancer cell proliferation [67], M1 TAMs inhibits this [68]. Thus, expanding here the proliferation law introduced in Suveges et al. [30] by accounting for the negative effect of M1 TAMs, we obtain leading to the following proliferation law:
where μc > 0 is a baseline proliferation rate that is being regulated by the available nutrients, being enhanced by the M2 TAMs at a rate μcM2 > 0 and at the same time weakened by the presence of the M1 TAMs at a rate μcM1 > 0. Again, here the term (1 − ρ(u))+ ensures that there is no overcrowding.
Besides proliferation, it is well known that cancer cells resist death [3, 69]. However, due to the peritumoral vasculature as well as the excessive degradation of the ECM, the efficiency of the nutrients delivery significantly reduces inside the tumour, leading to necrosis [70]. In addition, numerous studies have shown [71–75] that classically activated M1-like macrophages can produce significant amounts of pro-inflammatory cytokines, and thereby have the ability to kill cancer cells. To that end, we assume here a baseline death rate dc > 0 that is regulated not only by the cancer cell death effect-function Ψdc(σ) introduced in Equation (6a), but also by the M1 TAMs at a rate dcM1 > 0. This results in the following mathematical representation of the cancer cell death process, namely
Similar to the macrophages, for the cancer cell population we also account for the diffusion enhancement that the spatial distribution of ECM fibres enables [76–84]. Furthermore, the random movement of the cell population is also affected by the presence of both macrophage populations. While in general, the M2 TAMs were shown to promote cancer cell motility, Afik et al. [85] recent biological evidence [68, 86] indicates that the M1 phenotype has a negative effect on the cancer cell motility. Therefore, the diffusion coefficient for the random movement of the cancer cells can be formulated mathematically as
where Dc > 0 is a baseline diffusion rate, DcF > 0 is the ECM fibres enhancement coefficient, DcM1 > 0 represents the weakening effect due to the presence of M1 TAM, and DcM2 > 0 accounts for the positive motility effect due to the presence of M2 TAM.
Besides random motility, the directed movement of the cancer cells induced by various adhesion mediated processes [60, 61, 87–90] is a central player in cancer invasion within the oriented fibrous environment. To that end, extending here on the modelling approach proposed in Suveges et al. [30] to include the interactions of cancer cells with both families of macrophages, i.e., M1 and M2 TAM, we have that the non-local spatial flux that drives the directed movement is given in this case as:
where R, n(·) and are the same as in Equation (14). Further, in Equation (19) is the unit radial vector biased by the orientation of the fibres, i.e.,
as illustrated in Figure 3. Moreover, in Equation (19) ScM > 0 represents the strength of the adhesion relationship between the cancer cells and M1 and M2 TAMs, ScF > 0 is the strength of the cell-fibre ECM adhesion [91] and Scl > 0 corresponds to strength of adhesion between the cancer cells and the non-fibre ECM phase (that includes for instance amyloid fibrils, which can support cell-adhesion processes [92]). Furthrmore,as high level of extracellular Ca+2 ions (which form one of the constituents of the non-fibre ECM phase) are necessary for cell-cell adhesion [93, 94], proceeding as in Shuttleworth and Trucu [29, 41, 42], and Suveges et al. [30] the cancer cells self-adhesion coefficient Scc is taken here as
where Smax > 0 and Smin > 0 correspond to maximum and minimum levels of Ca+2 ions. Therefore, Scc smoothly increases from a minimal to a maximum value in order to fully explore the varying strengths of cell-cell adhesion.
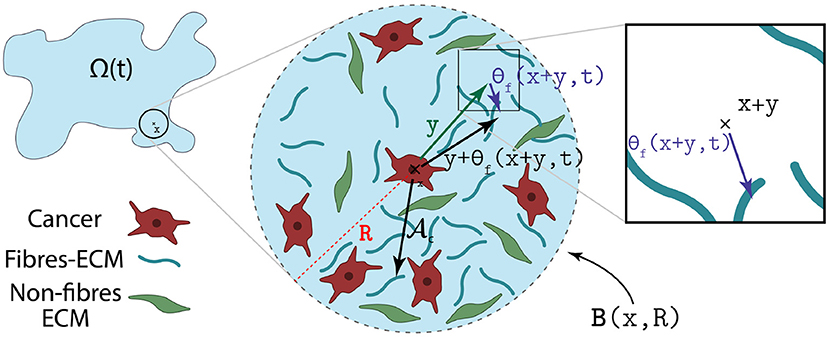
Figure 3. Illustration of how the orientation of the fibres θf(·, ·) biases the cell-fibre adhesion.
Thus, using Equations (16)–(19) the spatio-temporal dynamics of the cancer population c(x, t) is expressed as
2.1.4. Two-Phase ECM Macro-Scale Dynamics
Besides the cancer cells, both macrophage phenotypes contribute to the degradation of the ECM by secreting proteolytic enzymes [95–99] (e.g., various classes of matrix metalloproteinases). To that end, we extend the dynamics of the fibre, and non-fibre ECM components used in Suveges et al. [30] by incorporating the effects of the M1 phenotype. Thus, the dynamics of the non-fibre l(x, t) as well as the fibre ECM F(x, t) are formalised as
where βlc, βlM1, βlM2 are the positive degradation rates of the non-fibre ECM phase due to the cancer cells, M1 and M2 TAMs, respectively. Similarly, βFc, βFM1, βFM2 are all positive and describe the degradation rates of the fibre component of the ECM due to the cancer cells, M1 and M2 TAMs, respectively. Finally, in Equation (22) γ0 > 0 represents the constant rate of remodelling and γM2 > 0 is the remodelling enhancement rate induced by the M2 TAM population [85, 96, 100].
2.1.5. The Full Macro-Scale Dynamics
In summary, using Equations (3), (15), (21), and (22) the non-dimensional macro-scale dynamics is given by the following coupled PDEs
in the presence of appropriate initial conditions (such as those specified in Equation (51)) with zero-flux boundary conditions for c, M1, M2, l and F, as well as Dirichlet boundary condition (Equation 3) for the nutrients σ.
2.2. Processes on the Micro-Scales and Links Between the Scales
As the process of cancer invasion is truly a multi-scale phenomena [2], the macro-scale dynamics is tightly linked together with several micro-scale processes. Among the micro-scale processes of important for cancer invasion, of main interest for us in this work are the micro-scale rearrangement of ECM fibre micro-constituents as well as the cell-scale proteolytic processes that take place at the leading edge of the tumour. In the following, we outline the details of these two micro-dynamics as well as the naturally occurring double feedback loop that links them to the tumour macro-scale dynamics (Equation 23).
2.2.1. Fibres on the Micro-Scale and Their Bottom-Up and Top-Down Links to Macro-Dynamics
Following [29], the macroscopic oriented ECM fibres are represented not only through their amount F(x, t), but also via their spatial bias that characterise their ability to withstand incoming forces. Indeed, both of these characteristics of the ECM fibres are induced by the distribution of the non-dimensional micro-fibres f(z, t) on a cell-scale micro-domain δY(x): = x+δY of appropriate micro-scale size δ > 0, and are captured via a vector field representation [29] θf(x, t) of the ECM fibres which is defined by
where λ(·) is the Lebesgue measure in ℝd and θf, δY(x)(·, ·) is the revolving barycentral orientation with respect to the measure f(z, t)λ(·) given by Shuttleworth and Trucu [29]
Finally, the second characteristic, namely the ECM fibres amount, is given by the Euclidean norm of the vector field θf(x, t), i.e.,
and so it describes the mean-value of the micro-fibres distributed on δY(x). Therefore, the micro-scale naturally links with the macro-scale since the representation of the ECM fibres on the macro-scale is induced by the micro-scale fibre distribution, and so we refer to this as the fibres bottom-up link.
On the other hand, the macro-scale spatial fluxes, generated by the tumour macro-dynamics (Equation 23), trigger a rearrangement of the ECM fibres micro constituents on each micro-domain δY(x). Indeed, the collective migration of the cancer cells, M1 TAMS, and M2 TAMs lead naturally to the emergence of the associated spatial fluxes , , and given by
respectively. The combined action of these fluxes upon the ECM fibres distributed at (x, t) ∈ Ωt × [0, T] is felt uniformly by its constituent micro-fibres f(z, t) distributed on the associated micro-domain δY(x), consequently inducing a micro-fibres rearrangement vector similar to the ones proposed in Shuttleworth and Trucu [29] and Suveges et al. [30] of the form
which triggers a spatial redistribution of the micro-fibres in δY(x). In Equation (25), the non-linear weights ωc, ωM1, ωM2 and ωF are the associated mass factions of cancer cells, M1 TAMs, M2 TAMs, and ECM fibres at (x, t), and so these are
respectively. Ultimately, the rearrangement vector (Equation 25) induces a relocation vector νδY(x)(z, t), and as a result we can appropriately calculate the new positions of any micro-scale node z ∈ δY(x) that are given by
In Figure 4, we illustrate the micro-fibre rearrangement process by considering a typical example of these vectors while for further details we refer the reader to Shuttleworth and Trucu [29] and Suveges et al. [30]. Finally, this rearrangement of the ECM fibres at micro-scale triggered by the emergent macro-scale spatial fluxes (, , and ) establishes the fibre top-bottom link. In Figure 5, we illustrate the fibres bottom-up and top-down links, connecting the macro-scale and the ECM fibre micro-scale.
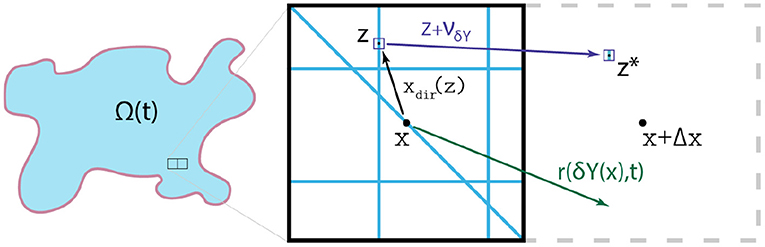
Figure 4. Typical examples of the relevant vectors xdir(z): = z − x, r(δY(x), t) and νδY(x)(z, t), allowing the redistribution of each micro-point (z, t).
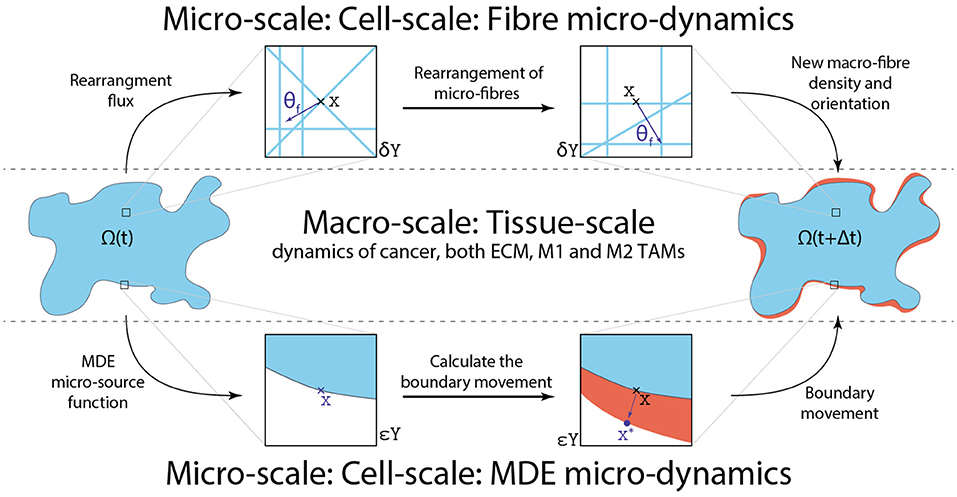
Figure 5. Schematics of the four links between the macro and both micro-scales as well as how they are linked together.
2.2.2. MDE Boundary Micro-Dynamics and Its Connections to Macro-Dynamics
The second micro-process that we consider is the proteolytic molecular processes which are driven by the secretion of matrix-degrading enzymes (MDEs) (such as matrix-metalloproteinases) and take place along the leading edge of the tumour. Indeed, besides cancer cells, both M1 and M2 TAMs within the proliferating outer rim of the tumour secrete MDEs [95–99], and this way the tissue-scale dynamics induces a source for cell-scale proteolytic activity. Once secreted, the MDE molecular population exercises a spatial transport across the tumour interface within a cell scale neighbourhood of the tumour boundary, causing degradation of the szrperitumoral ECM, and ultimately leading to changes in the tumour morphology [2]. Thus, following here the approach introduced in Trucu et al. [32], we explore the emerging spatio-temporal molecular MDEs micro-dynamics on an appropriate cell-scale neighbourhood of the tumour interface ∂Ω(t) enabled by the union of a covering bundle of cubic micro-domains , with each ϵY being of micro-scale size ϵ > 0. This allows us to decompose the MDE micro-dynamics occurring on into a union of MDE micro-processes occurring on each ϵY [32].
Therefore, considering the tumour evolution over a time perspective [t0, t0 + Δt], for an arbitrary instance t0 ∈ [0, T], and of appropriate micro-scale range Δt > 0, on any of the micro-domains we denote by m(y, τ) the spatio-temporal distribution of MDEs at micro-scale point (y, τ) ∈ ϵY × [0, Δt]. In this context, at any spatio-temporal (y, τ) ∈ (ϵY ∩ Ω(t0)) × [0, Δt], a source of MDEs arises as a collective contribution of the cancer cell and both macrophage populations from the outer proliferating rim of the tumour that are situated within a distance γh > 0 from y ∈ ϵY. Hence, denoting this micro-scale MDE source by h(y, τ), this can be formalised mathematically via the non-local expression
where B(y, γh): = {z ∈ Y|∥y − z∥∞ ≤ γh} denotes the ∥·∥∞ ball with appropriately chosen radius γh > 0 and 0 < ρ < γh is a small mollification range which smooths out the source function h(·, ·). Further, in Equation (26) hΣ is given by
where αc > 0, αM1 > 0 and αM2 > 0 are constant secretion rates of the MDEs by the cancer cells, M1 and M2 TAMs respectively. As the MDE micro-source is naturally induced by the macro-scale, this establishes a MDE top-down link between the tumour macro-dynamics and MDE-micro-dynamics occurring at the tumour interface. Finally, under the presence of the MDE source h(·, ·), the MDE micro-dynamics is given by
where Dm > 0 is the constant diffusion coefficient and n is the outward normal vector. Finally, as the patterns of significant degradation of the peritumoural ECM correspond the regions where significant levels MDEs are transported during the micro-dynamics, the micro-dynamics (Equation 27) enables us to capture to changes in tumour morphology by determining the direction of movement and magnitude of the displacement of invading cancer in the surrounding tissue [32]. Thus, the MDE micro-process induces changes in the shape of the tumour boundary ∂Ω(t0), affecting directly the macro-dynamics, which is continued on a modified tumour macro-domain Ω(t0 + Δt), for further details we refer the reader to Trucu et al. [32]. Hence, a MDE bottom-up link between the proteolytic boundary micro-dynamics and macro-scale cancer dynamics is this way established. In Figure 5, we illustrate both MDE top-down and bottom-up links that connect the macro-scale and the MDE micro-scale.
3. Numerical Approaches
In this section, we describe the numerical approach developed to solve the tumour macro-scale dynamics (Equation 23). First, to solve the quasi-steady nutrients σ equation (23f), we use the usual successive over-relaxation method with relaxation parameter ω = 0.5 and tolerance of 10−5. For the rest of the dynamics (Equations 23a–23e), we use the method of lines approach to discretise the system (Equation 23) first in space and then for the resulting ODEs, we use a non-local predictor-corrector scheme [29]. In this context, we carry out an accurate approximation of the two distinct spatial operators, namely the diffusion and adhesion operators, by using fast convolution-driven approaches. Specifically, while for the diffusion, we construct a convolution-based second-order central difference scheme [30], for the adhesion operators, we formulate a convolution-driven fifth-order weighted essentially non-oscillatory (WENO5) finite difference scheme.
Furthermore, to approximate the adhesion integrals (Equation 14 and 19), we adopt the numerical approach used in Suveges et al. [30]. Here, we omit the technical details of this method since it follows identical steps, the sole difference being that within the formulas, we use the total macrophage population, i.e., M1 + M2 TAMs instead of only the M2 TAMs population. For the same rationale, we also skip the details of the numerical method used in the MDE micro-scale, and for further details, we refer the reader to Suveges et al. [30].
To facilitate the description of the numerical approaches, let us introduce some basic notations. First, we discretise the maximal tissue cube Y ∈ ℝ2 uniformly in each direction with spatial step size Δx = Δy. Therefore, the discretisation of Y can be represented through the macro-spatial locations {(xi, yj)}i,j=1..N, with N = L/hL + 1. Then the discretised global tumour vector at any time-step n is denoted by , while the discretised nutrient field is denoted by σn. Furthermore, we denote the diffusion coefficient functions and adhesion integrals for cancer cell and TAMs by (Dc)n, (DM)n, and , respectively. Finally, with these notations, we are able to rewrite the macro-scale dynamics (Equation 23) in the following convenient form
where
3.1. Diffusion Operators:
Starting with the discretisation of the diffusion operators in Equation (28), during the computations, we first detect whether a spatial node (i, j) is inside or outside the expanding tumour domain Ω(t0) via an indicator function , with X = {1, ..., M} that is defined by
Similarly, we detect any boundary nodes using a boundary indicator function defined by
where ∂Ω(t0) is boundary of Ω(t0), and for convenience we also define the interior indicator function by
These two functions, given in Equations (30) and (31), enable us to split the domain into two parts, namely to boundary and strictly inside parts. The motivation behind this is to use two different computational technique on these parts which eventually reduces the computational cost. Hence, while for any interior node we can use the same discrete universal numerical operator (convolution), for a boundary point we need to apply unique operators due to the zero-flux boundary condition and the continuously changing tumour domain (that may result in an irregular tumour shape). Therefore, to achieve the reduction in computational cost, we accordingly split the spatial operators into two components as well, and so at any spatial node (xi, yj) ∈ Ω(t0) ⊂ Y, the diffusion operators can be represented as
In this context, the usual two dimensional second-order central difference scheme for a non-constant diffusion operator is given by
where . Further, we observe that Equation (33) can be equivalently expressed by sum of discrete convolutions and so for all interior node (xi, yj) the scheme is given by
where * is the discrete convolution and ◦ is the Hadamard product [101]. Also, in Equation (34) each , with k = 1…4 describe the average between the point (i, j) and one of its immediate neighbour and so they are defined by
Moreover, in Equation (34) and with k = 1, 2 are induced by the forward and backward differences, respectively. Hence, they are defined in both direction i (if k = 1) as well as in direction j (if k = 2) by
However, for boundary nodes, we cannot use the form Equation (34) due to the imposed zero-flux boundary condition and the continuously changing tumour domain. This is because the calculation of the diffusion operators at the boundary nodes involves the approximation of the values at any node that does not belong to the tumour domain, i.e., for any node (xi, yj) ∉ Ω(t0). In some cases, due to the irregular domain, such values may not be uniquely defined because multiple nodes can require the value of the same ghost/outside node, however, with different values. Consequently, for any boundary node, instead of the convolutional form Equation (34), we instead use the usual form Equation (33) and symmetrically reflect the values of the interior nodes to the ghost/outside nodes in a node by node fashion.
3.2. Adhesion Operators:
The other spatial operators that contribute to the motility are the adhesion operators in Equation (28). The procedure to approximate these differential operators is based on the standard WENO5 scheme proposed in Jiang and Shu [102] and Liu et al. [103]. However, it was shown [104] that these standard WENO5 schemes suffer from slight post-shock oscillations. As a consequence, we adopt here the modified WENO5 scheme proposed in Zhang and Shu [104], which uses modified smoothness indicators and is referred to as the ZSWENO scheme.
Similarly to the diffusion operator case, here we split the domain into two parts as well. However, ZSWENO schemes induce larger stencils compared to the second-order central difference scheme and so, we need to split the domain Ω(t0) into two parts differently. We refer these two parts as the inside and layer parts. First, the former one is detected by using an inside indicator function that we define by
where is defined in Equation (29) and is given by
which is induced by the fifth-order ZSWENO stencils. Then the layer part of the domain is detected by a layer indicator function formulated as
Similarly to the diffusion, using these indicator functions (Equations 37 and 38), we split the adhesion operator into two parts and so at any spatial node (xi, yj) ∈ Ω(t0) this operator is represented as
Therefore, for the inside operator , we use the usual conservative form
where , , and are the numerical fluxes at , , and , respectively. Also in Equation (40), for compact notation, and Ĝ denotes the x and y components of the vector field , respectively.
For brevity, we will only focus on defining and , and note that corresponding calculations for and follows identical steps. In this context, we split the x component of into two parts
where and . Then, we define these parts by using the popular Rusanov-type flux splitting method [105] that is given by
where we approximate , i.e., the spectral radius of the Jacobian generated by in a Jacobian-free manner, detailed in Section 3.3. To this end, let us denote by and the numerical fluxes obtained by splitting into the positive and negative parts, respectively. Then these numerical fluxes used in Equation (40) are given by the sum of their associated parts
where following the standard ZSWENO procedure, and are given by the weighted combination of the three third-order essentially non-oscillatory (ENO) approximations [102–104, 106]. Hence, they are given by
where are the non-linear weights that we will define later, are the ENO approximations given by
and similarly, are defined by
Finally, in Equations (43) and (44) are given by the Rusanov-type flux splitting method defined in Equation (41).
Since our aim is to reduce the computational cost and so for this we seek to use convolution, we observe that indeed these ENO fluxes (Equations 43 and 44) can be equivalently represented by discrete convolutions, i.e.,
where and are the induced vectors from Equations (43) and (44), and for completeness they are defined in Appendix D.
Let us now shift our attention to the non-linear weights that we used to construct the ZSWENO approximation in Equation (42). Following again the usual procedure [103], we define these weights as
where we take the usual p = 2, values [102], and define the optimal weights and as: , , and , , . Furthermore, in Equation (46) are the ZSWENO smoothness indicators [104], and the explicit formulae first for are given by
and then for , we have
Once again, in Equations (47) and (48) the positive and negative parts are defined by using the Rusanov flux splitting Equation (41). Furthermore, we can observe that these smoothness indicators (Equations (47), 48) can be equivalently expressed in terms of discrete convolutions, i.e.,
where the appropriately induced vectors and are defined in Appendix D. This completes the description of the convolution-driven ZSWENO scheme for the inside differential operators , i.e., the approximation of for all inside nodes.
However, since the adhesion operators were split into two parts in Equation (39), it remains to describe the ZSWENO scheme for the layer operator , accounting for all nodes that are considered to be in the layer part of the domain. As in Section 3.1 for the boundary diffusion operators, here we also need to appropriately approximate the value of any point that is located outside of the tumour domain Ω(t0). To this end, we symmetrically reflect the values of the interior nodes to the ghost nodes in a node by node fashion due to the irregular tumour domain. This ultimately enables us to use the standard non-convolutional ZSWENO scheme (Equations 43, 44, 47, and 48) instead of the convolutional forms Equations (45) and (49) to approximate the layer operators .
3.3. Approximation of the Propagation Speed α
Due to the complexity of , calculating its Jacobian is extremely time consuming. Hence, to find the largest eigenvalue α, we rather skip the exact evaluation of the Jacobian and choose to approximate the propagation speed in a Jacobian-free manner. For this, let us first define the eigenvalue problem by
where is the Jacobian, v is an eigenvector, and λ is an eigenvalue of J. Then in order to find the largest eigenvalue α, we solve (Equation 50) iteratively with convergence tolerance of 10−14 and with a random initial guess for v. Hence, similarly to, for instance, a Jacobian-free Newton-Krylov method [107, 108], to find λv in Equation (50) we evaluate the Jacobian-vector product Jv instead of J, which is proved to be a significantly less time-consuming task. To that end, the approximation of Jv is carried out via the first-order Taylor series expansion, and so it is given by
where ϵp is a small perturbation parameter. Since the precision is limited in the evaluation of the flux , a good choice to evaluate this small parameter ϵp is given by Knoll and Keyes [108]
where ϵmach > 0 is the machine precision.
4. Numerical Results
In this section, we present the numerical results for our multi-scale model. Hence, for the simulations let us consider a tissue domain Y = [0 × 4] × [0 × 4] and the following initial conditions:
which are illustrated in Figure 6A. Here the white curves indicate the boundary of the tumour domain ∂Ω(0). Besides these macro-scale initial conditions, we also illustrate the initial state of one micro-scale fibre domain δY(x) in Figure 6B, which is repeated for all macro-scale points. Also, the ratio between the fibre and non-fibre ECM phases are assumed to be 20% : 80% for all simulations.
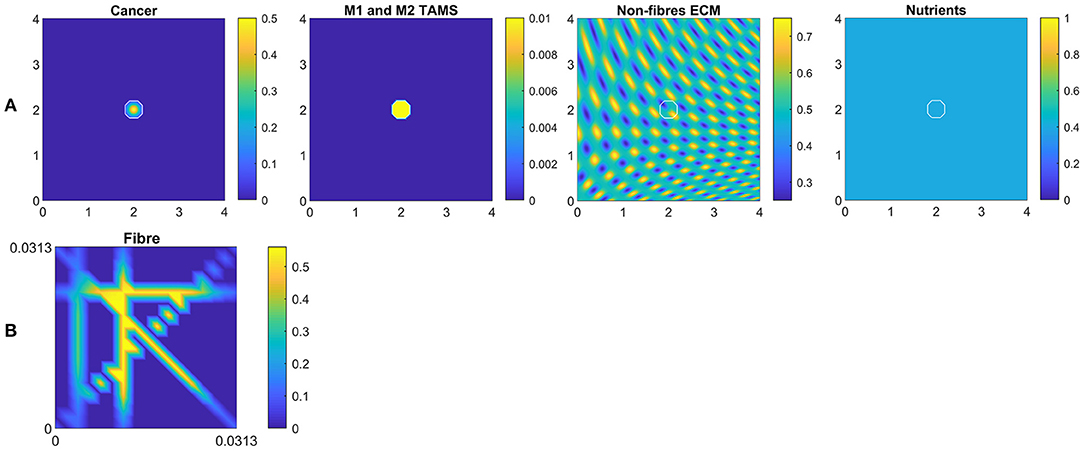
Figure 6. (A) Initial conditions of the cancer cells, both M1 and M2 TAMs, non-fibre ECM and the nutrients, respectively. (B) Initial condition of the micro-fibres on δY(x), which is repeated for all x.
Finally, all presented simulations corresponds to time 50Δt. The baseline parameters values are provided in Appendix A, and any alteration from these values will be stated accordingly.
4.1. Spatial Dependency of the Re-polarisation
First, we investigate numerically the effects of changing the re-polarisation domain Ωp(t, Rp) used in Equation (12), defined in Appendix C and illustrated in Figure 2. Hence, here we study whether the success of a M2→M1 re-polarisation strategy against the tumour is dependent on the spatial domain Ωp(t, Rp), specifically on Rp=the distance from the outer boundary ∂Ωo(t). For this let us use the radii Rp ∈ {0, Δx, 2Δx, 3Δx, 4Δx} for the re-polarisation domain Ωp(t, Rp), as well as let us start the process at time 0, i.e., we take tp = 0 in Equation (12). To further study these spatial effects, we also consider multiple tissue conditions by changing the tissue environment controller β ∈ {0.75, 0.7875, 0.825} (see Trucu et al. [32]).
To compare the resulting tumours, we measure the overall tumour mass and spread at final time 50Δt, using the total density of the cancer cells as well as the area of the tumour. Ultimately, this enables us to quantify the changes, resulted from the modification of the re-polarisation domain Ωp(t, Rp). Specifically, the overall tumour mass is measured by integrating the cancer cell density c(x, 50Δt) and the overall tumour spread as given by the area of the tumour domain Ω(50Δt).
4.1.1. Baseline Cases
In Figure 7 we present the numerical results for the baseline case characterised by the absence of M2→M1 re-polarisation. Specifically, in Figures 7A–C we investigate the no-repolarisation case in the context of different tissue environment controllers: Figure 7A β = 0.75, Figure 7B β = 0.7875, and Figure 7C β = 0.825. As we can see, at time 50Δt, the tumour is enlarged and has invaded some of its surroundings, and within the tumour domain Ω(50Δt) we observed heterogeneity in all three cell populations (cancer cell, M1 and M2 TAMs). We also notice that near M2 TAMs accumulations sites, the density of cancer cells also seems to be higher. In contrast, higher M1 TAMs density usually corresponds to both low M2 TAMs as well as low cancer cell populations. The movement and spatial distribution of tumour and immune cells are influenced directly and indirectly by the ECM fibres. For illustrative purposes, the rearranged fibre structure is portrayed by a four-fold coarsened oriented ECM fibres field in Figure 7. The peritumoral degradation of the two-phase ECM (caused by the cancer cells and both TAMs) allows the tumour to expand and spread to the neighbouring tissues, resulting in some tumour fingering patterns that vary with the controller β: higher β leads to more tumour fingering. This induces an irregular tumour domain, as well as the formation of "islands" inside the tumour, which corresponds to areas of initially low ECM density, i.e., the ECM level was too low in such areas to support tumour movement. Finally, in Figure 7, we also present the level of available nutrients. Hence, we can see that since the nutrients are only supplied through the outer boundary Ωo(t), the initial normal level of nutrients is significantly depleted (by the three cell populations) inside the tumour. This can lead to hypoxia and then eventually create a necrotic core (not modelled explicitly in this study).
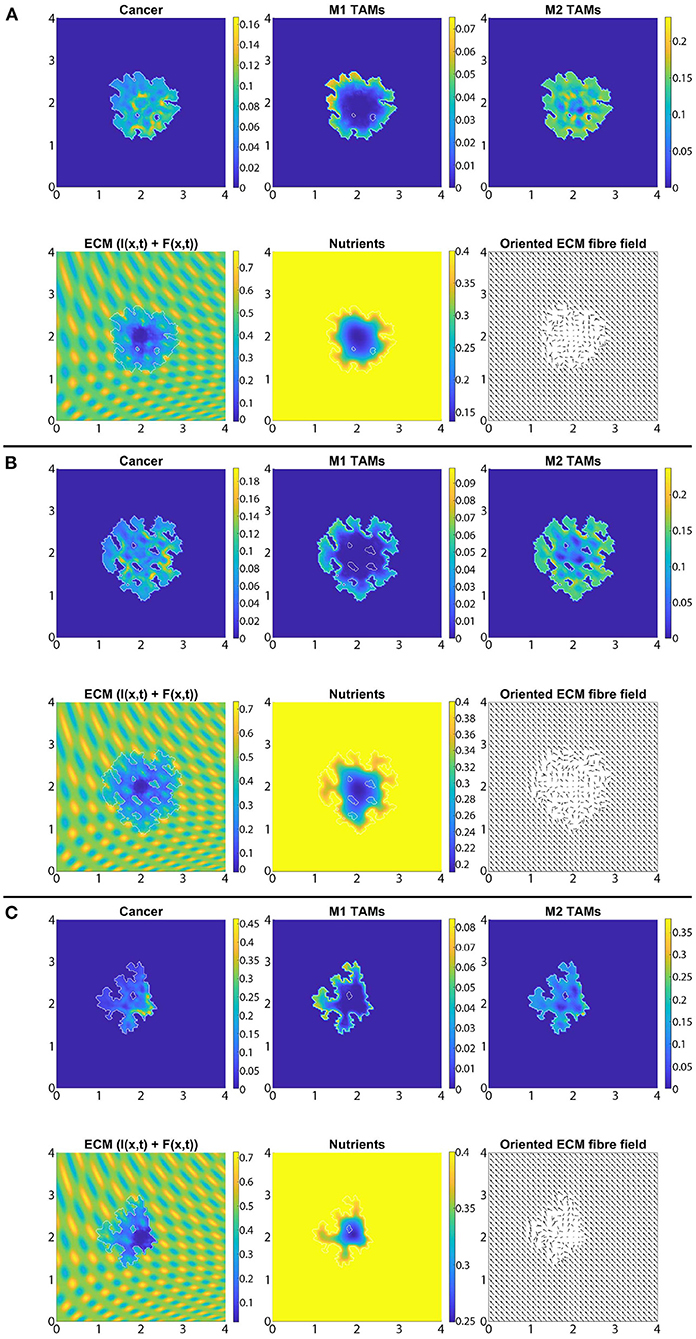
Figure 7. Baseline simulation with no macrophage re-polarisation (i.e., we set Rp = 0) at final time 50Δt. (A) β = 0.75, (B) β = 0.7875, and (C) β = 0.825.
4.1.2. The Impact of M2→M1 re-Polarisation
In Figures 8A–C, we introduce the re-polarisation of the M2 TAMs to M1 TAMs within the domain Ωp(t, Δx) (i.e., Rp = Δx), and again we investigate the role of three controller values: Figure 8A β = 0.75, Figure 8B β = 0.7875, and Figure 8C β = 0.825. While in Figure 7 the M1 TAMs mainly accumulated near the tumour boundary, in Figure 8 we see that the re-polarisation of M2 TAMs leads to an increase in the M1 TAMs population inside the tumour, leading to several accumulation sites located further away from the leading edge. In contrast, the presence of M2 TAMs inside of the tumour is decreased compared to Figure 7, and these immune cells now accumulate only in a small neighbourhood of the boundary (because we do not re-polarise M2 TAMs into M1 TAMs in a Rp = Δx neighbourhood of the boundary; see Figure 2). Since both macrophage populations interact with the cancer cells, we also see some differences in the cancer cell population and these differences depend on the degradation level of ECM as controlled by the value of β. Using two measures (spread and mass), we first focus on the β = 0.75 case and compare Figures 7A, 8A: re-polarisation leads to an ≈11% increase in tumour spread as well as an ≈20% decrease in tumour mass. Then for β = 0.7875 (Figures 7B, 8B) we observe an ≈5% reduction in spread and an ≈34% decrease in mass. Finally, for β = 0.825 (Figures 7C, 8C), the tumour spread is increased by ≈15% and the tumour mass is reduced by ≈31%. Hence, although re-polarising M2 TAMs into M1 TAMs does not show an overall improvement in terms of tumour spread, it significantly impeded the migration of the cancer cell mass from hypoxic regions to the proliferating rim as well as helped reducing the mass by killing the cancer cells. However, since Rp = Δx, the M2 TAMs are able to accumulate in a Δx neighbourhood of the interface and so we can still observe a moderate density of cancer cells near the boundary.
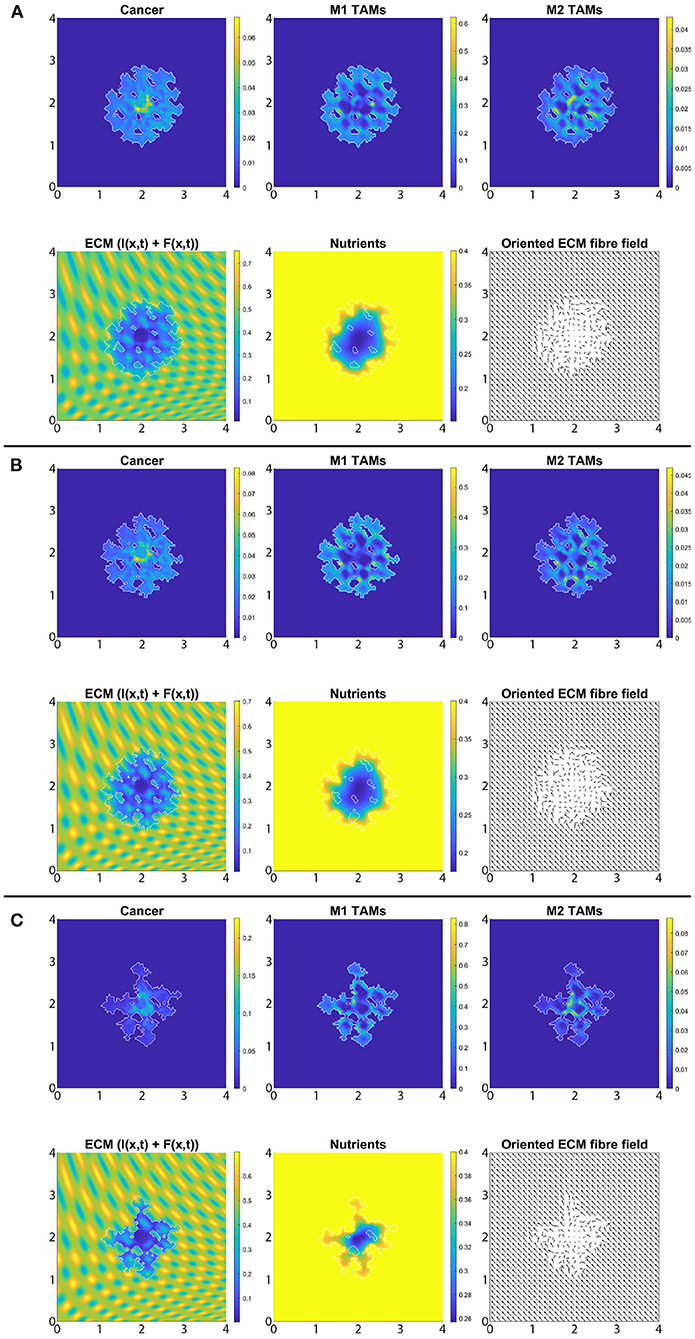
Figure 8. Simulation with re-polarisation domain Ωp(t, Δx) and with starting time tp = 0 at the final time 50Δt. (A) β = 0.75, (B) β = 0.7875, and (C) β = 0.825.
4.1.3. Tumour Spread/Mass Changes With Respect to Rp
In Figure 9 we vary Rp and present the changes in the dimensionless tumour area (spread) and mass resulted by changing the radius Rp. Specifically, in Figures 9A–C we again consider the three previously used environment controllers β = 0.75, β = 0.7875, β = 0.825. Moreover, since various types of cancers secrete MMPs at different rates [109], here we also consider high, medium and low MDE secretion rates. Finally, we vary the radii for the re-polarisation domain, Rp ∈ {0, Δx, 2Δx, 3Δx, 4Δx}, while we assume that the re-polarisation process starts at time 0, i.e., we take tp = 0. The left panels of Figure 9 show the changes in the dimensionless variable for tumour areas/spreads with respect to Rp, while the right panels show the changes in the dimensionless variables for tumour mass with respect to Rp. Here, the blue circles correspond to high ECM degradation rates (βlc = 3.0, βFc = 1.5, αc = 0.625), the orange diamonds correspond to medium degradation rates (βlc = 2.0, βFc = 1.0, αc = 0.42), and the red crosses correspond to low degradation rates (βlc = 1.0, βFc = 0.5, αc = 0.21). Comparing first the changes due to varying the tissue controller β, we can see a clear overall decrease in both tumour spread and mass as we increase β. This was seen also in Figures 7, 8, where a more prominent tumour fingering pattern was present as we increased β which resulted in a decrease in tumour spread. Furthermore, in Figures 9A–C the overall behaviour of the tumour spread does not change significantly as we vary the radius of the re-polarisation domain Rp. Hence, even though the proteolytic molecular processes at the leading tumour edge change (via the MDE source Equation 26) following the M2→M1 re-polarisation, we cannot see a clear trend in tumour spread. This might be because of the complex interactions between tumour and infiltrating immune cell populations: although we see an increase in the M1 TAMs populations near the boundary [that also secrete more MDEs than the M2 cells [110]], the overall proteolytic molecular processes at the leading edge of the tumour might not change too much, which would mean similar tumour spread. Second, the rearrangement of the micro-fibre distribution also affects tumour spread, since the amount of fibres that are being re-located near the leading edge is dependent on the fluxes generated by the different cell populations. Therefore, our model suggests that merely re-polarising the M2 TAMs into the anti-tumoral M1 phenotype might not be enough to stop tumour spread.
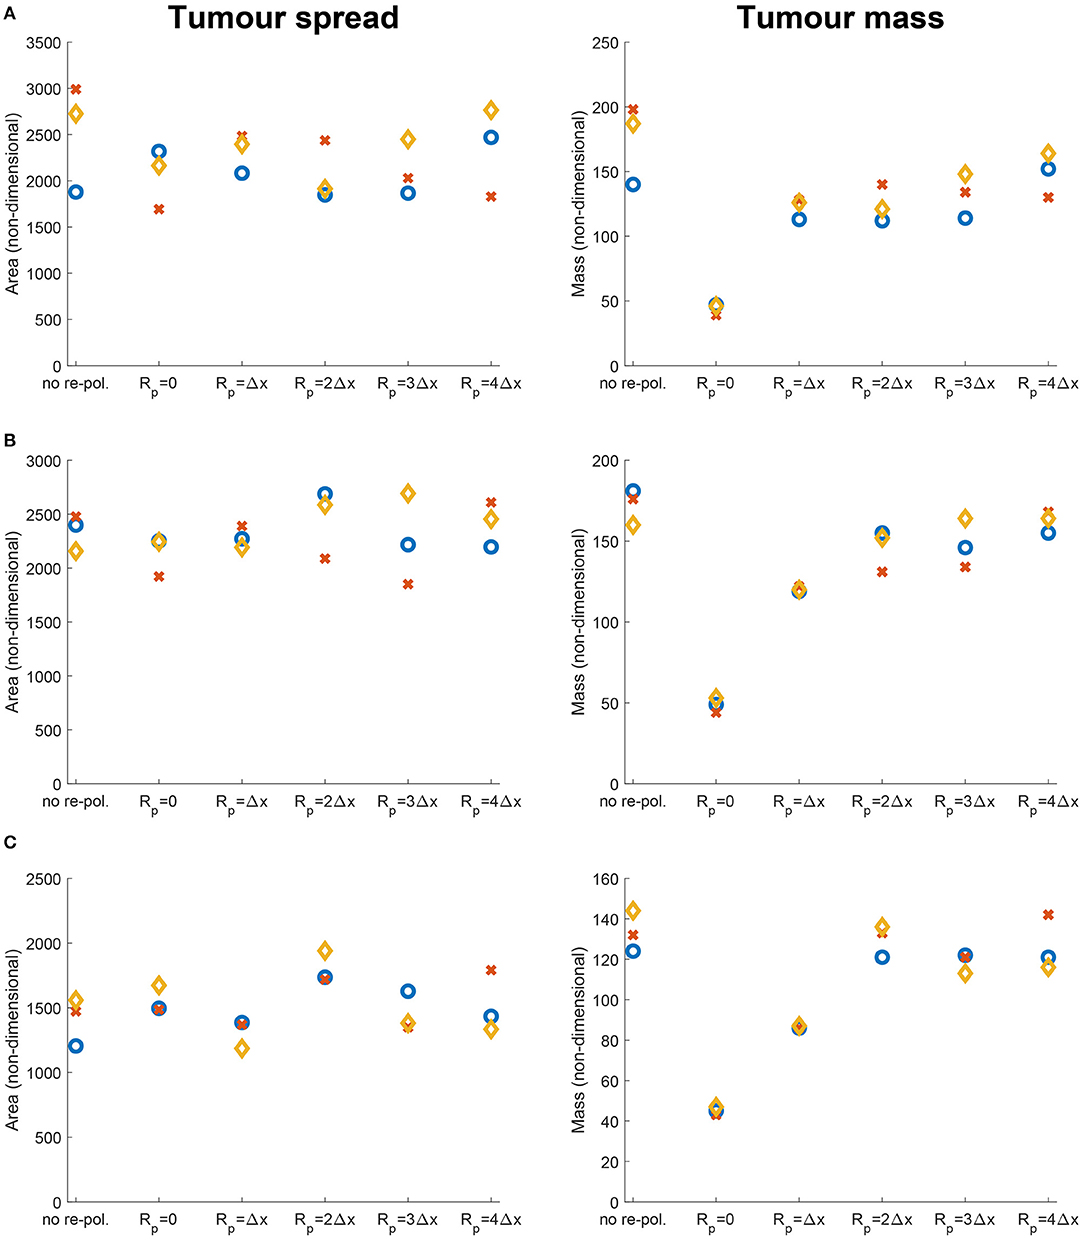
Figure 9. Results of varying the radius of the re-polarisation domain Rp ∈ {0, Δx, 2Δx, 3Δx, 4Δx} with starting time tp = 0. Left panel shows the change in the tumour spread and the right panel shows the change in tumour mass with respect to Rp. Here the blue circles correspond to a high ECM degradation rate by cancer cells (βlc = 3.0, βFc = 1.5, αc = 0.625), the orange diamonds to a medium ECM degradation rate (βlc = 2.0, βFc = 1.0, αc = 0.42) and the red crosses to a low degradation rate (βlc = 1.0, βFc = 0.5, αc = 0.21). The environment controller β is set to (A) β = 0.75, (B) β = 0.7875, and (C) β = 0.825.
On the other hand, in Figures 9A–C we see that the tumour mass is greatly reduced in all of the presented cases. These results also show that for the largest reduction we need to re-polarise the M2 TAMs inside the whole tumour domain (i.e., Rp = 0, which means that the re-polarisation domain is Ωp(t, 0) = Ω(t)). Hence, the presence of M2 TAMs in the proliferating rim may be enough to maintain the tumour mass and to induce tumour spread by leading to a moderate presence of cancer cells in the proliferating rim. In conclusion, the results in Figure 9 suggest that re-polarising M2-like macrophages to the M1 phenotype have the ability to reduce tumour mass, but we may need a supplementary strategy primarily focusing on tumour spread or tumour stroma in order to restrain tumour development.
4.2. Temporal Dependency of the Re-polarisation
Let us now concentrate on the temporal aspects of a possible re-polarisation strategy. Since in the previous section, we have shown that the M2→M1 re-polarisation impacts predominantly tumour mass, and since this effect was the strongest when Rp = 0, here we investigate the effect of changing tp on tumour mass when we re-polarise the M2 TAMs within the whole tumour domain. Thus, by varying tp used in Equation (12) we aim to investigate the effectiveness of such strategy when we introduce the re-polarisation of M2 TAMs at time tp > 0. This is crucial since tumours are only detectable above a certain size, and so a potential treatment that uses re-polarisation cannot be started at time tp = 0. To this end, in Figure 10 we present the change in the dimensionless tumour mass with respect to the re-polarisation start time tp. As before, Figure 10A corresponds to β = 0.75, Figure 10B to β = 0.8785 and Figure 10C to β = 0.825. For each of these sub-cases, the blue circle corresponds to high ECM degradation rates by cancer cells, the orange diamond to medium degradation rates, and the red cross to low degradation rates. The results in Figure 10 suggest that the lowest tumour mass can be achieved by starting the re-polarisation as soon as possible, as one would expect. However, even at moderate times, for instance at 25Δt, the tumour mass can be controlled at relatively low values. All these tumour values obtained following re-polarisation at different times tp are smaller than the tumour value obtained for no re-polarisation (see the last point on the horizontal axis in Figure 10). This indicates that a re-polarisation based strategy is not only viable when it is introduced at a very early stage, but it could also be effective even against a more advanced and larger tumour.
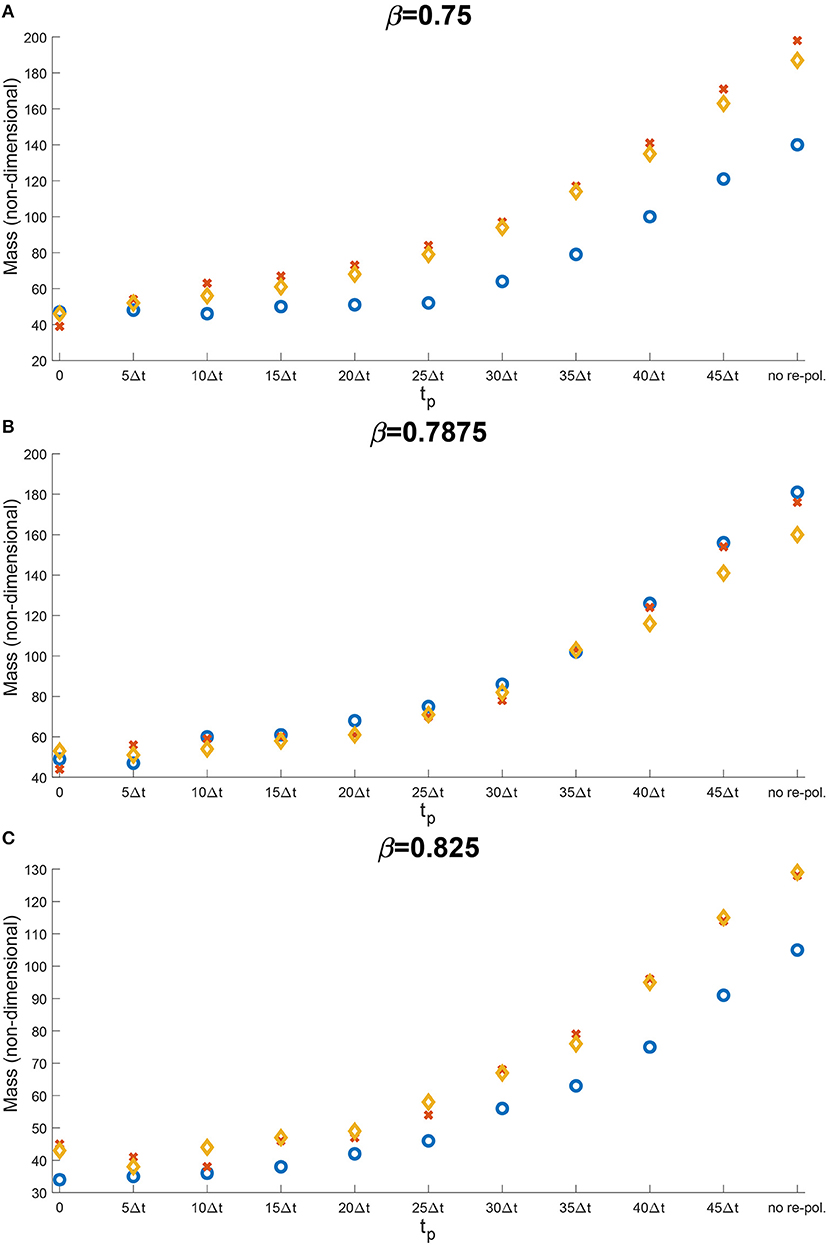
Figure 10. Results of varying the re-polarisation start time tp ∈ {0, 5Δt, …, 45Δt, 50Δt}. The blue circles correspond to a high ECM degradation rates by cancer cells (βlc = 3.0, βFc = 1.5, αc = 0.625), the orange diamonds to medium ECM degradation rates (βlc = 2.0, βFc = 1.0, αc = 0.42) and the red crosses to low ECM degradation rates (βlc = 1.0, βFc = 0.5, αc = 0.21). The environment controller β is set to (A) β = 0.75, (B) β = 0.7875, and (C) β = 0.825.
4.3. In the Absence of Nutrients
So far, we have considered the presence of nutrients and the related effect-functions within the macro-scale dynamics (Equation 23). However, here, we also investigate how the absence of these components influence the overall tumour dynamics. Hence, for the rest of this section, we take σ(x, t) ≡ 0, ∀(x, t) ∈ Y × [0, T] and Ψp(σ) ≡ 1, Ψdc(σ) ≡ 1, ΨdM(σ) ≡ 1 and ΨM(σ) ≡ 1, ∀σ and SMσ = 0. For reasons of comparability, we use the same scenarios as before, and so first, in Figure 11, we present the case of no re-polarisation and no nutrients. Although comparing Figures 7 and 11 we can observe some expected tumour morphology changes, the main difference that we would like to emphasise is that in the absence of nutrients, all three cell populations form a more homogeneous distribution. For example, while in Figure 11 there is only one cancer cell accumulation region (about (2, 2) where we centred our initial condition), in Figure 7 this is not the case, and rather cancer cells are more heterogeneously distributed throughout the tumour domain Ω(50Δt) creating various accumulation regions. Furthermore, we can also see an M2 TAMs population that penetrate the tumour deeper in the presence of nutrients. This is because in this case in Figure 11 there are no nutrients mediated movement (since SMσ = 0), and so the combination of macrophage-macrophage and macrophage-cancer adhesions is not adequate to guide the M2-like macrophages away from the boundaries in most cases. Hence, these results suggest that the nutrient mediated movement play an important, non-negligible role in guiding macrophages towards necrotic regions, which is consistent with biological experiments [59]. Moreover, in Figure 12, we introduce M2→M1 re-polarisation (with Ωp(t, Δx) and tp = 0), and so we can compare it to the results of Figure 8 where we presented the same scenario but in the presence of nutrients. By comparing these results, we can observe more homogeneous cell populations (cancer, M1 and M2 TAMs) as well as the same phenomena as before but with the M1 TAMs population (due to the re-polarisation), i.e., in the absence of macrophage-nutrient relationship (since SMσ = 0) M1-like macrophages are accumulated closer to the boundary and are less efficient in penetrating the tumour. This may be of particular interest for future mathematical models due to recent advances regarding macrophage-mediated drug delivery [111], an approach that can be used not only for tumours but for other diseases as well.
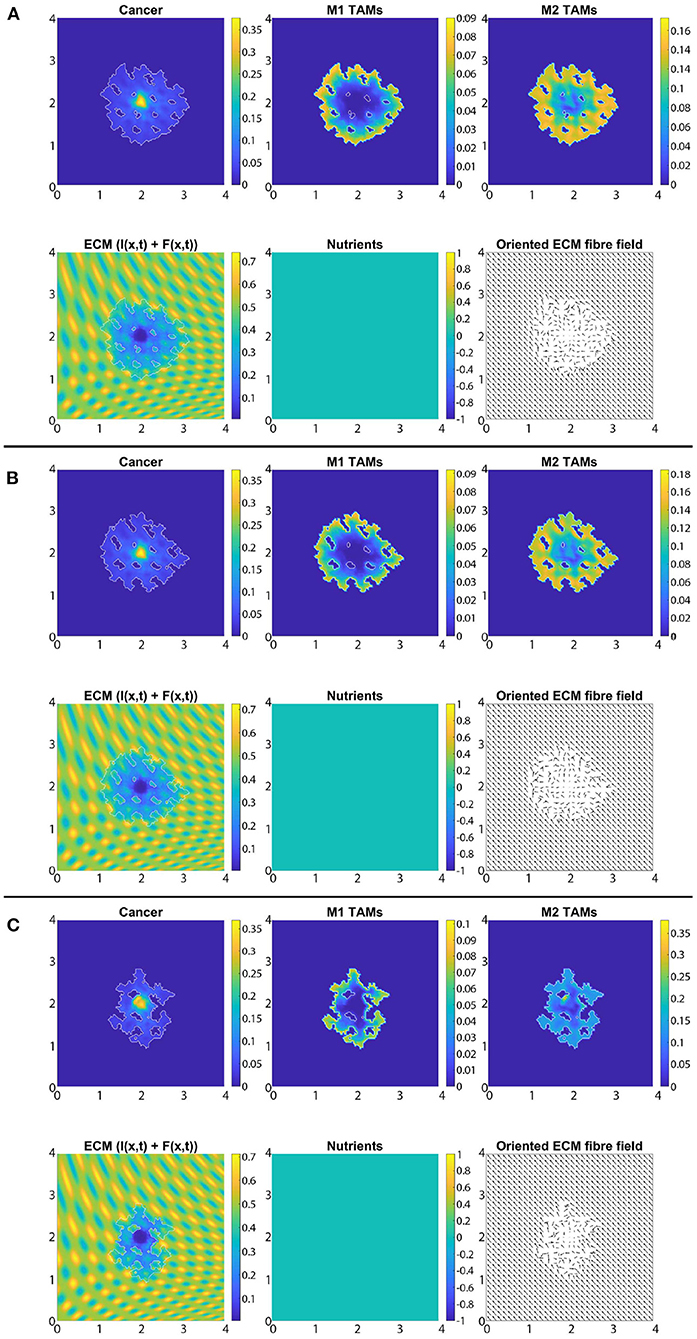
Figure 11. Baseline simulation with no macrophage re-polarisation and no nutrients (i.e., σ(x, t) ≡ 0, ∀(x, t) ∈ Y × [0, T] and Ψp(σ) ≡ 1, Ψdc(σ) ≡ 1, ΨdM(σ) ≡ 1 and ΨM(σ) ≡ 1, ∀σ and SMσ = 0) at final time 50Δt. (A) β = 0.75, (B) β = 0.7875, and (C) β = 0.825.
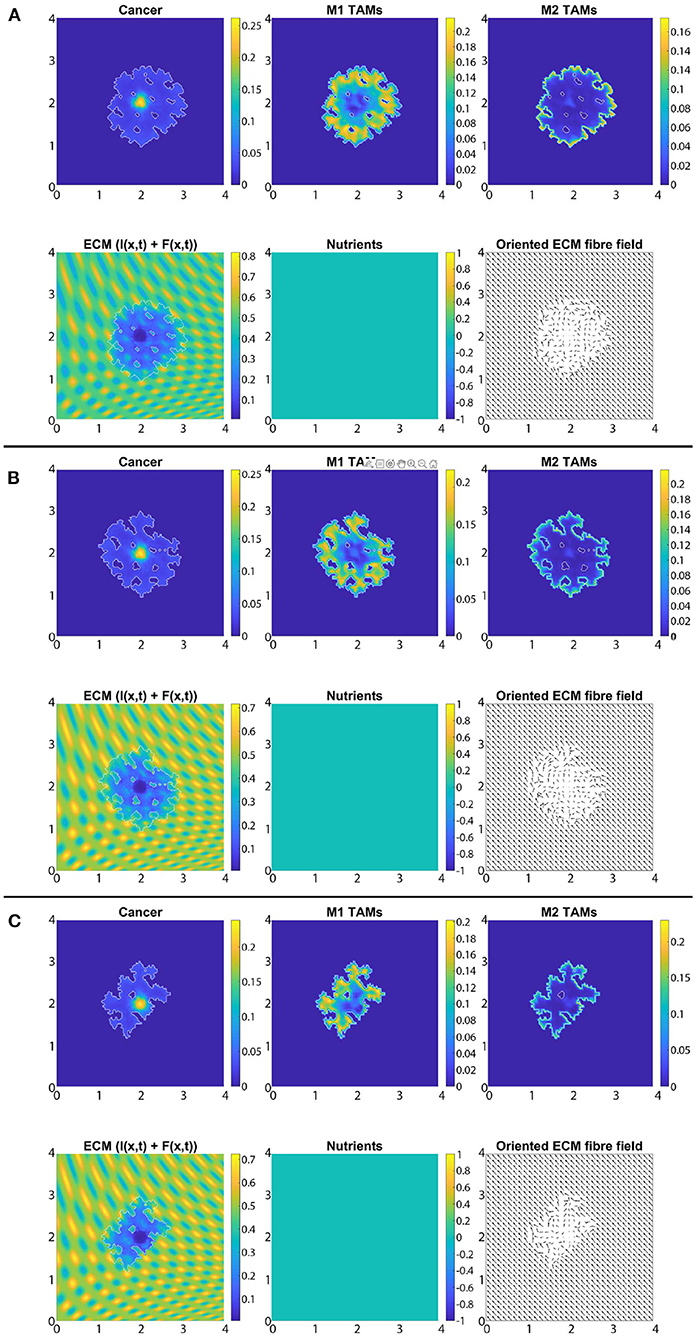
Figure 12. Simulation with re-polarisation domain Ωp(t, Δx), starting time tp = 0 and with no nutrients (i.e., σ(x, t) ≡ 0, ∀(x, t) ∈ Y × [0, T] and Ψp(σ) ≡ 1, Ψdc(σ) ≡ 1, ΨdM(σ) ≡ 1 and ΨM(σ) ≡ 1, ∀σ and SMσ = 0) at the final time 50Δt. (A) β = 0.75, (B) β = 0.7875, and (C) β = 0.825.
To investigate the effects of nutrients on the tumour spread and mass behaviour that we have seen in Figure 9, here for comparability, we also present the same scenarios but in the absence of nutrients in Figure 13. Hence, we consider the three previously used environment controllers β = 0.75, β = 0.7875, β = 0.825 with the three ECM degradation rates (high, medium and low) and present both the tumour spread and mass for each case. Although with some expected changes in the values, in Figure 13 we detect a similar behaviour as in Figure 9 that the proteolytic molecular processes at the leading edge of the tumour do not change drastically, i.e., varying the radius of the re-polarisation domain Rp does not affect tumour spread substantially. Furthermore, we find consistent results for tumour mass as well, since we achieve the greatest reduction in the case of Rp = 0 and then as we increase the radius Rp, tumour mass also increases. Therefore, our results suggest that although nutrients play an important role in the movement of both macrophage phenotype, it does not affect the features and properties of the spatial dependency of the re-polarisation, i.e., both in the presence and in the absence of nutrients the tumour spread and mass react to changes in the re-polarisation radius Rp in a similar fashion.
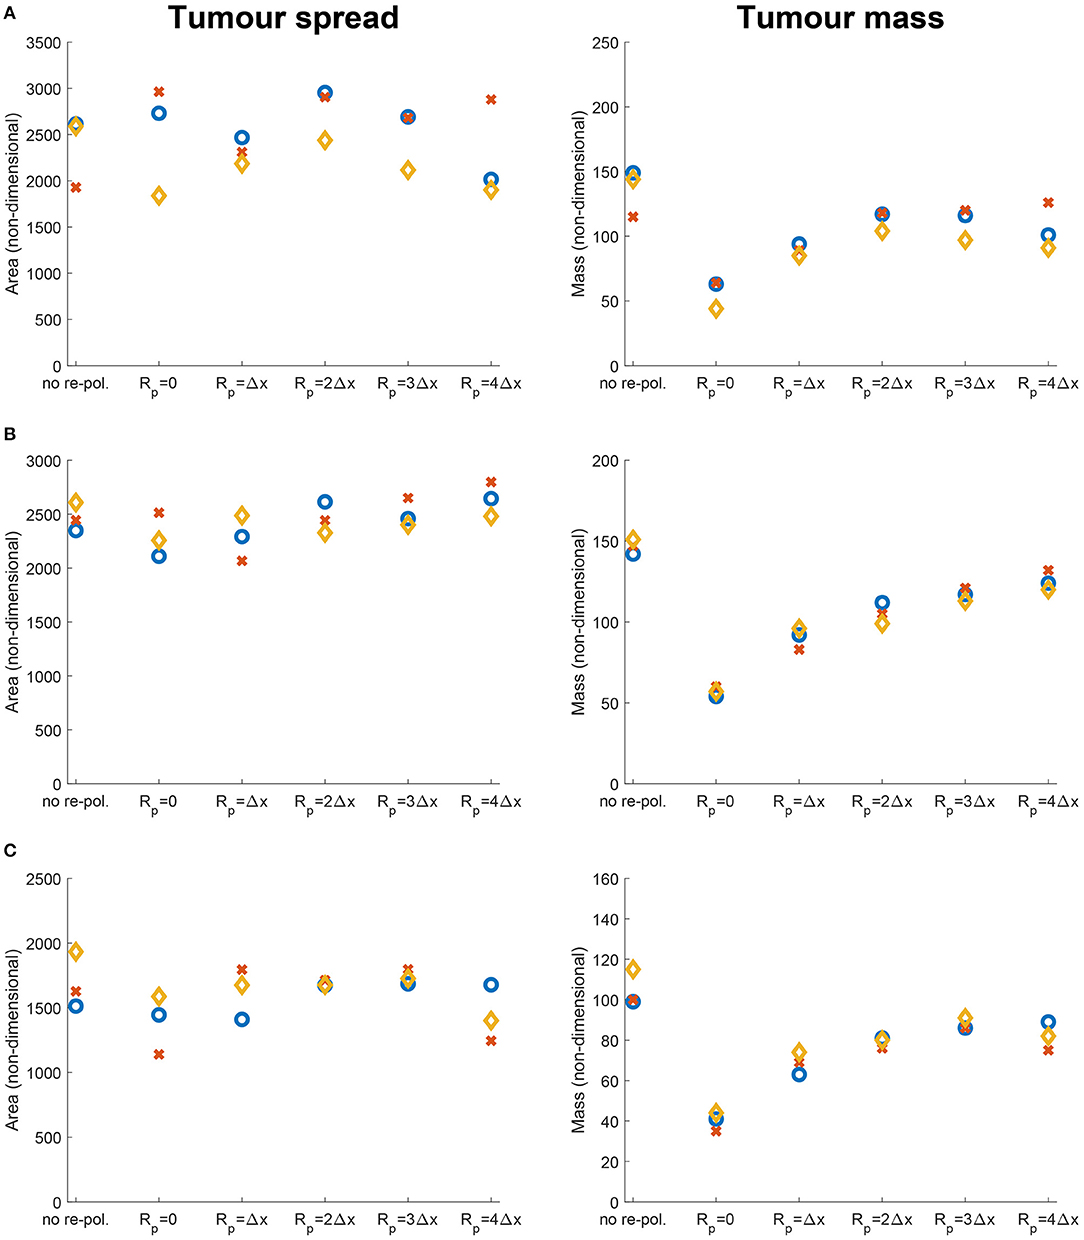
Figure 13. Results of varying the radius of the re-polarisation domain Rp ∈ {0, Δx, 2Δx, 3Δx, 4Δx} with starting time tp = 0 in the absence of nutrients (i.e., σ(x, t) ≡ 0, ∀(x, t) ∈ Y × [0, T] and Ψp(σ) ≡ 1, Ψdc(σ) ≡ 1, ΨdM(σ) ≡ 1 and ΨM(σ) ≡ 1, ∀σ and SMσ = 0). Left panel shows the change in the tumour spread and the right panel shows the change in tumour mass with respect to Rp. Here the blue circles correspond to high ECM degradation rates by cancer cells (βlc = 3.0, βFc = 1.5, αc = 0.625), the orange diamonds to medium degradation rates (βlc = 2.0, βFc = 1.0, αc = 0.42) and the red crosses to low degradation rates (βlc = 1.0, βFc = 0.5, αc = 0.21). The environment controller β is set to (A) β = 0.75, (B) β = 0.7875, and (C) β = 0.825.
5. Conclusions
In this study, we have further developed and extended a multi-scale moving boundary framework for cancer invasion [29, 30, 32] by also considering the dynamics of the anti-tumoral M1 TAMs as well as the nutrients. On one hand, we took into account the nutrients since every cell requires them to live and function properly, and so their presence is indispensable. On the other hand, we focused on the classically activated M1-like macrophages since they are known to be capable of killing cancer cells. Moreover, since macrophages are one of the most abundant immune cells in the tumour micro-environment and their plasticity enables them to switch phenotypes, they are prime candidates to assist in the fight against cancer. To this end, we investigated how the re-polarisation of the M2 TAMs into M1 TAMs can affect cancer development, by focusing especially on the macrophage populations near the leading edge of the tumour. Specifically, we studied the spatial aspect of the M2→M1 re-polarisation through the definition of a re-polarisation domain Ωp(t, Rp), and the temporal aspect via the starting re-polarisation time tp used in Equation (12). Finally, while in this work we considered the death of macrophages induced through nutritional starvation, this is only one aspect in the wider picture concerning death and survival of macrophages within the necrotic region, which so far has not been fully explored experimentally. Future mathematical modelling studies will explore other death and survival aspects involved concerning macrophages in necrotic regions.
To propose new hypotheses, we first introduced a macro-scale quasi-steady reaction-diffusion equation for the nutrients where we considered the spatial transport to be described by diffusion with constant-coefficient as well as a linear uptake rate. To account for the effect of nutrients on the different cell functions, we defined four effect-functions that we used for the rest of tumour dynamics. Furthermore, we introduced another macro-scale equation, describing the behaviour of the M1 TAMs where the motility of the M1 phenotype is represented both by random and directed movements. The rest of the equation involves an influx term, a nutrient-dependent proliferation and death laws, as well as a nutrient-dependent polarisation and a re-polarisation terms that describe the switch between the two phenotypes. Similarly to the M2 TAMs, the M1 phenotype also secrete MDEs that can degrade the ECM. Therefore, this M1 phenotype directly contributes to the re-arrangement of the micro-fibres constituents, as well as serving as a source of MDEs for the proteolytic processes that occur on the invasive edge of the tumour.
We used this extended model to explore the possibilities of macrophage re-polarisation to depend on the spatial domain as well as on time. First, in Figures 7–9 we presented the result of the spatial dependency by varying the re-polarisation domain Ωp(t, Rp). We concluded that even though the tumour spread does seems to be affected much by the M2→M1 re-polarisation (which may be expected as biological studies [110, 112, 113] have shown that M1 TAMs located in the stoma can promote cancer progression), the tumour mass can be reduced significantly. Therefore, even though we may need additional strategies directly targeting tumour spread, the tumour mass can potentially be reduced by the re-polarisation of M2 TAMs to M1 TAMs.
Finally, since tumours are only detectable above a certain size and therefore the M2→M1 re-polarisation is usually applied at later stages in tumour development, in Figure 10 we investigated the temporal dependency of M2→M1 re-polarisation. There, we showed that while the smallest tumour mass can be obtained when the re-polarisation starts as soon as possible, in some cases, it is possible to keep the tumour under control even when we re-polarise at later times. For example, in Figure 10A, for high ECM degradation levels, tumour mass did not change when tp ≤ 25Δt. However, tumour mass slowly increased as we delayed the re-polarisation time for medium and low ECM degradation. All these theoretical results suggest that macrophages re-polarisation protocols (through various immunotherapies, such as the use of agonist anti-CD40 mAb [15]) might have to be adapted to the tumour environment and the degradation levels of the ECM.
We emphasise that due to the complexity of this modelling framework, which forced us to work with a nondimensionalised model, the results in this study are only qualitative. Nevertheless, they provide new theoretical hypotheses regarding the possible roles of macrophage re-polarisation (within specific regions of the solid tumours, and within specific time scales) in the context of immunotherapies for cancer. Furthermore, while in this study we considered a generic solid tumour rather than a specific one, the findings here are in principle applicable to specific tumour types such as gliomas as we have done it also in our recent publication [114].
To conclude, we suggest that in addition to the re-polarisation of M2 TAMs, we also need additional strategies targeting tumour spread or tumour stroma in order to fully stop the tumour from advancing. In this context, it is worth mentioning that we started modelling the effect of vasculature (existing and newly growing blood vessels) on the transport of nutrients and immune cells into the tumour; but this will form the topic of a future publication. Moreover, beyond the current modelling approach, considering the time evolution of the vasculature would also allow us to gain a more comprehensive insight into the effects of nutrients on other immune cells (such as T cells), the interplay between different cells [such as cancer, TAMs and cancer-associated fibroblasts [115, 116]] and additional surplus amount of cytokines secreted by other immune cells in the tumour microenvironment. Furthermore, modelling an evolving network of blood vessels would enable us to use it as a supply of macrophages (and other cells) or create more complex hypoxic and necrotic regions that would induce further heterogeneity in all cell populations, ultimately leading to more realistic scenarios.
Data Availability Statement
The original contributions presented in the study are included in the article/Supplementary Material, further inquiries can be directed to the corresponding author.
Author Contributions
All authors listed have made a substantial, direct, and intellectual contribution to the work and approved it for publication.
Funding
The authors would like to acknowledge that this research was supported by the EPSRC DTA EP/R513192/1 grant.
Conflict of Interest
The authors declare that the research was conducted in the absence of any commercial or financial relationships that could be construed as a potential conflict of interest.
Publisher's Note
All claims expressed in this article are solely those of the authors and do not necessarily represent those of their affiliated organizations, or those of the publisher, the editors and the reviewers. Any product that may be evaluated in this article, or claim that may be made by its manufacturer, is not guaranteed or endorsed by the publisher.
Supplementary Material
The Supplementary Material for this article can be found online at: https://www.frontiersin.org/articles/10.3389/fams.2021.799650/full#supplementary-material
References
1. Henke E, Nandigama R, Ergün S. Extracellular matrix in the tumour microenvironment and its impact on cancer therapy. Front Mol Biosci. (2020) 6:160. doi: 10.3389/fmolb.2019.00160
3. Hanahan D, Weinberg RA. Hallmarks of cancer: the next generation. Cell. (2011) 144:646–74. doi: 10.1016/j.cell.2011.02.013
4. Filipe EC, Chitty JL, Cox TR. Charting the unexplored extracellular matrix in cancer. Int J Exp Pathol. (2018) 99:58–76. doi: 10.1111/iep.12269
5. Madsen DH, Bugge TH. The soure of matrix-degrading enzymes in human cancer: problems of research reproducibility and possible solutions. J Cell Biol. (2015) 209:195–8. doi: 10.1083/jcb.201501034
6. Kelly P, Davison R, Bliss E, McGee J. Macrophages in human breast disease: a quantitative immunohistochemical study. Br J Cancer. (1988) 57:174–7. doi: 10.1038/bjc.1988.36
7. Vinogradov S, Warren G, Wei X. Macrophages associated with tumours as potential targets and therapeutic intermediates. Nanomedicine. (2014) 9:695–707. doi: 10.2217/nnm.14.13
8. Liguori M, Solinas G, Germano G, Mantovani A, Allavena P. Tumor-Associated macrophages as incessant builders and destroyers of the cancer stroma. Cancers. (2011) 3:3740–61. doi: 10.3390/cancers3043740
9. Cassetta L, Noy R, Swierczak A, Sugano G, Smith H, Wiechmann L, et al. Isolation of mouse and human tumor-associated macrophages. In: Advances in Experimental Medicine and Biology. New York, NY: Springer International Publishing (2016). p. 211–29.
10. López-Janeiro Á, Padilla-Ansala C, de Andrea CE, Hardisson D, Melero I. Prognostic value of macrophage polarization markers in epithelial neoplasms and melanoma. A systematic review and meta-analysis. Mod Patho.l. (2020) 33:1458–65. doi: 10.1038/s41379-020-0534-z
11. Qiu SQ, Waaijer SJH, Zwager MC, de Vries EGE, van der Vegt B, Schröder CP. Tumor-associated macrophages in breast cancer: innocent bystander or important player? Cancer Treat Rev. (2018) 70:178–89. doi: 10.1016/j.ctrv.2018.08.010
12. Wu P, Wu D, Zhao L, Huang L, Chen G, Shen G, et al. Inverse role of distinct subsets and distribution of macrophage in lung cancer prognosis: a meta-analysis. Oncotarget. (2016) 7:40451–60. doi: 10.18632/oncotarget.9625
13. Yu M, Guan R, Hong W, Zhou Y, Lin Y, Jin H, et al. Prognostic value of tumor-associated macrophages in pancreatic cancer: a meta-analysis. Cancer Manag Res. (2019) 11:4041–58. doi: 10.2147/CMAR.S196951
14. Yuan X, Zhang J, Li D, Mao Y, Mo F, Du W, et al. Prognostic significance of tumor-associated macrophages in ovarian cancer: a meta-analysis. Gynecol Oncol. (2017) 147:181–7. doi: 10.1016/j.ygyno.2017.07.007
15. Beatty GL, Chiorean EG, Fishman MP, Saboury B, Teitelbaum UR, Sun W, et al. CD40 agonists alter tumor stroma and show efficacy against pancreatic carcinoma in mice and humans. Science. (2011) 331:1612–6. doi: 10.1126/science.1198443
16. Aras S, Zaidi MR. TAMeless traitors: macrophages in cancer progression and metastasis. Br J Cancer. (2017). 117:1583–91. doi: 10.1038/bjc.2017.356
17. Ke X, Chen C, Song Y, Cai Q, Li J, Tang Y, et al. Hypoxia modifies the polarization of macrophages and their inflammatory microenvironment, and inhibits malignant behavior in cancer cells. Oncol Lett. (2019) 18:5871–8. doi: 10.3892/ol.2019.10956
18. Gunaydin G, Gedik ME. Effects of cellular energy homeostasis modulation through AMPK on regulation of protein translation and response to hypoxia. Turkish J Biochem. (2019). 44:611–20. doi: 10.1515/tjb-2018-0338
19. Singleton DC, Macann A, Wilson WR. Therapeutic targeting of the hypoxic tumour microenvironment. Nat Rev Clin Oncol. (2021). 18:751–72. doi: 10.1038/s41571-021-00539-4
20. Anderson ARA, Chaplain MAJ, Newman EL, Steele RJC, Thompson AM. Mathematical modelling of tumour invasion and metastasis. J Theorl Medic. (2000) 2:129–54. doi: 10.1080/10273660008833042
21. Chaplain MAJ, Lolas G. Mathematical modelling of cancer cell invasion of tissue: the role of the urokinase plasminogen activation system. Math Model Meth Appl Sci. (2005) 15:1685–734. doi: 10.1142/S0218202505000947
22. Chaplain MAJ, Lolas G. Mathematical modelling of cancer invasion of tissue: dynamic heterogeneity. Netw Heterog Media. (2006) 1:399–439. doi: 10.3934/nhm.2006.1.399
23. Deisboeck TS, Wang Z, Macklin P, Cristini V. Multiscale cancer modeling. Annu Rev Biomed Eng. (2011) 13:127–55. doi: 10.1146/annurev-bioeng-071910-124729
24. Domschke P, Trucu D, Gerisch A, Chaplain M. Mathematical modelling of cancer invasion: implications of cell adhesion variability for tumour infiltrative growth patterns. J Theor Biol. (2014) 361:41–60. doi: 10.1016/j.jtbi.2014.07.010
25. Kiran KL, Jayachandran D, Lakshminarayanan S. Mathematical modelling of avascular tumour growth based on diffusion of nutrients and its validation. Can J Chem Eng. (2009) 87:732–40. doi: 10.1002/cjce.20204
26. Knútsdóttir H, Pálsson E, Edelstein-Keshet L. Mathematical model of macrophage-facilitated breast cancer cells invasion. J Theor Biol. (2014) 357:184–99. doi: 10.1016/j.jtbi.2014.04.031
27. Macklin P, McDougall SR, Anderson ARA, Chaplain MAJ, Cristini V, Lowengrub J. Multiscale modelling and nonlinear simulation of vascular tumour growth. J Math Biol. (2009) 58:765–98. doi: 10.1007/s00285-008-0216-9
28. Mahlbacher G, Curtis LT, Lowengrub J, Frieboes HB. Mathematical modelling of tumour-associated macrophage interactions with the cancer microenvironment. J Immunother Cancer. (2018) 6:10. doi: 10.1186/s40425-017-0313-7
29. Shuttleworth R, Trucu D. Multiscale modelling of fibres dynamics and cell adhesion within moving boundary cancer invasion. Bull Math Biol. (2019) 81:2176–219. doi: 10.1007/s11538-019-00598-w
30. Suveges S, Eftimie R, Trucu D. Directionality of macrophages movement in tumour invasion: a multiscale moving-boundary approach. Bull Math Biol. (2020) 82:1–50. doi: 10.1007/s11538-020-00819-7
31. Szymańska Z, Morales-Rodrigo C, Lachowicz M, Chaplain MAJ. Mathematical modelling of cancer invasion of tissue: the role and effect of nonlocal interactions. Math Mod Meth Appl S. (2009) 19:257–81. doi: 10.1142/S0218202509003425
32. Trucu D, Lin P, Chaplain MAJ, Wang Y. A multiscale moving boundary model arising in cancer invasion. Multiscale Model Simul. (2013) 11:309–35. doi: 10.1137/110839011
33. Xu J, Vilanova G, Gomez H. A mathematical model coupling tumor growth and angiogenesis. PLoS ONE. (2016) 11:e0149422. doi: 10.1371/journal.pone.0149422
34. Dallon JC, Sherratt JA, Maini PK. Mathematical modelling of extracellular matrix dynamics using discrete cells: fiber orientation and tissue regeneration. J Theor Biol. (1999) 199:449–71. doi: 10.1006/jtbi.1999.0971
35. McDougall S, Dallon J, Sherratt J, Maini P. Fibroblast migration and collagen deposition during dermal wound healing: mathematical modelling and clinical implications. Philos Trans R Soc A. (2006) 364:1385–405. doi: 10.1098/rsta.2006.1773
36. Owen MR, Byrne HM, Lewis CE. Mathematical modelling of the use of macrophages as vehicles for drug delivery to hypoxic tumour sites. J. Theor. Biol. (2004) 226:377–91. doi: 10.1016/j.jtbi.2003.09.004
37. Owen MR, Sherratt JA. Pattern formation and spatiotemporal irregularity in a model for macrophage–tumour interactions. J Theor Biol. (1997) 189:63–80. doi: 10.1006/jtbi.1997.0494
38. Owen MR, Sherratt JA. Modelling the macrophage invasion of tumours: effects on growth and composition. IMA J Math Appl Med Biol. (1998) 15:165–85. doi: 10.1093/imammb/15.2.165
39. Webb SD, Owen MR, Byrne HM, Murdoch C, Lewis CE. Macrophage-based anti-cancer therapy: modelling different modes of tumour targeting. Bull Math Biol. (2007) 69:1747–76. doi: 10.1007/s11538-006-9189-2
40. Peng L, Trucu D, Lin P, Thompson A, Chaplain MAJ. A multiscale mathematical model of tumour invasive growth. Bull Math Biol. (2017) 79:389–429. doi: 10.1007/s11538-016-0237-2
41. Shuttleworth R, Trucu D. Cell-Scale degradation of peritumoural extracellular matrix fibre network and its role within tissue-scale cancer invasion. Bull Math Biol. (2020) 82:65. doi: 10.1007/s11538-020-00732-z
42. Shuttleworth R, Trucu D. Multiscale dynamics of a heterotypic cancer cell population within a fibrous extracellular matrix. J Theor Biol. (2020) 486:110040. doi: 10.1016/j.jtbi.2019.110040
43. Lee SY, Ju K, Jeon HM, Jeong EK, Lee YJ, Kim CH, et al. Regulation of tumour progression by programmed necrosis. Oxid Med Cell Longev. (2018) 2018:3537471. doi: 10.1155/2018/3537471
44. Sakagami H, Kishino K, Amano O, Kanda Y, Kunii S, Yokote Y, et al. Cell death induced by nutritional starvation in mouse macrophage-like RAW264.7 cells. Anticancer Res. (2009) 29:343–347.
45. Mehrabi M, Amini F, Mehrabi S. Active role of the necrotic zone in desensitisation of hypoxic macrophages and regulation of CSC-fate: a hypothesis. Front Oncol. (2018) 8:235. doi: 10.3389/fonc.2018.00235
46. Tan HY, Wang N, Li S, Hong M, Wang X, Feng Y. The reactive oxygen species in macrophage polarization: reflecting its dual role in progression and treatment of human diseases. Oxid Med Cell Longev. (2016) 2016:1–16. doi: 10.1155/2016/2795090
47. Damelin SB, Miller WJ. The Mathematics of Signal Processing. Cambridge: Cambridge University Press (2011).
48. Tymoszuk P, Evens H, Marzola V, Wachowicz K, Wasmer MH, Datta S, et al. In situ proliferation contributes to accumulation of tumour-associated macrophages in spontaneous mammary tumors. Eur J Immunol. (2014) 44:2247–62. doi: 10.1002/eji.201344304
49. Hayenga HN, Adlerz K, Aranda-Espinoza H. Substrate stiffness regulates the behavior of human monocyte-derived macrophages. Biophys J. (2015) 108:306a–307a. doi: 10.1016/j.bpj.2014.11.1667
50. Cassetta L, Fragkogianni S, Sims AH, Swierczak A, Forrester LM, Zhang H, et al. Human tumor-associated macrophage and monocyte transcriptional landscapes reveal cancer-specific reprogramming, biomarkers, and therapeutic targets. Cancer Cell. (2019) 35:588–602.e10. doi: 10.1016/j.ccell.2019.02.009
51. Chitu V, Yeung Y, Yu W, Nandi S, Stanley E. Measurement of macrophage growth and differentiation. Curr Protocols Immunol. (2011) Chapter 14:Unit 14.20.1–26. doi: 10.1002/0471142735.im1420s92
52. Jenkins SJ, Ruckerl D, Cook PC, Jones LH, Finkelman FD, van Rooijen N, et al. Local macrophage proliferation, rather than recruitment from the blood, is a signature of TH2 inflammation. Science. (2011) 332:1284–8. doi: 10.1126/science.1204351
53. Becker M, Müller C, De Bastiani M, Klamt F. The prognostic impact of tumor-associated macrophages and intra-tumoral apoptosis in non-small cell lung cancer. Histol Histopathol. (2013) 29:21–31. doi: 10.14670/HH-29.21
54. da Rocha RF, Bastiani MAD, Klamt F. Bioinformatics approach to evaluate differential gene expression of M1/M2 macrophage phenotypes and antioxidant genes in atherosclerosis. Cell Biochem Biophys. (2014) 70:831–9. doi: 10.1007/s12013-014-9987-3
55. Pastuszak-Lewandoska D, Domańska-Senderowska D, Antczak A, Kordiak J, Górski P, Czarnecka KH, et al. The expression levels of IL-4/IL-13/STAT6 signaling pathway genes and SOCS3 could help to differentiate the histopathological subtypes of non-small cell lung carcinoma. Mol Diagno Therapy. (2018) 22:621–9. doi: 10.1007/s40291-018-0355-7
56. Sica A, Bronte V. Altered macrophage differentiation and immune dysfunction in tumor development. J Clin Invest. (2007) 117:1155–66. doi: 10.1172/JCI31422
57. Davis MJ, Tsang TM, Qiu Y, Dayrit JK, Freij JB, Huffnagle GB, et al. Macrophage M1/M2 polarization dynamically adapts to changes in cytokine microenvironments in cryptococcus neoformans infection. MBio. (2013) 4:3. doi: 10.1128/mBio.00264-13
58. Cui K, Ardell CL, Podolnikova NP, Yakubenko VP. Distinct migratory properties of M1, M2, and resident macrophages are regulated by αDβ2 and αMβ2 Integrin-Mediated Adhesion. Front Immunol. (2018) 9:2650. doi: 10.3389/fimmu.2018.02650
59. Murdoch C, Giannoudis A, Lewis CE. Mechanisms regulating the recruitment of macrophages into hypoxic areas of tumors and other ischemic tissues. Blood. (2004) 104:2224–34. doi: 10.1182/blood-2004-03-1109
60. Chen Q, Zhang XHF, Massagué J. Macrophage binding to receptor VCAM-1 transmits survival signals in breast cancer cells that invade the lungs. Cancer Cell. (2011) 20:538–49. doi: 10.1016/j.ccr.2011.08.025
61. Condeelis J, Pollard JW. Macrophages: obligate partners for tumor cell migration, invasion, and metastasis. Cell. (2006) 124:263–6. doi: 10.1016/j.cell.2006.01.007
62. Dutta P, Sarkissyan M, Paico K, Wu Y, Vadgama JV. MCP-1 is overexpressed in triple-negative breast cancers and drives cancer invasiveness and metastasis. Breast Cancer Res Treat. (2018) 170:477–86. doi: 10.1007/s10549-018-4760-8
63. Xuan W, Qu Q, Zheng B, Xiong S, Fan GH. The chemotaxis of M1 and M2 macrophages is regulated by different chemokines. J Leukoc Biol. (2014) 97:61–9. doi: 10.1189/jlb.1A0314-170R
65. Laird AK. Dynamics of tumour growth: comparison of growth rates and extrapolation of growth curve to one cell. Br J Cancer. (1965) 19:278–91. doi: 10.1038/bjc.1965.32
66. Tjorve KMC, Tjorve E. The use of gompertz models in growth analyses, and new gompertz-model approach: an addition to the unified-richards family. PLoS ONE. (2017) 12:e0178691. doi: 10.1371/journal.pone.0178691
67. Hu HL, Bai HS, Pan HX. Correlation between TAMs and proliferation and invasion of type I endometrial carcinoma. Asian Pacific J Trop Med. (2015) 8:643–50. doi: 10.1016/j.apjtm.2015.07.009
68. Liu H, Yang L, Qi M, Zhang J. NFAT1 enhances the effects of tumor-associated macrophages on promoting malignant melanoma growth and metastasis. Biosci Rep. (2018) 38:BSR20181604. doi: 10.1042/BSR20181604
69. Hanahan D, Weinberg RA. The hallmarks of cancer. Cell. (2000) 100:57–70. doi: 10.1016/S0092-8674(00)81683-9
70. Zhang M, Xi N, editors. Nanomedicine. Boca Raton, FL: Jenny Stanford Publishing (2019). doi: 10.1201/9780429065767
71. Blankenstein T, Qin ZH, Uberla K, Müller W, Rosen H, Volk HD, et al. Tumor suppression after tumor cell-targeted tumor necrosis factor alpha gene transfer. J Exp Med. (1991) 173:1047–52. doi: 10.1084/jem.173.5.1047
72. Lamagna C, Aurrand-Lions M, Imhof BA. Dual role of macrophages in tumor growth and angiogenesis. J Leukocyte Biol. (2006) 80:705–13. doi: 10.1189/jlb.1105656
73. MacMicking J, wen Xie Q, Nathan C. NITRIC OXIDE AND MACROPHAGE FUNCTION. Ann Rev Immunoloy. (1997) 15:323–50. doi: 10.1146/annurev.immunol.15.1.323
74. McBride WH. Phenotype and functions of intratumoral macrophages. Biochim Biophys Acta. (1986) 865:27–41. doi: 10.1016/0304-419X(86)90011-9
75. Nathan CF. Secretory products of macrophages. J Clin Invest. (1987) 79:319–26. doi: 10.1172/JCI112815
76. Allena R, Scianna M, Preziosi L. A cellular potts model of single cell migration in presence of durotaxis. Math Biosci. (2016) 275:57–70. doi: 10.1016/j.mbs.2016.02.011
77. Cheung Y, Azeloglu E, Shiovitz D, Costa K, Seliktar D, Sia S. Microscale control of stiffness in a cell-adhesive substrate using microfluidics-based lithography. Angewandte Chemie Int Edit. (2009) 48:7188–92. doi: 10.1002/anie.200900807
78. Ebata H, Moriyama K, Kuboki T, Kidoaki S. General cellular durotaxis induced with cell-scale heterogeneity of matrix-elasticity. Biomaterials. (2020) 230:119647. doi: 10.1016/j.biomaterials.2019.119647
79. Isenberg BC, DiMilla PA, Walker M, Kim S, Wong JY. Vascular Smooth muscle cell durotaxis depends on substrate stiffness gradient strength. Biophys J. (2009) 97:1313–22. doi: 10.1016/j.bpj.2009.06.021
80. Lo CM, Wang HB, Dembo M, li Wang Y. Cell movement is guided by the rigidity of the substrate. Biophys J. (2000) 79:144–52. doi: 10.1016/S0006-3495(00)76279-5
81. Raab M, Swift J, Dingal PCDP, Shah P, Shin JW, Discher DE. Crawling from soft to stiff matrix polarizes the cytoskeleton and phosphoregulates myosin-II heavy chain. J Cell Biol. (2012) 199:669–83. doi: 10.1083/jcb.201205056
82. Reinhart-King CA, Dembo M, Hammer DA. The dynamics and mechanics of endothelial cell spreading. Biophys J. (2005) 89:676–89. doi: 10.1529/biophysj.104.054320
83. Saez A, Ghibaudo M, Buguin A, Silberzan P, Ladoux B. Rigidity-driven growth and migration of epithelial cells on microstructured anisotropic substrates. Proc Natl Acad Sci USA. (2007) 104:8281–6. doi: 10.1073/pnas.0702259104
84. Trichet L, Digabel JL, Hawkins RJ, Vedula SRK, Gupta M, Ribrault C, et al. Evidence of a large-scale mechanosensing mechanism for cellular adaptation to substrate stiffness. Proc Natl Acad Sci USA. (2012) 109:6933–8. doi: 10.1073/pnas.1117810109
85. Afik R, Zigmond E, Vugman M, Klepfish M, Shimshoni E, Pasmanik-Chor M, et al. Tumor macrophages are pivotal constructors of tumor collagenous matrix. J Exp Med. (2016) 213:2315–31. doi: 10.1084/jem.20151193
86. Lee YS, Song SJ, Hong HK, Oh BY, Lee WY, Cho YB. The FBW7-MCL-1 axis is key in M1 and M2 macrophage-related colon cancer cell progression: validating the immunotherapeutic value of targeting PI3Kγ. Exp Mol Med. (2020) 52:815–31. doi: 10.1038/s12276-020-0436-7
87. Huda S, Weigelin B, Wolf K, Tretiakov KV, Polev K, Wilk G, et al. Lévy-like movement patterns of metastatic cancer cells revealed in microfabricated systems and implicated in vivo. Nat Commun. (2018) 9:4539–9. doi: 10.1038/s41467-018-06563-w
88. Petrie RJ, Doyle AD, Yamada KM. Random versus directionally persistent cell migration. Nat Rev Mol Cell Biol. (2009) 10:538–49. doi: 10.1038/nrm2729
89. Weiger MC, Vedham V, Stuelten CH, Shou K, Herrera M, Sato M, et al. Real-time motion analysis reveals cell directionality as an indicator of breast cancer progression. PLoS ONE. (2013) 8:e0058859. doi: 10.1371/journal.pone.0058859
90. Wu PH, Giri A, Sun SX, Wirtz D. Three-dimensional cell migration does not follow a random walk. Proc Nat Acad Sci USA. (2014) 111:3949–54. doi: 10.1073/pnas.1318967111
91. Wolf K, Friedl P. Extracellular matrix determinants of proteolytic and non-proteolytic cell migration. Tren Cel Biol. (2011) 21:736–44. doi: 10.1016/j.tcb.2011.09.006
92. Gras SL. Chapter 6 - surface- and solution-based assembly of amyloid fibrils for biomedical and nanotechnology applications. In: Koopmans RJ, editor. Engineering Aspects of Self-Organizing Materials. vol. 35 of Advances in Chemical Engineering. San Diego, CA: Academic Press (2009). p. 161–209. doi: 10.1016/S0065-2377(08)00206-8
93. Gu Z, Liu F, Tonkova EA, Lee SY, Tschumperlin DJ, Brenner MB, et al. Soft matrix is a natural stimulator for cellular invasiveness. Mol Biol Cell. (2014) 25:457–69. doi: 10.1091/mbc.e13-05-0260
94. Hofer AM, Curci S, Doble MA, Brown EM, Soybel DI. Intercellular communication mediated by the extracellular calcium-sensing receptor. Nat Cell Biol. (2000) 2:392–8. doi: 10.1038/35017020
95. Dollery C, Libby P. Atherosclerosis and proteinase activation. Cardiovasc Res. (2006) 69:625–35. doi: 10.1016/j.cardiores.2005.11.003
96. Goswami KK, Ghosh T, Ghosh S, Sarkar M, Bose A, Baral R. Tumor promoting role of anti-tumor macrophages in tumor microenvironment. Cell Immunol. (2017) 316:1–10. doi: 10.1016/j.cellimm.2017.04.005
97. Madsen DH, Jürgensen HJ, Siersbæk MS, Kuczek DE, Cloud LG, Liu S, et al. Tumor-Associated macrophages derived from circulating inflammatory monocytes degrade collagen through cellular uptake. Cell Rep. (2017) 21:3662–71. doi: 10.1016/j.celrep.2017.12.011
98. Newby AC. Metalloproteinase expression in monocytes and macrophages and its relationship to atherosclerotic plaque instability. Arterioscler Thrombosis Vascular Biol. (2008) 28:2108–14. doi: 10.1161/ATVBAHA.108.173898
99. Rath B, Klameth L, Plangger A, Hochmair M, Ulsperger E, Huk I, et al. Expression of proteolytic enzymes by small cell lung cancer circulating tumor cell lines. Cancers. (2019) 11:114. doi: 10.3390/cancers11010114
100. Springer NL, Fischbach C. Biomaterials approaches to modeling macrophage–extracellular matrix interactions in the tumor microenvironment. Curr Opin Biotechnol. (2016) 40:16–23. doi: 10.1016/j.copbio.2016.02.003
101. Golub GH, van Loan CF. Matrix Computations. 4th ed. JHU Press (2013). Available online at: http://www.cs.cornell.edu/cv/GVL4/golubandvanloan.htm.
102. Jiang GS, Shu CW. Efficient implementation of weighted eno schemes. J Comput Phys. (1996) 126:202–28. doi: 10.1006/jcph.1996.0130
103. Liu XD, Osher S, Chan T. Weighted essentially non-oscillatory schemes. J Comput Phys. (1994) 115:200–12. doi: 10.1006/jcph.1994.1187
104. Zhang S, Shu CW. A new smoothness indicator for the weno schemes and its effect on the convergence to steady state solutions. J Sci Comput. (2006) 31:273–305. doi: 10.1007/s10915-006-9111-y
105. Rusanov VV. The calculation of the interaction of non-stationary shock waves and obstacles. USSR Comput Math Math Phys. (1962) 1:304–20. doi: 10.1016/0041-5553(62)90062-9
106. Kim D, Kwon JH. A high-order accurate hybrid scheme using a central flux scheme and a WENO scheme for compressible flowfield analysis. J Comput Phys. (2005) 210:554–83. doi: 10.1016/j.jcp.2005.04.023
107. Kelley CT. Solving Nonlinear Equations with Newton's Method. Philadelphia, PA: Society for Industrial and Applied Mathematics (2003). doi: 10.1137/1.9780898718898
108. Knoll DA, Keyes DE. Jacobian-free Newton–Krylov methods: a survey of approaches and applications. J Comput Phys. (2004) 193:357–97. doi: 10.1016/j.jcp.2003.08.010
109. Gobin E, Bagwell K, Wagner J, Mysona D, Sandirasegarane S, Smith N, et al. A pan-cancer perspective of matrix metalloproteases (MMP) gene expression profile and their diagnostic/prognostic potential. BMC Cancer. (2019) 19:581. doi: 10.1186/s12885-019-5768-0
110. Hedbrant A, Wijkander J, Seidal T, Delbro D, Erlandsson A. Macrophages of M1 phenotype have properties that influence lung cancer cell progression. Tumor Biol. (2015) 36:8715–25. doi: 10.1007/s13277-015-3630-9
111. Liang T, Zhang R, Liu X, Ding Q, Wu S, Li C, et al. Recent advances in macrophage-mediated drug delivery systems. Int J Nanomedicine. (2021) 16:2703–14. doi: 10.2147/IJN.S298159
112. Ma J, Liu L, Che G, Yu N, Dai F, You Z. The M1 form of tumor-associated macrophages in non-small cell lung cancer is positively associated with survival time. BMC Cancer. (2010) 10:112. doi: 10.1186/1471-2407-10-112
113. Ohri CM, Shikotra A, Green RH, Waller DA, Bradding P. Macrophages within NSCLC tumour islets are predominantly of a cytotoxic M1 phenotype associated with extended survival. Eur Respirat J. (2009) 33:118–26. doi: 10.1183/09031936.00065708
114. Suveges S, Hossain-Ibrahim K, Steele JD, Eftimie R, Trucu D. Mathematical modelling of glioblastomas invasion within the brain: a 3D multi-scale moving-boundary approach. Mathematics. (2021). 9:2214. doi: 10.3390/math9182214
115. Gunaydin G. CAFs interacting with TAMs in tumor microenvironment to enhance tumorigenesis and immune evasion. Front Oncol. (2021). 11:668349. doi: 10.3389/fonc.2021.668349
Keywords: collective cancer cell movement, cancer invasion, macrophages, macrophage re-polarisation, multi-scale modelling, cell adhesions, WENO schemes, convolution
Citation: Suveges S, Eftimie R and Trucu D (2022) Re-polarisation of Macrophages Within Collective Tumour Cell Migration: A Multiscale Moving Boundary Approach. Front. Appl. Math. Stat. 7:799650. doi: 10.3389/fams.2021.799650
Received: 21 September 2021; Accepted: 24 December 2021;
Published: 01 February 2022.
Edited by:
Subhas Khajanchi, Presidency University, IndiaReviewed by:
Gurcan Gunaydin, Hacettepe University, TurkeyHaralampos Hatzikirou, Khalifa University, United Arab Emirates
Copyright © 2022 Suveges, Eftimie and Trucu. This is an open-access article distributed under the terms of the Creative Commons Attribution License (CC BY). The use, distribution or reproduction in other forums is permitted, provided the original author(s) and the copyright owner(s) are credited and that the original publication in this journal is cited, in accordance with accepted academic practice. No use, distribution or reproduction is permitted which does not comply with these terms.
*Correspondence: Dumitru Trucu, dHJ1Y3VAbWF0aHMuZHVuZGVlLmFjLnVr