 Sidy Danioko
 Jianwei Zheng
 Kyle Anderson
 Cyril S. Rakovski
- Schmid College of Science and Technology, Chapman University, Orange, CA, United States
The classical Box-Pierce and Ljung-Box tests for auto-correlation of residuals possess severe deviations from nominal type I error rates. Previous studies have attempted to address this issue by either revising existing tests or designing new techniques. The Adjusted Box-Pierce achieves the best results with respect to attaining type I error rates closer to nominal values. This research paper proposes a further correction to the adjusted Box-Pierce test that possesses near perfect type I error rates. The approach is based on an inflation of the rejection region for all sample sizes and lags calculated via a linear model applied to simulated data that encompasses a large range of data scenarios. Our results show that the new approach possesses the best type I error rates of all goodness-of-fit time series statistics.
1. Introduction
The Box-Jenkins algorithm is a1 general systematic approach for model checking of a time series model. Examples of the approach can be found in [1–3]. A well-fitting model produces residuals that are free of correlation. Thus, standard goodness-of-fit approaches are in essence global tests for absence of correlation among estimated residuals. Accordingly, many statistical techniques have been designed to assess the absence of correlation among the time series model residuals.
Following classical notation, let {Xt} be an observed time series generated by a stationary and invertible ARMA(p,q) process ϕ(B)Xt = θ(B)ϵt, where ϕ(B) and θ(B) are the autoregressive and moving average characteristic polynomial and is the backshift operator. The desired parameters, ϕi and θi are estimated using maximum likelihood or least squares methods to obtain and , the residuals are calculated via and the sample auto-correlation coefficients are in turn obtained from .
In recent years, many techniques have been employed to test the global hypothesis of all autocorrelations up to a certain lag, H0 : r1 = r2 = … = rm = 0. In general, these techniques are designed as weighted sums of squares of the estimated autocorrelations and they can produce misleading conclusions due to deviations from the asymptotic limiting distribution in moderate size samples [4–6]. Thus, a new and more robust test is proposed in this research that attains precise type I error rates for all sample sizes.
The history of portmanteau tests traces its roots back to the Box-Pierce diagnostic test defined as [6, 7]:
where n, m, and represent the sample size, number of lags being tested and the sample auto-correlation of order k of the residuals, respectively. The authors showed that the asymptotic distribution of QBP is approximately χ2(m-p-q) but considerable deviations for moderate sample sizes have been observed [7–9]. That deficiency entails imperfections of type I error rates and prompted the design of a weighted and improved versions of the test. In their stimulation studies, Ray and Xiaolou [4] focused on investigating the type I errors in the setting. They remarked that the Box-Pierce test has imperfect type I error rates for most sample size and lag values.
Ljung and Box [7] were the first ones to propose a design that assigns larger weights to residuals estimated with more data:
The Box-Pierce and Ljung-Box tests are asymptotically equivalent. The Ljung-Box test has been shown to overcorrect in moderate samples [4]. They also realized that Ljung-Box inflates the test statistic using a variance estimate of the residuals. They further showed that on moderate sized data, QLB rejects too often because the test statistic is too small.
Li and McLeod [9] refined the QBP test by proposing the following statistic,
This approach only corrects the mean of the Box-Pierce statistic and consequently fails to properly adjust the type I error rates.
Monti [10] proposed a portmanteau test based on the residual partial autocorrelations. The test is defined as,
Monti [10] showed via simulations that the performance of QM is comparable to that QLB. In addition, he concluded that in certain scenarios, QLB outperforms QM.
Peña and Rodríguez [11] proposed a test based on a different measure of dependence of the residual autocorrelations,
where
In their work, the authors showed that under particular conditions, their test greatly outperformed QLB test. Furthermore, they demonstrated that the test had an advantage over the McLeod and Li's test regardless of sample size. However, the convergence of the asymptotic distribution of the test developed by Peña and Rodríguez is very slow [12].
Fisher proposed new weighted versions of the Box-Pierce and Monti's tests, the Q statistic [5]:
and
A comparison simulation study by Safi and Al-Reqep [13] showed that for small sample size and m values QWL performs better than QLB. For moderate sample sized data, they also found that QWL does better than QLB and QWM outperforms QM.
To remedy some of the shortcomings of all previously existing tests, Kan and Wang [4] proposed a new modification of the portmanteau test, widely called the adjusted Box-Pierce test. They defined their statistic as,
The authors conducted an evaluation of various tests including Box-Pierce and Ljung-Box. The design of the adjusted Box-Pierce statistic (9) explicitly recenters and rescales QBP to attain the mean and variance of a χ2(m) variable. The authors showed through simulations that the test possesses very good adherence to nominal type I error rates. In their comparison study, they found that both the distributions of QBP and QLB deviate from the expected variance of χ2(m) distribution for small and moderate sample sizes and almost all choices for the value of m.
All of the above-mentioned tests exhibit deviations from the nominal type I error rates that compromise their performance. Hassani and Yeganegi [14, 15] conducted simulation studies to evaluate the optimal lag value for the Ljung-Box test. They found that the optimal number of lags not only depends on the length of the time series, but also on the significance level of the test. Thus, a new approach is proposed which aims at correcting the rejection region instead of redesigning the test statistic itself. This technique was introduced by Bernard in his effort to construct a more powerful alternative to Fisher's exact test [16, 17] and later by Boschloo [18]. The same idea of rejection region correction has been recently employed by Ehwerhemuepha et al. [19] to produce the best performing test for homogeneity for multinational distributions.
2. Methods
A model based correction of the rejection region of the adjusted Box-Pierce test was designed. A large scale simulation study was then conducted to not only estimate the correction, but to also assess the performance advantages (defined as adherence to the nominal type I error rates for all scenarios) of the proposed corrected method.
2.1. Simulation Study
For sample size values of n = 40, 50, …, 300, we simulated 106 white noise samples, . These mimic the behavior of residuals of a well-fitting time series model (under the null). Next, the adjusted Box-Pierce test was applied to every sample and for all possible lags, m (2 ≤ m ≤ n−1) and the corresponding p-values, were obtained. For each pair (n, m), the estimated the type I error rate of the adjusted Box-Pierce test at alpha level of 0.05 was empirically estimated by . Thus, for each sample size n, n−2 empirically estimated type I error rates yielding a dataset with three columns, n, m, and . Further, these datasets obtained from all individual sample sizes n were stacked to get an aggregated dataset with number of rows .
2.2. Linear Model
The primary idea of this study was to provide a model-based correction to the rejection region of the adjusted Box-Pierce test in order to attain improved type I error rates for all sample sizes and lags. We created six linear regression models trained on the simulated data described in the section above. These six models were trained on different subsets of the data split into sample size intervals [0, 50], [51, 70], [71, 90], [91, 120], [121, 200], and [201, 300]. The difference in the type I error rate patterns for distinct sample seizes (shown in Figure 1) necessitated the use of separate models to achieve the desired level of fit. These linear models are complex as they encompass different powers of n, m, and their 2-way interactions. The general formula adopted for the models was,
Further, within the general form (10) an extensive grid search to find the best values of the power transformation parameters s and p was performed. The type I error rates from the selected best models are presented in Table 1. The rates were calculated using validation data with sample sizes of nval = 45, 65, 85, 100, 250.
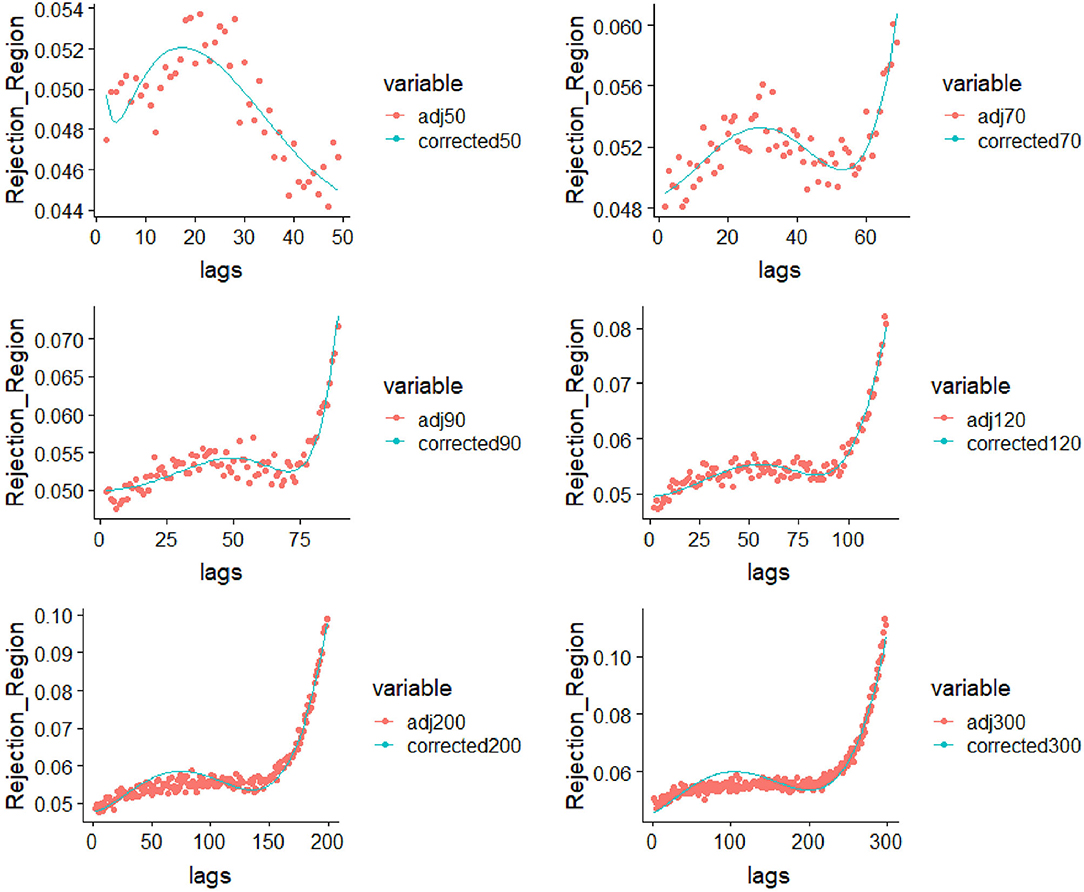
Figure 1. Parametric correction to the rejection region for sample sizes 50, 70, 90, 130, 200, and 300.
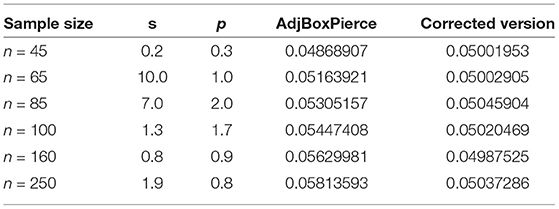
Table 1. Performance summary of the correction to the Adjusted Box-Pierce.
3. Results
Noticeable differences between the patterns of type I error rates across the analyzed sample sizes (40–300) were discovered. Therefore, sample-size specific models (0–50, 51–70, 71–90, 91–120, 120–200, 201–300) were constructed to capture the exact pattern for that particular scenario. Table 1 displays a condensed form of the comparative study between revised version of Box-Pierce, which to the best of our knowledge is the last version, and the correction that we have brought into the study. For different time series lengths, the corresponding s- and p-values along with the type I error rates for the adjusted Box-Pierce and those of the corrected version that we designed. It is important to realize that the results from the implementation of these models show that in all settings, the proposed regression-based correction provided almost perfect type I error rates. In particular, the adjusted type I error rates after the correction to the rejection regions were exactly 0.05 with detailed results.
Tables 2–7 show detailed summary from the sample-size specific model fits. These models provide a parametric correction of the type I error rates. Graphical representation of results from the implementation of these models for several scenarios are shown in Figure 1.
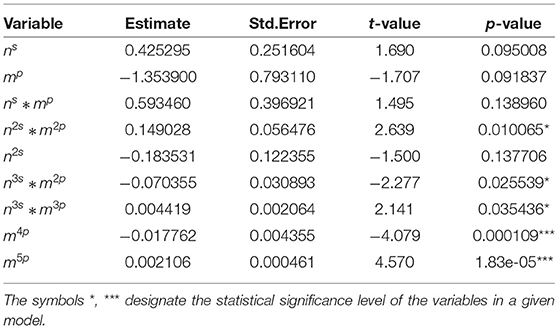
Table 2. Summary statistics for selected variables in interval sample size <50.
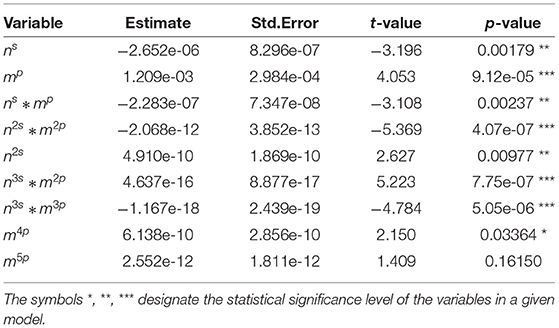
Table 3. Summary statistics for selected variables in finite sample size between 51 and 70.
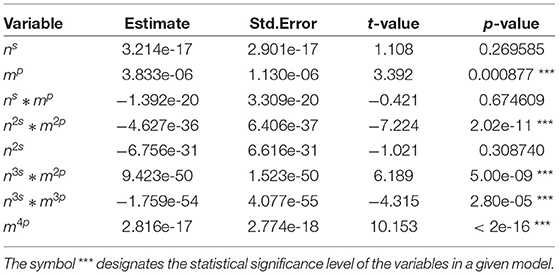
Table 4. Summary statistics for selected variables in finite sample size between 71 and 90.
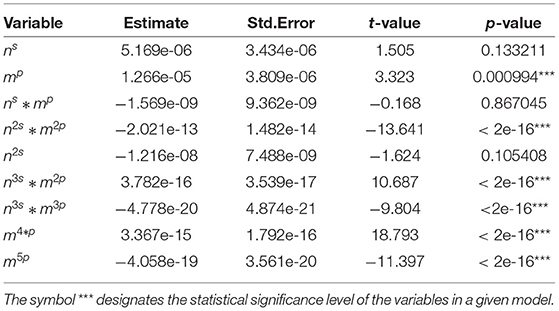
Table 5. Summary statistics for selected variables in finite sample size between 91 and 120.
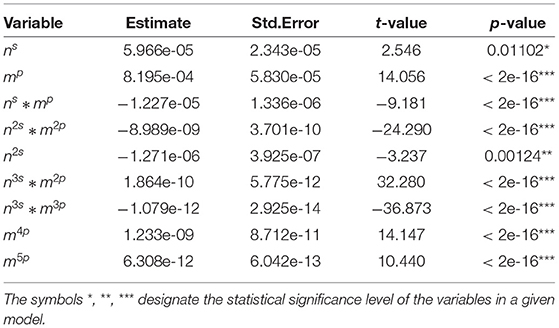
Table 6. Summary statistics for selected variables in finite sample size between 121 and 200.
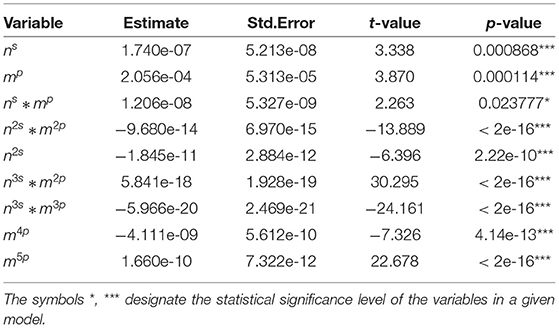
Table 7. Summary statistics for selected variables in finite sample size between 201 and 300.
Form left-to-right-up-to-down the fitting curves with appropriately found models in cases where (n = 50, 70, 90, 120, 300) can be viewed. Empirically, it can be seen that the models that best fit the specific curve in a given data were found.
4. Data Example
An application of our corrected version of the adjusted Box-Pierce test was performed using S&P 500 stock data. We provide instances of both false positive and false negative results obtained by the standard adjusted Box-Pierce test using EQT Corporation stock. This corporation created in 1884 and headquartered in Pittsburg is one of the leading companies extensively devoted to the exploration and transportation of hydrocarbon (Petroleum, natural gas, natural gas liquid). The average daily price of the EQT Corporation was calculated by collecting its opening and closing prices over a period over 8 years (2010–2018). For a window size of 50, numerous false negative and false positive points were found at different lags. In this case, instead of a critical value we have a critical boundary or curve exists. In this setting, the same rejection conditions are the same as in the normal case.
In Figure 2, instances of a false positive rejection at lag 26 are shown where the adjusted Box-Pierce test obtains a p-value of 0.0504 but the proposed model correction inflates the rejection region to start at 0.058. The graph also shows a false negative results with p-value of 0.046 at lag 47. However, the proposed correction shrinks the rejection region to start at 0.045.
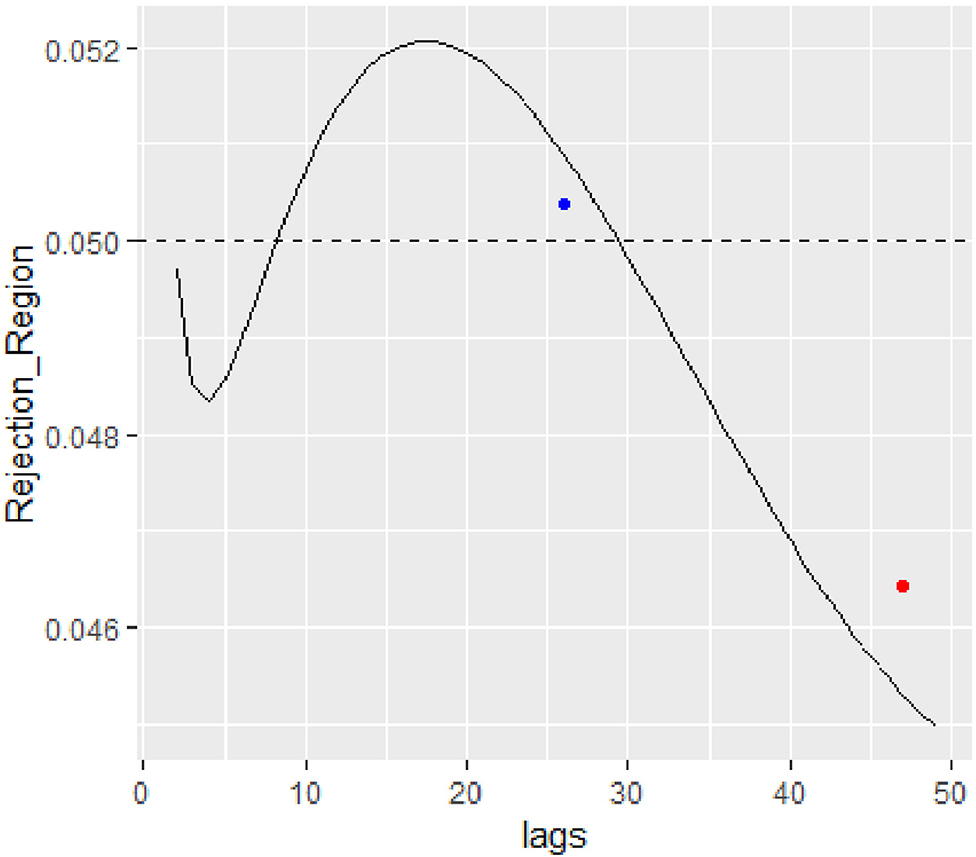
Figure 2. Parametric correction to the rejection region for the real EQT Corporation data is size 50.
5. Discussion
In this work a new approach for correction of adjusted Box-Pierce test recently developed by Kan and Wang [4]. Conceptually, the rejection region correction idea is similar to the ones successfully employed in the work of [18, 19] to counterbalance the conservativeness of exact homogeneity tests. The provided method combines large scale simulations with subsequent scenario-specific regression modeling that includes complex interaction terms to achieve exceptionally good fit that entails nominal type I error rates for all sample sizes and lags used in the test statistic. The regression models that were constructed depend on the length of the series (n) and the lag order (m). The exponents (s) and (p) of different variables present in the models are treated as hyperparameters in order to control the learning process. To obtain optimal values for those hyperparameters an extensive search through chosen subset values for (s) and (p) was conducted. The simulation study showed that the test outperforms all existing competing goodness-of-fit approaches for sample sizes up to 300.
It shall be noted that, in this study, we are not developing any new statistic but improving the best test among the current goodness-of-fit methods for time series. Our contribution is the introduction of a completely new idea to time series diagnostics, a rejection region correction via a range of parametric regressions fitted to large sample simulation data. Our study is an extension of the Adjusted Box-Pierce, as presented earlier.
The merit to the novel correction to the adjusted Box-Pierce proposed in this study is that it allows to find a test with vastly improved type I error rates for all sample size and lag values. This proposed technique of rejection region correction has direct implication on precise decision making by investors and financial institutions. The same technique can be easily extended to larger sample sizes.
Data Availability Statement
The original contributions presented in the study are included in the article/supplementary material, further inquiries can be directed to the corresponding author/s.
Author Contributions
SD conducted the simulation study, drafted, and revised the manuscript. JZ participated in interpreting the simulation results. KA reviewed and revised the manuscript, and prepared the final draft. AB contributed to the model building and the study design. CR conceived and designed the study, contributed to drafting, reviewing, and revising the manuscript. All authors contributed to the article and approved the submitted version.
Conflict of Interest
The authors declare that the research was conducted in the absence of any commercial or financial relationships that could be construed as a potential conflict of interest.
Publisher's Note
All claims expressed in this article are solely those of the authors and do not necessarily represent those of their affiliated organizations, or those of the publisher, the editors and the reviewers. Any product that may be evaluated in this article, or claim that may be made by its manufacturer, is not guaranteed or endorsed by the publisher.
References
2. Rachev ST, Mittnik S, Fabozzi FJ, Focardi SM, Jašić T. Financial Econometrics: From Basics to Advanced Modeling Techniques. Vol. 150. John Wiley & Sons (2007).
4. Kan R, Wang X. On the distribution of the sample autocorrelation coefficients. J Econ. (2010) 154:101–21. doi: 10.1016/j.jeconom.2009.06.010
5. Fisher TJ. Testing adequacy of arma models using a weighted portmanteau test on the residual autocorrelations. In: Contributed Paper to 2011 SAS Global Forum. (2011) 327.
6. Box GE, Pierce DA. Distribution of residual autocorrelations in autoregressive-integrated moving average time series models. J Am Stat Assoc. (1970) 65:1509–26. doi: 10.1080/01621459.1970.10481180
7. Ljung GM, Box GE. On a measure of lack of fit in time series models. Biometrika. (1978) 65:297–303. doi: 10.1093/biomet/65.2.297
8. Arranz MA. Tol-Project Portmanteau test statistics in time series. Time Orientated Lang. (2005) 1–8.
9. Chen Y. On the robustness of Ljung- Box and McLeod- Li Q tests: a simulation study. Econ Bull. (2002) 3:1–10.
10. Monti AC. A proposal for a residual autocorrelation test in linear models. Biometrika. (1994) 81:776–80. doi: 10.1093/biomet/81.4.776
11. Peña D, Rodríguez J. A powerful portmanteau test of lack of fit for time series. J Am Stat Assoc. (2002) 97:601–10. doi: 10.1198/016214502760047122
12. Lin JW, McLeod AI. Improved Peňa-Rodriguez portmanteau test. Comput Stat Data Anal. (2006) 51:1731–8. doi: 10.1016/j.csda.2006.06.010
13. Safi SK, Al-Reqep AA. Comparative study of portmanteau tests for the residuals autocorrelation in ARMA models. Sci J Appl Math Stat. (2014) 2:1–13. doi: 10.11648/j.sjams.20140201.11
14. Hassani H, Yeganegi MR. Selecting optimal lag order in Ljung-Box test. Phys A. (2020) 541:123700. doi: 10.1016/j.physa.2019.123700
15. Hassani H, Yeganegi MR. Sum of squared ACF and the Ljung-Box statistics. Phys A. (2019) 520:81–6. doi: 10.1016/j.physa.2018.12.028
17. Fisher RA. On the interpretation of χ 2 from contingency tables, and the calculation of P. J R Stat Soc. (1922) 85:87–94. doi: 10.2307/2340521
18. Boschloo R. Raised conditional level of significance for the 2× 2-table when testing the equality of two probabilities. Stat Neerland. (1970) 24:1–9. doi: 10.1111/j.1467-9574.1970.tb00104.x
Keywords: model selection, residuals, auto-correlation, type I error, diagnostic test, portmanteau Q statistic
Citation: Danioko S, Zheng J, Anderson K, Barrett A and Rakovski CS (2022) A Novel Correction for the Adjusted Box-Pierce Test. Front. Appl. Math. Stat. 8:873746. doi: 10.3389/fams.2022.873746
Received: 11 February 2022; Accepted: 12 April 2022;
Published: 19 May 2022.
Edited by:
Avner Bar-Hen, Conservatoire National des Arts et Métiers (CNAM), FranceReviewed by:
Hossein Hassani, University of Tehran, IranChristian Derquenne, Electricité de France, France
Copyright © 2022 Danioko, Zheng, Anderson, Barrett and Rakovski. This is an open-access article distributed under the terms of the Creative Commons Attribution License (CC BY). The use, distribution or reproduction in other forums is permitted, provided the original author(s) and the copyright owner(s) are credited and that the original publication in this journal is cited, in accordance with accepted academic practice. No use, distribution or reproduction is permitted which does not comply with these terms.
*Correspondence: Jianwei Zheng, emhlbmcxMjBAbWFpbC5jaGFwbWFuLmVkdQ==