 Lunga Matsebula
 Farai Nyabadza
- Department of Mathematics and Applied Mathematics, University of Johannesburg, Johannesburg, South Africa
Typhoid fever and cholera remain a huge public health problem on the African continent due to deteriorating infrastructure and declining funding for infrastructure development. The diseases are both caused by bacteria, and they are associated with poor hygiene and waste disposal systems. In this paper, we consider a nonlinear system of ordinary differential equations for the co-infection of typhoid and cholera in a homogeneously mixing population. The model's steady states are determined and analyzed in terms of the model's reproduction number. Impact analysis—how the diseases impact on each other—is carried out. Numerical simulations and sensitivity analysis are also given. The results show that the control of the diseases should be carried out in tandem for the greatest impact of disease control. The results have important implications in the management of the two diseases.
1. Introduction
Cholera, an acute gastro-intestinal water-borne infection, is caused by the bacterium Vibrio Cholerae, V. cholerae O1 or O139. Some of the symptoms are vomiting and diarrhea. If treatment is delayed, it can lead to severe dehydration and death within a few hours. The disease has two modes of transmission: direct and indirect transmission. Direct transmission (human-human) is very uncommon, whilst indirect transmission (environment-human), which occurs through the ingestion of contaminated food or water [1], is more frequent. Known estimates of the incubation period for the cholera disease is 1.4 days [2]. On the other hand, the Salmonella Typhi bacteria is responsible for causing the life threatening typhoid fever disease. Cholera and typhoid fever have the same transmission modes. The recticuloendothelical system, the intestinal lymphoid, and the gall bladder are severely damaged by the typhoid fever disease. Once a susceptible individuals is infected by the disease, roughly 19 days are required for the disease to incubate within the host [3].
Mathematical models have been used for the past decades to give insights into the transmission dynamics of co-infections within the human population. Akinyi et al. [4], showed that whenever the basic reproduction number is lowered to below one, then the malaria and the pneumonia cases will be reduced in a model of malaria-pneumonia coinfection. Onyinge et al. [5] modeled the co-dynamics of pneumonia and HIV, and they showed that the model was mathematically and epidemiologically sound; Mushayabasa et al. [6] modeled malaria-typhoid co-infection and demonstrated that a typhoid outbreak will inevitably lead to a spike in the malaria cases.
A number of mathematical models on typhoid have been proposed by a number of researchers. Mushayabasa [7], modeled how vaccines can help mitigate the spread of typhoid in Ghana. Pitzer et al. [8], extended the work in Mushayabasa [7] by applying the model to South Asia. Khan et al. [9], studied the typhoid disease with a saturated incidence rate.
To the best of our knowledge, the co-dynamics of typhoid and cholera have not been investigated in the literature. A recent outbreak of these two infections in Zimbabwe prompted this theoretical inquiry into how these infections interact. Due to the complicated nature of the co-infection model, we begin our analysis by studying the underlying sub-models; namely, the cholera only and the typhoid only sub-models. For each of the models, a number of pertinent questions are investigated. The questions explored include: Which factors in the models are key to decreasing the prevalence of each disease and the co-infection? Within the population, are the infections in competition with each other, or are they symbiotic? The implications of the results to the public health are discussed.
The paper is arranged as follows; the development of the model and the properties of the basic reproduction number are established in Section 2. Section 3 contains the stability analysis of the model at the fixed points. Numerical simulations and parameter estimations are done in section 4. Section 5 concludes the articles.
2. Methodology
2.1. Model development
Our typhoid cholera co-infection model partitions the human population N(t), at time t, into a susceptible class S(t), a cholera infection class Ic(t), a typhoid infection class It(t), a coinfection class Ict(t), a cholera recovery class Rc(t), a typhoid recovery class Rc(t), and a coinfection recovery class Rct(t). Thus,
The bacterial concentration of Salmonella Typhi, Bt(t), and Vibrio Cholerae, Bc(t), in the environment are incorporated into the model as well. The formulation of this model is an extension to the work carried out by Matsebula et al. [10].
Since the incubation periods of the two infections are different, we assume that dually infected individuals can only transmit either cholera or typhoid but not both infections simultaneously. Transmission of cholera to susceptible individuals occurs in one of two routes—the direct transmission route (human-to-human) and the indirect transmission route (envirnment-to-human). The rates of the transmission routes, respectively, are given by
The parameter βc1 denotes the person-to-person cholera transmission. The effective contact rate for cholera multiplied by the probability of cholera transmission per contact gives the person to person cholera transmission. The modification parameter ηc, accounts for the relative infectiousness of individuals in class Ic relative to individuals in class Ict. We assume that ηc ∈ (0, 1). This assumption is motivated by the fewer numbers of co-infected individuals as compared to those infected with cholera only. The parameter βc2 denotes the environment-to-humans per capita contact rate and the Vibrio Cholerae in the contaminated environment, whilst the parameter κc denotes the half saturation constant of the Vibrio Cholerae. The half saturation constant is the bacterial concentration that is required to support half of the maximum rate, βc2.
Similarly, the transmission of typhoid to susceptible individuals occurs in one of two routes—the direct transmission route (human-to-human) and the indirect transmission route (envirnment-to-human). The rates of the transmission routes, respectively, are given by
The parameter βt1 denotes the effective person-to-person typhoid transmission rate. The effective contact rate for typhoid multiplied by the probability of typhoid transmission per contact gives the person to person typhoid transmission. The modification parameter ηt, accounts for the relative infectiousness of individuals in class It relative to individuals in class Ict. We also assume that ηt ∈ (0, 1) following the assumptions given in the cholera infection dynamics. The per capita contact rate between the susceptibles and Salmonela typhi is represented by βt2, and the half saturation constant for λc2 is κt.
Transmission of cholera to typhoid infected individuals occurs in one of two routes—the direct transmission route (human-to-human) and the indirect transmission route (environment-to-human). The rates of the transmission routes, respectively, are given by
The parameter βc3 denotes the effective person-to-person cholera transmission rate of individuals in class It. The parameter βc4 denotes the environment-to-humans per capita contact rate for individuals in class It and the Vibrio Cholerae in the contaminated environment. Transmission of typhoid to cholera infected individuals occurs in one of two routes—the direct transmission route (human-to-human) and the indirect transmission route (environment-to-human). The rates of the transmission routes, respectively, are given by
The parameter βt3 denotes the person-to-person typhoid transmission rate of individuals in class Ic. The parameter βt4 denotes the environment-to-humans per capita contact rate for individuals in class Ic and the Salmonella Typhi in the contaminated environment.
Infected individuals in classes Ic, It and Ict experience disease related death at rates given, respectively by δc, δt and δct. Individuals in the infectious states Ic and It, respectively, excrete Vibrio Cholerae bacteria and Salmonella Typhi bacteria into the environment at rates αc and αt. Coinfected individuals shed Vibrio Cholerae and Salmonella Typhi into the environments at rates θc and θt, respectively. Infection is assume to confer temporary immunity. The cholera and typhoid immunity wanes at rates ρc, ρt and ρct.
The generation rate of Vibrio Cholerae is , and its growth is enhanced by cholera infected individuals and the coinfected individuals that are shedding into the environment. The generation rate of Salmonella Typhi is and its growth is enhanced by typhoid infected individuals and the coinfected individuals that are shedding into the environment. We assume that the Vibrio Cholerae and the Salmonella Typhi bacteria in the environment are respectively removed by interventions such as improved sanitation and treatment of contaminated environments at rates μc and μt. The parameter Λ represents the recruitment into the susceptibles, while the parameter μ represents the natural death rate. It is assumes that individuals mix homogeneously and that they are indistinguishable in each of the classes. The model diagram is shown in Figure 1.
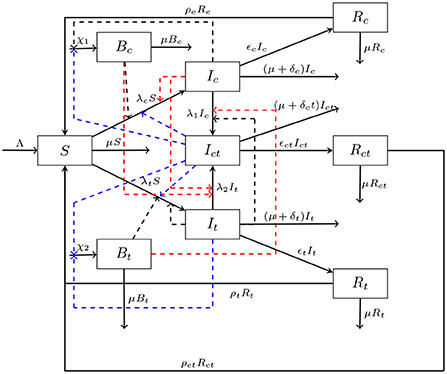
Figure 1. The cholera typhoid co-infection compartmental model. For the concise presentation of our model flow diagram, we make use of the following expressions: , , , , , .
The dynamical system associated with the schematic diagram in Figure 1 is;
with initial conditions
2.2. Cholera only model
We define the cholera only model as the model obtained from setting all the typhoid classes and its associated parameters to zero. We thus have the following
where
with initial conditions
2.2.1. Boundedness and non-negative trajectories
We argue that model (Equation 2) yields bounded-non negative-trajectories in this section provided the initial conditions are non-negative.
Theorem 1. All solutions of the cholera only sub-model (Equation 2) are non-negative if all the initial conditions are non-negative.
Proof. Define t1 = sup{t > 0|S(τ1) > 0, Ic(τ1) ≥ 0, Rc(τ1) ≥ 0, Bc(τ1) ≥ 0, ∀τ1 ∈ [0, t]}. It follows t1 > 0 since
S0 > 0, Ic0 ≥ 0, Rc0 ≥ 0, Bc0 ≥ 0.
Assume t1 < ∞, then S(t1) > 0, Ic(t1) = 0, Rc(t1) = 0, Bc(t1) = 0. Applying variation of constants to
yields
where and f(r) = Λ + ρcRc. Clearly,
Since f(r) > 0 and P(x) > 0 when x, r ∈ [0, t1]. Similarly, Ic(t1) > 0 and Rc(t1) > 0. This produces a contradiction, hence t1 = ∞.
Theorem 2. All solutions of the cholera only sub-model (Equation 2) are bounded within Ω whenever gc ≥ μc.
Proof. The time derivative of the population for the cholera model (Equation 2) is bounded above by
Upper bounds for the human population, Nc(t), are obtained by integrating the separable differential inequality as follows,
By extension, Λ/μ is also the upper bound for each of the human classes. Whereas, owing to Ic ≤ Nc ≤ Λ/μ, an upper bound for the bacterial classes can be obtained as follows,
From inequality (3), if
Where is the maximum shedding rate from the cholera infected individuals, then
The constant
is the upper bound for the differential inequality (Equation 5) since (Equation 5) is the logistic growth model with carrying capacity (Equation 6). For some t ≥ 0, (αc + θc)Λ/μ is an upper bound for Bc whenever (Equation 4) is false, whilst Bc is bounded above by Equation (6) for the rest of the time points in the domain of Bc if (Equation 4) is true. Thus, in both cases, .
Within the feasible region,
We have summarized the results on the boundedness and positivity of the solutions of the cholera only sub-model 2.
2.2.2. The stability of the disease free equilibrium and the reproduction number,
The disease free equilibria of system (Equation 2) is given by
where and . The equilibrium x1 > 0 if gc > μc. The Jacobian of dynamical system (Equation 2) is given by
The dynamical system (Equation 2) is locally asymptotically stable if all four of its eigenvalues have negative real parts. Two of the eigenvalues for the Jacobian, J, are λ1 = −μ and λ2 = −(μ + ρc). The other two eigenvalues for J are the eigenvalues from the sub-matrix
The characteristic equation for matrix is , where
and
The constants and are the bacterial regeneration threshold and the human-to-human sub reproduction number, respectively. The constant is the so-called basic reproduction number for the system (Equation 2). Clearly, or if and only if .
It follows from the Routh Hurwitz criterion that the two eigenvalues of have negative real parts if . It is easy to see that if , and . Hence, a positive basic reproduction number for system (Equation 2) that is less than unity implies that the system is locally asymptotically stable at the disease free equilibrium.
2.2.3. Endemic equilibrium
Setting the derivatives of the classes to zero gives the endemic equilibrium for the cholera only sub-model (Equation 2). Let .
From Equation (8),
From Equation (7),
Consider (Equation 9),
therefore
Given that
Using (Equation 10), we have a quadratic equation in Bc of the form
where
with
Clearly, ν0 < 0, ν1 < 0 if . Since
it follows that if , then it follows from Descartes' rule of signs that Bc has no positive roots, and if , then Bc has only one positive root. We shall call the positive root .
Let
Then
We have an expression for λ* such that
where,
Since
it follows that if a1 > 0, then the polynomial (Equation 12) has a positive root, and if a1 < 0, then the polynomial (Equation 12) has a positive root. So the polynomial (Equation 12) will always have one positive root.
So system (Equation 2) has a unique endemic equilibrium if
Remark 1. Due to the symmetric structure of the cholera only and typhoid only sub-models, the typhoid only sub-model has similar structural results to those obtained for the cholera only sub-model. To avoid repetition, we have not shown the analysis of the typhoid only sub-model.
2.3. Cholera-typhoid co-infection model
We study the full co-infection model (Equation 1) in this section.
2.3.1. Non-negative trajectories and boundedness
We prove in this subsection that model (Equation 1) has non-negative trajectories.
Theorem 3. All solutions of the co-infection model (Equation 1) are non-negative if all the initial conditions are non-negative.
Proof. Define t1 = sup{t > 0|S(τ1) > 0, Ic(τ1) ≥ 0, It(τ1) ≥ 0, Ict(τ1) ≥ 0, Rc(τ1) ≥ 0, Rt(τ1) ≥ 0, Rct(τ1) ≥ 0, Bc(τ1) ≥ 0, Bt(τ1) ≥ 0, ∀τ1 ∈ [0, t]}. It follows that t1 > 0 since S0 > 0, Ic0 ≥ 0, It0 ≥ 0, Ict0 ≥ 0, Rc0 ≥ 0, Rt0 ≥ 0, Rt0 ≥ 0, Bc0 ≥ 0, Bt0 ≥ 0.
Assume t1 < ∞, then S(t1) > 0, Ic(t1) = 0, It(t1) = 0, Ict(t1) = 0, Rc(t1) = 0, Rt(t1) = 0, Rct(t1) = 0, Bc(t1) = 0, Bt(t1) = 0. Applying variation of constants to
yields
Where P(x) = λc1 + λc2 + λt1 + λt2 + μ and f(r) = Λ + ρcRc + ρtRt + ρctRct. Clearly,
since f(r) > 0 and P(x) > 0 when x, r ∈ [0, t1]. Similarly, Ic(t1) > 0, It(t1) > 0, Ict(t1) > 0, Rt(t1) > 0 and Rc(t1) > 0. This produces a contradiction, hence t1 = ∞.
Theorem 4. All solutions of the co-infection model (Equation 1) are bounded within Ω whenever gc ≥ μc and gt ≥ μt.
Proof. Since δct(Ic + Ict) ≥ 0, it follows that the upper bound for the time derivative of the total human population, N(t), is
Using separation of variables, we obtain the following upper bound for the human population,
This upper bound for the population implies that each of the classes are also bounded above by the same constant Λ/μ. Since Ic, Ict ≤ Λ/μ, it follows that the upper bound for the bacterial concentration of Vibros Cholerae is bounded above by
From inequality (Equation 13), if
then
The constant
is the upper bound for the differential inequality (Equation 15) since (Equation 15) is the logistic growth model with carrying capacity (Equation 16). For some t ≥ 0, (αc + θc)Λ/μ is an upper bound for Bc whenever (Equation 14) is false, whilst Bc is bounded above by Equation (16) for the rest of the time points in the domain of Bc if (Equation 14) is true. The constant is the maximum shedding rate from the cholera infected individuals and dually infected individuals. In both cases,
Within the feasible region,
We have summarized the results on the boundedness and positivity of the solutions to the co-infection model (Equation 1).
2.3.2. Stability analysis of the disease free equilibrium and reproduction number,
We find the conditions required for the disease free equilibrium for dynamical system (Equation 1) to be locally asymptotically stable in this section. The disease free equilibria of dynamical system (Equation 1) are
where
It is observed that the disease free equilibria, X1, X2, X3, are always unstable due to the condition, gc ≥ μc, that is requires for their existence.
The Jacobian of the full system is
The dynamical system (Equation 1) is locally asymptotically stable if all nine of its eigenvalues have negative real parts. Five of the eigenvalues for the Jacobian, J, are λ1 = −μ, λ2 = −(μ + ρc), λ3 = −(μ+ρt), λ4 = −(μ+ρct) and λ5 = −(μ+δct+ϵct). The other four eigenvalues for J are the eigenvalues from the sub-matrix
The characteristic equation for matrix is , where
and
The constants and are the bacterial regeneration threshold and the human-to-human sub reproduction number, respectively, for the cholera only sub-model. The constants and are the bacterial regeneration threshold and the human-to-human sub reproduction number, respectively, for the typhoid only sub-model. The constants and are the so-called basic reproduction numbers for the cholera only sub-model and the typhoid only sub-model, respectively. Clearly, or if and only if ; Similarly, or if and only if .
We note that
Thus
The constant is the basic reproduction number for the systems (Equation 1). It follows from the Routh Hurwitz criterion that the four eigenvalues of have negative real parts if ν1, ν2, ν3, ν4 > 0. It is easy to see that ν1, ν2, ν3, ν4 > 0 if , and . Hence, a positive basic reproduction number for system (Equation 1) that is less than unity implies that the system is locally asymptotically stable at the disease free equilibrium.
2.3.3. Impact analysis
In this section, we show how cholera affects typhoid, and through symmetry, we show how typhoid affects cholera.
The reproduction numbers for cholera and typhoid are
respectively. These two reproduction numbers are dependent on each other. The constant, Λ/μ, allows for the expression of one reproduction number in terms of the other. From the second equation above, Equation (18), isolating, Λ/μ, yields
Differentiating with respect to gives
We conclude that an increase in cholera cases may be associated with an increase in typhoid cases, and an increase in typhoid cases may be associated with an increase in cholera cases. This conclusion is subject to the following conditions: firstly, the the bacterial regeneration threshold for both cholera and typhoid must be less than unity; secondly, the human-to-human sub reproduction number for both cholera and typhoid must also be less than unity. This result proves the symbiotic nature of the relationship between the typhoid disease and the Cholera disease.
3. Numerical simulations
In this section, we give a brief outline of the numerical results obtained in the investigation. Table 1 shows the parameters of the cholera typhoid co-infection model (Equation 1). The basic reproduction number, , obtained from the Table 1 is 1.4. The initial conditions used to produce the figures in this section were: S(0) = 99980, Ic(0) = 20, It(0) = 20, Ict(0) = 20, Rc(0) = 0, Rt(0) = 0, Rct(0) = 0, Bc(0) = 40000, Bt(0) = 40000. Note that all figures in this section are presented in the logarithmic scale since the range of some of the plots spanned several orders of magnitude.
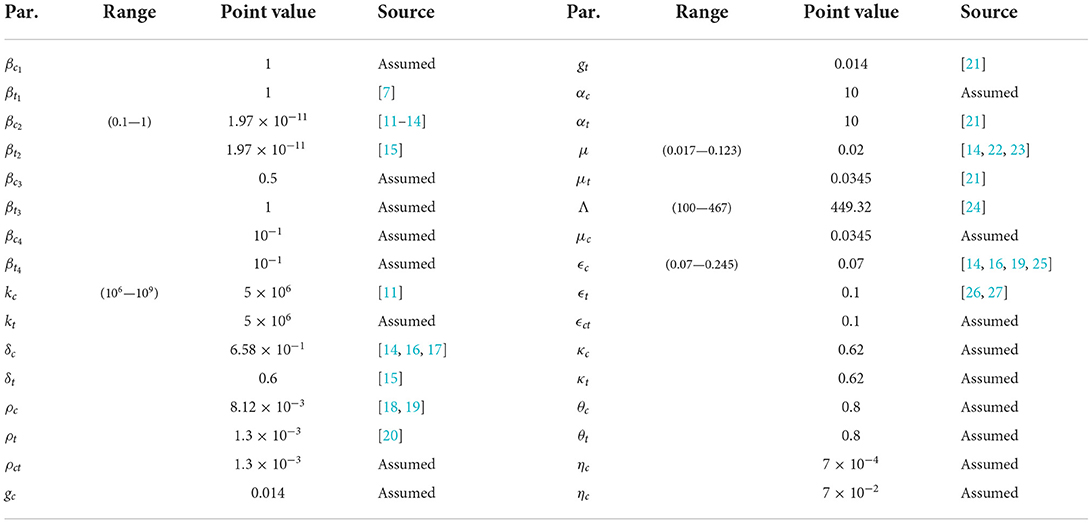
Table 1. Parameter values used for numerical simulation.
Coupled with the parameters from Table 1, the sensitivity indices of the variables above are shown on Figure 2. Latin Hypercube sampling was utilized to generate the plot above (Figure 2). This method returns the correlation between the state variable Ict and each of the model parameters, and it also returns the ranks of all these correlations (PRCC). The simulation was carried out over 1,000 runs. A parameter with a negative PRCC value means that parameter is negatively correlated with Ict, whilst a parameter with a positive PRCC value represents a positive correlation between that parameter and Ict. Relative to the current model parameters, we note that the coinfection class is most sensitive to changes to the person-to-person typhoid transmission rate, βt1, and the correlation is positive between this parameter and the state variable. The typhoid induced death rate is that second most sensitive parameter to the coinfection class, and it is negatively correlated to the coinfection class. Due to the large number of parameters in model 1, we have opted to split the PRCC values into 4 equal sets, see Figure 2.
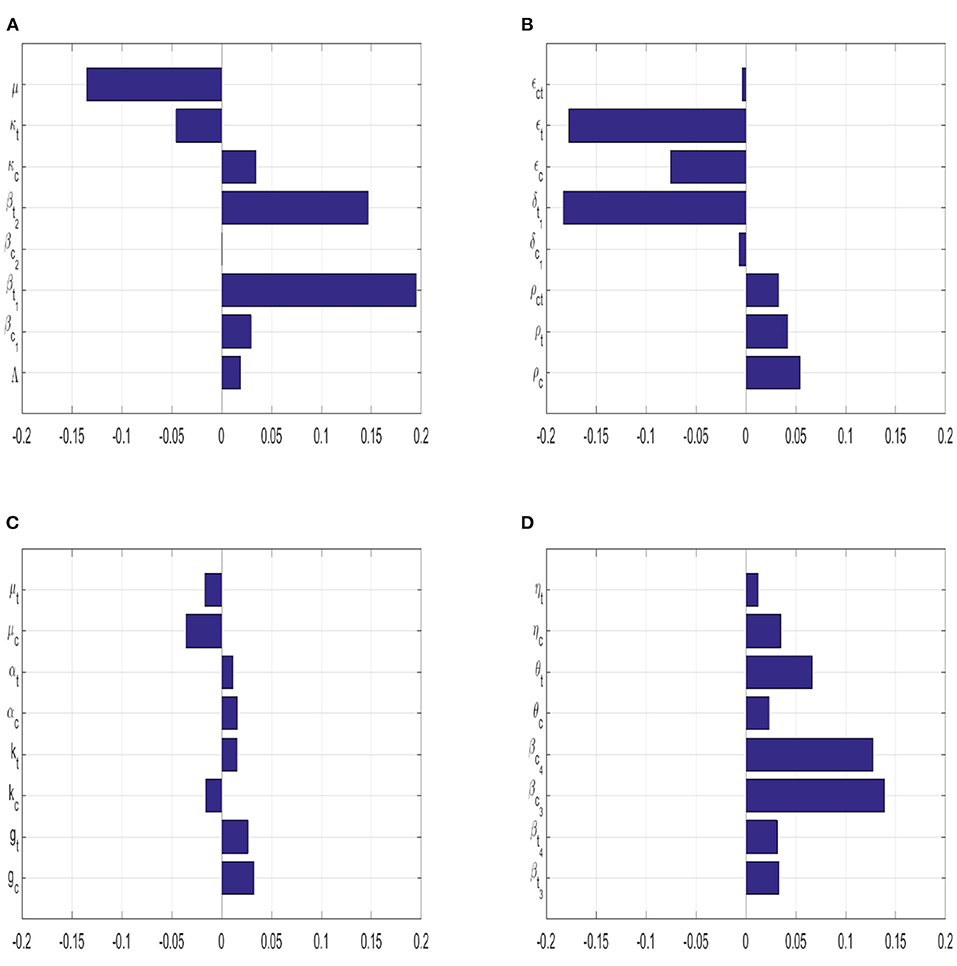
Figure 2. The correlation between the co-infected class and each of the model's parameter are shown in this bar graph (PRCC). (A) Shows the PRCC values for {Λ, βc1, βt1, βc2, βt2, κc, κt, μ}. (B) Shows the PRCC values for {ρc, ρt, ρct, δc, δt, ϵc, ϵt, ϵct}. (C) Shows the PRCC values for {gc, gt, kc, kt, αc, αt, μc, μt}. (D) Shows the PRCC values for {βt3, βt4, βc3, βc4, θc, θt, ηc, ηt}.
The contour map of as a function of the typhoid recovery rate, ϵt, and the cholera recovery rate, ϵc is shown in Figure 3. Using the parameters from Table 1, the base case as well as the contour levels are also shown in Figure 3. The basic reproduction number attains its global minimum if both the typhoid and cholera recovery rate are maximized. It is be observed that, locally, a reduction in the reproduction number, , —moving the base case to a lower contour level—is only achieved by increasing the cholera recovery rate. Since the reproduction number, , is the maximum of the reproduction numbers of the individual diseases, it follows that a reduction in the reproduction number, , means a reduction in the reproduction numbers of each of the diseases. Hence, locally, an increase in the cholera recovery rate will not only reduce the cholera reproduction number, , but it has the added benefit of indirectly reducing the reproduction number for typhoid, , as well. It is also observed that increasing the typhoid recovery rate exclusively will have no immediate benefits locally. This finding is consistent with the previous findings of an optimal treatment plan being centered around the recovery rate of cholera.
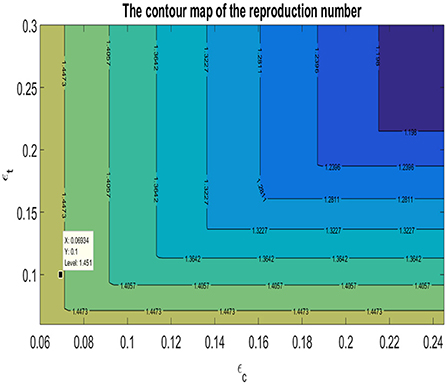
Figure 3. The contour map of the basic reproduction number, , as a function of the typhoid recovery rate, ϵt, and the cholera recovery rate, ϵc.
We show the trajectories of the three infectious classes of model (Equation 1). An initial surge in infections followed closely by an immediate recovery is shown in Figure 4. The phenomenon of waning immunity results in the smaller second wave of infections. The co-infected class is the only exception to this observation. We see the co-infected class reach a local minimum before the first surge in cholera only or typhoid only infections is reached. A possible reason for this is that, unlike the cholera and typhoid classes, the co-infected class does not recruit directly from the susceptible class. This is due to the fact that the cholera disease has a shorter incubation period than the typhoid disease. The incubation periods are 1.4 days for cholera [2] and 19 days for typhoid [3]. What is then observed in the co-infected class is a case of people leaving the class either through death or recovery coupled with the delayed recruitment into the class. All the diseases reach stability after the second waves of infection.
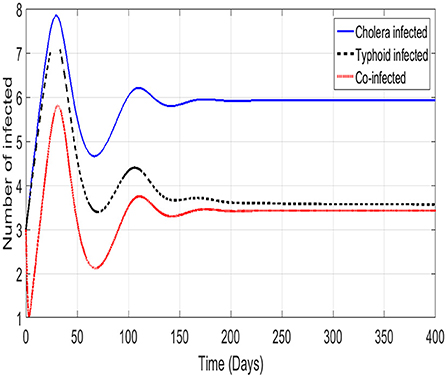
Figure 4. The trajectories of the infectious classes.
In order to understand how the diseases interact with each other, we vary the different recovery rates and observe how the prevalence of each of the infections change. In Figures 5A,B show the impact of varying the recovery rate of the co-infected on the cholera and typhoid prevalence, whilst (Figures 5C,D) show the impact of varying the recovery rates of cholera and typhoid on the prevalence of the co-infected individuals. Figure 5C shows a significant reduction in the co-infected class' prevalence when the cholera recovery rate is increased, whilst plots (Figure 5D) shows that this reduction is negligible when the typhoid recovery rate was increased. Figures 5A,B show that an increase in the co-infected class' recovery rate reduces the typhoid prevalence more than the cholera prevalence. The net effect is that an increased cholera recovery rate may be associated with a decreased prevalence of the co-infected individuals and a higher co-infected recovery rate. This in turn, produces a reduced typhoid prevalence. Given the current model parameters, this finding suggests that an optimal treatment plan for the two infections should primarily focus on increasing the cholera recovery rate as opposed to the typhoid recovery rate. This also underscores the point made earlier about the symbiotic nature of the two diseases.
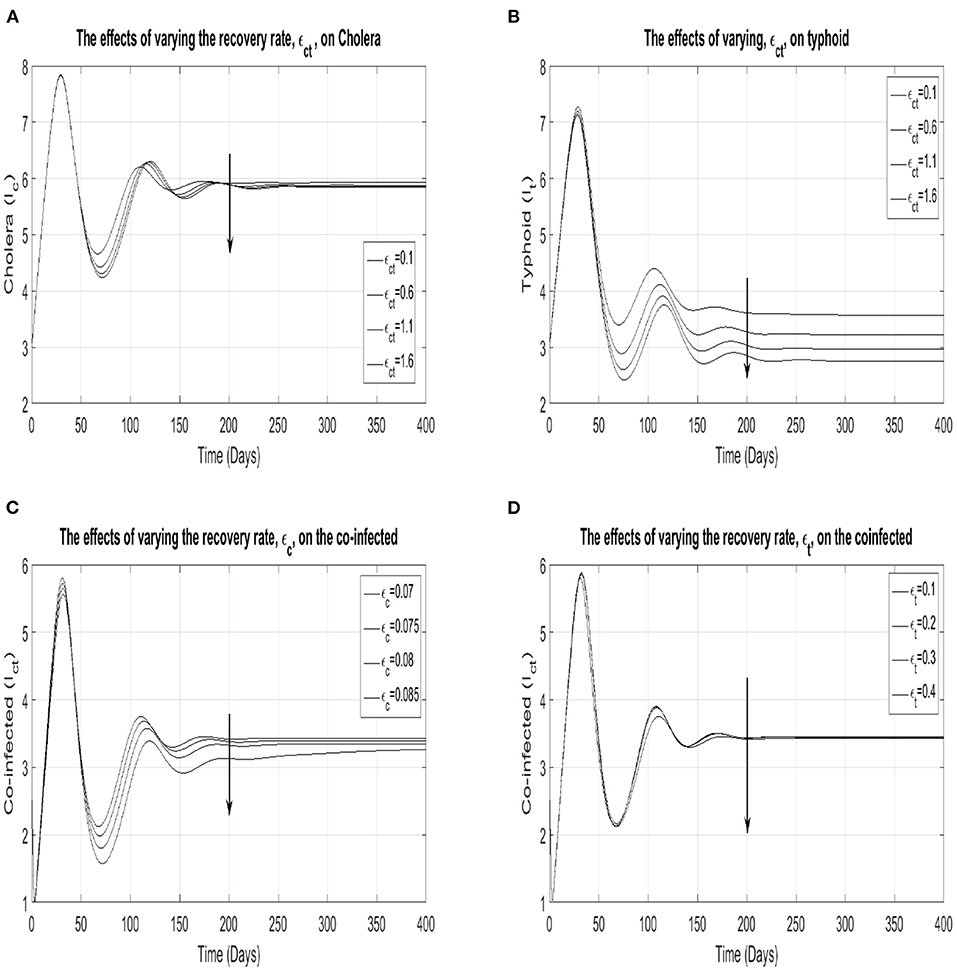
Figure 5. Plots (A,B) show the cholera and typhoid prevalence, respectively, as the co-infection recovery rate, ϵct, runs through {0.1, 0.6, 1.1, 1.6}. Plots (C,D) show the prevalence of the co-infected as the cholera and typhoid recovery rates are varied through the sets {0.07, 0.075, 0.08, 0.085} and {0.1, 0.2, 0.3, 0.4}, respectively.
4. Discussion and conclusion
In this article, we formulated and analyzed a theoretical model for the transmission dynamics of a cholera typhoid co-infection model. Through numerical simulations, we were able to verify a number of the results obtained analytically.
The birth and death rates of the bacteria are central to proving the boundedness and positivity of all three models—cholera only sub-model, typhoid only sub-model, and the full cholera typhoid co-infection model. For the cholera-only model, if the birth rate of the Vibrio Cholerae bacteria exceeds its death rate, then the cholera only model has non-negative and bounded trajectories. For the typhoid only model, if the birth rate of the Salmonella Typhi bacteria exceeds its death rate, then the typhoid only model has non-negative and bounded trajectories. For the full cholera typhoid co-infection model, if the birth rates of the Vibrio Cholerae bacteria and the Salmonella Typhi bacteria exceed their death rates, simultaneously, then the cholera-typhoid co-infection model has non-negative and bounded trajectories.
In analyzing the equilibria of the co-infection models, several key sights were discovered. We showed the existence of the disease free equilibria, by finding them, for all three models. Sufficient conditions for the existence of the endemic equilibria for the cholera only sub-model and the typhoid only sub-model were documented. We showed that if the reproduction number is less than one for the all the models, then the disease free equilibria are locally asymptotically stable, otherwise they are unstable. Global stability could not be guaranteed, both at the disease free equilibria and the endemic equilibria, in any of the models. Sensitivity analysis revealed the parameters in the model were at the heart of the spread of the cholera typhoid co-infection. The prevalence of cholera is decreased whenever ηt, βt3, βt4 are increased and/or βc1, βc2, ϵct, ηc and θc are decreased. The prevalence of typhoid is decreased whenever ηc, βc3, βc4 are increased and/or βt1, βt2, ϵct, ηt and θt are decreased.
From the impact analysis section, we found that an increase in cholera cases may be associated with an increased risk of typhoid and that an increase in typhoid cases may be associated with an increased risk of cholera. This result proves the symbiotic nature of the relationship between the typhoid disease and the cholera disease.
The findings in this investigation come with some limitations. The most glaring of all is the lack of data to fit the model to. Our model also fails to take into account the highly seasonal nature of each of the diseases. For the two infections, fear has a significant impact on the transmission dynamics. Future work should also be able to account for the effects of fear in the transmission dynamics of both infections. Notwithstanding these limitations, we believe that the findings of this investigation can still be useful to policy makers in containing an outbreak of these two diseases.
Data availability statement
The original contributions presented in the study are included in the article/supplementary material, further inquiries can be directed to the corresponding author.
Author contributions
LM prepared the manuscript and contributed to the analysis, whilst FN formulated the model, proofread the manuscript, and also contributed to the analysis. Both authors contributed to the article and approved the submitted version.
Acknowledgments
The authors would like to acknowledge the financial support received from the University of Johannesburg during the production of this manuscript.
Conflict of interest
The authors declare that the research was conducted in the absence of any commercial or financial relationships that could be construed as a potential conflict of interest.
Publisher's note
All claims expressed in this article are solely those of the authors and do not necessarily represent those of their affiliated organizations, or those of the publisher, the editors and the reviewers. Any product that may be evaluated in this article, or claim that may be made by its manufacturer, is not guaranteed or endorsed by the publisher.
References
1. Brachman PS, Evans AS. Bacterial Infections of Humans: Epidemiology Control. 3rd ed. Springer (1998). Available online at: http://gen.lib.rus.ec/book/index.php?md5=ae64651f2efa7ade60c537325be29cab
2. Azman AS, Rudolph KE, Cummings DA, Lessler J. The incubation period of cholera: a systematic review. J Infect. (2013) 66:432–8. doi: 10.1016/j.jinf.2012.11.013
3. Taylor A, Santiago A, Gonzalez-Cortes A, Gangarosa EJ. Outbreak of typhoid fever in Trinidad in 1971 traced to a commercial ice cream product. Am J Epidemiol. (1974) 100:150–7. doi: 10.1093/oxfordjournals.aje.a112017
4. Akinyi OC, Mugisha J, Manyonge A, Ouma C, Maseno K. Modelling the impact of misdiagnosis and treatment on the dynamics of malaria concurrent and co-infection with pneumonia. Appl Math Sci. (2013) 7:6275–96. doi: 10.12988/ams.2013.39521
5. Onyinge DO, Ongati NO, Odundo F. Mathematical model for co-infection of HIV/AIDS and pneumonia with treatment. Int J Scientific Eng Appl Sci. (2016) 2:106–11. Available online at: http://ir.jooust.ac.ke:8080/xmlui/handle/123456789/2643
6. Mushayabasa S, Bhunu CP, Mhlanga NA. Modeling the transmission dynamics of typhoid in malaria endemic settings. Appl Appl Math. (2014) 9:121–40. Available online at: https://digitalcommons.pvamu.edu/aam/vol9/iss1/9
7. Mushayabasa S, Bhunu CP, Ngarakana-Gwasira ET. Assessing the impact of drug resistance on the transmission dynamics of typhoid fever. Comput Biol J. (2013) 2013:1–13. doi: 10.1155/2013/303645
8. Pitzer VE, Bowles CC, Baker S, Kang G, Balaji V, Farrar JJ, et al. Predicting the impact of vaccination on the transmission dynamics of typhoid in South Asia: A mathematical modeling study. PLoS Negl Trop Dis. (2014) 8:e2642. doi: 10.1371/journal.pntd.0002642
9. Khan MA, Parvez M, Islam S, Khan I, Shafie S, Gul T. Mathematical analysis of typhoid model with saturated incidence rate. Adv Stud Biol. (2015) 7:65–78. doi: 10.12988/asb.2015.41059
10. Matsebula L, Nyabadza F, Mushanyu J. Mathematical analysis of typhoid fever transmission dynamics with seasonality and fear. Commun Math Biol Neurosci. (2021) 2021:36. doi: 10.28919/cmbn/5590
11. Codeço CT. Endemic and epidemic dynamics of cholera: the role of the aquatic reservoir. BMC Infect Dis. (2001) 1:1. doi: 10.1186/1471-2334-1-1
12. Bertuzzo E, Casagrandi R, Gatto M, Rodriguez-Iturbe I, Rinaldo A. On spatially explicit models of cholera epidemics. J R Soc Interface. (2010) 7:321–33. doi: 10.1098/rsif.2009.0204
13. Mari L, Bertuzzo E, Righetto L, Casagrandi R, Gatto M, Rodriguez-Iturbe I, Rinaldo A. Modelling cholera epidemics: the role of waterways, human mobility and sanitation. J R Soc Interface. (2012) 9:376–88. doi: 10.1098/rsif.2011.0304
14. Miller Neilan RL, Schaefer E, Gaff H, Fister KR, Lenhart S. Modeling optimal intervention strategies for cholera. Bull Math Biol. (2010) 72:2004–18. doi: 10.1007/s11538-010-9521-8
15. Mushayabasa S. Impact of vaccines on controlling typhoid fever in Kassena-Nankana district of upper east region of Ghana: insights from a mathematical model. J Modern Math Stat. (2011) 5:54–9. doi: 10.3923/jmmstat.2011.54.59
16. Sepulveda J, Gomez-Dantes H, Bronfman M. Cholera in the Americas: an overview. Infection. (1992) 20:243–8. doi: 10.1007/BF01710787
17. Shuai Z, Tien JH, van den Driessche P. Cholera models with hyperinfectivity and temporary immunity. Bull Math Biol. (2012) 74:2423–45. doi: 10.1007/s11538-012-9759-4
18. King AA, Ionides EL, Pascual M, Bouma MJ. Inapparent infections and cholera dynamics. Nature. (2008) 454:877–80. doi: 10.1038/nature07084
19. Sanches RP, Ferreira CP, Kraenkel RA. The role of immunity and seasonality in cholera epidemics. Bull Math Biol. (2011) 73:2916–31. doi: 10.1007/s11538-011-9652-6
20. Okosun K, Makinde OD. Modelling the impact of drug resistance in malaria transmission and its optimal control analysis. Int J Phys Sci. (2011) 6:6479–87. doi: 10.5897/IJPS10.542
21. Mutua JM, Wang FB, Vaidya NK. Modeling malaria and typhoid fever co-infection dynamics. Math Biosci. (2015) 264:128–44. doi: 10.1016/j.mbs.2015.03.014
22. Hartley DM, Morris Jr JG, Smith DL. Hyperinfectivity: a critical element in the ability of V. cholerae to cause epidemics? PLoS Med. (2006) 3:e7. doi: 10.1371/journal.pmed.0030007
23. Munro PM, Colwell RR. Fate of Vibrio cholerae O1 in seawater microcosms. Water Res. (1996) 30:47–50. doi: 10.1016/0043-1354(95)00137-A
24. Blayneh K, Cao Y, Kwon HD. Optimal control of vector-borne diseases: treatment and prevention. Discrete Continuous Dyn Syst B. (2009) 11:587. doi: 10.3934/dcdsb.2009.11.587
26. Adetunde IA. Mathematical models for the dynamics of typhoid fever in Kassena-Nankana district of upper east region of Ghana. J Modern Math Stat. (2008) 2:45–9. Available online at: https://medwelljournals.com/abstract/?doi=jmmstat.2008.45.49
Keywords: cholera, typhoid, co-infection, stability, basic reproduction number, impact analysis
Citation: Matsebula L and Nyabadza F (2022) Mathematical analysis of cholera typhoid co-infection transmission dynamics. Front. Appl. Math. Stat. 8:892098. doi: 10.3389/fams.2022.892098
Received: 08 March 2022; Accepted: 29 August 2022;
Published: 16 September 2022.
Edited by:
Pierre Magal, Université de Bordeaux, FranceReviewed by:
Feng-Bin Wang, Chang Gung University, TaiwanGui-Quan Sun, North University of China, China
Copyright © 2022 Matsebula and Nyabadza. This is an open-access article distributed under the terms of the Creative Commons Attribution License (CC BY). The use, distribution or reproduction in other forums is permitted, provided the original author(s) and the copyright owner(s) are credited and that the original publication in this journal is cited, in accordance with accepted academic practice. No use, distribution or reproduction is permitted which does not comply with these terms.
*Correspondence: Lunga Matsebula, bG1hdHNlYnVsYUB1ai5hYy56YQ==