 Chunhua Ren
 Chaorong Li
 Yang Yu2
- 1School of Computer Science and Technology, Yibin University, Yibin, China
- 2School of Computer and Software, Southwest Petroleum University, Chengdu, China
Ever since Density Peak Clustering (DPC) was published in Science, it has been widely favored and applied in various fields due to its concise and efficient computational theory. However, DPC has two major flaws. On the one hand, it fails to find cluster centers of low-density clusters in datasets with uneven density distribution. On the other hand, its single assignment strategy, which only assigns points to high-density clusters, can lead to incorrect clustering due to a chain reaction. To address these weaknesses, a new density peak clustering algorithm based on weighted mutual K-nearest neighbors called WMKNNDPC is proposed in this paper. WMKNNDPC offers two significant advantages: (1) It introduces the concept of mutual K-nearest neighbors by using K-nearest neighbors and inverse K-nearest neighbors, allowing for the identification of cluster centers in clusters with uneven density distribution through a new local density calculation method. (2) It includes a remaining points assignment method based on weighted mutual K-nearest neighbors, which involves two stages: first, the initial assignment of data points is done by combining mutual K-nearest neighbors and breadth-first search, and second, the membership degree of data points is calculated based on weighted mutual K-nearest neighbors for remaining points assignment. This method allows for efficient assignment based on the local distribution of points, avoiding the disadvantages of using a fixed K-value in DPC-derived algorithms based on K-nearest neighbors. The WMKNNDPC algorithm has been extensively tested on two-dimensional synthetic datasets, real datasets, facial recognition dataset and parameter analysis. The experimental results indicate that our algorithm performs the best on most datasets.
1 Introduction
Nowadays, due to the explosive growth of social data, data mining has become widespread in various industries, helping people understand data and make informed decisions. Clustering technology is an unsupervised learning method in data mining that focuses on a large amount of unlabeled data and uses data point similarity to classify. This results in highly similar data being grouped into the same category, while there is low data similarity between different categories [1]. Clustering algorithms can be categorized into partition clustering [2], hierarchical clustering [3], density clustering [4], grid clustering [5], model clustering [6], and graph clustering [7] based on different partition theories. These algorithms have been successfully applied in areas such as customer segmentation [8], image processing [9–11], product recommendation [12], social networks [13], big data application [14] and data security [15].
So far, several traditional clustering algorithms have been developed, such as K-means [16], DBSCAN [17, 18], Spectral Clustering (SC) [19], and Expectation-Maximization Clustering (EM) [20], along with numerous enhanced methods. However, they are unable to effectively handle datasets of various shapes, sizes, and densities.
In 2014, Rodriguez and Laio [21] published a paper in Science titled “Clustering by fast search and find of density peaks.” The paper introduced a clustering algorithm called DPC, which gained significant attention from researchers. DPC is a density-based clustering algorithm that operates on two key assumptions: low-density data points tend to cluster near the center point, and different cluster centers are usually far apart. This algorithm requires only one parameter and demonstrates efficient clustering center identification and data point assignment for most datasets, delivering strong clustering performance.
While the DPC process is straightforward and clustering is effective, there are several issues, with two notable shortcomings. One problem is that when dealing with manifold datasets, the strategy for assigning remaining points can easily cause a chain reaction, leading to significant assignment errors, as depicted in Figure 1a. In this dataset, comprising three clusters, the data points on both sides of the semicircle are incorrectly assigned to the other two clusters. Another issue arises when dealing with datasets featuring uneven density distribution. The lack of consideration for sparsity between data points when calculating local density can result in errors in selecting cluster centers, as shown in the dataset in Figure 1b. This dataset contains two clusters with uneven density distribution, leading to issues with multiple peaks when calculating candidate cluster centers.
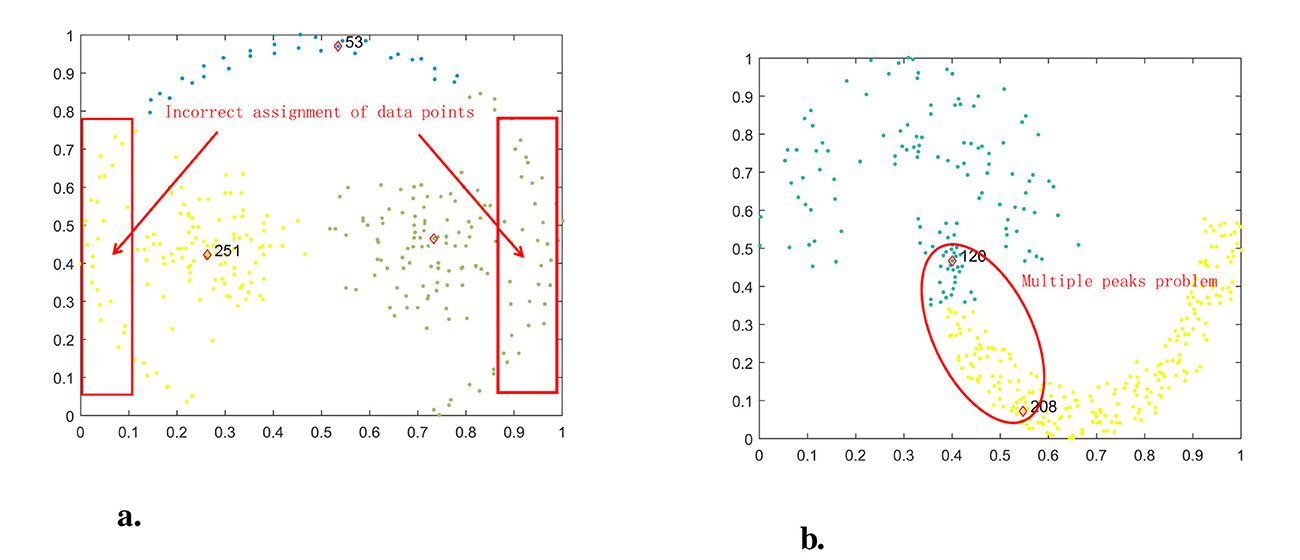
Figure 1. Problems faced by DPC in pathbased and jain datasets. (a) DPC on pathbased. (b) DPC On Jain.
In response to the shortcomings of DPC, numerous researchers have conducted a series of work, primarily focusing on two aspects: optimizing local density calculation and improving assignment strategy. In the meantime, several research findings have been produced. These include concepts such as K-nearest neighbors [22], fuzzy K-nearest neighbors [23], shared K-nearest neighbors [24], layered K-nearest neighbors [25], reverse K-nearest neighbors [26], and so on, which have been incorporated into DPC. However, these improved algorithms still use a fixed K-value parameter and lack consideration for the local distribution of the dataset.
Therefore, this paper proposed a new density peak clustering algorithm WMKNNDPC based on weighted mutual K-nearest neighbors, which, like most derived-DPC algorithms, requires a mutual K-nearest neighbors hyper-parameter. The WMKNNDPC algorithm can identify clusters with arbitrary shapes, densities, and sizes, and it offers two major contributions: (1) It defines mutual K-nearest neighbors based on K-nearest neighbors and inverse K-nearest neighbors, and redesigns the local density of mutual K-nearest neighbors. This method is adaptable, no longer using a fixed parameter K, and can calculate more accurate local density based on the local points distribution, which makes it easier to select the correct clustering center and avoid the issue of multiple peaks. (2) It introduces a remaining points assignment method based on weighted mutual K-nearest neighbors, utilizing mutual K-nearest neighbors, breadth-first search, and points membership probability for assigning. This approach helps in avoiding point assignment errors and stopping the domino effect.
The paper is organized as follows: In Section 2, we analyze the latest progress of the DPC algorithm. In Section 3, we provide a detailed introduction to the proposed WMKNNDPC algorithm. In Section 4, we conduct a large number of experiments and compare our algorithm with seven classic algorithms for analysis. In the Section 5, we provide a summary of the works and looks forward to the future.
2 Related works
This section explains the basic theory of the DPC algorithm and analyzes the latest research status of DPC-derived algorithms.
2.1 DPC analysis
The DPC clustering process is straightforward and easy to comprehend [21]. Firstly, it defines two methods for local density calculation, which are calculated using piecewise functions and Gaussian kernels, as shown in Equations 1, 2.
Where ρi represents the local density of data point xi, dij is the Euclidean distance from data point xi to xj, and dc is the only truncation distance parameter. χ(.) is a piecewise function defined as follows: If the parameter z is less than 0, χ(z) equals 1, otherwise χ(z) equals 0. According to DPC, local density calculation for large-scale datasets is more suitable for Equation 1, otherwise Equation 2 is used. However, this presents a problem: researchers do not know which method of local density calculation is more accurate and effective for different datasets. As a result, only two methods are employed for calculation, leading to additional computational workload.
Secondly, DPC defines another important variable, the relative distance δi , which represents the shortest distance from data point xi to data point xj with higher density. The calculation method is shown in Equation 3.
When data point xi has the maximum local density, DPC considers it a peak point and sets the relative density to the maximum value using Equation 4.
Once the local density and relative distance are calculated, DPC identifies potential cluster centers using a decision graph. These potential cluster centers are characterized by having the highest local density and relative distance simultaneously for data point xi. The process for calculating potential cluster centers is outlined in Equation 5.
DPC usually selects points with high local density and relative distance as actual clustering centers, or manually identifies significant outliers by drawing decision graph to determine the number of clustering centers. Finally, assign the remaining points sequentially to the nearest and denser data points.
2.2 Research progress of DPC
Since the density peak clustering algorithm was published in 2014, numerous researchers have conducted extensive research in the past decade to address the shortcomings of DPC.
The first stage is between 2016 and 2019. At the beginning, the density peaks clustering based on K-nearest neighbors (DPC-KNN) algorithm [27] redefined a new local density using the average distance from the data point to K-nearest neighbors, while considering the distribution differences between points, avoiding the limitation of DPC using a unified truncation distance when defining local density, and achieving good clustering performance. However, DPC-KNN has two shortcomings. Firstly, it still uses the percentage parameter to obtain K-nearest neighbors, which is very sensitive and makes it difficult to determine the optimal value. Secondly, it cannot accurately obtain cluster centers when dealing with datasets with uneven density distribution. Subsequently, the fuzzy weighted K-nearest neighbors density peak clustering algorithm (FKNN-DPC) was proposed by Xie et al. [23], which has better robustness compared to DPC and DPC-KNN. FKNN-DPC adopts the K-nearest neighbors method and fuzzy set theory to design a new local density and develops a two-stage remaining point assignment strategy. However, this method uses a fixed K-value each time to calculate local density and assign sample points, without considering the local distribution of sample points. To address the issue of DPC dependency and truncation distance parameters, the Natural Neighbor-based clustering algorithm with density peaks (NaNDP) [28] was first formed by introducing the idea of natural neighbors. NaNDP does not require additional parameters and can expand from the cluster center by searching for the natural neighborhood of the cluster midpoint. Finally, extension rules are defined to determine the boundaries of the cluster. However, NaNDP still adopts the assignment principle of DPC, which is not good for handling boundary points. To solve the problem of DPC not being able to correctly select cluster centers, the adaptive density peak clustering based on K-nearest neighbors with aggregating strategy (ADPC-KNN) [29] designed a method for automatically selecting initial cluster centers and improved the clustering performance by using the idea of cluster density reachability. However, the unique parameter K of this method needs to be manually preset. The shared-nearest-neighbor-based clustering by fast search and find of density peaks (SNN-DPC) algorithm was proposed by Liu et al. [24], which redefines local density based on nearest neighbors and shared neighbors, which can better adapt to the local environment of sample points. At the same time, a two-stage remaining point assignment strategy was also proposed based on shared neighbors. SNN-DPC can effectively handle various datasets, but its problems are consistent with FKNN-DPC, which requires the use of fixed K-nearest neighbors parameter in the clustering process. Based on two assumptions in DPC, the comparative density peaks clustering (CDP) [30] is a clustering algorithm based on comparative quality and density measurement, and experiments have shown that CDP has better performance than DPC in most cases. A feasible density peaks clustering algorithm with a merging strategy (FDPC) [31] has been proposed to address the issue of DPC being unable to handle multiple peaks. It uses support vector machines to calculate the feedback values between clusters after finding the initial cluster center, and clusters based on the feedback values. In response to the dilemma of DPC being unable to distinguish overlapping clusters, Parmar et al. [32] designed a residual error-based density peak clustering algorithm (REDPC), which uses residuals to calculate local density and identify low-density sample points. This method can generate a decision graph that is more conducive to clustering, but it has multiple process parameters and poor autonomy.
The second stage, from 2020 to the present, has further generated a series of DPC-derived algorithms. In 2020, a novel systematic density based clustering method using anchor points (APC) [33] was proposed, which uses anchor points as the center to obtain intermediate clusters and automatically selects appropriate clustering strategies. The experimental results show that APC has good clustering performance in most cases. Although APC combines the advantages of DPC and DBSCAN, the four custom parameters incur significant time overhead. Ren et al. [25] proposed an improved density peaks clustering algorithm based on the layered K-nearest neighbors and subcluster merging (LKSM-DPC) to address the issue of multiple peaks in DPC. This algorithm uses layered K-nearest neighbors to define local density, which is beneficial for extracting cluster centers. At the same time, a subcluster merging strategy based on shared neighbors and universal gravitation is designed, and comparative experiments show that LKSM-DPC has some advantages. But LKSM-DPC also has obvious shortcomings, that is, selecting how many sub-clusters to merge requires a lot of trying, which increases the time cost. To cope with imbalanced datasets, a novel clustering algorithm related to density based clustering algorithm for identifying diverse density clusters effectively named IDDC [34] has emerged. It determines the local density of sample points by defining relative density and searches for unassigned points from a clustering perspective, designing a new assignment strategy. However, IDDC requires two parameters. A graph adaptive density peaks clustering algorithm based on graph theory (GADPC) [35] was proposed in 2022. GADPC based on the turning angle and graph connectivity automatically selects cluster centers, and the remaining points move closer to the corresponding cluster centers. The algorithm is more feasible when dealing with datasets with different densities such as Jain and Spiral, but it ignores the issue of selecting parameters for the same DPC. Similarly, for imbalanced datasets, Zhao et al. [36] proposed a new density peaks clustering algorithm based on fuzzy and weighted shared neighbor (DPC-FWSN), which redefines local density using the nearest neighbors fuzzy kernel function and designs a weighted shared neighbors similarity assignment strategy. Experimental tests have shown that DPC-FWSN can effectively handle datasets with uneven density distribution, but its drawback is that it still uses a manual setting of the nearest neighbors parameter K. Based on FKNN-DPC, Xie et al. [37] further proposed the standard deviation weighted distance based density peak clustering algorithm (SFKNN-DPC) with better robustness, considering the contribution of each feature to the distance between data points, adopting the standard deviation weighted distance, and designing a divide and conquer assignment strategy. For DPC, which cannot find cluster centers in sparse clusters, an adaptive nearest neighbors density peak clustering algorithm (ANN-DPC) [38] was proposed. Firstly, the adaptive nearest neighbors of points are introduced to accurately define the local density of points. Then, the sample points are divided into super score, core, linked, and slave points to check for suitable cluster centers. Finally, a new assignment strategy is designed using the adaptive nearest neighbors algorithm combined with breadth-first search and fuzzy weighted adaptive nearest neighbors algorithm. For ANN-DPC, the performance is excellent, but it is still necessary to specify the number of clusters in advance. Fan et al. [39] designed a density peak clustering based on improved mutual K-nearest neighbor graph (MKNNG-DPC) by defining K-nearest-neighbor sample set, distance-upper-bound point, distance level and mutual K-nearest-neighbors set. However, this method requires consideration of constructing a mutual K-nearest neighbor graph, and at the same time requires two parameters: truncation distance dc and K-nearest neighbors. In 2023, Li et al. [40] constructed a new local density based on MKNNG-DPC and designed a two-stage sub cluster merging method, thus proposing a fast density peaks clustering algorithm based on improved mutual K-nearest-neighbors and sub-cluster merging (KS-FDPC). However, calculating the similarity of sub-clusters and merging them both require additional storage and time overhead.
3 WMKNNDPC algorithm
In this section, we will provide a detailed introduction to our proposed density peak clustering algorithm based on weighted mutual K-nearest neighbors (WMKNNDPC). For the specific technical details, please refer to the following sections.
3.1 Mutual K-nearest neighbors local density
In DPC, local density calculation depends on the truncation distance dc. However, determining the optimal value for dc can be challenging when working with different datasets. KNN-DPC addresses this issue by using the K-nearest neighbors method to calculate local density [27]. While this approach eliminates the need to determine dc, it overlooks the distribution around data points, and using a fixed K-value can result in calculation errors when identifying cluster centers. Therefore, this section introduces a new method for local density calculation called mutual K-nearest neighbors local density.
First, calculate the K-nearest neighbors set KNN(xi) of data point xi using Equation 6 and sort it in ascending order by Euclidean distance.
where D represents the dataset, and diK represents the distance between data point xi and its K-th nearest neighbor.
The inverse K-nearest neighbors set RNN(xi) of data point xi is defined as shown in Equation 7. RNN(xi) indicates the influence of data point xi in the dataset. If point xi is in a high-density region, it is usually surrounded by more data points. Conversely, if it is in a sparse region, the number of inverse neighbors is less. The size of the inverse K-nearest neighbors set is more likely to provide feedback on the local distribution of the data points.
For a given data point xi, the mutual K-nearest neighbors MKNN(xi) are defined based on the K-nearest neighbors and inverse K-nearest neighbors. It represents the bidirectional local relationship between data point xi and its neighboring points. The set of mutual K-nearest neighbors for individual points is initially empty. However, this paper suggests that the mutual K-nearest neighbors set of these points should be the top 50% (Top⌈K/2⌉, K ∈ ℕ+ and 1 < K < |D| − 1) of the K-nearest neighbor set. The calculation method can be found in Equation 8.
Experimental analysis indicates that the number of mutual K-nearest neighbors for each data point varies, suggesting that it is more appropriate to describe the local situation of points using mutual K-nearest neighbors rather than fixed K-nearest neighbors. Using mutual K-nearest neighbors provides the benefit of accurately describing the local nearest neighbors structure of each data point, particularly in distinguishing low-density areas. Additionally, mutual K-nearest neighbors not only consider the calculation of local density but also facilitate the assignment of remaining points.
Equation 9 describes the number of mutual K-nearest neighbors of data point xi, denoted as MK(xi), where |.| represents the number of data points in the set MKNN(xi).
Based on mutual K-nearest neighbors, we have designed a new method of local density ρi for any data point xi, as shown in Equation 10. This method is reconstructed from the original local density calculation method, where the numerator represents the number of mutual K-nearest neighbors. Due to the inconsistency of mutual K-nearest neighbors for each data point, it has adaptability, which is completely different from the K-nearest neighbors method. The denominator in the equation is the contribution of the K-nearest neighbors of the data point xi to the local density. If the sum of the distances between xi and the K-nearest neighbors is smaller, the local density will be larger.
As per Equation 10, having more mutual K-nearest neighbors between data points implies that the data point is surrounded by more points, which significantly impacts the local density. When multiple data points have the same mutual K-nearest neighbors, it's important to consider the local distribution around the data points, specifically the Euclidean distance between the data points and their K-nearest neighbors. This helps to better identify data with uneven density distribution in different regions and select the correct clustering center.
For example, Figure 2 contains 20 data points, with two diamond center points labeled A and B, and the remaining 18 as circular points. The black line represents the distance between the data points and the center point. If the K-nearest neighbors parameter K is set to 7, the circular points in the dashed ellipse represent the K-nearest neighbors of A and B. We can conclude that the actual local density at center point A is lower than that at center point B, which is ρA < ρB. For data point xi with , we can obtain a result where ρA = 4.05 is greater than ρB = 3.04, which is inconsistent with reality. This is the influence of using a fixed K-value in K-nearest neighbors, and data point 17 also serves as the K-nearest neighbor of center point B. If the local density calculation method designed in this paper is used, point 17 will not be recognized as the mutual K-nearest neighbors of center B. This method has adaptability and can obtain ρB = 6.43 greater than ρA, which is more in line with actual expectations.
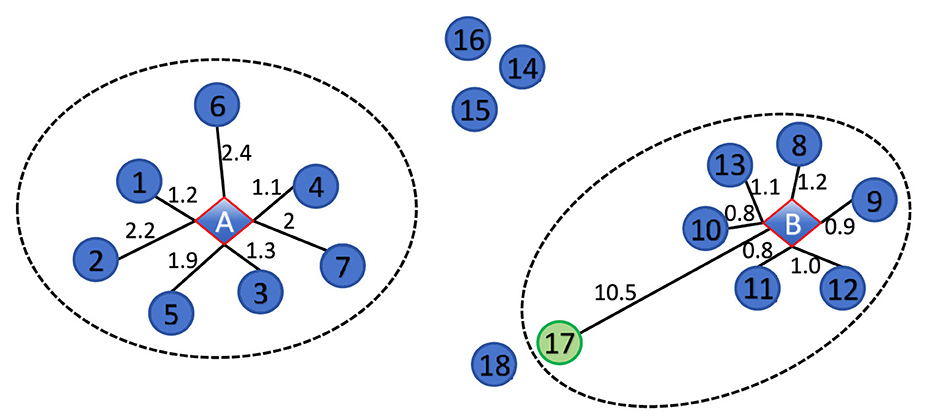
Figure 2. The influence of the K-nearest neighbors method on local density.
3.2 A remaining points assignment method based on weighted mutual K-nearest neighbors
The incorrect assignment of remaining points in DPC can trigger a chain reaction. The strategy used in the assignment should prioritize high-density clusters which can lead to points from sparse clusters being incorrectly assigned to dense clusters. In this paper, a new method for assigning remaining points based on weighted mutual K-nearest neighbors is proposed, inspired by FKNN-DPC [23]. FKNN-DPC uses a fixed K-value for each assignment without considering the local distribution around data points. Instead, our proposed method utilizes weighted mutual K-nearest neighbors to assign these remaining points. This approach, in contrast to FKNN-DPC, is more suitable for capturing the local distribution of points due to the flexibility of the weighted mutual K-nearest neighbors for each data point.
The data points assignment method we propose consists of two algorithms. Algorithm 1 uses mutual K-nearest neighbors and breadth-first search of data points for initial priority assignment. Building on Algorithms 1, 2 calculates the membership probability of the remaining unassigned points using weighted mutual K-nearest neighbors and then assigns high-probability data points to the most suitable cluster. If there are still unassigned points, they are classified based on their nearest neighbors. This method can quickly assign remaining points in dense areas, where the number of mutual K-nearest neighbors of data points is relatively large. In sparse areas, the number of mutual K-nearest neighbors can be used for small-scale assignments to reduce errors. It effectively adapts to local conditions and demonstrates strong robustness.
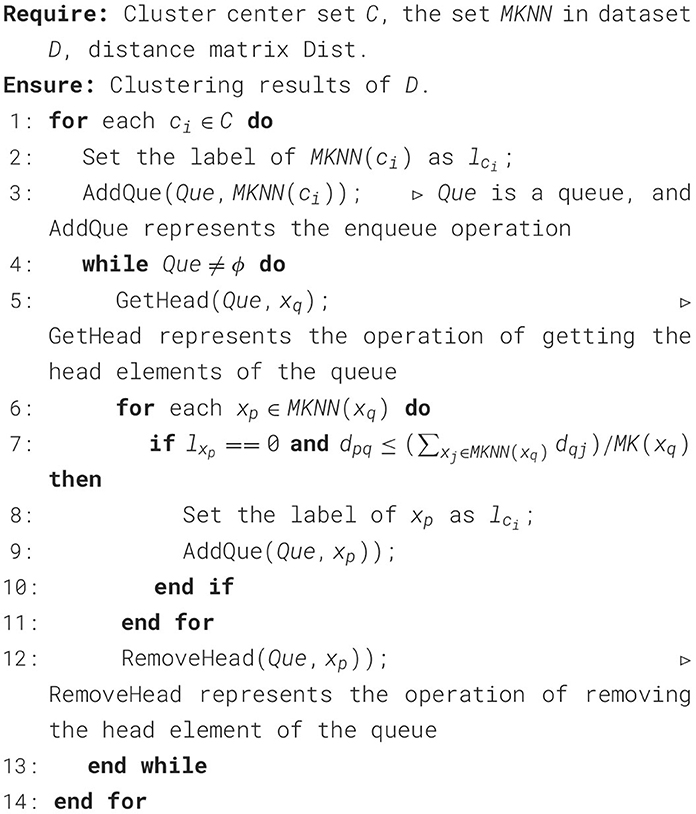
Algorithm 1. Initial assignment algorithm based on mutual K-nearest neighbors and breadth-first search.
The similarity Sij between data points xi and xj is defined as follows: if the distance between data points is smaller and the Sij value is larger, it indicates that the two data points are more similar, as shown in Equation 11.
To calculate the assignment probability p(xi, ct) of a data point xi belonging to cluster ct, we define wij as a weight. This weight is obtained by the similarity Sij and the mutual K-nearest neighbors of the data point xj, as shown in Equation 12.
The value of wijSij represents the weighted contribution of data point xj to p(xi, ct). This consideration takes into account the distance between data points xi and xj, as well as the weighted mutual K-nearest neighbors distribution of data points xj. This approach helps assign the remaining points to the most suitable cluster. The calculation method for p(xi, ct) is shown in Equation 13.
where ct is a cluster center and belongs to the cluster center set C. lxj = ct indicates that the label of data point xj belongs to ct. p(xi, ct) is explicitly normalized using .
The following are the remaining points assignment Algorithms 1, 2.
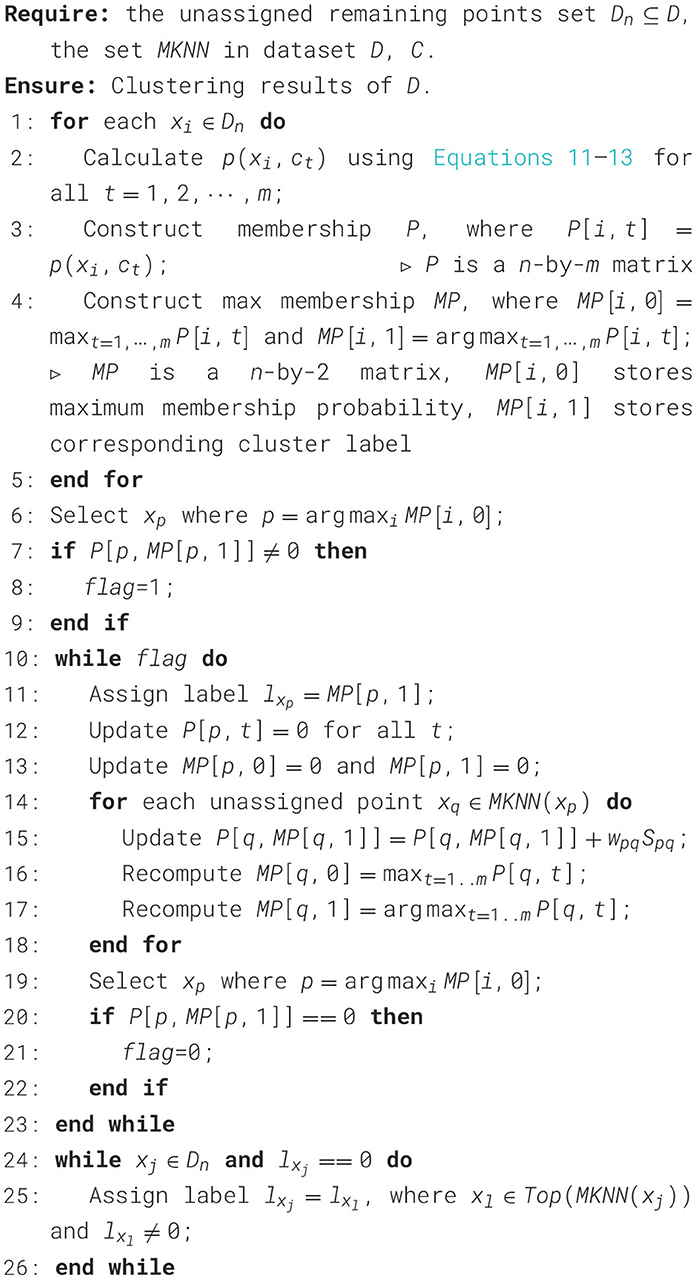
Algorithm 2. Membership assignment algorithm based on weighted mutual K-nearest neighbors.
In Algorithm 1, there is a key criterion for initial assignment of data point xp, which is Step 7. The purpose of step 7 is to ensure the accuracy of initial assignment as much as possible. In other words, when data point xp is unassigned, xp is the mutual K-nearest neighbor of xq and the distance between data point xp and xq is less than half of the sum of all mutual K-nearest neighbor distances of xq.
3.3 The procedure of WMKNNDPC
This section provides a detailed description of the WMKNNDPC algorithm process. To illustrate the proposed algorithm, Figure 3 presents a simple algorithm flowchart. The WMKNNDPC algorithm can be divided into several steps: (1) Input the dataset and calculate the Euclidean distance matrix between the data. (2) Calculate the mutual K-nearest neighbors for each data point by combining K-nearest neighbors and inverse K-nearest neighbors. (3) Calculate the local density and relative distance of each point. (4) Construct a two-dimensional decision graph. (5) Perform initial priority assignment by Algorithm 1. (6) Calculate the membership degree of the remaining points and classify them using Algorithm 2. (7) Obtain the final clustering result. Algorithm 3 provides a detailed implementation process.
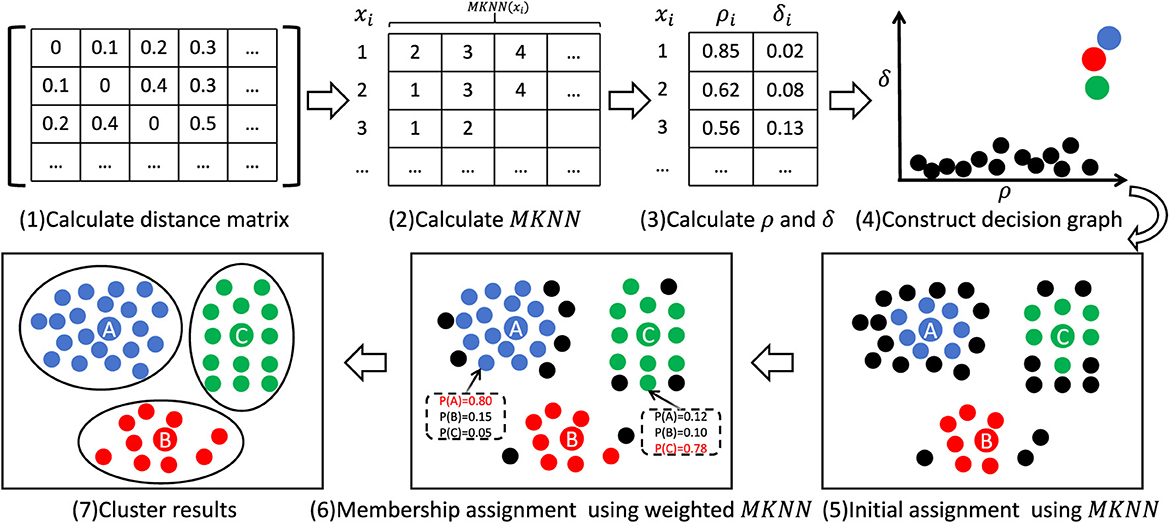
Figure 3. The WMKNNDPC algorithm flowchart.
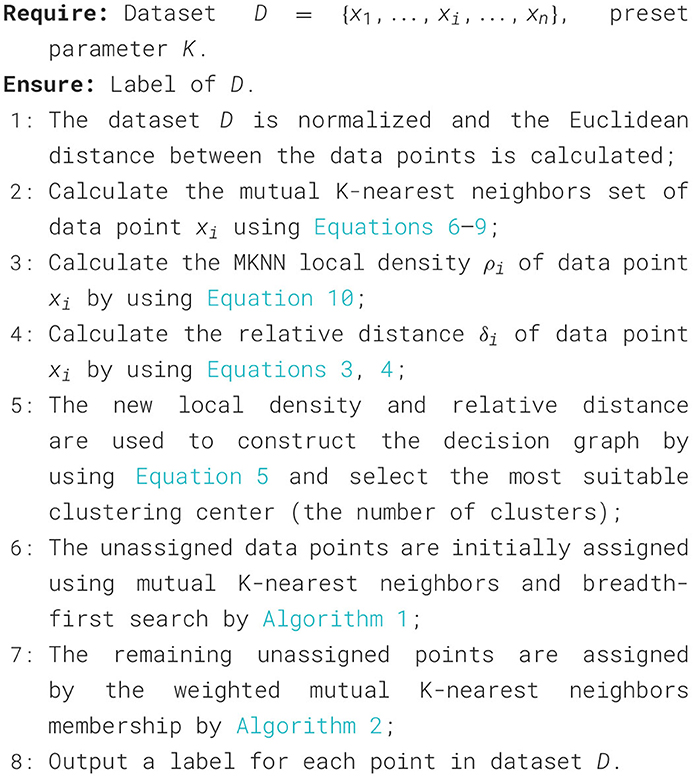
Algorithm 3. WMKNNDPC.
3.4 Time complexity analysis
This section focuses on evaluating the time complexity of WMKNNDPC. Assuming the size of the dataset is n, where k represents the number of nearest neighbors. According to the algorithm process, the time complexity is composed of the following parts: (1) The time consumption for calculating the Euclidean distance matrix is O(n2). (2) Calculate local density, including calculating K-nearest neighbors, inverse K-nearest neighbors, and mutual K-nearest neighbors, with time complexity of O(klogn), O(kn), and O(n2), respectively. (3) The time complexity of calculating the relative density between data points is O(n2). (4) The key to assignment Algorithm 1 is using the breadth-first search, which requires one queue. In the worst-case scenario, all data points are queued, with a time complexity of O(n). (5) In Algorithm 2, two aspects need to be considered: first, calculating the membership matrix of all unassigned points in the dataset and selecting the data point with the highest membership for category assignment, with a time complexity of O(kn); second, updating the membership matrix and calculating the membership probability of the data point, in the worst-case scenario is O(n2).
Based on the above analysis, we can conclude that the time complexity of WMKNNDPC is approximately O(n2), which is consistent with the original DPC algorithm.
4 Experiments and analyses
In this section, we will assess the performance of the WMKNNDPC algorithm and compare it with several other clustering algorithms, including K-means [16], DBSCAN [18], DPC [21], and DPC-derived algorithms such as DPC-KNN [27], FKNN-DPC [23], the density peaks clustering based on weighted local density sequence and nearest neighbor assignment (DPCSA) [41], and the density peaks clustering based on local fair density and fuzzy K-nearest neighbor membership allocation strategy (LF-DPC) [42]. To ensure the consistency of the experiment, all tests were carried out in a consistent software and hardware environment, utilizing an i5-11400H @ 2.70GHz CPU, 16GB RAM, WIN10 x64 OS, and MATLAB 2015b programming software.
4.1 Test datasets
The test datasets consist of eight classic artificially synthetic 2D datasets (Abbreviation: synthetic datasets) [43] and ten real datasets from the UCI database [44]. Testing the performance of the proposed algorithm from different perspectives will be helpful due to variations in data size, dimensions, and category numbers in the test datasets. Detailed information about the datasets can be found in Tables 1, 2.
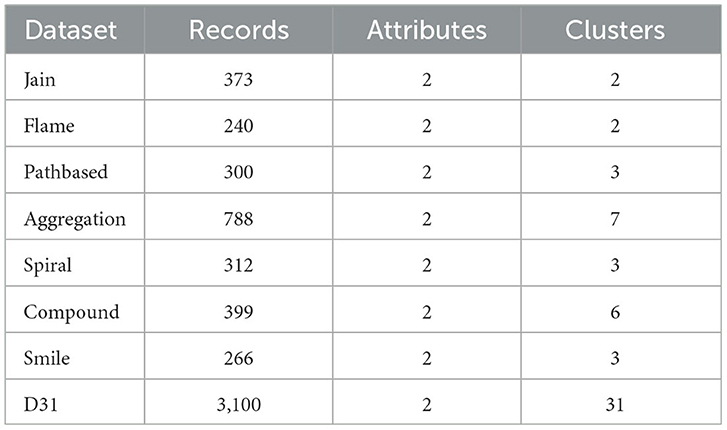
Table 1. The details of artificially synthetic 2D datasets.
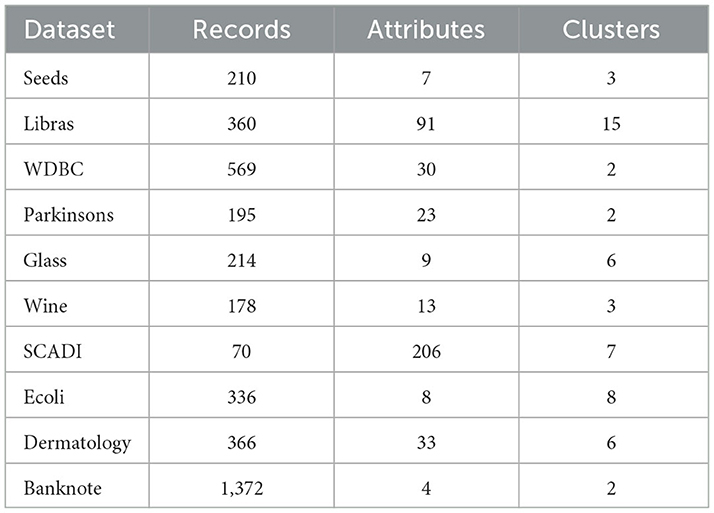
Table 2. The details of real datasets from UCI.
4.2 Evaluation criteria and experimental parameters
To assess the effectiveness of the proposed algorithm in this paper, three classic external clustering evaluation indicators were chosen as the metrics for the algorithm. These are the Adjusted Rand Index [ARI [45]], Adjusted Mutual Information [AMI [46]], and Folkes-Mallows Index [FMI [47]]. The closer the values of these three evaluation indicators are to 1, the better the clustering performance will be.
To compare different clustering algorithms, we fine-tuned their parameters to achieve the best clustering performance. For K-means clustering, the results are averaged over 10 runs due to the initial center's instability. The only parameter for K-means is the number of clusters. DBSCAN requires two parameters: the radius distance e and the minimum number MinPts. The parameter of DPC is the truncation distance dc, while the parameter for DPC-KNN is a percentage p controlling the number of K-nearest neighbors. Determining the optimal parameters for DPC and DPC-KNN is challenging. DPCSA does not need any parameters. WMKNNDPC, like FKNN-DPC and LF-DPC, only requires one parameter for K-nearest neighbors, making it easier to determine parameters compared to DPC. That is because the value of K is an integer, while the parameter dc of DPC is a percentage, K is easier to obtain than dc, especially for small datasets.
4.3 Experiments on synthetic datasets
In this section, we will focus on exploring the clustering results of various algorithms (WMKNNDPC, K-means, DBSCAN, DPC, DPC-KNN, FKNN-DPC, DPCSA, and LF-DPC) on synthetic datasets. We will visualize the best clustering results obtained by each algorithm on eight datasets, as illustrated in Figures 4–11. All algorithms, except DBSCAN, will be represented by red diamonds for their cluster centers. Additionally, the performance of each algorithm on the synthetic datasets will be compared based on the ARI, AMI, and FMI clustering results in Table 3. The best evaluation indicators have been highlighted in bold.
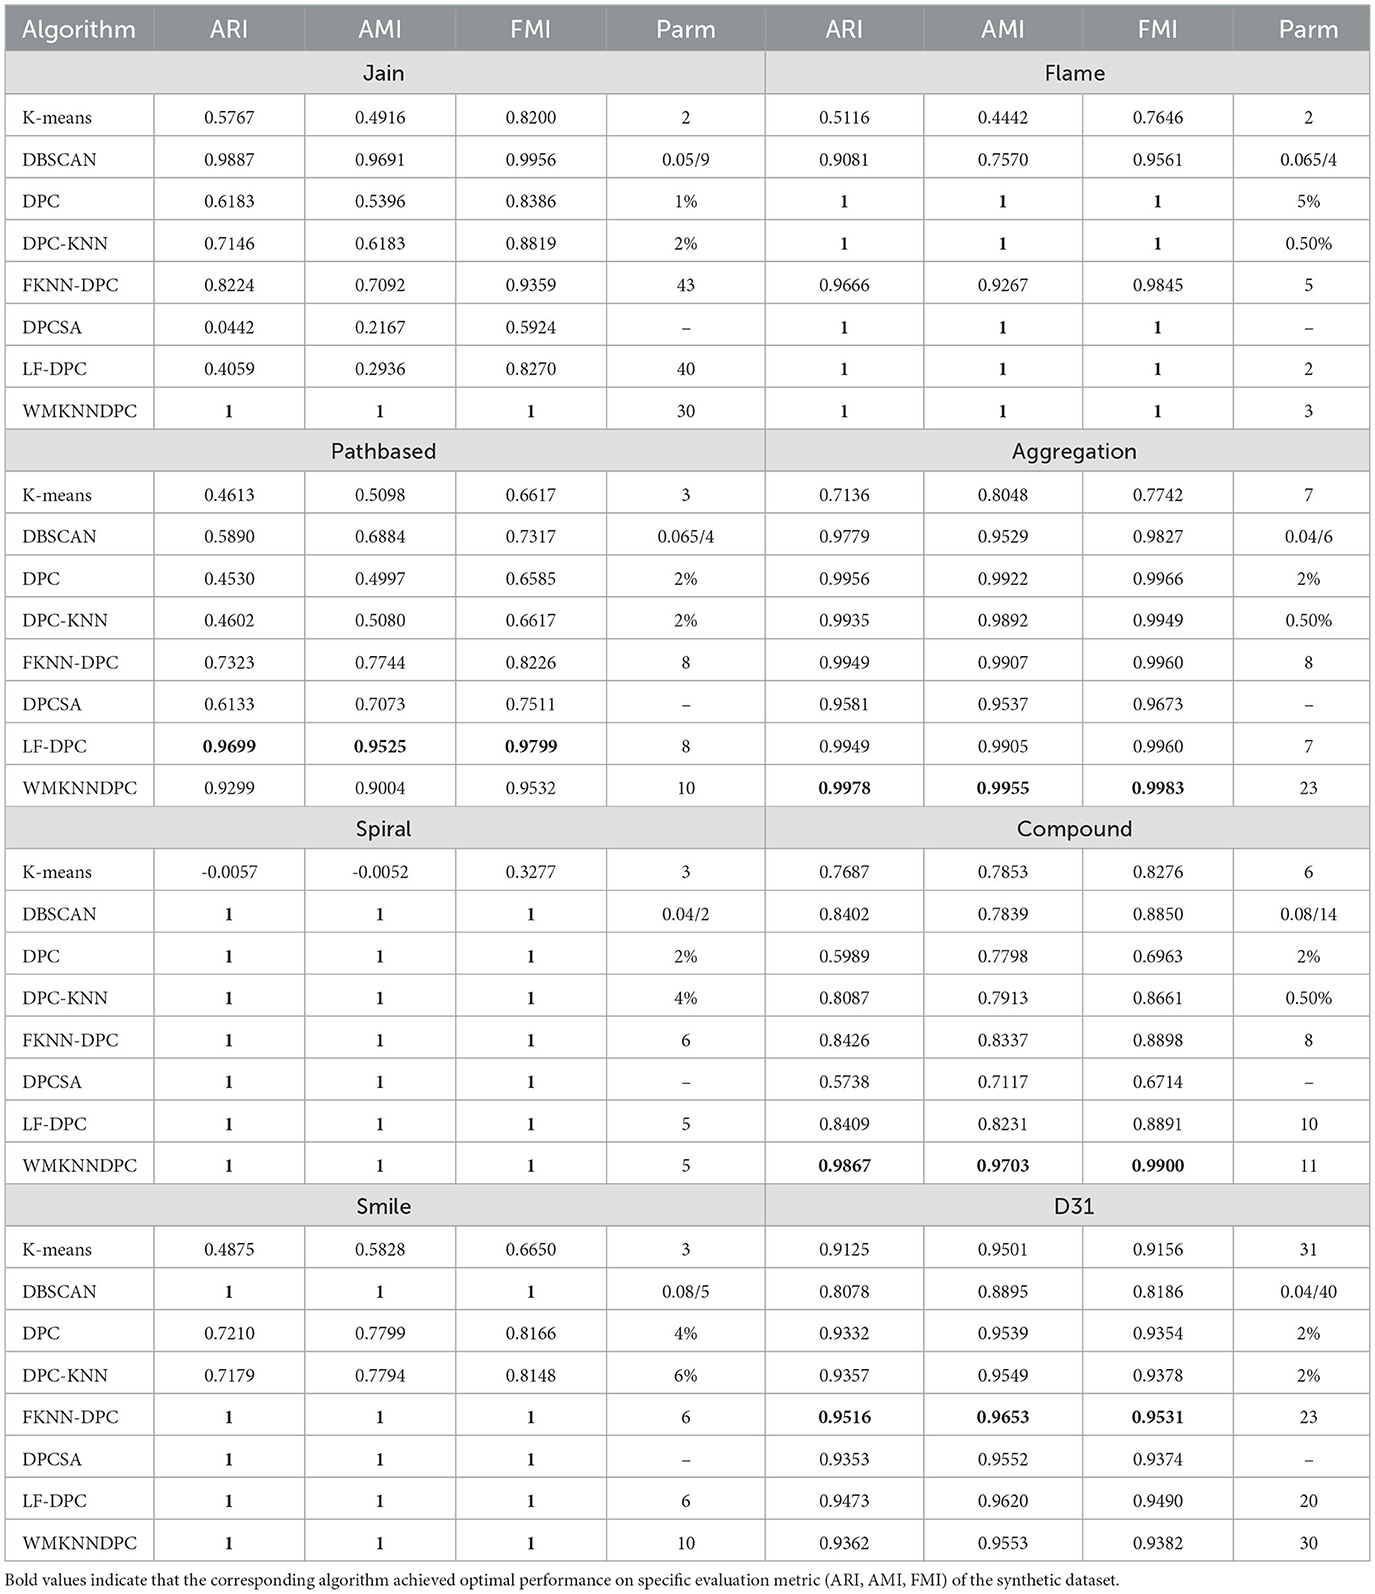
Table 3. Cluster results on synthetic datasets.
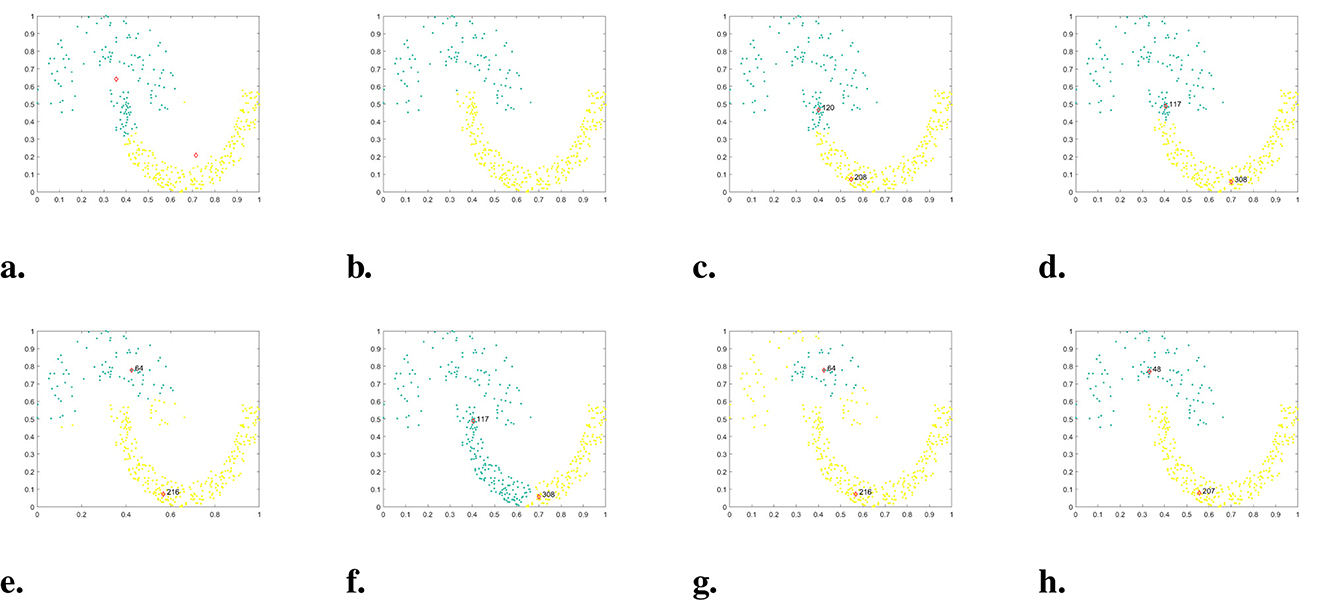
Figure 4. The clustering results of each algorithm on the Jain dataset. (a) K-means. (b) DBSCAN. (c) DPC. (d) DPC-KNN. (e) FKNN-DPC. (f) DPCSA. (g) LF-DPC. (h) Our.
In the given dataset, named Jain, there is an uneven density distribution, consisting of two semicircles. The cluster of data points in the upper semicircle is much sparser than the cluster in the lower semicircle. The clustering results of each algorithm are presented in Figure 4. It is evident that DPC, DPC-KNN, and DPCSA fail to find the correct cluster center primarily because they do not take into account the local distribution of data points when calculating local density. Though FKNN-DPC and LF-DPC can accurately locate cluster centers, some sparse data points in the upper half circle are incorrectly assigned to the lower half circle cluster due to the assignment strategy. K-means can approximately find the cluster center, but due to the assignment strategy considering only distance, some points have been assigned incorrectly. DBSCAN is the best-performing algorithm among the comparison algorithms, except for WMKNNDPC, which can correctly identify two clusters, but there are individual boundary points with category attribution errors. In contrast, our algorithm not only accurately finds cluster centers but also perfectly assigns remaining points. This is mainly due to the proposed new local density calculation method and remaining points assignment algorithm.
The Flame dataset consists of two evenly distributed clusters. According to the experimental results shown in Figure 5, both the original DPC and its derived algorithms (DPC-KNN, DPCSA, LF-DPC, and WMKNNDPC) can accurately identify two class centers and correctly assign the remaining points. However, FKNN-DPC correctly identifies cluster centers but has an assignment error in one data point on each side of the upper cluster. K-means can find suitable clustering centers but incorrectly attribute the data points in both clusters, resulting in the worst clustering performance. DBSCAN can correctly classify most of the data points, but it identifies 14 boundary points as noise.
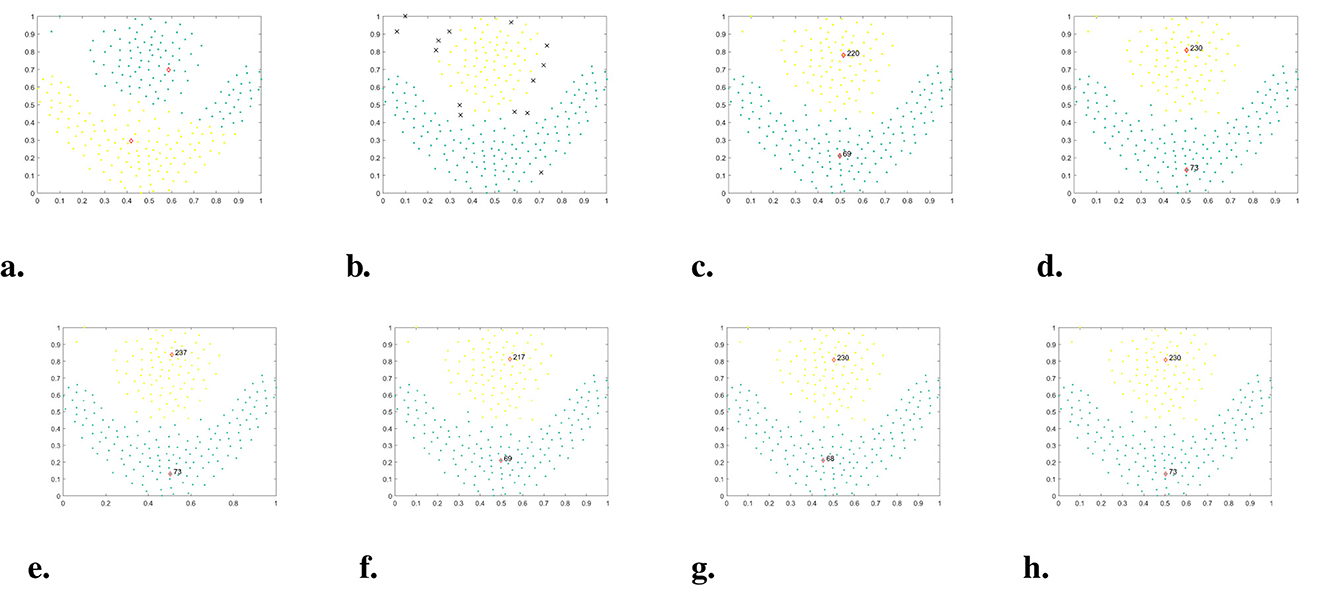
Figure 5. The clustering results of each algorithm on the Flame dataset. (a) K-means. (b) DBSCAN. (c) DPC. (d) DPC-KNN. (e) FKNN-DPC. (f) DPCSA. (g) LF-DPC. (h) Our.
The dataset Pathbased is a manifold dataset that consists of one circular cluster wrapping around two spherical clusters. Due to the proximity of data points on both sides of the spherical cluster to the circular cluster, assignment errors are easily caused. In Figure 6, both DPC and its DPC-derived algorithms can find cluster centers. The data points on both sides of the circular cluster in K-means, DPC, and DPC-KNN are incorrectly assigned to the spherical cluster, which is due to the assignment strategy that only considers distance. FKNN-DPC and DPCSA improved the assignment strategy, but there was an error in dividing the data points on the right side of the circular cluster. The clustering performance of DBSCAN is similar to that of DPCSA, but six spherical cluster boundary points are identified as noise. LF-DPC and WMKNNDPC can correctly partition the data points on both sides of a circular cluster, but there are still a few adhesive boundary point assignment errors, and our algorithm's performance is only inferior to LF-DPC.
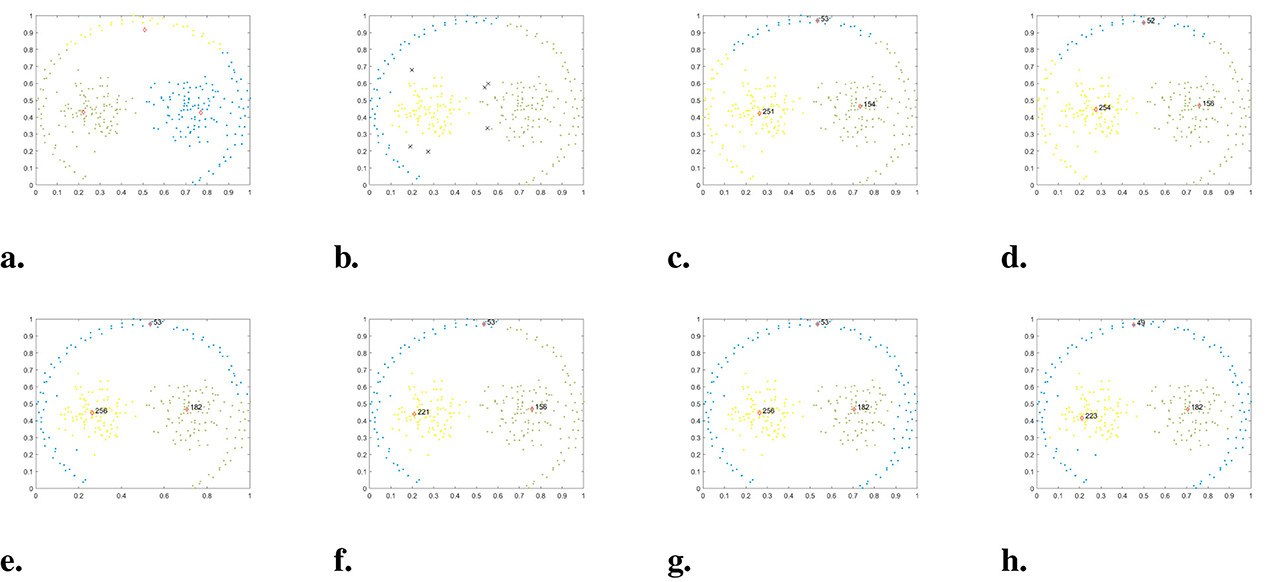
Figure 6. The clustering results of each algorithm on the Pathbased dataset. (a) K-means. (b) DBSCAN. (c) DPC. (d) DPC-KNN. (e) FKNN-DPC. (f) DPCSA. (g) LF-DPC. (h) Our.
Figure 7 illustrates the clustering performance of each algorithm on the Aggregation dataset. DBSCAN, DPC, DPC-KNN, FKNN-DPC, DPCSA, LF-DPC, and WMKNNDPC all demonstrate the ability to achieve good clustering results and identify seven clusters with different shapes. Our algorithm better than other comparative algorithms and attains the highest evaluation values for ARI, AMI, and FMI. K-means exhibits the poorest clustering performance on this dataset, which may be a common issue in partitioning clustering algorithms.
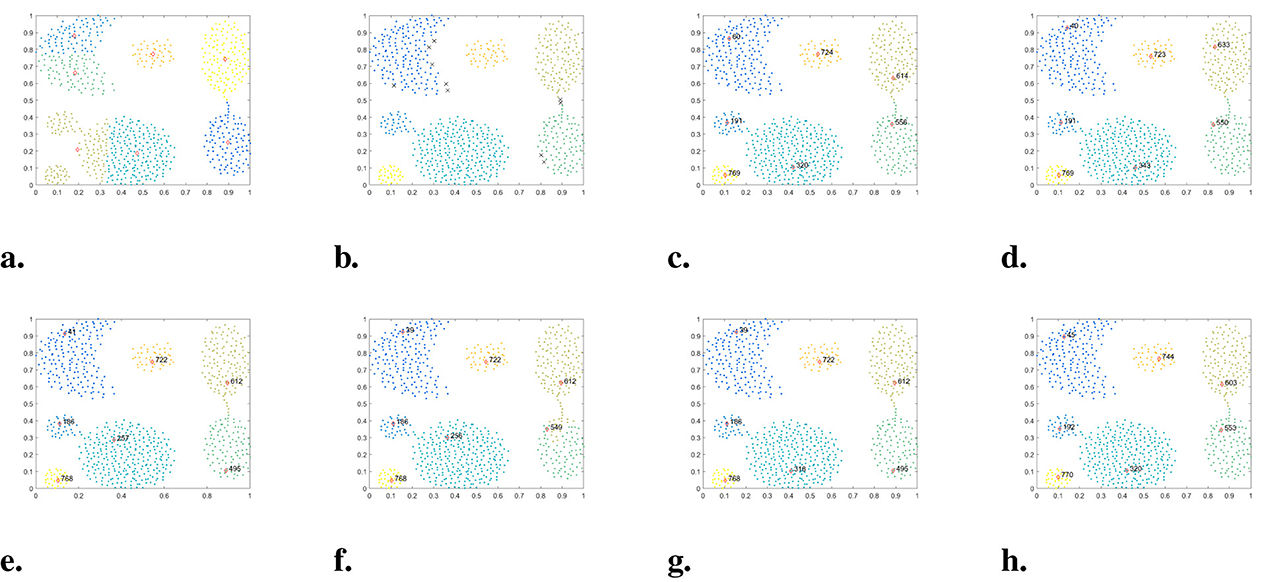
Figure 7. The clustering results of each algorithm on the Aggregation dataset. (a) K-means. (b) DBSCAN. (c) DPC. (d) DPC-KNN. (e) FKNN-DPC. (f) DPCSA. (g) LF-DPC. (h) Our.
Spiral is composed of three spiral clusters, which are typical nonspherical clusters. The accompanying Figure 8 illustrates that, except K-means, all other algorithms such as DBSCAN, DPC, and DPC-derived algorithms are able to cluster perfectly, with only slight variations in cluster centers.
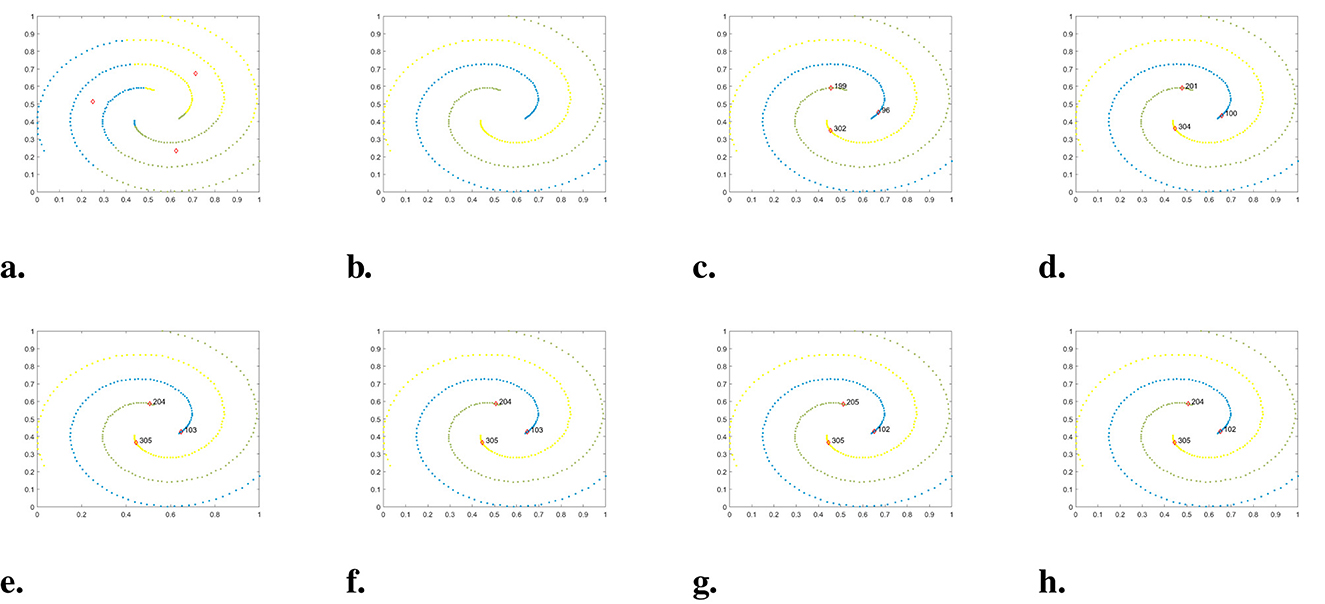
Figure 8. The clustering results of each algorithm on the Spiral dataset. (a) K-means. (b) DBSCAN. (c) DPC. (d) DPC-KNN. (e) FKNN-DPC. (f) DPCSA. (g) LF-DPC. (h) Our.
In Figure 9, the performance of WMKNNDPC and seven other comparison algorithms on the Compound dataset is demonstrated. The Compound dataset is a manifold dataset with an uneven density distribution and six arbitrary shapes. Detecting clusters in this dataset is a challenging task for many clustering algorithms. For example, K-means failed to identify two cluster centers on Compound, resulting in clustering errors for most points. DBSCAN only found four clusters and identified a large number of sparse boundary points as noise. DPC mistakenly identified two cluster centers from one cluster in the bottom left corner, mainly due to the local density calculation method. DPC-KNN could only find one cluster center in the bottom left of two clusters, while the sparse cluster on the right recognized two cluster centers, showcasing typical challenges faced by local density calculation methods. FKNN-DPC, DPCSA, and LF-DPC showed improved performance, but still faced challenges in finding cluster centers when dealing with sparse clusters and in identifying two cluster centers in the geese-shaped cluster in the upper right corner. One of the main reasons for these issues is the use of a fixed K-value, which does not adapt to the local distribution of data points. Although WMKNNDPC also faced challenges in identifying cluster centers in geese-shaped clusters, it managed to find the cluster centers of sparse clusters and correctly allocate sparse cluster data points. Additionally, the evaluation indicators of WMKNNDPC were significantly better than those of other algorithms.
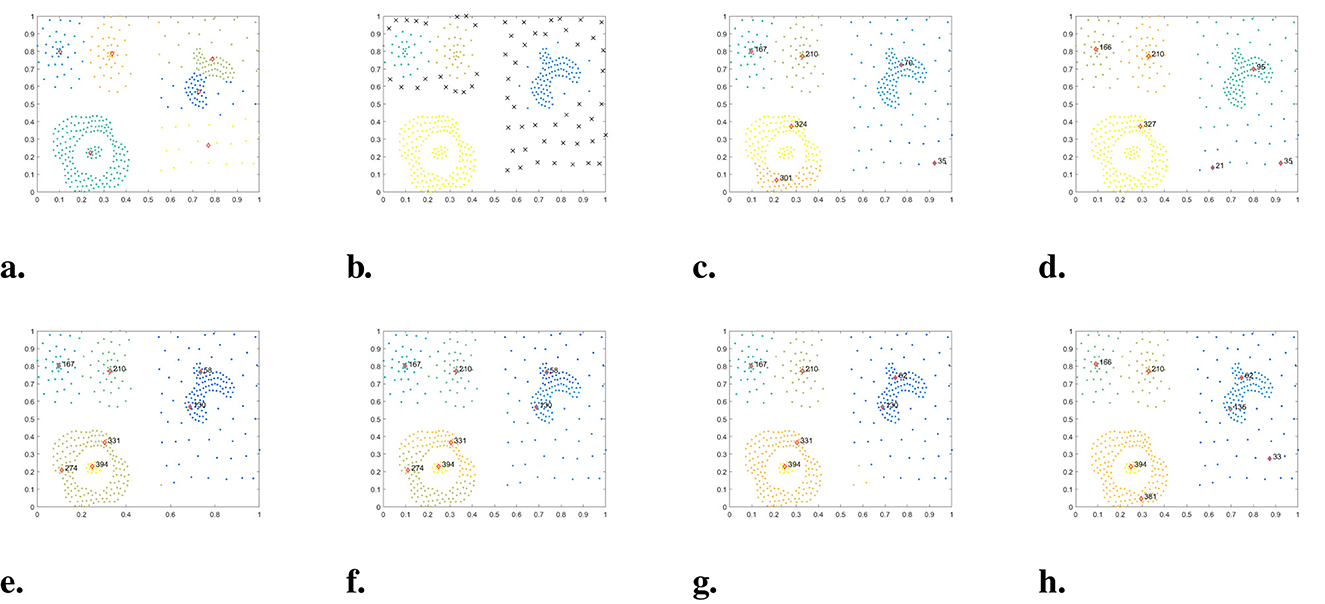
Figure 9. The clustering results of each algorithm on the Compound dataset. (a) K-means. (b) DBSCAN. (c) DPC. (d) DPC-KNN. (e) FKNN-DPC. (f) DPCSA. (g) LF-DPC. (h) Our.
The Smile dataset is surrounded by one semi-circular cluster and two square clusters, similar to the Pathbased dataset. In Figure 10, we can see the clustering results of each algorithm. Although K-means identifies three cluster centers, it incorrectly classifies the points of circular clusters into two square clusters. Similar issues are observed with DPC and DPC-KNN, as they also focus on assigning data points to the nearest neighbors in high-density areas. Our WMKNNDPC algorithm has the same performance as DBSCAN, FKNN-DPC, DPCSA, and LF-DPC, all of which can achieve perfect clustering.
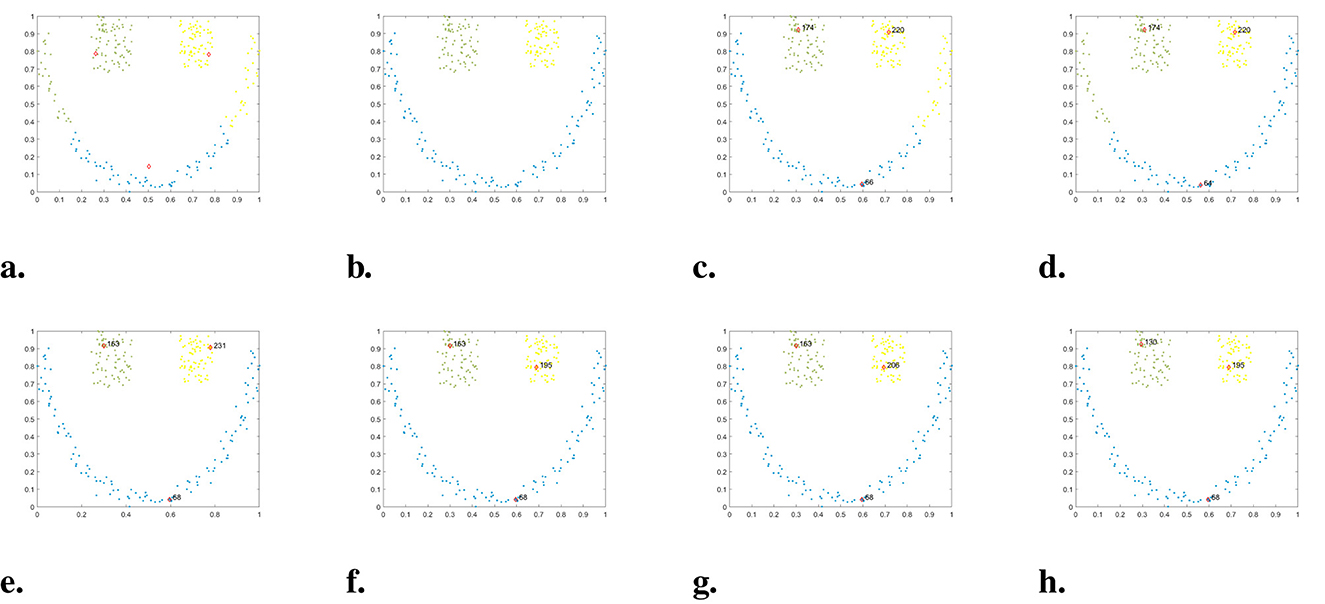
Figure 10. The clustering results of each algorithm on the Smile dataset. (a) K-means. (b) DBSCAN. (c) DPC. (d) DPC-KNN. (e) FKNN-DPC. (f) DPCSA. (g) LF-DPC. (h) Our.
The D31 dataset consists of 31 clusters containing a total of 3,100 data points. Several of these clusters are very close to each other, with some even partially overlapping. Results from the experiment shown in Figure 11 indicate that the K-means, DPC, and DPC-derived algorithms demonstrate strong clustering performance and are able to identify boundary points of different categories to a certain extent. According to various evaluation indicators, FKNN-DPC exhibits the best clustering performance, with our algorithm being only slightly inferior to FKNN-DPC and LF-DPC, but better than the other five algorithms.
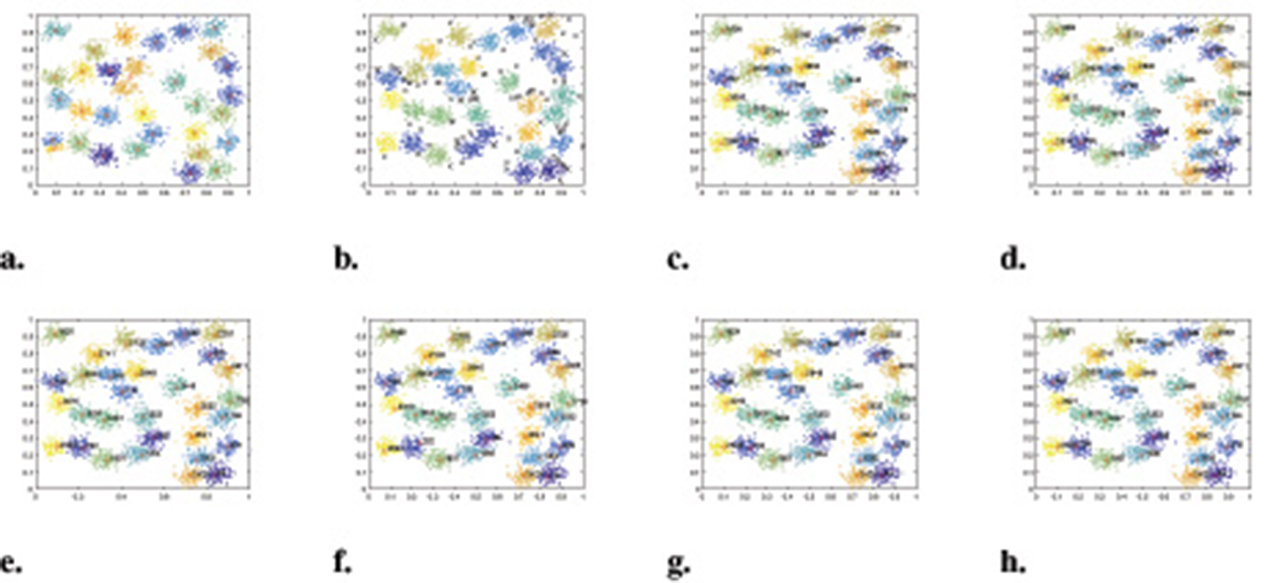
Figure 11. The clustering results of each algorithm on the D31 dataset. (a) K-means. (b) DBSCAN. (c) DPC. (d) DPC-KNN. (e) FKNN-DPC. (f) DPCSA. (g) LF-DPC. (h) Our.
In summary, the algorithm presented in this paper demonstrated excellent clustering performance on six artificial synthesis datasets. Our WMKNNDPC algorithm performed second best on the Pathbased dataset, trailing only LF-DPC. However, it still achieved impressive results, with an ARI of 0.9299, AMI of 0.9004, and FMI of 0.9532. The results on the D31 dataset were similar to those on the Pathbased dataset. Therefore, we have confidence in the proposed algorithm, which is based on mutual K-nearest neighbors local density and remaining points assignment, and its strong clustering performance.
4.4 Experiments on real datasets
In this section, we will evaluate the clustering performance of WMKNNDPC using real datasets from various research fields. These datasets vary in size, dimensions, and cluster numbers, allowing for a comprehensive assessment of the proposed algorithm's adaptability. Table 4 displays the clustering results of eight different algorithms applied to ten real datasets.
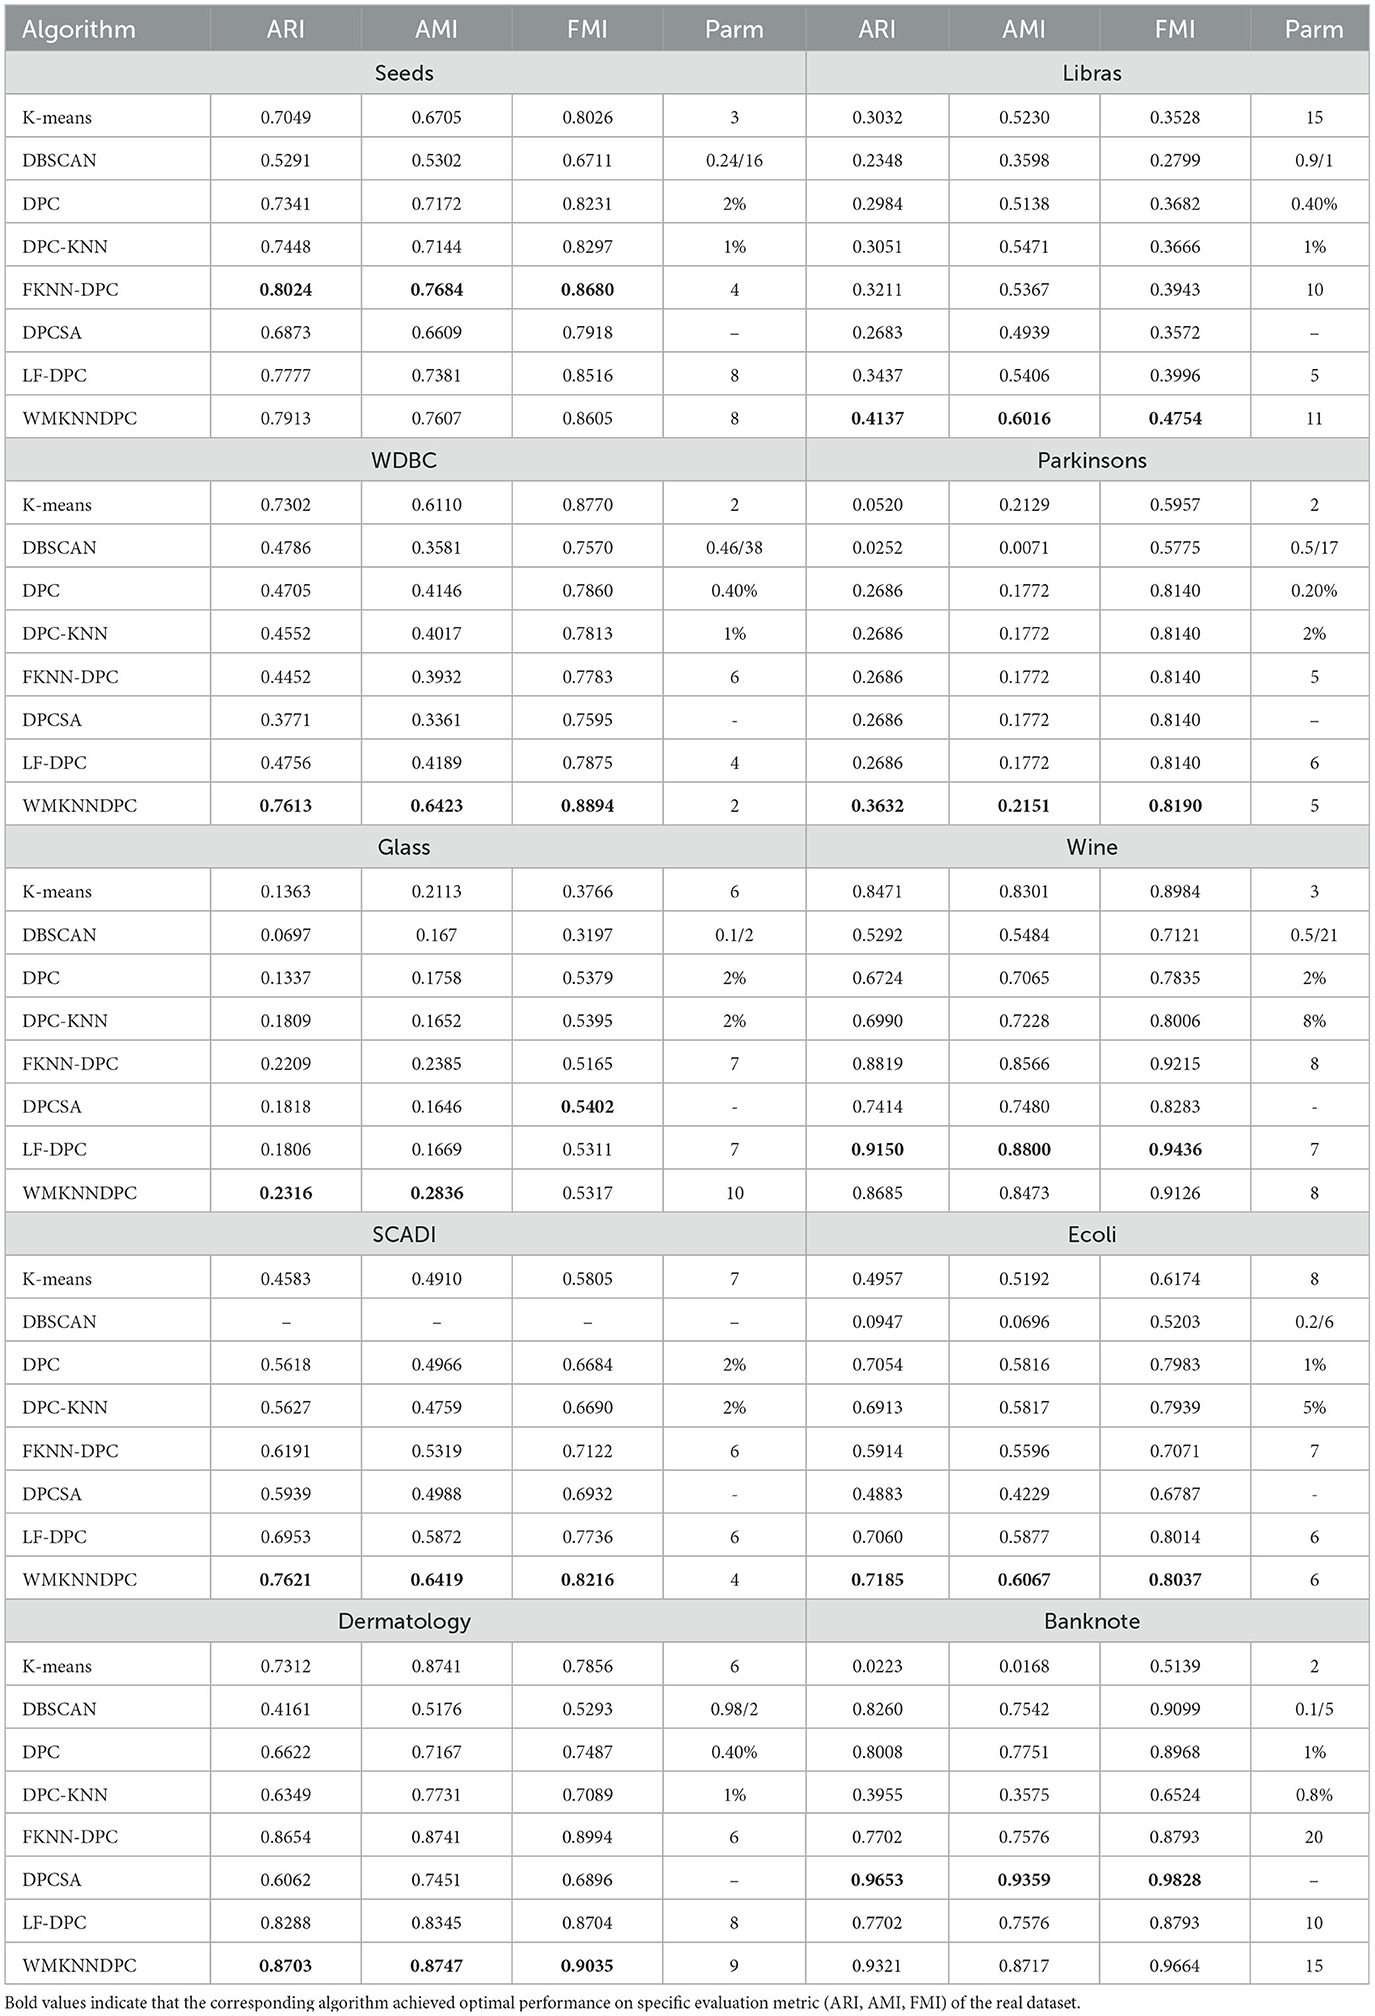
Table 4. Cluster results on real datasets.
Based on the data in Table 4, it is evident that the proposed WMKNNDPC algorithm is better than the other seven algorithms in ARI, AMI, and FMI evaluation indicators across the Libras, WDBC, Parkinsons, SCADI, Ecoli, and Dermatology datasets. Additionally, our algorithm shows superior performance in the ARI and AMI indicators compared to other algorithms in the Glass dataset.
In the Seeds dataset, the WMKNNDPC algorithm ranks second among all algorithms and is very close to FKNN-DPC in the evaluation indicators. FKNN-DPC's ARI value is 0.8024, while our ARI value is 0.7913, indicating that they are very comparable. Our algorithm performs far superior to the other six comparative algorithms. This is because FKNN-DPC obtains the best clustering result after parameter tuning, and our algorithm selects a K-value that is slightly larger to ensure that each point has mutual K-nearest neighbors with each other.
In comparing the Wine dataset, we observed that LF-DPC achieved the best clustering performance based on various indicators through local fair density, closely followed by FKNN-DPC and our algorithm.
In the Banknote dataset, DPCSA without any parameters achieved the best clustering performance, outperforming other algorithms. Our algorithm ranked second in all comparison results, showing that DPCSA's remaining points assignment algorithm is well-suited for this dataset.
According to Table 4, the WMKNNDPC algorithm performs better in clustering than other algorithms in most cases. It achieved the highest ARI and AMI indicators on the 7/10 dataset and the highest FMI on the 6/10 dataset. Even though the comparison algorithms were optimized, they did not perform as well as our WMKNNDPC algorithm. This is mainly due to the unique method for calculating the density of mutual K-nearest neighbors and the remaining points assignment algorithm based on weighted mutual K-nearest neighbors. Therefore, we can conclude that the WMKNNDPC algorithm is not only effective in discovering cluster centers but also in correctly assigning remaining points. It also demonstrates good adaptability on both manifold datasets and datasets with uneven density distribution.
4.5 Experiments on Olivetti face dataset
To further evaluate the performance of WMKNNDPC, we conducted experiments on the Olivetti face dataset to detect density peaks, complete clustering and compare with DPC, FKNN-DPC, and DPCSA. The Olivetti face dataset [48, 49] is a widely used test dataset in density peak clustering and machine learning. It consists of 40 types of faces, with each type having 10 different images.
To reduce experimental costs and computational load, we randomly selected 100 pictures of 10 types of faces for the experiment. In Figure 12, it is observed that DPC and DPCSA identified 11 and 12 density peaks, respectively, but did not accurately find the ideal 10 density peaks. Our WMKNNDPC performed similarly to FKNN-DPC in density peak detection, efficiently identifying 10 density peaks. Therefore, WMKNNDPC is better than DPC and DPCSA in locating cluster centers in the Olivetti face dataset.
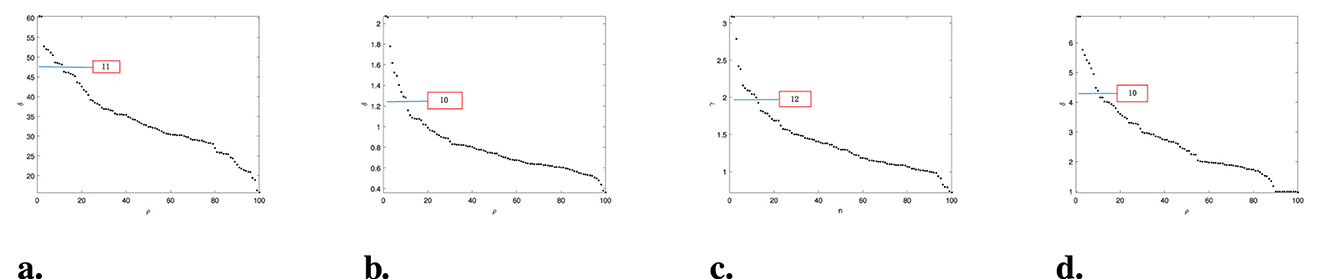
Figure 12. Select clustering centers in the Olivetti face dataset. (a) DPC (p = 3%). (b) KNN-DPC (k = 3). (c) DPCSA. (d) WMKNNDPC (k = 4).
We evaluated the clustering performance of WMKNNDPC on 10 different types of faces. We chose 10 density peaks of DPC, FKNN-DPC, DPCSA and WMKNNDPC as the clustering centers. The final clustering results can be seen in Figure 13, where white box dots indicate the clustering centers. It is evident that DPC is only able to accurately identify six cluster centers. However, in groups 3 and 6, multiple cluster centers appear due to its local density calculation method. FKNN-DPC and DPCSA can identify seven cluster centers, but there may still be multiple peaks problem. This is mainly because they use a fixed K-value for local density without considering the local distribution of the samples. However, our algorithm can efficiently identify 9 cluster centers. As shown in the clustering indicators results in Figure 14, WMKNNDPC is far superior to the other three algorithms in ARI, AMI, and FMI evaluation indicators. This further confirms the good performance of the proposed algorithm in cluster center recognition and remaining points assignment, mainly due to the adaptive ability of weighted mutual K-nearest neighbors.
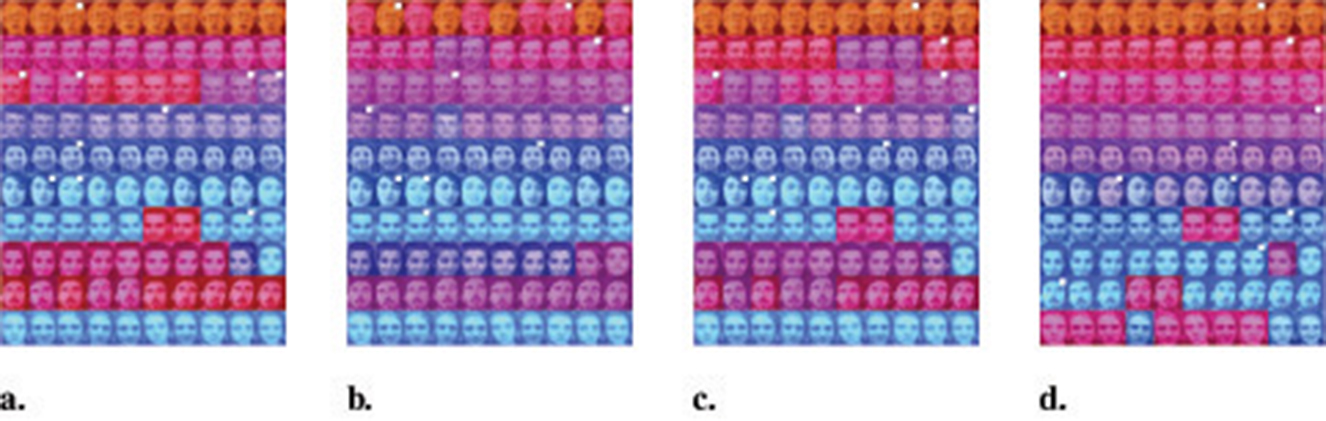
Figure 13. Graphical display of clustering results on Olivetti face dataset. (a) DPC (p = 3%). (b) KNN-DPC (k = 3). (c) DPCSA. (d) WMKNNDPC (k = 4).
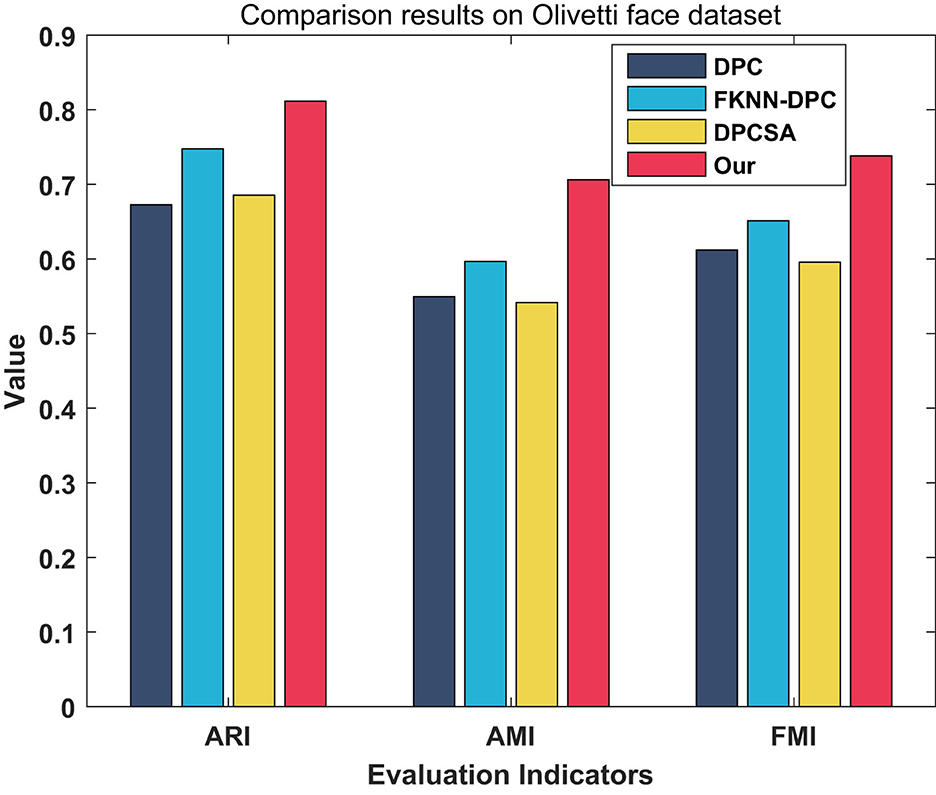
Figure 14. Comparison results of evaluation indicators on Olivetti face dataset.
4.6 Analyze different parameters of WMKNNDPC
This section will discuss the impact of the unique parameter K of WMKNNDPC on clustering performance. Four typical mainfold datasets and datasets with uneven density distribution (Jain, Pathbased, Aggregation and Compound), and four real datasets from UCI (Libras, Parkinsons, SCADI, and Dermatology) were used for experimental analysis.
Figure 15 displays the experimental results of parameters on the synthetic datasets. Differently colored lines represent various clustering indicators. The parameter K-value of the Jain dataset in Figure 15a ranges from 29 to 38. It is evident that WMKNNDPC performs clustering exceptionally well, except when K-values are 31, 37, and 38. Even in the worst case scenario, when K = 37, the Adjusted Rand Index is 0.9887. From Figure 15b, it is evident that the overall performance of WMKNNDPC is generally stable, except for K-values of 12 and 15. In the Aggregation parameter experiment, it was observed that WMKNNDPC is not significantly affected by the parameter K, and it exhibits a very good clustering effect. Upon examining Figure 15d, it is evident that the performance of WMKNNDPC experiences a slight decrease with an increase in the K-value, but overall performance remains relatively stable. However, in some extreme cases, such as in the Jain dataset, when the K-value is relatively small (K = 6), our algorithm obtains an ARI value of 0.5222. This is mainly because the K-value is small and there are fewer mutual K-nearest neighbors, making it difficult to capture the local distribution of data points. In the Aggregation dataset (with a size of 788), when the K-value is relatively large (K = 50, 60, 70), our algorithm obtains ARI values of 0.9095, 0.9072, and 0.9095, respectively. We can observe that when the K-value is relatively large, the clustering performance of WMKNNDPC on the Aggregation dataset remains relatively stable.
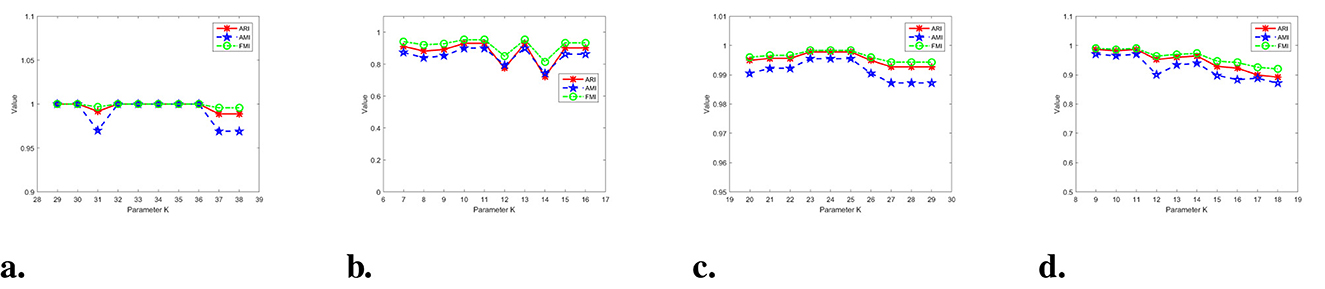
Figure 15. Results on four synthetic datasets with different parameter. (a) Jain dataset. (b) Pathbased dataset. (c) Aggregation dataset. (d) Compound dataset.
In Figure 16, the experimental results of the parameters on real datasets are presented. It was found that the optimal parameter value for the Libras dataset is K = 11. There are slight fluctuations in the performance of WMKNNDPC on both sides of the optimal parameter. In Figure 16b, our algorithm achieved the best clustering performance when K = 5. The clustering performance of WMKNNDPC is very stable when K>5. Similarly, in the testing of SCADI and Dermatology datasets, it is observed that WMKNNDPC is basically not affected by parameter and has good clustering performance.
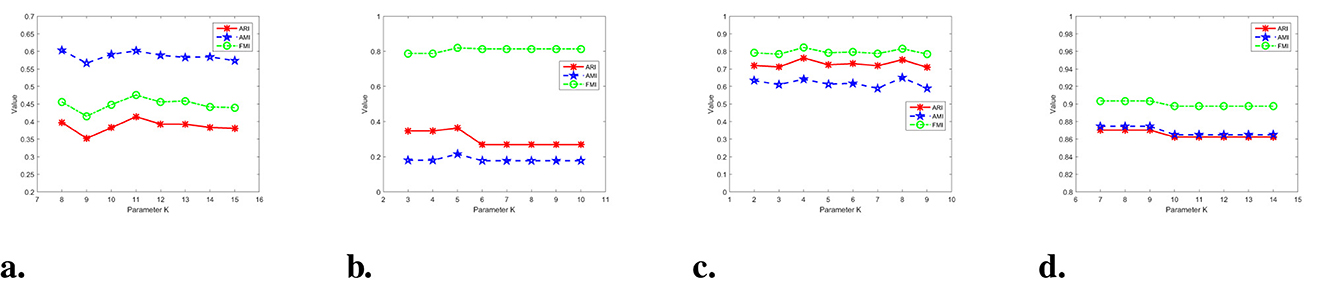
Figure 16. Results on four real datasets with different parameter. (a) Libras dataset. (b) Parkinsons dataset. (c) SCADI dataset. (d) Dermatology dataset.
According to parameter testing, the parameter of the WMKNNDPC algorithm is within a reasonable range, and its clustering performance is basically not affected by synthetic and real datasets. The main reason is that mutual K-nearest neighbors have adaptability and can effectively discover the true cluster centers. Moreover, our proposed remaining points assignment method based on weighted mutual K-nearest neighbors can effectively improve clustering accuracy.
4.7 Running time analysis
This section mainly analyzes the running time of the proposed algorithm and the comparative algorithm. DPC is a basic algorithm with significantly lower running time; DPC-KNN has recently improved local density and its running time is relatively low; The clustering principles of K-means and DBSCAN are inconsistent with the density peak clustering principle and lack comparability. Therefore, the reason for choosing FKNN-DPC, DPCSA, and LF-DPC as comparison algorithms is that these three algorithms simultaneously improve local density and optimize the remaining point allocation mechanism, which has comparative analysis value.
The running time of WMKNNDPC algorithm and comparative algorithms (FKNN-DPC, DPCSA, and LF-DPC) is shown in Table 5. The running time is the average of three runs of each algorithm, rounded to four decimal places, in seconds. We can see that DPCSA has the lowest running time because the algorithm uses a fixed K-value to calculate local density and allocate remaining points, without preset parameters. The running time of FKNN-DPC and LF-DPC is at the same level because the clustering principles of these two algorithms are very similar. Although WMKNNDPC has higher running time on most datasets compared to other algorithms, this is because our algorithm requires calculating weighted mutual K-nearest neighbors, which increases the time overhead in calculating local density and allocating remaining points. However, the clustering results are relatively good.
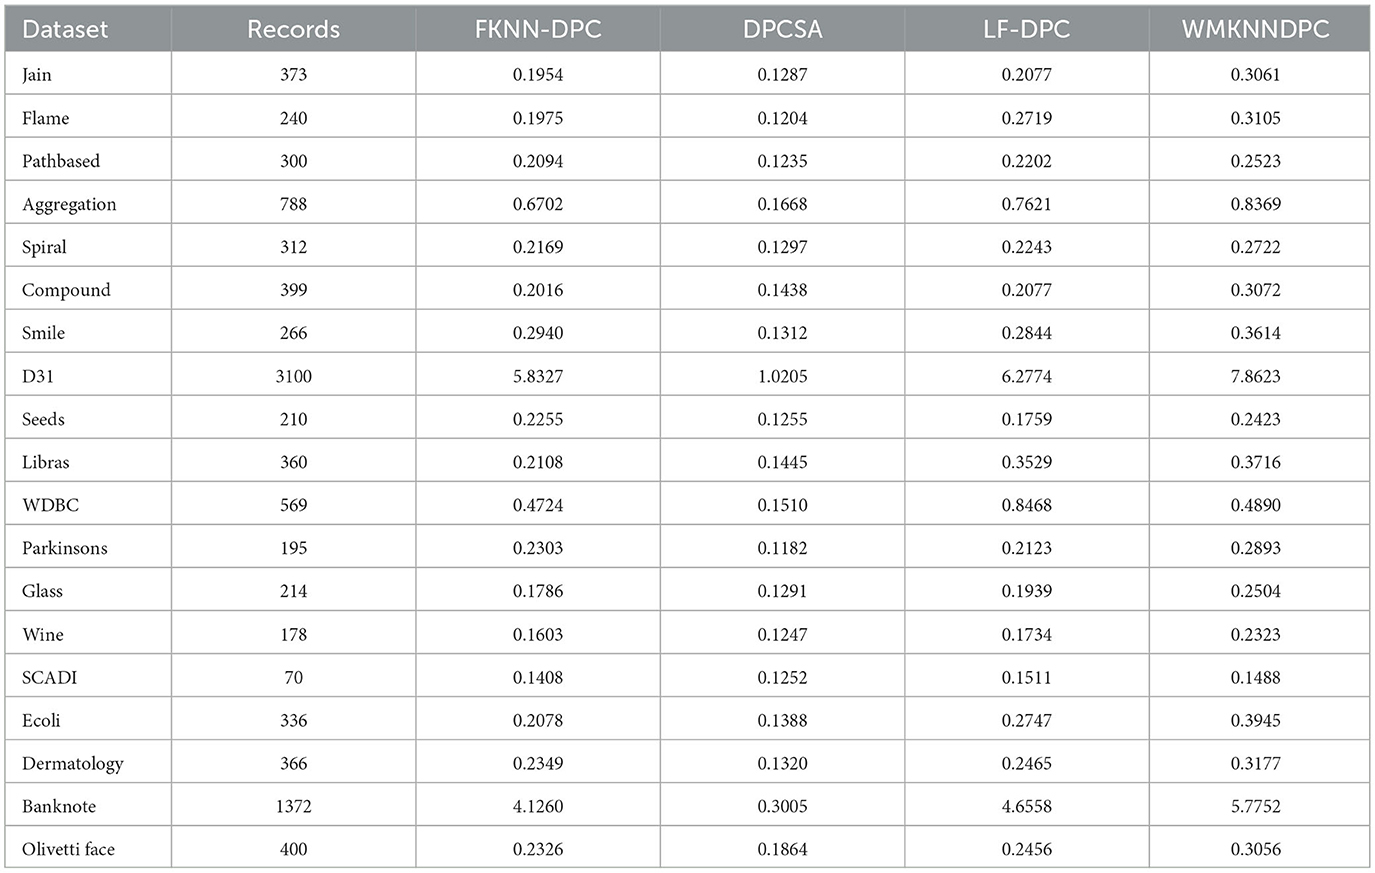
Table 5. Comparison results of running time.
5 Conclusion
This paper introduces a novel density peak clustering algorithm called WMKNNDPC, which is based on weighted mutual K-nearest neighbors. It includes a local density calculation method for mutual K-nearest neighbors to address DPC's difficulty in finding cluster centers in unevenly distributed clusters. Additionally, a remaining points assignment method based on weighted mutual K-nearest neighbors is designed, which is more adaptive than FKNN-DPC and LF-DPC. The initial assignment is carried out using mutual K-nearest neighbors and breadth-first search, and the remaining points are further assigned using the membership assignment algorithm of weighted mutual K-nearest neighbors. Extensive experimental testing shows that WMKNNDPC performs better than the original DPC and DPC-derived algorithms on most datasets, and its clustering results also surpass those of classical K-means and DBSCAN. However, it's worth noting that, while the algorithm has certain advantages, the selection of cluster centers still requires manual intervention. Future research will focus on automating the selection of cluster centers, especially in clusters with uneven distribution.
Data availability statement
The datasets presented in this study can be found in online repositories. The names of the repository/repositories and accession number(s) can be found at: http://archive.ics.uci.edu/. The relevant data and source code of this article can be found in the Supplementary material folder.
Author contributions
CR: Writing – review & editing, Writing – original draft. CL: Writing – review & editing, Supervision. YY: Formal analysis, Supervision, Writing – review & editing. WY: Supervision, Writing – review & editing. RG: Writing – review & editing, Methodology.
Funding
The author(s) declare that financial support was received for the research and/or publication of this article. This work was supported by the High-Level Departure Project of Yibin University (Grant No. 2023QH02) and Science and Technology Project of Sichuan Province (Grant Nos. 2024ZYD0089 and 2024YFHZ0022).
Acknowledgments
The authors express their gratitude to the researchers who provided the source codes of the comparative algorithms and the experimental data for this paper.
Conflict of interest
The authors declare that the research was conducted in the absence of any commercial or financial relationships that could be construed as a potential conflict of interest.
Correction note
This article has been corrected with minor changes. These changes do not impact the scientific content of the article.
Generative AI statement
The author(s) declare that no Gen AI was used in the creation of this manuscript.
Publisher's note
All claims expressed in this article are solely those of the authors and do not necessarily represent those of their affiliated organizations, or those of the publisher, the editors and the reviewers. Any product that may be evaluated in this article, or claim that may be made by its manufacturer, is not guaranteed or endorsed by the publisher.
Supplementary material
The Supplementary Material for this article can be found online at: https://www.frontiersin.org/articles/10.3389/fams.2025.1598165/full#supplementary-material
References
1. Frey BJ, Dueck D. Clustering by passing messages between data points. Science. (2007) 315:972–6. doi: 10.1126/science.1136800
2. Borlea ID, Precup RE, Borlea AB, Iercan D. A unified form of fuzzy C-means and K-means algorithms and its partitional implementation. Knowl-Based Syst. (2021) 214:106731. doi: 10.1016/j.knosys.2020.106731
3. Murtagh F, Contreras P. Algorithms for hierarchical clustering: an overview, II. Wiley Interdiscip Rev: Data Min Knowl Discov. (2017) 7:e1219. doi: 10.1002/widm.1219
4. Bai L, Cheng X, Liang J, Shen H, Guo Y. Fast density clustering strategies based on the k-means algorithm. Pattern Recognit. (2017) 71:375–86. doi: 10.1016/j.patcog.2017.06.023
5. Zhao J, Tang J, Fan T, Li C, Xu L. Density peaks clustering based on circular partition and grid similarity. Concurr Comput Pract Exp. (2019) 32:e5567. doi: 10.1002/cpe.5567
6. Yang MS, Chang-Chien SJ, Nataliani Y. Unsupervised fuzzy model-based Gaussian clustering. Inf Sci. (2019) 481:1–23. doi: 10.1016/j.ins.2018.12.059
7. Yin H, Benson AR, Leskovec J, Gleich DF. Local higher-order graph clustering. In: Proceedings of the 23rd ACM SIGKDD International Conference on Knowledge Discovery and Data Mining. New York, NY: ACM (2017). p. 555–64. doi: 10.1145/3097983.3098069
8. Li Y, Chu X, Tian D, Feng J, Mu W. Customer segmentation using K-means clustering and the adaptive particle swarm optimization algorithm. Appl Soft Comput. (2021) 113:107924. doi: 10.1016/j.asoc.2021.107924
9. Huang L, Ruan S, Denœux T. Application of belief functions to medical image segmentation: a review. Inf Fusion. (2023) 91:737–56. doi: 10.1016/j.inffus.2022.11.008
10. Lei T, Liu P, Jia X, Zhang X, Meng H, Nandi AK. Automatic fuzzy clustering framework for image segmentation. IEEE Trans Fuzzy Syst. (2019) 28:2078–92. doi: 10.1109/TFUZZ.2019.2930030
11. Tu B, Zhang X, Kang X, Wang J, Benediktsson JA. Spatial density peak clustering for hyperspectral image classification with noisy labels. IEEE Trans Geosci Remote Sens. (2019) 57:5085–97. doi: 10.1109/TGRS.2019.2896471
12. Kolhe L, Jetawat AK, Khairnar V. Robust product recommendation system using modified grey wolf optimizer and quantum inspired possibilistic fuzzy C-means. Cluster Comput. (2021) 24:953–68. doi: 10.1007/s10586-020-03171-6
13. Cai Q, Gong M, Ma L, Ruan S, Yuan F, Jiao L. Greedy discrete particle swarm optimization for large-scale social network clustering. Inf Sci. (2015) 316:503–16. doi: 10.1016/j.ins.2014.09.041
14. Qiu T, Li YJ. Fast LDP-MST: an efficient density-peak-based clustering method for large-size datasets. IEEE Trans Knowl Data Eng. (2023) 35:4767–80. doi: 10.1109/TKDE.2022.3150403
15. Lv Z, Di L, Chen C, Zhang B, Li N. A fast density peak clustering method for power data security detection based on local outlier factors. Processes. (2023) 11:2036. doi: 10.3390/pr11072036
16. Nie F, Li Z, Wang R, Li X. An effective and efficient algorithm for K-means clustering with new formulation. IEEE Trans Knowl Data Eng. (2022) 35:3433–43. doi: 10.1109/TKDE.2022.3155450
17. Ester M, Kriegel HP, Sander J, Xu X. A density-based algorithm for discovering clusters in large spatial databases with noise. In: Proceedings of the Second International Conference on Knowledge Discovery and Data Mining (KDD'96). Portland, OR: AAAI Press (1996). p. 226–231.
18. Schubert E, Sander J, Ester M, Kriegel HP, Xu X. DBSCAN revisited, revisited: why and how you should (still) use DBSCAN. ACM Trans Database Syst. (2017) 42:1–21. doi: 10.1145/3068335
19. Shi D, Wang J, Cheng D, Gao J. A global-local affinity matrix model via EigenGap for graph-based subspace clustering. Pattern Recognit Lett. (2017) 89:67–72. doi: 10.1016/j.patrec.2016.12.023
20. Asheri H, Hosseini R, Araabi BN. A new EM algorithm for flexibly tied GMMs with large number of components. Pattern Recognit. (2021) 114:107836. doi: 10.1016/j.patcog.2021.107836
21. Rodriguez A, Laio A. Clustering by fast search and find of density peaks. Science. (2014) 344:1492–6. doi: 10.1126/science.1242072
23. Xie J, Gao H, Xie W, Liu X, Grant PW. Robust clustering by detecting density peaks and assigning points based on fuzzy weighted K-nearest neighbors. Inf Sci. (2016) 354:19–40. doi: 10.1016/j.ins.2016.03.011
24. Liu R, Wang H, Yu X. Shared-nearest-neighbor-based clustering by fast search and find of density peaks. Inf Sci. (2018) 450:200–26. doi: 10.1016/j.ins.2018.03.031
25. Ren C, Sun L, Yu Y, Wu Q. Effective density peaks clustering algorithm based on the layered k-nearest neighbors and subcluster merging. IEEE Access. (2020) 8:123449–68. doi: 10.1109/ACCESS.2020.3006069
26. Wu C, Lee J, Isokawa T, Yao J, Xia Y. Efficient clustering method based on density peaks with symmetric neighborhood relationship. IEEE Access. (2019) 7:60684–96. doi: 10.1109/ACCESS.2019.2912332
27. Du M, Ding S, Jia H. Study on density peaks clustering based on k-nearest neighbors and principal component analysis. Knowl-Based Syst. (2016) 99:135–45. doi: 10.1016/j.knosys.2016.02.001
28. Cheng D, Zhu Q, Huang J, Yang L. Natural neighbor-based clustering algorithm with density peeks. In: 2016 International Joint Conference on Neural Networks (IJCNN). Vancouver, BC: IEEE (2016). p. 92–8. doi: 10.1109/IJCNN.2016.7727185
29. Yaohui L, Zhengming M, Fang Y. Adaptive density peak clustering based on K-nearest neighbors with aggregating strategy. Knowl-Based Syst. (2017) 133:208–20. doi: 10.1016/j.knosys.2017.07.010
30. Li Z, Tang Y. Comparative density peaks clustering. Expert Syst Appl. (2018) 95:236–47. doi: 10.1016/j.eswa.2017.11.020
31. Xu X, Ding S, Xu H, Liao H, Xue Y. A feasible density peaks clustering algorithm with a merging strategy. Soft Comput. (2019) 23:5171–83. doi: 10.1007/s00500-018-3183-0
32. Parmar M, Wang D, Zhang X, Tan AH, Miao C, Jiang J, et al. REDPC: a residual error-based density peak clustering algorithm. Neurocomputing. (2019) 348:82–96. doi: 10.1016/j.neucom.2018.06.087
33. Wang Y, Wang D, Pang W, Miao C, Tan AH, Zhou Y. A systematic density-based clustering method using anchor points. Neurocomputing. (2020) 400:352–70. doi: 10.1016/j.neucom.2020.02.119
34. Wang Y, Yang Y. Relative density-based clustering algorithm for identifying diverse density clusters effectively. Neural Comput Appl. (2021) 33:10141–57. doi: 10.1007/s00521-021-05777-2
35. Xu T, Jiang J. A graph adaptive density peaks clustering algorithm for automatic centroid selection and effective aggregation. Expert Syst Appl. (2022) 195:116539. doi: 10.1016/j.eswa.2022.116539
36. Zhao J, Wang G, Pan JS, Fan T, Lee I. Density peaks clustering algorithm based on fuzzy and weighted shared neighbor for uneven density datasets. Pattern Recognit. (2023) 139:109406. doi: 10.1016/j.patcog.2023.109406
37. Xie J, Liu X, Wang M. SFKNN-DPC: standard deviation weighted distance based density peak clustering algorithm. Inf Sci. (2024) 653:119788. doi: 10.1016/j.ins.2023.119788
38. Yan H, Wang M, Xie J. ANN-DPC: density peak clustering by finding the adaptive nearest neighbors. Knowl-Based Syst. (2024) 294:111748. doi: 10.1016/j.knosys.2024.111748
39. Fan JC, Jia PL, Ge L. Mk-NNG-DPC: density peaks clustering based on improved mutual K-nearest-neighbor graph. Int J Mach Learn Cybern. (2019) 11:1179–95. doi: 10.1007/s13042-019-01031-3
40. Li C, Ding S, Xu X, Hou H, Ding L. Fast density peaks clustering algorithm based on improved mutual K-nearest-neighbor and sub-cluster merging. Inf Sci. (2023) 647:19. doi: 10.1016/j.ins.2023.119470
41. Yu D, Liu G, Guo M, Liu X, Yao S. Density peaks clustering based on weighted local density sequence and nearest neighbor assignment. IEEE Access. (2019) 7:34301–17. doi: 10.1109/ACCESS.2019.2904254
42. Ren C, Sun L, Gao Y, Yu Y. Density peaks clustering based on local fair density and fuzzy k-nearest neighbors membership allocation strategy. J Intell Fuzzy Syst. (2022) 43:21–34. doi: 10.3233/JIFS-202449
43. Wang Y, Qian J, Hassan M, Zhang X, Zhang T, Yang C, et al. Density peak clustering algorithms: a review on the decade 2014-2023. Expert Syst Appl. (2024) 238:121860. doi: 10.1016/j.eswa.2023.121860
44. Dua D, Graff C. UCI Machine Learning Repository. Irvine, CA: University of California, School of Information and Computer Sciences (2017). Available online at: http://archive.ics.uci.edu/ml (Accessed September 19, 2024).
45. Fränti P, Rezaei M, Zhao Q. Centroid index: cluster level similarity measure. Pattern Recognit. (2014) 47:3034–45. doi: 10.1016/j.patcog.2014.03.017
46. Vinh NX, Epps J, Bailey J. Information theoretic measures for clusterings comparison: variants, properties, normalization and correction for chance. J Mach Learn Res. (2010) 11:2837–54.
47. Boudane F, Berrichi A. Gabriel graph-based connectivity and density for internal validity of clustering. Prog Artif Intell. (2020) 9:221–38. doi: 10.1007/s13748-020-00209-z
48. Cambridge AL. The Database of Faces. AT&T Laboratories Cambridge (1992). Original dataset release with 400 images of 40 subjects. Available online at: https://www.cl.cam.ac.uk/research/dtg/attarchive/facedatabase.html (Accessed September 19, 2024).
Keywords: K-nearest neighbors, inverse K-nearest neighbors, weighted mutual K-nearest neighbors, local density, remaining points assignment, density peak clustering
Citation: Ren C, Li C, Yu Y, Yang W and Guo R (2025) Density peak clustering algorithm based on weighted mutual K-nearest neighbors. Front. Appl. Math. Stat. 11:1598165. doi: 10.3389/fams.2025.1598165
Received: 25 March 2025; Accepted: 31 July 2025;
Published: 01 September 2025; Corrected: 05 September 2025.
Edited by:
Daniel Potts, Chemnitz University of Technology, GermanyReviewed by:
Kai Bergermann, Chemnitz University of Technology, GermanyMichael Quellmalz, Technical University of Berlin, Germany
Copyright © 2025 Ren, Li, Yu, Yang and Guo. This is an open-access article distributed under the terms of the Creative Commons Attribution License (CC BY). The use, distribution or reproduction in other forums is permitted, provided the original author(s) and the copyright owner(s) are credited and that the original publication in this journal is cited, in accordance with accepted academic practice. No use, distribution or reproduction is permitted which does not comply with these terms.
*Correspondence: Chaorong Li, bGljaGFvcm9uZzg4QDE2My5jb20=