 Yuxi Zhu
 Shi Du3
- 1Department of Pediatrics, University Hospitals Rainbow Babies & Children's Hospital, Cleveland, OH, United States
- 2Division of Biostatistics, College of Public Health, The Ohio State University, Columbus, OH, United States
- 3International College of Pharmaceutical Innovation, Soochow University, Suzhou, China
- 4UH Rainbow Center for Child Health and Policy, University Hospitals Rainbow Babies and Children's Hospital, Cleveland, OH, United States
Accurate sample size estimation is a cornerstone of successful Institutional Review Board (IRB) proposals, as it establishes the feasibility of clinical studies and ensures they are sufficiently powered to detect meaningful effects. Underestimating sample size poses the risk of insufficient statistical power, compromising the ability to identify significant outcomes. Conversely, overestimating sample size can lead to prolonged data collection, wasting valuable time and resources. One of the primary challenges in sample size estimation lies in the uncertainty surrounding variance and effect size before the study begins. Group Sequential Design with Sample Size Re-estimation (GSD-SSR) effectively addresses this issue by utilizing interim data at predefined stages to refine these estimates. GSD-SSR enables dynamic adjustments to sample size during the study, optimizing resource allocation and improving overall efficiency. We offer a comprehensive introduction to the theoretical background of GSD-SSR and provide step-by-step guidance for its practical application in clinical research. To further facilitate adoption, we have developed a user-friendly online platform that streamlines the GSD-SSR process and integrates it seamlessly into IRB proposals. By incorporating GSD-SSR into the power analysis of IRB proposals, researchers can significantly increase the likelihood of successful clinical studies while enhancing budget efficiency and optimizing timelines.
1 Introduction
Power analysis is a critical component of an Institutional Review Board (IRB) proposal for a clinical study, as it establishes the study's feasibility and ensures the sample size is sufficient to detect meaningful effects. A poorly conducted power analysis can lead to either overestimating or underestimating the required sample size, both of which carry significant consequences. Overestimating the sample size unnecessarily increases the study's duration and costs, even if statistical power is achieved. In contrast, underestimating the sample size can compromise the study's ability to detect significant effects, potentially leading to inconclusive or misleading results. A notable example of the consequences of underestimating sample size is the Cardiac Insufficiency Bisoprolol Study (CIBIS) [1]. In the initial trial conducted in 1989, 261 events were observed, but the study failed to demonstrate a significant survival benefit of bisoprolol. However, a subsequent trial, conducted a decade later with an increased sample size of 384 events, successfully showed that bisoprolol significantly reduced mortality in heart failure patients. This example highlights the critical importance of accurate power analysis in clinical research.
Power analysis typically involves estimating the appropriate variance and determining the effect size necessary to achieve sufficient statistical power. However, these estimates are often uncertain during the planning phase, as the variance may be poorly understood or even unknown [2], and the choice of effect size may be based on limited or preliminary data. If the variance estimate used in the power calculation is too low or the effect size is overly optimistic, the study may be underpowered, resulting in low statistical power and potentially failing to detect a clinically meaningful difference [3]. Conversely, if the variance estimate is too high or the effect size is too conservative, the sample size required to achieve the desired power may be unnecessarily large, leading to increased costs, longer recruitment times, and delays in completing the trial. In addition to the uncertainty in the variance and effect size, other factors can also impact the power of a clinical trial, including the choice of statistical test, the level of significance, and the type of study design. To address these issues, various statistical methods and trial designs have been developed, such as group sequential designs (GSD) [4] and sample size adaptation designs [5].
GSD is an adaptive design that does not require a predefined total number of patients. Instead, GSD uses several predefined stages for interim analyses, with three important components at each stage: sample size, efficacy boundary, and test statistics. If the test statistics exceed the efficacy boundary, the trial can be stopped early, while maintaining control over the overall type I error and statistical power [4]. The main advantage of GSD is the ability to stop the trial at any stage based on the interim analysis, which may reduce the required sample size for a clinical trial.
In GSD, the sample size required at each stage is predefined, and the trial follows the established protocol. However, GSD does not address the issue of insufficient conditional power in subsequent stages. For instance, in a two-stage GSD, the conditional power at the second stage, based on interim results from the first stage, may fall below the predefined target, such as 90%. Continuing the study under the original design in such cases increases the likelihood of failure [6]. To address this, sample size re-estimation can be employed to adjust the trial design or sample size, thereby enhancing the probability of success. Additionally, adapting the sample size during the trial can optimize resource utilization at each stage, reducing the overall time required to achieve a successful outcome [7].
Group Sequential Design with Sample Size Re-estimation (GSD-SSR) offers a robust framework for ensuring the success of clinical studies while providing significant economic benefits. However, its application remains limited in hospital systems that handle a high volume of IRB proposals, despite the potential advantages that could be realized by incorporating an additional layer into the IRB proposal process. Moreover, no existing publication comprehensively bridges the gap between the theoretical foundations of GSD-SSR and its practical implementation.
Our study is designed to serve as a comprehensive resource for understanding GSD-SSR, offering an ideal introduction for researchers seeking an efficient and practical grasp of these methods. Recognizing that the complex mathematical formulations of GSD-SSR can be challenging for those from non-mathematical fields, we focus specifically on two-stage GSD-SSR, providing a clear, step-by-step explanation of its practical application. This is further supplemented with detailed examples to enhance understanding. To support researchers, we have also developed an accessible online platform that simplifies the implementation of two-stage GSD-SSR. Our goal is to guide researchers through every step of applying GSD-SSR, bridging the gap between theoretical concepts and real-world application.
This paper is organized as follows: Following the introduction, we present the theoretical foundations of GSD-SSR, with additional details provided in the Supplementary Appendix. In the application section, we offer a step-by-step guide to implementing two-stage GSD-SSR using our developed website, demonstrated through a simulated scenario and two real-world examples. Furthermore, we include a sample power analysis that incorporates two-stage GSD-SSR, showcasing how it can be seamlessly integrated as an additional layer into the standard proposal process. Finally, we conclude with a discussion summarizing our findings and their broader implications.
2 Method foundation
2.1 Critical boundaries in two-stage GSD
In transitioning from a single-test setting conducted at the end of a planned study to a two-stage GSD, additional considerations are required to control the type I error rate. The introduction of an interim test requires maintaining the overall type I error within the predefined significance level. Two commonly used schemes for setting critical boundaries are the O'Brien-Fleming and Pocock methods. For cases where half of the patients are enrolled by the first stage, the critical boundaries are presented in Table 1. An alternative approach for controlling the overall type I error rate is the α spending function, which allows flexible allocation of type I error across interim analyses. For readers interested in a more comprehensive exploration of this topic and its theoretical underpinnings, additional details are provided in the Supplementary Appendix.
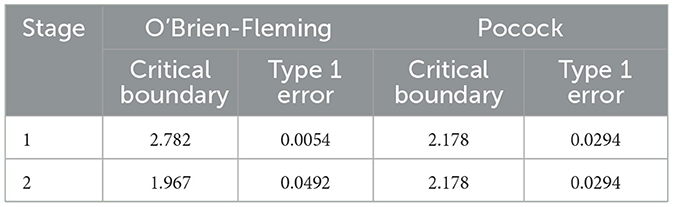
Table 1. Critical boundaries and type I error allocation in two-stage group sequential designs using O'Brien-Fleming and Pocock methods.
2.2 Conditional power at the first stage
Conditional power is defined as
Where,
• Zinterim is the interim test statistic at the first stage.
• Z1 is the test statistics at the final stage.
• b1 is the critical boundary for rejecting the null hypothesis at the final stage.
• t represents the proportion of information available at the first stage, calculated as , where S1 is the sample size at first stage and S is the total planned sample size at the start of the study.
Conditional power is interpreted as the probability of rejecting the null hypothesis at the final stage, given the test statistic observed at the first stage. When PHa(Z1>b1|Zinterim) is smaller than the power predefined at the beginning of the study, sample size re-estimation can be applied to achieve the desired power.
2.3 Sample size re-estimation
When the conditional power at the first stage is lower than the predefined power, sample size re-estimation can be performed. In this process, the critical boundary at the second stage must also be adjusted to ensure type I error control.
The new estimated sample size can be determined by solving the following equation:
Where, t* is the new information. . S2 is the new estimated sample size.
The adjusted critical boundary for the second stage is calculated as:
After sample size re-estimation, we compare the final test statistics to the adjusted critical boundary.
After re-estimating the sample size, the final test statistic is compared to the adjusted critical boundary to make a conclusion. The flowchart of two-stage GSD-SSR is provided in Figure 1.
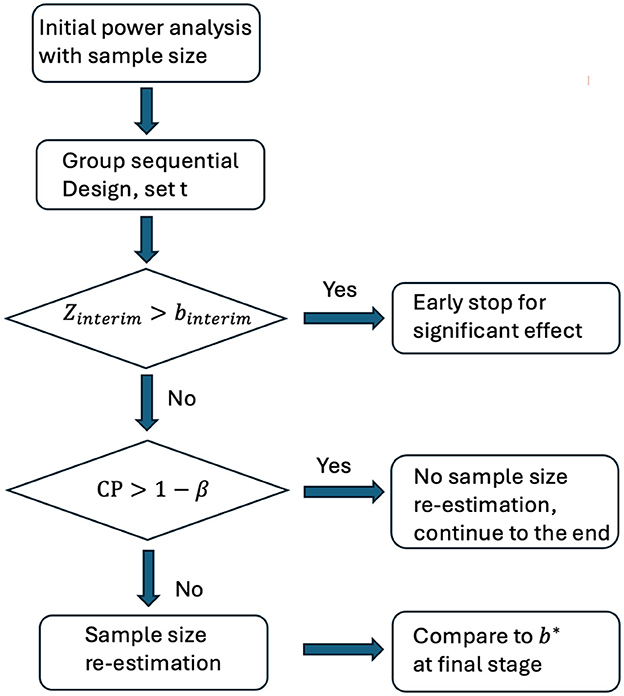
Figure 1. Flowchart of two-stage GSD-SSR. Zinterim: test statistics at the first stage. binterim: critical boundary at the first stage. b*: critical boundary at the final stage. CP: conditional power based on Zinterim. β: type 2 error.
Detailed derivations of the formulas presented in this section are provided in the Supplementary Appendix. To illustrate the advantages of the GSD-SSR approach over both non-group sequential designs and traditional group sequential designs, a simulation study with 10,000 replications is included in the Supplementary Appendix. The results are summarized in Supplementary Table S1 and show that GSD-SSR has an increase in power to reject the null hypothesis at the end of the study compared to both group sequential design and non-group sequential design.
3 Application of GSD-SSR
In this section, we provide a step-by-step guide for implementing GSD-SSR in a two-stage plan using a simulated scenario and two real example. The illustration leverages our developed website for GSD-SSR to walk through the process (https://samplesize.shinyapps.io/GSD-SSR/).
3.1 Simulated scenarios
Assume we have a population with a mean value of 3.5 and a standard deviation (SD) of two. In practice, the true values of the mean and SD are not known. We conduct a clinical study to test the hypothesis that the population mean is >3.
Scenario 1: Sample size re-estimation is needed
Step 1: Determine the total sample size needed without GSD
In a real-world scenario, researchers must propose an expected difference between the population mean and three, along with an estimated SD. For example, let's assume:
• Mean difference: 0.5
• SD: 1.4
• Significance level (α): 0.05
• Power: 90%
This setup assumes an overestimation of the effect size. Using the R package “pwr,” we calculate:
n < - pwr.t.test (d = 0.5/1.4, sig.level = 0.05, power = 0.9, type = “one.sample”)
This calculation suggests that 84 subjects are needed.
However, given the actual population mean of 3.5 and SD of two, we refine the calculation:
n < - pwr.t.test (d = 0.5/2, sig.level = 0.05, power = 0.9, type = “one.sample”)
This shows that to achieve 90% power to detect a mean difference of 0.5, we actually need 170 subjects.
The initial sample size estimate underestimated the actual number of subjects required for the study, which would result in insufficient power to detect a significant difference. This example highlights the importance of accurate parameter estimation in determining the required sample size.
Step 2: Set up a two-stage GSD
In this step, we determine that 84 subjects are needed for the clinical study. We implement a two-stage GSD, performing an interim analysis after collecting data from 42 subjects. To control the type I error due to the additional interim test, we adopt Pocock's critical boundary, setting it to 2.178 for both stages in Table 1.
The data for 42 subjects is simulated from a normal distribution N (3.5, 4). From the interim analysis, we calculate the interim statistic:
Step 3: Compute the expected conditional power at the second stage
In this step, we compute the expected conditional power for the second stage. Using our developed website, the process is simplified and demonstrated in the screenshot below (Figure 2).
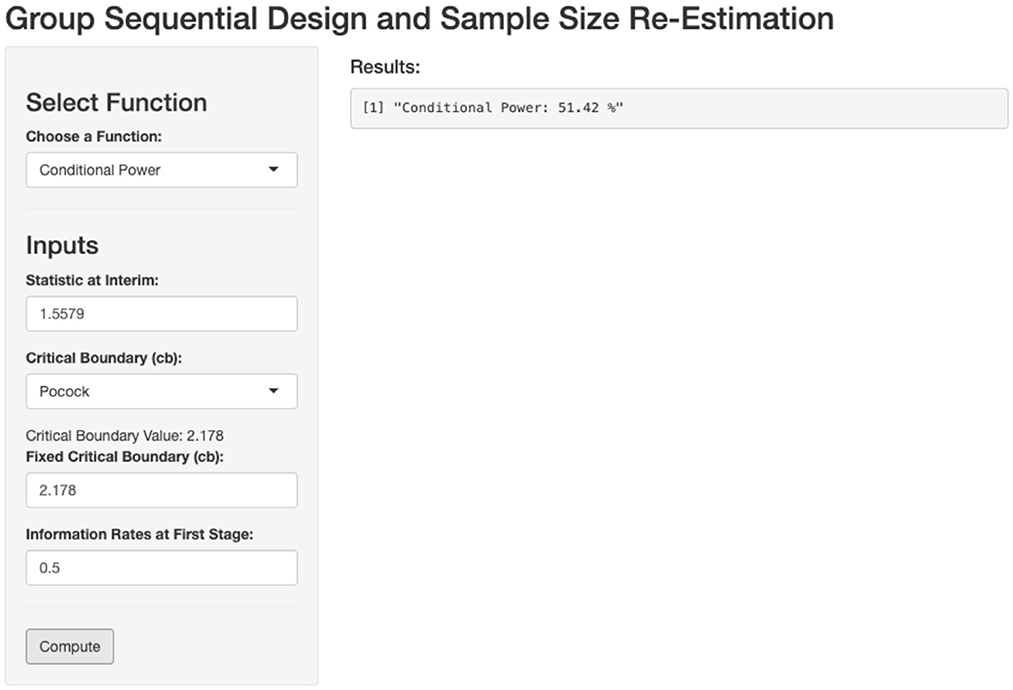
Figure 2. Calculation of conditional power based on first stage outcome. Zinterim = 1.5579, Critical boundary = 2.178, t = 0.5.
This calculation enables us to evaluate whether the current sample size is sufficient or if sample size re-estimation is needed to achieve the desired power. The expected conditional power at the second stage is calculated to be 51.42%, which is lower than the predefined target of 90%. Therefore, sample size re-estimation is necessary for the second stage to ensure the study meets the desired power.
Step 4: Calculate the sample size needed for recruitment at the second stage
Using our website, we input the required parameters, including the predefined power, interim statistics, critical boundary for the second stage, information rate, initial planned sample size, and the maximum allowable sample size. Based on these inputs in the screenshot below (Figure 3), we determine that 147 additional patients need to be recruited for the second stage, bringing the total sample size to 189 patients.
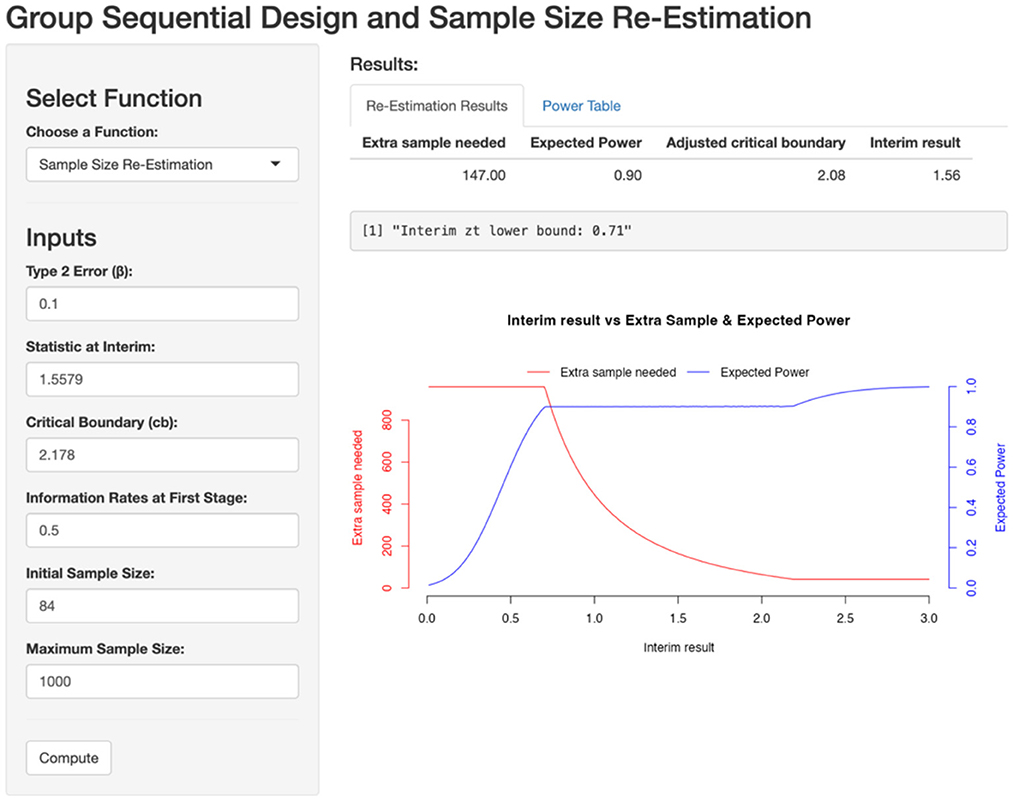
Figure 3. Sample size re-estimation based on first stage. Zinterim = 1.5579, Critical boundary = 2.178, β = 0.1, t = 0.5, initial sample size = 84, maximum sample size = 1,000.
With 147 patients added in the second stage, the expected power is recalculated to meet the predefined target of 90%. By simulating data for these additional 147 patients and pooling them with the 42 patients from the first stage, we calculate a test statistic of 3.2322 (>2.08) with a corresponding p-value of 0.00145.
Scenario 2: Sample size re-estimation is not needed due to early stop
Step 1: Determine the total sample size needed without GSD
Using the same setup as in Scenario 1, we now assume the following parameters:
• Mean difference: 0.5
• SD: 2.5
• Significance level (α): 0.05
• Power: 90%
This setup assumes an underestimation of the effect size. Using the R package “pwr,” we calculate:
n < - pwr.t.test (d = 0.5/2.5, sig.level = 0.05, power = 0.9, type = “one.sample”)
This calculation suggests that 266 subjects are needed.
Step 2: Set up a two-stage GSD
We implement a two-stage GSD, performing an interim analysis after collecting data from 133 subjects. We apply Pocock's critical boundary, setting it at 2.178 for both stages.
The data for 133 subjects is simulated from a normal distribution N (3.5, 4). From the interim analysis, we calculate the interim statistic:
Under this scenario, since Zinterim >2.178, we can stop early due to a significant effect, making it unnecessary to continue recruiting up to 266 subjects or to perform sample size re-estimation.
3.2 Real applications
Example 1: Lan and Wittes's Work
The first simple example is based on Lan and Wittes's work with the following setting [8]:
• A two-arm trial with a continuous endpoint.
• H0 is μx = μy and Ha is μx> μy,
• α = 0.025
• Power(1−β) = 90%
• The critical boundary at the second stage is 1.96.
In this example, the sample size at the first stage is 250, resulting in an information fraction t = 0.25 and the interim test statistic Zinterim = 0.3. By inputting these values into the conditional power function on our developed website (Figure 4), we can compute the conditional power and determine whether sample size re-estimation is needed to achieve the predefined power of 90%.
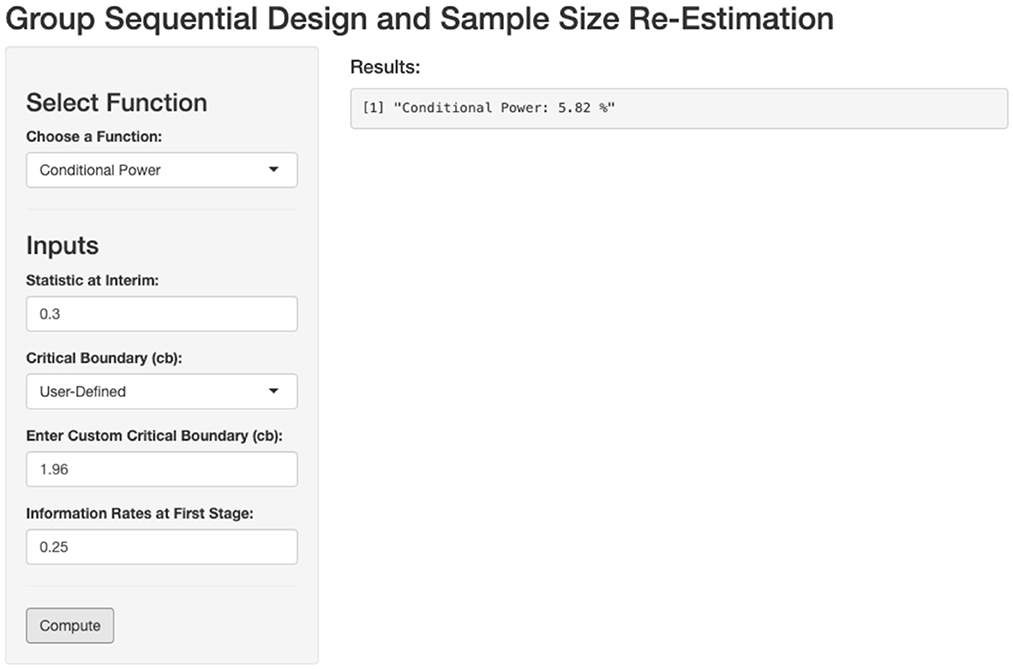
Figure 4. Calculation of conditional power based on first stage outcome. Zinterim = 0.3, Critical boundary = 1.96, t = 0.25.
The function returns a conditional power of 6%, which matches the result reported in the original paper. This outcome indicates that sample size re-estimation is necessary.
Example 2: The Cardiac Insufficiency Bisoprolol Study (CIBIS)
The CIBIS studies provide a compelling example of the potential benefits of GSD-SSR in a survival trial setting [1, 9]. In the initial CIBIS trial conducted in 1989, 261 events occurred, but the study failed to demonstrate a significant difference in survival using bisoprolol. However, a second CIBIS trial was conducted 10 years later with 384 events, which ultimately showed a significant benefit of bisoprolol in reducing mortality in heart failure. The CIBIS studies highlight the consequences of underestimating sample size. This not only resulted in wasted time and increased costs but also delayed the confirmation of bisoprolol's beneficial effects.
Let's apply a two-stage GSD-SSR to address the issue in sample size estimation. The original sample size is 261, and the test statistics is 1.23. The information vector t is set to (0.5, 1), and the critical upper boundaries at two stages are set to 2.782 and 1.967, respectively, based on Pocock boundary in Table 1. The type II error is set to 0.1.
Assuming the test statistic at the first stage is 1.23, the conditional power is 37%, indicating the need for sample size re-estimation. By inputting these values into the GSD-SSR framework, the necessary sample size adjustment for the second stage to achieve the predefined power is provided in screen shoot below (Figure 5).

Figure 5. Sample size re-estimation based on first stage. Zinterim = 1.5579, Critical boundary = 2.178, β = 0.1, t = 0.5, initial sample size = 84, maximum sample size = 1,000.
To achieve 90% power, an additional 721 events would have been needed in the second stage. The CIBIS example demonstrates that, by applying GSD-SSR, the initial conclusion of failure in the CIBIS study might have been avoided. The survival trial could have continued with the recruitment of 721 additional events, potentially saving the 10 years required to restart the CIBIS study. This approach highlights the potential to reach earlier conclusions about the benefits of bisoprolol in reducing mortality in heart failure.
4 A writing example of power analysis in IRB proposal with GSD-SSR
In this section, we use the example from Section 3 simulated scenario to demonstrate how to write the core part of a power analysis for an IRB proposal, incorporating GSD-SSR.
Original version:
To detect a 0.5 difference in the mean with 90% power, we need 84 patients at the significant level of 0.05.
Revised version with GSD-SSR:
To detect a 0.5 difference in the mean with 90% power, 84 patients are required at a significance level of 0.05. An interim analysis will be conducted after data collection from 42 patients. If the conditional power at the interim analysis is <90%, sample size re-estimation will be performed using the power table below, which was generated by our GSD-SSR website (Figure 6).
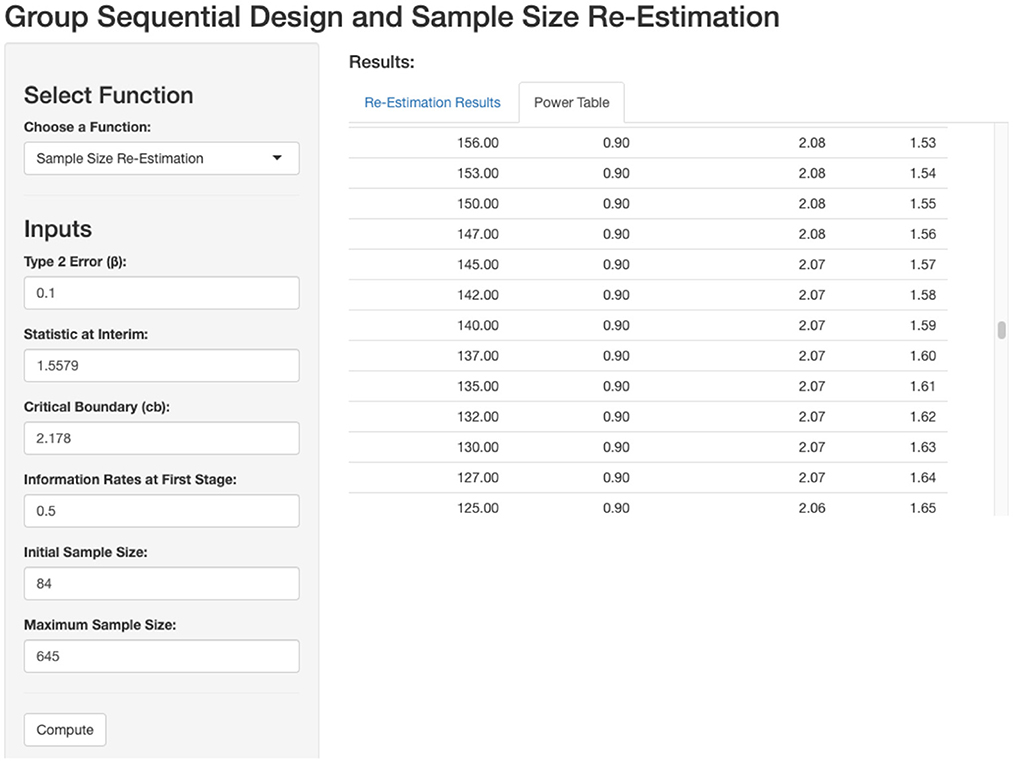
Figure 6. Power table based on interim outcome. Based on the interim outcome, extra sample is needed for 90% power.
5 Discussion and conclusions
The primary advantage of GSD-SSR lies in its ability to leverage information collected during patient recruitment, enhancing the robustness of clinical studies. Traditional power analyses, conducted without GSD-SSR, rely heavily on prior knowledge of the topic, particularly the accurate estimation of effect size. An inaccurate estimate can significantly impact the success of a study. GSD-SSR addresses this issue by incorporating an additional layer—interim analysis—while maintaining control of the type I error rate. This approach allows for deviations from the initial effect size estimation, enabling adjustments to keep the study on track and increasing its likelihood of success.
The value of GSD-SSR is evident through the examples and applications presented in our study. During our research, we identified a notable gap in the literature: a lack of comprehensive resources that bridge theoretical foundations and practical implementation of GSD-SSR. To address this, we provided detailed theoretical explanations in the Supplementary Appendix for readers interested in the methodology. Additionally, we developed a user-friendly website to facilitate the application of GSD-SSR by practitioners. This study seeks to bridge the gap between methodological experts and applied researchers by offering a clear, step-by-step explanation of GSD-SSR, complemented by detailed examples to enhance understanding. We envision this paper as a “one-stop” resource for researchers in this field.
Our study is limited to a two-stage GSD-SSR design. The primary reason for this choice is our belief that simplicity enhances usability for researchers. In a two-stage design, only one additional layer is added to the original plan, making the approach more practical, feasible, and easier to learn and implement.
In conclusion, GSD-SSR represents a significant advancement in clinical trial design, enabling more flexible and reliable studies. By addressing both theoretical and practical aspects, this work provides a valuable resource for researchers aiming to adopt GSD-SSR in their studies.
Data availability statement
The original contributions presented in the study are included in the article/Supplementary material, further inquiries can be directed to the corresponding authors.
Author contributions
YZ: Conceptualization, Investigation, Methodology, Supervision, Validation, Writing – original draft, Writing – review & editing. PX: Validation, Writing – original draft, Writing – review & editing. SD: Investigation, Validation, Writing – original draft, Writing – review & editing.
Funding
The author(s) declare that no financial support was received for the research and/or publication of this article.
Conflict of interest
The authors declare that the research was conducted in the absence of any commercial or financial relationships that could be construed as a potential conflict of interest.
Generative AI statement
The author(s) declare that no Gen AI was used in the creation of this manuscript.
Publisher's note
All claims expressed in this article are solely those of the authors and do not necessarily represent those of their affiliated organizations, or those of the publisher, the editors and the reviewers. Any product that may be evaluated in this article, or claim that may be made by its manufacturer, is not guaranteed or endorsed by the publisher.
Supplementary material
The Supplementary Material for this article can be found online at: https://www.frontiersin.org/articles/10.3389/fams.2025.1611205/full#supplementary-material
References
1. CIBIs Investigators. A randomized trial of β-blockade in heart failure: the cardiac insufficiency bisoprolol study. Circulation. (1994) 90:1765. doi: 10.1161/01.CIR.90.4.1765
2. Birkett MA, Day SJ. Internal pilot studies for estimating sample size. Stat Med. (1994) 13:2455–63. doi: 10.1002/sim.4780132309
3. Potvin D, DiLiberti CE, Hauck WW, Parr AF, Schuirmann DJ, Smith RA. Sequential design approaches for bioequivalence studies with crossover designs. Pharm Stat. (2008) 7:245–62. doi: 10.1002/pst.294
4. Pocock SJ. Group sequential methods in the design and analysis of clinical trials. Biometrika. (1977) 64:191–9. doi: 10.2307/2335684
5. Lai TL, Shih M-C. Power, sample size and adaptation considerations in the design of group sequential clinical trials. Biometrika. (2004) 91:507–28. doi: 10.1093/biomet/91.3.507
6. Liu Y, Lim P. Sample size increase during a survival trial when interim results are promising. Commun Stat Theory Methods. (2017) 46:6846–63. doi: 10.1080/03610926.2015.1137596
7. Mehta CR, Pocock SJ. Adaptive increase in sample size when interim results are promising: a practical guide with examples. Stat Med. (2011) 30:3267–84. doi: 10.1002/sim.4102
8. Lan KG, Wittes J. The B-value: a tool for monitoring data. Biometrics. (1988) 44:579–85. doi: 10.2307/2531870
Keywords: sample size calculation, group sequential design, sample size re-estimation, power analysis, clinical trial
Citation: Zhu Y, Du S and Xia P (2025) GSD-SSR: an integrated framework for power analysis in IRB proposals using group sequential design and sample size re-estimation. Front. Appl. Math. Stat. 11:1611205. doi: 10.3389/fams.2025.1611205
Received: 14 April 2025; Accepted: 24 June 2025;
Published: 14 July 2025.
Edited by:
Paul Horn, Cincinnati Children's Hospital Medical Center, United StatesCopyright © 2025 Zhu, Du and Xia. This is an open-access article distributed under the terms of the Creative Commons Attribution License (CC BY). The use, distribution or reproduction in other forums is permitted, provided the original author(s) and the copyright owner(s) are credited and that the original publication in this journal is cited, in accordance with accepted academic practice. No use, distribution or reproduction is permitted which does not comply with these terms.
*Correspondence: Yuxi Zhu, eXV4aV96aHVAaG90bWFpbC5jb20=