 Neha Purwar1
 Kaustav Aditya
 Bharti
 Pankaj Das
- 1The Graduate School, ICAR-IARI, New Delhi, India
- 2ICAR-Indian Agricultural Statistics Research Institute, New Delhi, India
Research under classical statistics often relies on precise, determinate data to estimate population parameters. However, in certain situations, data may be indeterminate or imprecise. Neutrosophic statistics, a generalization of classical statistics, has been introduced to address these challenges by handling vague, indeterminate, and uncertain information effectively. Several estimators, including ratio estimators, have been proposed in neutrosophic statistics. These ratio estimators perform well when the correlation between the auxiliary and study variables is strong. However, in this study, regression-type estimators were developed, demonstrating superior performance in cases where the correlation between the study and auxiliary variables is high, weak, or moderate. The performance of the proposed estimator was evaluated using simulated data as well as four real-world datasets with indeterminate data, including blood pressure, temperature, natural growth rate, and solar energy data. The proposed neutrosophic regression estimator consistently outperformed the existing neutrosophic ratio estimator, modified neutrosophic ratio estimators, and the neutrosophic exponential ratio estimator, as indicated by performance measures such as mean squared error (MSE) and percent relative efficiency (PRE). This paper highlights the advantages of the neutrosophic regression estimator in improving estimation accuracy when dealing with uncertain and ambiguous data, with any range of correlation between the study and the auxiliary variables considered under the study.
1 Introduction
In surveys, a representative sample is drawn from the population using an appropriate sampling design to make inferences about population parameters. Classical statistics typically relies on precise, determinate data to estimate these parameters. However, real-world data often exhibit imprecision, indeterminacy, or vagueness due to various factors such as measurement errors, incomplete information, or inherent variability. For instance, in agriculture surveys, crop yield predictions are uncertain due to fluctuating weather patterns and pest infestations. In demographic studies, estimating birth rates and natural growth rates can involve uncertainty due to factors such as incomplete census data, reporting errors, and variations in survey methodologies [1]. Classical statistical methods provide point estimates but often struggle to adequately address such indeterminate data, potentially leading to biased or less robust estimates. To overcome this limitation, the concept of neutrosophic statistics was introduced by Prof. Dr. Florentin Smarandache from the University of New Mexico, United States, in 1998 [2], which offers a powerful generalization of classical statistics. Neutrosophic statistics is designed to handle data characterized by uncertainty, indeterminacy, and ambiguity by representing observations as intervals or sets rather than single precise values. Unlike classical statistics, which assumes deterministic data, neutrosophic statistics incorporates three key components: truth-membership (representing the degree of certainty), indeterminacy-membership (quantifying the level of uncertainty or ambiguity), and falsity-membership (indicating the degree of contradiction). This framework allows neutrosophic statistics to model complex, real-world scenarios more effectively by accounting for the full spectrum of uncertainty, including situations where data are partially known or contradictory. For example, in health studies, blood pressure measurements may vary within a range due to instrument precision or patient conditions, and neutrosophic statistics can represent these measurements as intervals, providing a more comprehensive analysis than classical point estimates. Compared to fuzzy statistics, which focus on ambiguity through membership degrees between 0 and 1, neutrosophic statistics explicitly address indeterminacy, making them particularly suitable for scenarios where data uncertainty cannot be fully resolved by fuzzy sets [3, 4]. This capability enhances the robustness and flexibility of neutrosophic methods in handling imprecise data across diverse fields such as agriculture, health, environmental studies, and social sciences.
Neutrosophic probability distributions extend classical distributions by incorporating imprecise parameters to handle indeterminate data. Neutrosophic logic allows these distributions to model uncertainty more effectively than traditional methods [5], and further, many researchers contribute to neutrosophic statistics using a variety of estimating techniques [6–18].
In sample surveys, in addition to data on the study variable, information on several auxiliary variables is often available. The use of auxiliary information for estimating parameters like the population mean, ratio, product of two means, and coefficient of variation is well established under the classical framework, with key estimators including ratio, product, and regression estimators. Numerous researchers have contributed to sample surveys incorporating auxiliary information, employing various transformation techniques to develop efficient ratio and regression estimators under the classical framework. Research indicates that when the study variable and auxiliary variable are highly correlated, the sampling error in classical ratio estimators is significantly reduced compared to using the study variable alone. A modified ratio estimator considers the subsidiary information's coefficient of variation [19]. The use of transformed auxiliary variables to estimate population means has also been investigated under the classical framework [20–22]. The performance of ratio-type estimators improved when incorporating various types of auxiliary information under the classical framework [23]. The classical regression estimator performs better than the classical ratio estimator regardless of whether there is positive or negative correlation between the study and the auxiliary variables [24]. Introduction of a new chain ratio-type estimator and regression-type estimator to the finite population mean based on a linear combination of two auxiliary variables [25]. Traditional ratio and regression estimators provide precise estimates for the population parameter within a deterministic sampling framework. However, they may not be appropriate for a neutrosophic framework, which includes indeterminacy or ambiguity in data.
Tahir et al. [26] pioneered the estimation of population parameters within a neutrosophic framework using non-linear estimators. They introduced neutrosophic ratio-type estimators and neutrosophic exponential estimators for estimating the population mean under simple random sampling without replacement, particularly in cases where there is a strong correlation between the auxiliary and study variables. Additionally, a study on neutrosophic exponential estimators for the estimation of population means has shown them to perform better in cases where the correlation between these variables is weak or moderate [27]. In addition to this, Alqudah et al. [28] proposed a generalized neutrosophic robust ratio estimator for estimating the finite population mean, specifically designed to handle indeterminate, imprecise, and outlier-contaminated data. Singh et al. [29] proposed an Almost Unbiased Estimator for estimating the population mean to handle neutrosophic data using auxiliary information and the ratio estimator. Yadav et al. [30] proposed neutrosophic mean estimators using extremely indeterminate observations in sample surveys. Despite these advancements, existing neutrosophic estimators often rely on ratio-based methods, which may not perform optimally across a wide range of correlation levels, such as weak, moderate, strong, or even negative.
1.1 Novelty and contributions
This study introduces a novel neutrosophic regression estimator designed to estimate the finite population mean in the presence of indeterminate, imprecise, or vague data. Unlike existing neutrosophic ratio and exponential estimators, which are primarily effective under strong positive correlations, the proposed estimator leverages the regression framework to perform robustly across a wide range of correlation levels, including weak, moderate, strong positive, and negative correlations. By extending classical regression principles to the neutrosophic domain, the estimator accommodates interval-based or uncertain data, providing more reliable estimates in real-world scenarios where data precision is compromised, such as in agricultural yield predictions or health metrics with measurement variability. The study also introduces the R-package “neutroSurvey” [31], which facilitates the practical implementation of neutrosophic statistical methods, making them accessible to researchers and practitioners. The performance of the proposed estimator is rigorously evaluated using four real-world datasets (blood pressure, temperature, natural growth rate, and solar energy) and simulated data, demonstrating its superiority over existing neutrosophic ratio and exponential estimators in terms of mean squared error (MSE) and percent relative efficiency (PRE).
1.2 Significance of the study
The significance of this study lies in its development of a versatile and robust neutrosophic regression estimator that addresses the limitations of classical and existing neutrosophic estimators (Figure 1). By effectively handling indeterminate data across various correlation structures, the proposed estimator enhances estimation accuracy in fields where uncertainty is prevalent, such as agriculture, health, and environmental studies, and so on, by providing a framework that explicitly accounts for truth, indeterminacy, and falsity. The estimator's ability to perform well across a wide range of correlation levels—weak, moderate, or strong positive and negative correlations—makes it a valuable tool for complex, real-world applications where traditional methods may fail. Furthermore, the introduction of the “neutroSurvey” R-package democratizes access to neutrosophic statistical methods, enabling researchers to apply these techniques in diverse domains. This study also lays the groundwork for future research into advanced neutrosophic estimators for complex sampling designs and multivariate frameworks, potentially integrating robust and machine learning-based approaches to further enhance estimation precision in uncertain environments.
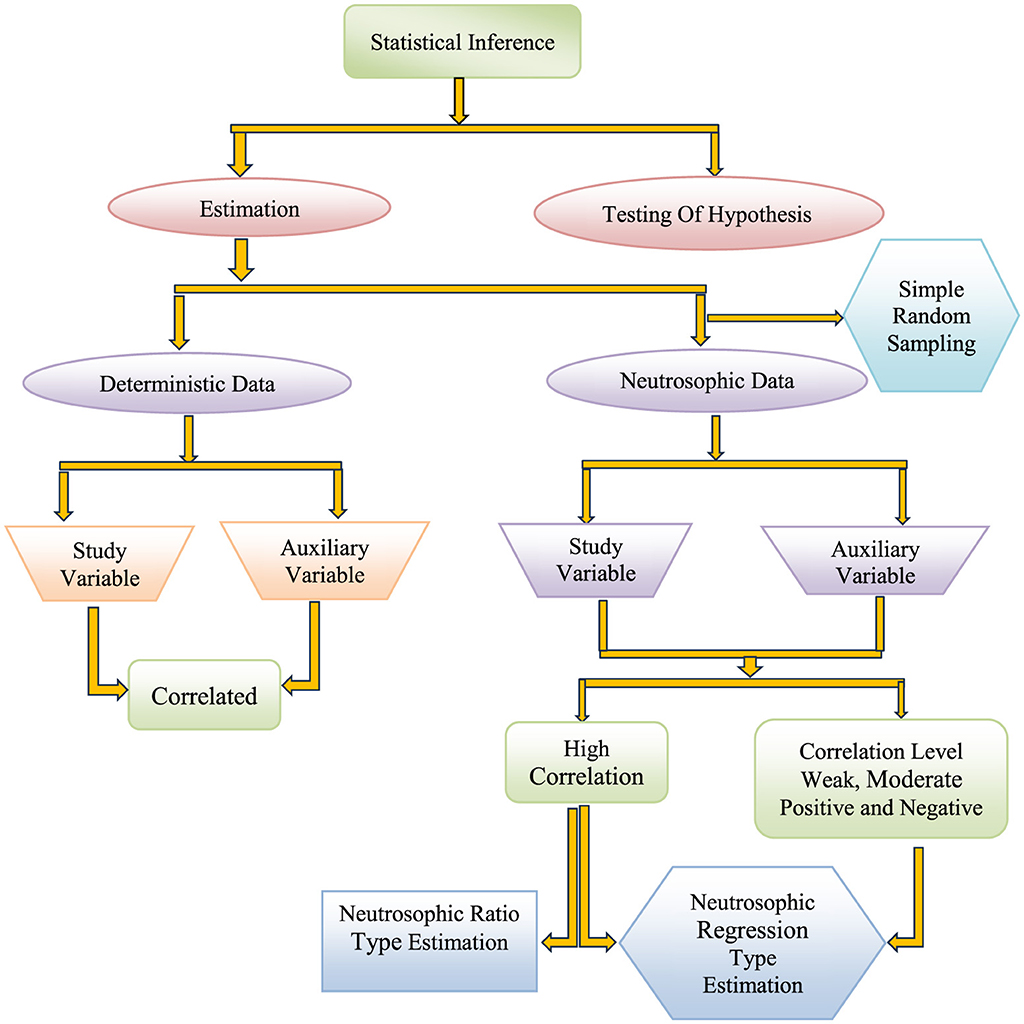
Figure 1. Flow chart of neutrosophic inference.
2 Methodology
2.1 Neutrosophic observation
Neutrosophic numbers can be represented in multiple ways. However, in this study, neutrosophic interval values were defined as
where
ZL indicates the deterministic (lower) part of the neutrosophic number, representing a certain or known component of the data.
ZU indicates the coefficient of the indeterminate part, which quantifies the magnitude of indeterminacy.
IN indicates an indeterminacy component, which lies within the interval IN ∈ [IL, IU ], where IL is the lower bound, and IU is the upper bound of the indeterminacy interval.
The neutrosophic number is expressed as an interval ZN ∈ [a, b]
where:
a is the lower bound of the neutrosophic interval, representing the minimum possible value.
b is the upper bound of the neutrosophic interval, representing the maximum possible value.
The expression ZN = ZL+ZUIN with IN ∈ [0, 1] and ZN ∈ [a, b] represents a neutrosophic number as an interval [ ZN, ZL+ZU] = [a, b] where ZU = b−a. When ( IN = 0), this condition refers to a specific value of the indeterminacy component. However, since IN is an interval [IL, IU ], this can be interpreted as the case where the indeterminacy interval collapses to a crisp value, specifically, or the indeterminacy component is evaluated at zero. In this situation, ZN = ZL = a, where a is the lower bound of the neutrosophic interval. This reduction aligns neutrosophic statistics with classical statistics, where all data are determinate [4].
Let (T=T1, T2, …,TN) be a population of N units a random sample of size n, which is drawn from a finite population of N units by simple random sampling without replacement (SRSWOR). Let YN(i) ∈ (YL,YU) be ith unit of neutrosophic population on variable of interest YN (study variable), and XN(i) ∈ (XL,XU) is ith unit of neutrosophic population on auxiliary variable, which is correlated to neutrosophic study variable YN and yN(i) and xN(i) is ith unit of sample observation of the neutrosophic study and auxiliary variable, respectively. Let and be the neutrosophic population mean for study variable YN and auxiliary variable XN, respectively, and and be the neutrosophic sample mean for study variable YN and auxiliary variable XN, respectively. Let CyN ∈ (CyL,CyU) and CxN ∈ (CxL,CxU) be neutrosophic coefficients of variation for YN and XN, respectively. ρyxN ∈ (ρyxL,ρyxU) is the neutrosophic correlation between YN and XN (neutrosophic variables). Let and be the neutrosophic population variances for XN and YN (neutrosophic variables), respectively, SyxN ∈ (SyxL,SyxU) be the neutrosophic covariance between XN and YN (neutrosophic variables). In addition, β2(x)N ∈ (β2(x)L, β2(x)U) is the neutrosophic coefficient of kurtosis for auxiliary variable XN. Let eyL ∈ (eyL,eyU) and exN ∈ (exL,exU) be the neutrosophic mean errors for YN and XN, respectively . Let and be neutrosophic error terms for variance and esyxN ∈ (esyxL,esyxU) is neutrosophic error term for covariance. These terms are defined in Table 1.
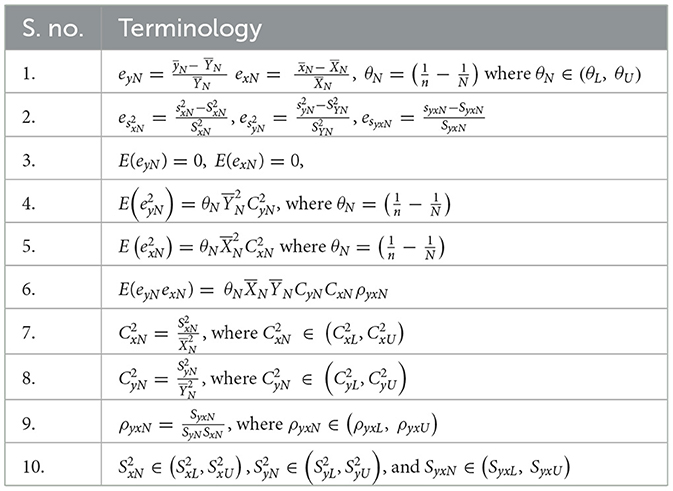
Table 1. Terminological framework for neutrosophic estimators.
2.2 Flow chart
The flowchart below illustrates the process for applying the proposed methods to neutrosophic data.
2.3 Existing neutrosophic estimators
i. Tahir et al. [26] proposed the neutrosophic ratio estimator for estimating the mean of the finite population in the presence of an auxiliary variable denoted by is (Equation 1) given
where
Bias and MSE up to the first-order approximation were
Bias )
MSE .
ii. The neutrosophic ratio-type estimator that considers the coefficient of variation as an auxiliary variable proposed by Tahir et al. [26] was as follows:
where
Bias and MSE up to first order approximation were
Bias
MSE
.
iii. The neutrosophic ratio-type estimator that considers the coefficient of kurtosis as an auxiliary variable proposed by Tahir et al. [26] is given below:
where
Bias () can be expressed as follows:
iv. In this sequence, Tahir et al. [26] proposed a neutrosophic ratio estimator incorporating both the coefficient of variation CxN and the coefficient of kurtosis β2(x)N as auxiliary variables given as follows:
where
Bias and MSE up to first order approximation were as
Bias
MSE E
.
v. The neutrosophic exponential estimator developed by Tahir et al. [26] is given below:
where
Bias and MSE up to first order approximation were as,
MSE .
Derivation of bias and MSE of all the above estimators are given in Appendix A.
3 Proposed neutrosophic regression estimator for the estimation of a finite population parameter
The proposed neutrosophic regression estimator for the estimation of a finite population parameter is given as follows:
where; bN ∈ (bL, bU) be the sample regression coefficient, which is unknown.
To obtain bias, taking the expectation on both sides of Equation 6, we obtain
Thus, Bias is as follows:
Bias covariance
To obtain the MSE for the proposed neutrosophic regression estimator up to first order approximation, neutrosophic errors given in Table 1 were substituted into Equation 6, and applying Taylor series expansion, we obtain
,
where BN is a constant known as the population regression coefficient
E
Now, MSE of the proposed estimator can be obtained as follows:
On differentiating Equation 7 with respect to BN and setting it equal to zero, we obtain the following:
Then, on putting the value of BN from Equation 8 into Equation 7, we obtain
We can write the Equation 9 in terms of the coefficient of variance as below:
3.1 Performance measures
The proposed neutrosophic regression estimator was compared with existing estimators , and using performance measures: mean squared error (MSE) and percent relative efficiency (PRE).
Estimator T(say) with a percent relative efficiency value less than or equal to 100 as compared to other estimators T1, is considered the most efficient and is given by
4 Results and discussion
4.1 Evaluation of proposed neutrosophic regression estimator using real datasets
4.1.1 Description of the datasets
The proposed neutrosophic regression-type estimator is a novel concept with limited existing literature. However, in this study, the proposed estimator was compared with other existing neutrosophic ratio estimators, as presented in Equations 1–5. For the empirical evaluation, four real datasets characterized by indeterminacy were selected. The details of each data set are provided below:
Dataset 1: Indeterminate blood pressure data from a population of 82 individuals, comprising 41 men and 41 women, for the years 1975 to 2015, sourced from Japan (https://ncdrisc.org/index). This indeterminate dataset includes five neutrosophic-type variables year-wise. However, in this study, the number of adults with raised blood pressure, (YN) and the age-standardized prevalence of raised blood pressure 95% uncertainty interval, (XN) were considered as study variables and auxiliary variables, with a population size N= 82, the same for the lower and upper bounds under the neutrosophic framework, respectively.
Dataset 2: Data set from Seasonal and Annual Minimum-Maximum Temperature Series (1901–2017) sourced from https://data.gov.in/resource/seasonal-and-annual-minimum-maximum-temperature-series-1901-2017. Temperatures from March to May (YN) and Minimum and maximum temperatures in January and February (XN) with a population size N=117, which is the same for lower and upper bounds under the neutrosophic framework, were considered as the study variable and auxiliary variable, respectively.
Dataset 3: Natural growth rate data from SRS Bulletin 2020 (1) for 21 Bigger States, 9 Smaller States, and 6 Union Territories with a total population size of 36. Natural growth rate was considered as a neutrosophic study variable (YN), and birth rate as a neutrosophic auxiliary variable (XN) with population size N = 36, the same for both lower and upper bounds under the neutrosophic framework.
Dataset 4: Indeterminate solar energy data from Aslam and Algarni (2020) [18]. This dataset consists of ten neutrosophic variables recorded over 12 months, from mid-June 2013 to mid-June 2014. Here, next-day Global Horizontal Irradiance (ND-GHI) was considered as a neutrosophic study variable (YN), and temperature as the neutrosophic auxiliary variable (XN) with a population size N= 12, which is the same for lower and upper bound under the neutrosophic framework.
4.1.2 Descriptive statistics of datasets
To explore the efficiency of the proposed neutrosophic regression estimator for four real-world datasets, descriptive statistics for each dataset were computed under neutrosophic and classical frameworks and are presented in Table 2. The descriptive analysis of all the mentioned data sets under a neutrosophic framework was evaluated using our developed R-package “neutroSurvey” given below (https://CRAN.Rproject.org/package=neutroSurvey). In dataset:1 (Blood pressure), the neutrosophic mean for study variable (YN) was found within the interval [11913108, 16490350], while the classical mean is 11,913,108 and neutrosophic mean for auxiliary variable (XN) was found within the interval [0.2121, 0.2854], with a classical value of 0.2121. Additionally, the neutrosophic coefficients of variation for CyN and CxN for study and auxiliary variables were found and ranged from [0.2889, 0.4048] and [0.3386, 0.5025], respectively, with corresponding classical values of 0.1107 and 0.2967. The neutrosophic correlation coefficient ρxyN, between the study and auxiliary variable was found within the interval [0.3932, 0.5503], with a classical value of 0.5502, while the coefficient of kurtosis for the auxiliary variable β2(x)N, was obtained within the interval [2.115907, 2.239048], with a classical value of 2.1160.
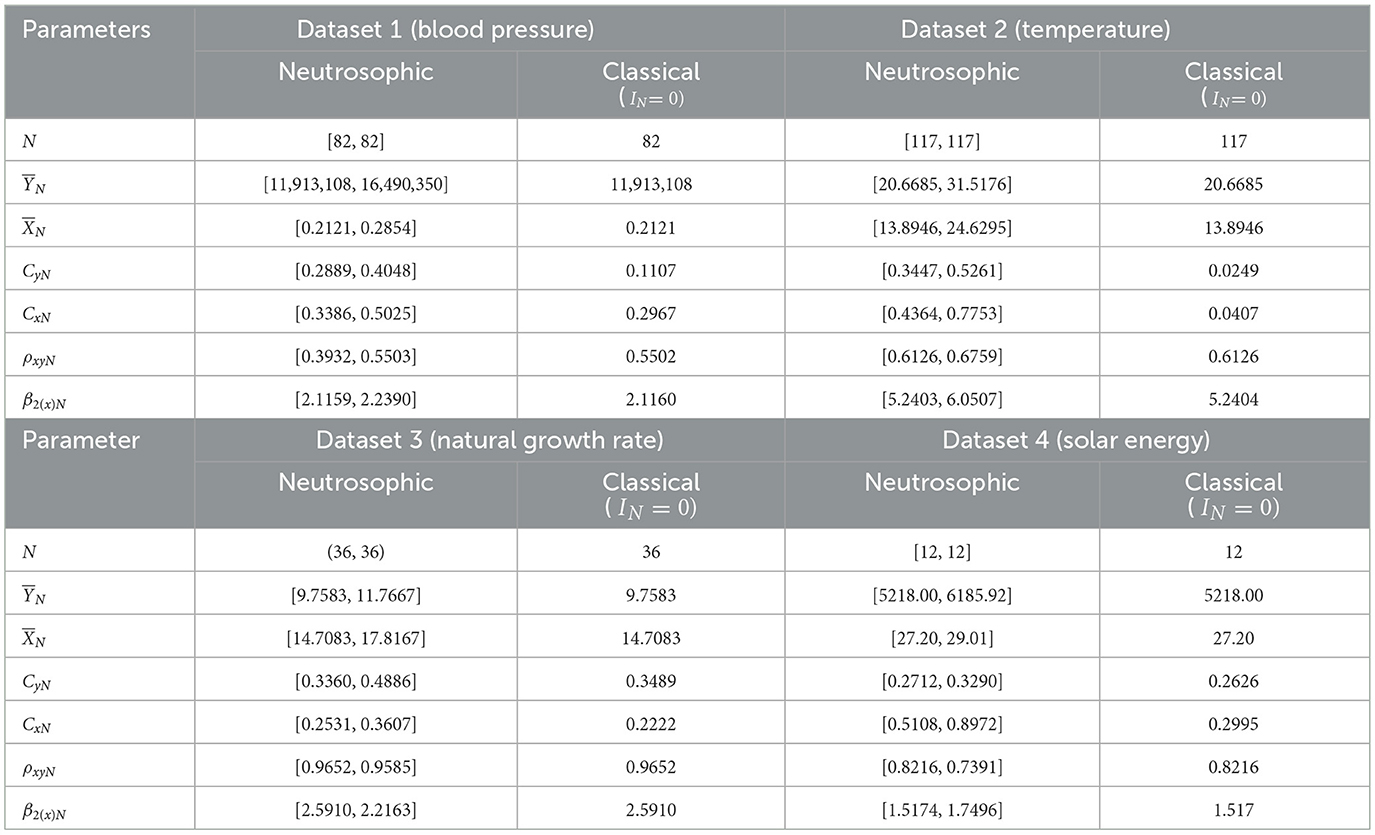
Table 2. Descriptive statistics for all four neutrosophic data sets in both neutrosophic and classical frameworks.
For dataset 2, (temperature) the neutrosophic mean for the study variable was estimated to lie within the interval [20.6685, 31.5176], with a classical mean value of 20.6685. The neutrosophic mean for the auxiliary variable was obtained within the interval [13.8946, 24.6295], with a classical mean value of 13.8946. Furthermore, the neutrosophic coefficients of variation CyN for the study variable and coefficients of variation CxN for the auxiliary variable were determined and found in intervals [0.3447, 0.5261] and [0.4364, 0.7753], respectively, with corresponding classical values of 0.0249 and 0.0407. The neutrosophic correlation coefficient between the study and auxiliary variables, ρxyN, was found in the interval [0.6126, 0.6759] with a classical value of 0.6126. Additionally, the neutrosophic coefficient of kurtosis for the auxiliary variable, β2(x)N, was evaluated and found within the interval [5.2403, 6.0507] with a classical value of 5.2404. For dataset 3, (natural growth rate), the neutrosophic mean for the study variable was found to lie within the interval [9.7583, 11.7667] with a classical mean value of 9.7583, and the neutrosophic mean for the auxiliary variable was obtained and found within the interval [14.7083, 17.8167] with a classical value of 14.7083. The neutrosophic coefficients of variation CyN for the study variable and CxN for the auxiliary variable were calculated to lie within the intervals [0.3360, 0.4886] and [0.2531, 0.3607], respectively, with corresponding classical values of 0.3489 and 0.2222. The neutrosophic correlation coefficient between the study and auxiliary variables, ρxyN, was estimated and found within the interval [0.9652, 0.9585] with a classical value of 0.9652. Additionally, the coefficient of kurtosis for the auxiliary variable, β2(x)N, was evaluated and found to lie within the interval [2.5910, 2.2163] with a classical value of 2.5910, and for dataset 4, (solar energy), the neutrosophic mean and for study variable as well as the auxiliary variable were evaluated to lie within the intervals [5218.00, 6185.92] and [27.20, 29.01], respectively, with corresponding classical mean values of 5218.00 and 27.20. The neutrosophic coefficients of variance CyN and CxN for study and auxiliary variables were obtained and found within the interval [0.2712, 0.3290] and [0.5108, 0.8972], respectively, with corresponding classical values of 0.2626 and 0.2995. Neutrosophic correlation coefficient, ρxy, between the study and auxiliary variable ranged from [0.8216, 0.7391] with a classical value of 0.8216, and the coefficient of kurtosis for auxiliary variable β2(x)N was estimated within the interval [1.5174, 1.7496] with a classical value of 1.5174.
4.1.3 Comparison of proposed estimators with existing estimators
The performance of the proposed neutrosophic regression estimator was compared with existing estimators based on their MSE and PRE under the neutrosophic and classical frameworks. The sample size n was drawn by simple random sampling without replacement (SRSWOR). MSE of all estimators for comparison to these datasets is presented in Tables 3–6. The analysis was conducted using the developed R-package “neutroSurvey” (https://CRAN.R-project.org/package=neutroSurvey). The package was developed for empirical analysis of the proposed neutrosophic regression estimator against the above-mentioned existing estimators.
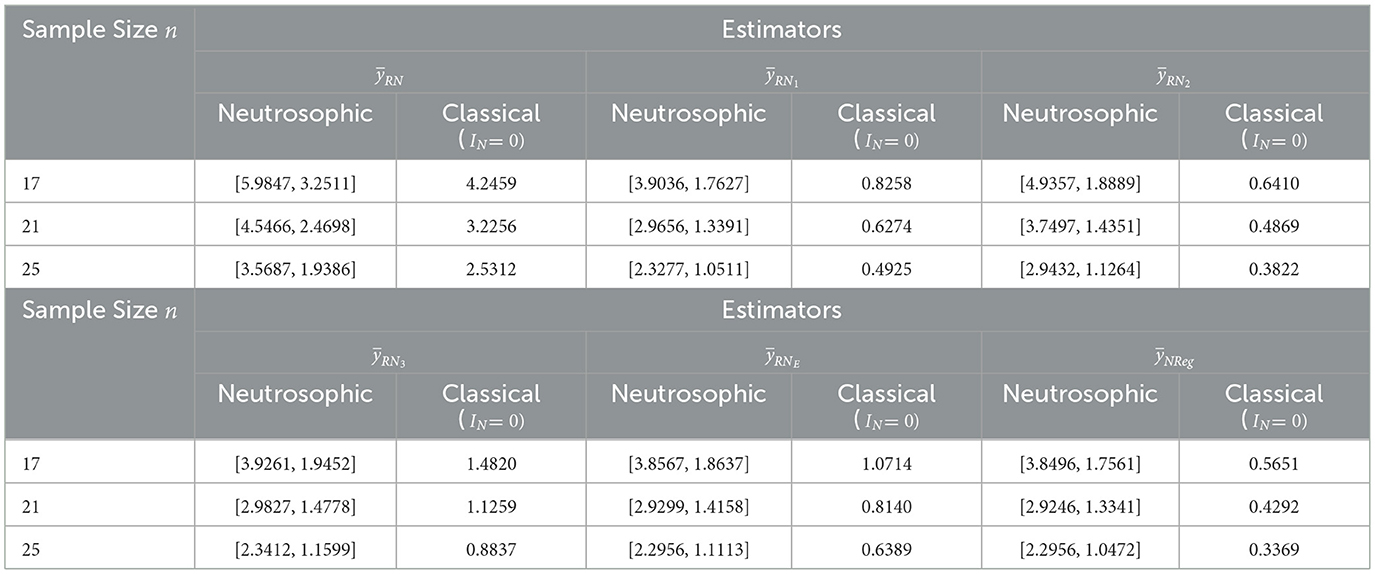
Table 3. Comparison of MSE for existing vs. proposed estimators using dataset 1.
For dataset 1, sample sizes n of 17, 21, and 25 were selected from the population of size N= 82 with SRSWOR. Samples of sizes 17, 21, and 25 correspond to approximately 20%, 25%, and 30% of the total population size N= 82, respectively.
The perusal of Table 3 presented that the MSEs at sample size n=17, for estimators , and were evaluated and found within the intervals [5.9847, 3.2511], [3.9036, 1.7627], [4.9357, 1.8889], [3.9261, 1.9452], [3.8567, 1.8637], and [3.8496, 1.7561], respectively, with corresponding classical MSEs of 4.2459, 0.8258, 0.6410, 1.4820, 1.0714, and 0.5651. These results indicate that the MSE of the proposed neutrosophic regression estimator is found to be lower than all existing estimators in both neutrosophic and classical approaches. It is closely followed by the neutrosophic exponential estimator, with the existing neutrosophic ratio-type estimators performing comparatively less efficiently. As the sample size n increased from 17 to 25, all estimators exhibited a notable reduction in MSEs, highlighting improved estimation precision with larger sample sizes. In this way, with sample size n= 25, MSEs of estimators and were determined to be in the ranges [3.5687, 1.9386], [2.3277, 1.0511], [2.9432, 1.1264], [2.3412, 1.1599], [2.2956, 1.1113], and [2.2956, 1.0472], respectively, with corresponding classical MSEs of 2.5312, 0.4925, 0.3822, 0.8837, 0.6389, and 0.3369. This trend of declining MSEs with increasing the sample size confirms the estimator's efficiency in both neutrosophic and classical approaches. The neutrosophic framework, by accounting for indeterminacy in blood pressure data, provides interval-based estimates, in contrast to the precise point estimates of the classical framework for the mean-squared errors of estimators. This highlights its ability to effectively handle uncertainty while maintaining high accuracy, thereby enhancing its applicability. Furthermore, the MSEs from the classical framework across various sample sizes fall within the corresponding neutrosophic MSE intervals for all estimators, indicating that the neutrosophic estimation procedure has broader applicability.
For dataset 2, sample sizes equal to 15, 20, and 25 were selected from a population of size N= 117 using simple random sampling without replacement (SRSWOR), representing approximately 13%, 17% and 21% of the population size N= 117, respectively.
Upon the assessment of Table 4, it was found that MSEs for estimators and with sample size n= 15 were estimated to lie within the intervals [3.1026, 18.8513], [2.9583, 17.7368], [2.1199, 12.7902], [3.0737, 18.6578], [1.8431, 8.7392], and [1.8419, 8.6799], respectively, with corresponding classical MSEs of 0.0259, 0.0258, 0.0148, 0.0259, 0.0103, and 0.0097. It indicates that the proposed neutrosophic regression estimator exhibits the lowest MSEs in both neutrosophic and classical approaches, among all the existing estimators and proposed by Tahir et al. [26]. It is important to note that the proposed neutrosophic regression estimator performs better than the neutrosophic exponential estimator, followed by others. As sample size n increased from 15 to 25, a consistent decrease in MSE was observed across all estimators in both neutrosophic and classical settings. With sample size n= 25, MSEs for estimators and were determined and found within the intervals [1.6790, 10.2019], [1.6009, 9.5987], [1.1472, 6.9218], [1.6634, 10.0972], [0.9974, 4.7295], and [0.9968, 4.6974], respectively, with corresponding classical MSEs of 0.0140, 0.0139, 0.0080, 0.0141, 0.0056, and 0.0052. This pattern of declining MSEs with increasing sample size confirms the improved estimation efficiency of the proposed neutrosophic regression estimator across both neutrosophic and classical statistical frameworks. It is observed that, in the case of real datasets, point estimates sometimes fluctuate from neutrosophic intervals due to factors like measurement errors, seasonal fluctuations, environmental variability, and so on. Hence, the neutrosophic framework seems more relevant than classical statistics in these types of situations. Therefore, it can be concluded that estimates under the neutrosophic framework provide a better understanding and more effective handling of indeterminacy.
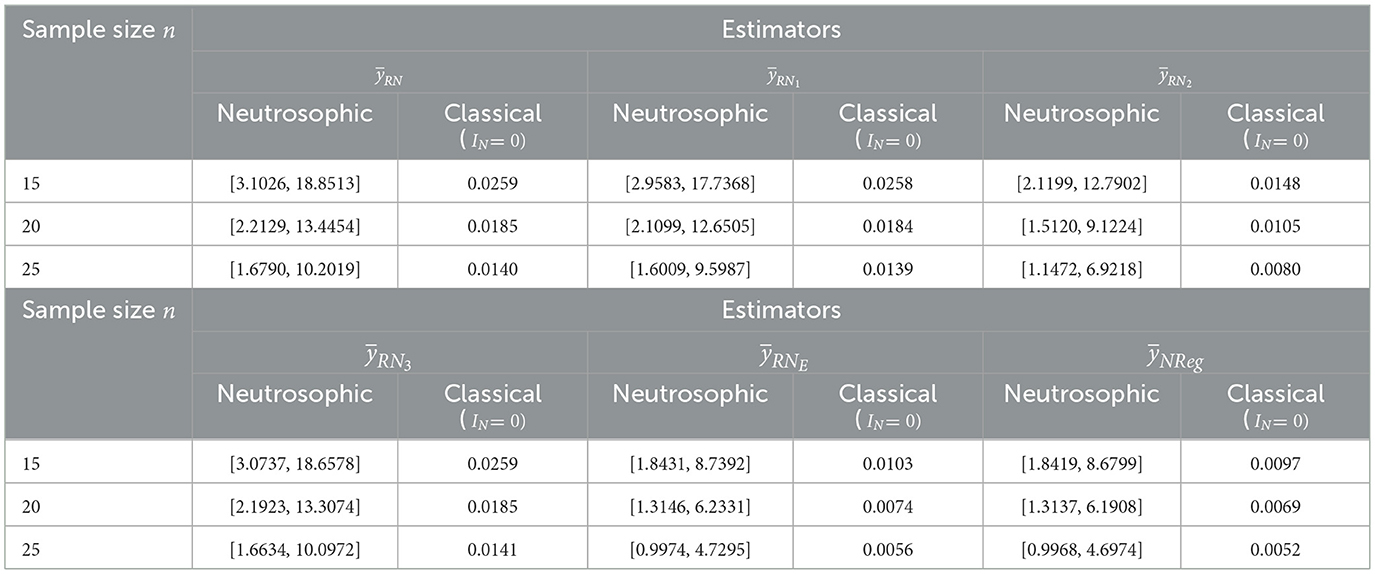
Table 4. Comparison of MSE for existing vs. proposed estimators using dataset 2.
For dataset 3, sample sizes n equal to 6, 9, and 12 were selected from a population of size N= 36, using simple random sampling without replacement (SRSWOR). These sample sizes represent approximately 15%, 25%, and 33% of the population size N= 36, respectively.
The findings of Table 5 revealed that the MSE of estimators and for sample size n= 6, were estimated to lie within the intervalss [0.1689, 0.5957], [0.1772, 0.6263], [0.2592, 0.7915], [0.1721, 0.6094], [0.6187, 1.9677] and [0.1021, 0.3731], respectively, with corresponding classical MSEs of 0.2837, 0.2938, 0.3991, 0.2875, 0.7834, and 0.1101. A close examination exhibits that the MSE of the neutrosophic exponential estimator is much larger than that of all estimators in neutrosophic and classical approaches, indicating that the exponential estimator is not suitable in some real-life situations, whereas the proposed neutrosophic regression estimator outperforms in all types of situations across the range of Pearson's correlation, among all the existing estimators and proposed by Tahir et al. [26]. Increasing the sample size from 6 to 12 exhibited a consistently decreasing trend of MSEs in both the neutrosophic and classical frameworks. In this way, MSEs for estimators and with sample size n=12, were evaluated to lie within the intervals [0.0676, 0.2383], [0.0709, 0.2505], [0.1037, 0.3166], [0.0688, 0.2438], [0.2475, 0.7871] and [0.0408, 0.1492], respectively, with corresponding classical MSEs of 0.1134, 0.1175, 0.1596, 0.1150, 0.3133, and 0.0440. This consistent decrease in MSEs with increasing sample size confirms the efficiency of these estimators in both frameworks. The neutrosophic framework provides interval-based MSE estimates that capture a range of uncertainties, in contrast to the point estimates of the classical framework. In this case of a real dataset related to demography, the classical MSE falls within the neutrosophic MSE interval across all estimators. This suggests that the neutrosophic regression estimator effectively handles uncertainty with greater precision and robustness.
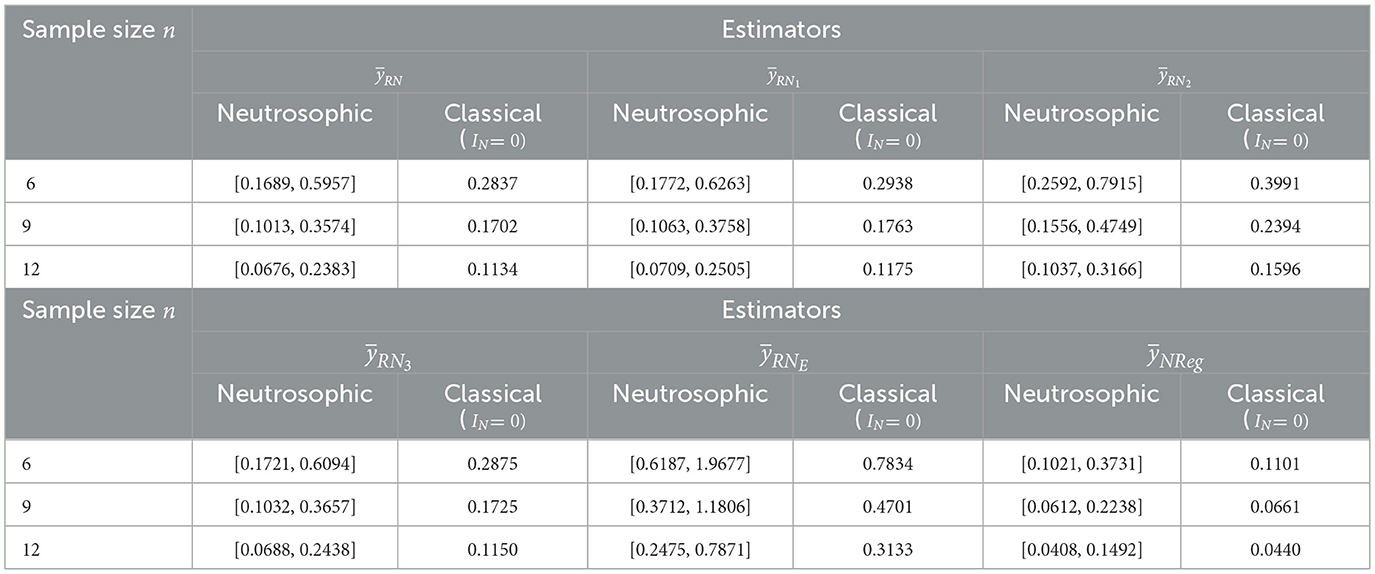
Table 5. Comparison of MSE for existing vs. proposed estimators using dataset 3.
For dataset 4, sample sizes n equal to 2, 3, and 4 were drawn from a population of size N = 12, with simple random sampling without replacement (SRSWOR) sampling. These sample sizes represent approximately 16%, 25%, and 33% of the total population size N = 12, respectively.
On the perusal of Table 6, with sample size n = 2, the MSEs of existing estimators and were obtained and found within the intervals [318844.3, 811371.7], [314515.0, 807758.0], [299088.7, 793749.0], [315957.9, 809267.5], [341817.9, 944036.4], and [271088.9, 783025.3], respectively, with corresponding classical MSEs of 333795.2, 327713.7, 306574.6, 329745.4, 303501.0, and 254138.6. However, MSEs of the neutrosophic exponential ratio estimator are comparatively higher among all existing estimators in both neutrosophic and classical approaches, indicating that the exponential estimator is not suitable in all real-life scenarios. This analysis suggested that the proposed neutrosophic regression estimator performs much better than all existing estimators in all types of situations across the range of Pearson's correlation. As the sample size n increased from 2 to 4, the MSEs of all the existing estimators consistently declined. In this sequence, MSEs with sample size n = 4, for estimators , and were determined and found to be within the ranges [127537.7, 324548.7], [125806.0, 323103.2], [119635.5, 317499.6], [126383.2, 323707.0], [136727.2, 377625.3, and [108435.6, 313210.1], respectively, with corresponding classical MSEs of 133518.1, 131085.5, 122619.0, 131898.2, 121400.0, and 101655.0. These findings indicate that decreasing MSE with increasing sample size validates the efficiency of all the estimators. The neutrosophic framework delivers interval-based MSE estimates that effectively account for data uncertainty from various sources. Conversely, the classical framework provides only point estimates, failing to address data uncertainties, making it less suitable for the current data context. This highlights the ability of neutrosophic estimators to manage diverse forms of indeterminacy in real-world data. Thus, the proposed neutrosophic estimator offers enhanced reliability and robustness for handling indeterminate datasets.
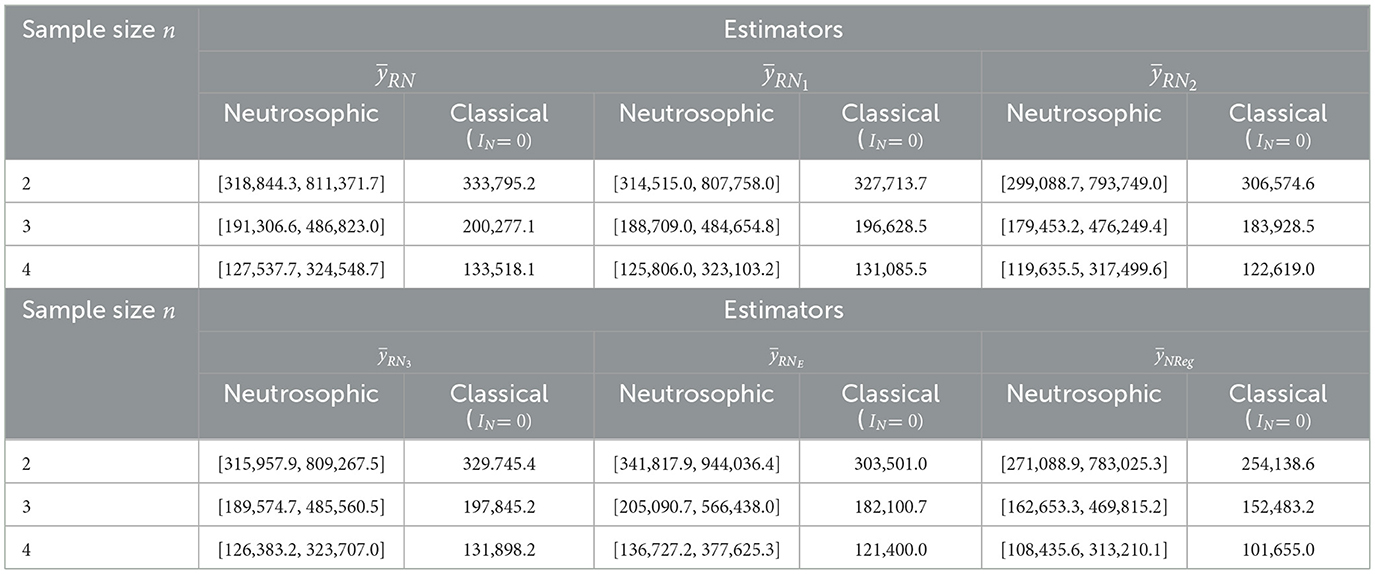
Table 6. Comparison of MSE for existing vs. proposed estimators using dataset 4.
Performance measure Percent Relative Efficiency (PRE) was also utilized to compare the performance of the proposed neutrosophic regression estimator with existing estimators , and and presented in Table 7.
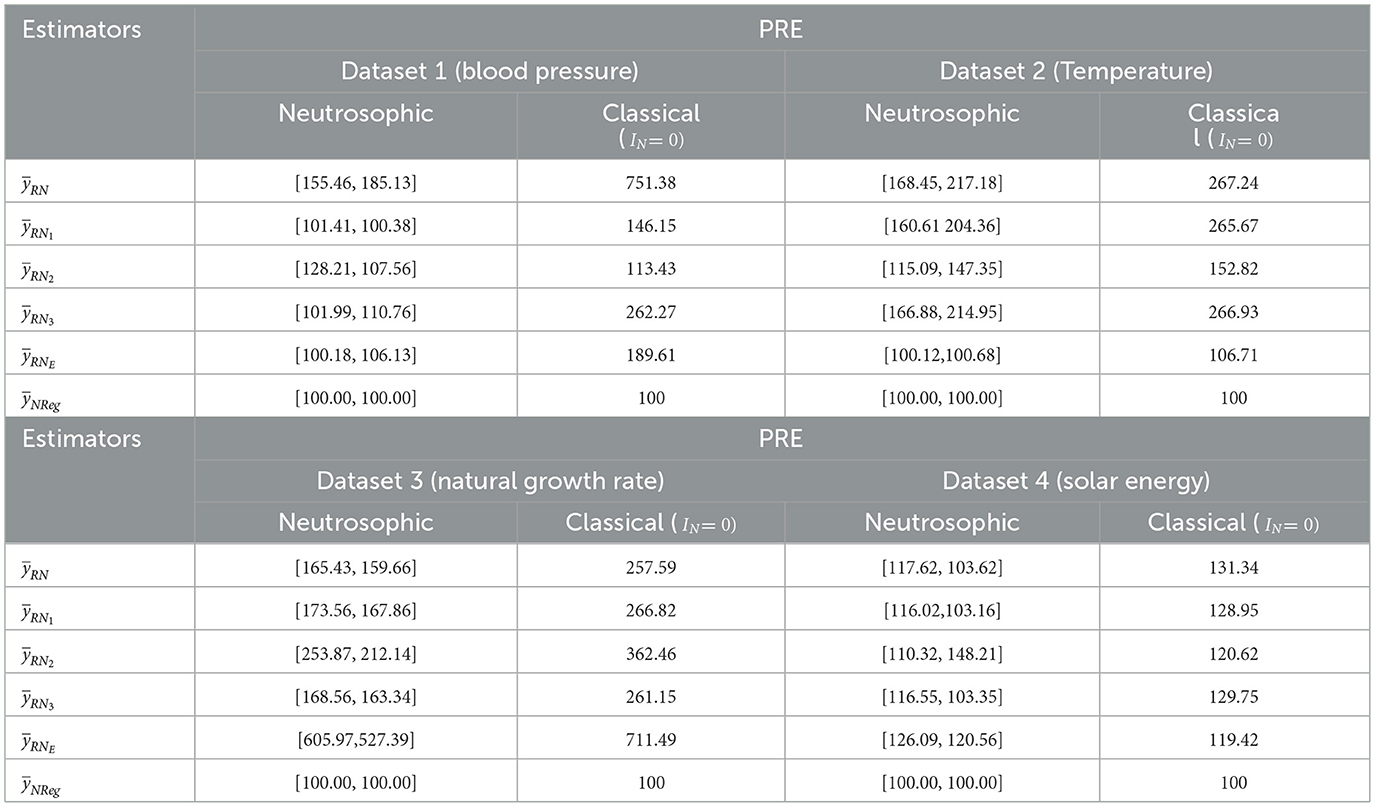
Table 7. Comparison of PRE for existing vs. proposed estimators.
On the assessment of Table 7, in the case of dataset 1, the PRE of the proposed neutrosophic regression estimator is [100.00, 100.00]. By employing this, PRE for other estimators was compared. PRE for the estimators , and were measured and found to be within the intervals [155.46, 185.13], [101.41, 100.38], [128.21, 107.56], [101.99, 110.76], and [100.18, 106.13], respectively, with corresponding classical PREs of 751.38, 146.15, 113.43, 262.27, and 189.61. These results demonstrated that the proposed neutrosophic regression estimator was more efficient than all existing estimators in both neutrosophic and classical frameworks. The estimators and contained much higher PREs in the classical framework than their neutrosophic counterpart. It indicates that the proposed neutrosophic regression estimator provides more stable and realistic results under uncertainty. Similarly, for dataset 2, PRE for the existing estimators and were evaluated and found within the intervals [168.45, 217.18], [160.61 204.36], [115.09, 147.35], [166.88, 214.95] and [100.12, 100.68], respectively, with corresponding classical PREs were 267.24, 265.67, 152.82, 266.93, and 106.71. These findings suggest that the proposed neutrosophic regression estimator performed better than the existing estimators in both settings. Moreover, the inflated PRE values under the classical setup further emphasize the limitations of classical estimators in handling data uncertainty, thereby highlighting the broader applicability and effectiveness of the neutrosophic approach in real-world, indeterminate scenarios. For dataset 3, the proposed neutrosophic regression estimator compared with the existing estimators and were found within the intervals [165.43, 159.66], [173.56, 167.86], [253.87, 212.14], [168.56, 163.34] and [605.97,527.39], respectively, with corresponding classical PREs of 257.59, 266.82, 362.46, 261.15, and 711.49. It was found that the proposed neutrosophic regression estimator outperformed all the existing estimators in both neutrosophic and classical approaches. However, the performance of neutrosophic exponential estimators compared to other existing estimators and was the worst. It exhibits existing estimators and are several times more efficient than the neutrosophic exponential estimator even for highly correlated variables in some situations under both neutrosophic and classical frameworks. Additionally, the inflated PRE values observed under the classical framework, as compared to those under the neutrosophic framework, suggest that classical estimators may overestimate efficiency in uncertain data conditions. This further underscores the broader applicability and robustness of the neutrosophic estimators, particularly in real-world scenarios characterized by indeterminacy and imprecision. Similarly for dataset 4, PRE for estimators , and were obtained and found within the intervals [17.62, 103.62], [116.02,103.16], [110.32, 148.21], [116.55, 103.35], and [126.09, 120.56], respectively with corresponding classical PREs of 131.34, 128.95, 120.62, 129.75, and 119.42. Based on the performance, the proposed neutrosophic regression estimator was found to be the most efficient among all existing estimators. However, the PRE value of the neutrosophic exponential estimator indicates that all other estimators performed much better than the same in some real-world scenarios in both neutrosophic and classical settings, so it can be said that the neutrosophic exponential estimator fails to tackle some real-world problems even with the highly correlated data. Along with this, the proposed estimator has wide applicability to handle uncertainty for imprecise and indeterminate data.
4.2 Evaluation of the proposed neutrosophic regression estimator using simulated data
To validate the robustness of the proposed neutrosophic regression estimator, a simulation study was conducted by generating a large neutrosophic population under a neutrosophic normal distribution such that the neutrosophic study variable YN and auxiliary variable XN follows a neutrosophic normal distribution (NND) with , YN ∈ (YL, YU), μyN ∈ (μyL, μyU), , and , XN ∈ (XL, XU), μxN ∈ (μxL, μxU), . Let YN~NN([76.0, 84.9], [(12.9)2, (17.2)2]), where μyN ∈ (76.0, 84.9), σyN ∈ (12.9, 17.2) and XN~NN ([171.2, 180.4], [(5.8)2, (6.7)2]) where μxN ∈ (171.2, 180.4), σxN ∈ (5.8, 6.7). Simulations were conducted with population sizes of 2,000 and 10,000, running 10,000 iterations to generate results using R software.
Table 8 summarizes the descriptive statistics of the simulated neutrosophic data and is used to evaluate the performance of the proposed neutrosophic regression-type estimator under the simulation study. In this study, a neutrosophic normal distribution (NND) was assumed for the study variable YN and auxiliary variable XN, with specified levels of variability and indeterminacy. The population size of 2,000 represented a large dataset generated for simulation, and the sample size was considered as 50 under SRSWOR. The neutrosophic means of the study variable and the auxiliary variable were determined to lie within the intervals [75.0504, 84.0164] and [169.8597, 181.2128], respectively. The neutrosophic coefficient of variation for the study variable and the auxiliary variable ranged from [0.1774, 0.2471] and [0.0718, 0.0777], respectively. The neutrosophic kurtosis was found to lie between [2.9096, 3.7944], and the neutrosophic correlation between the study variable and auxiliary variable was obtained to lie within the range [0.0381, 0.1615]. It indicates a weak correlation between the study variable and the auxiliary variable. Similarly, a sample size of 500 was considered from the simulated population of size 10,000 under SRSWOR, and the neutrosophic means of the study variable and the auxiliary variable were determined to lie within the intervals [75.6511, 85.0679] and [170.8981, 180.4626], respectively. The neutrosophic coefficient of variation for the study variable and the auxiliary variable were evaluated and ranged in intervals [0.18667, 0.25904] and [0.06233, 0.06744], respectively. The neutrosophic kurtosis was found to lie between [2.80087, 2.65350], and the neutrosophic correlation between the study variable and auxiliary variable was obtained to lie within the range [0.00721, −0.03439], where the upper bound of the neutrosophic correlation is negative.
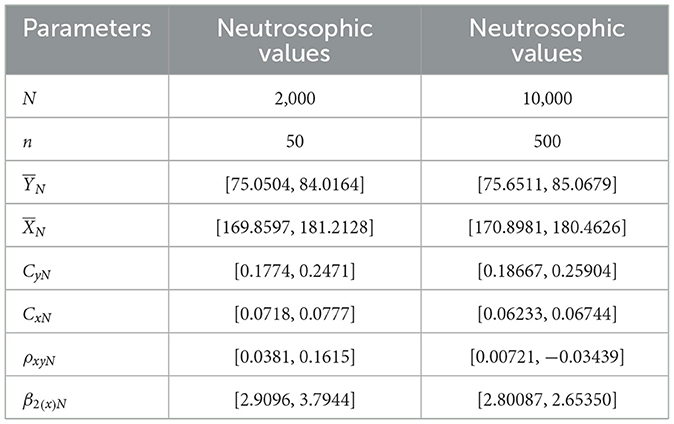
Table 8. Descriptive statistics for simulation under neutrosophic data.
Table 9 summarizes the results of the simulation study. The performance of the proposed neutrosophic regression estimator was assessed under simulated conditions by increasing the population size from 2000 to 10000, with corresponding sample sizes of 50 and 500, respectively. The findings reinforce the robustness and consistency of the proposed estimator across varying sample sizes and correlation levels. At a population size of 2,000 with a sample size of 50, the Mean Squared Error (MSE) for the proposed neutrosophic regression estimator was found to lie within the interval [3.4525, 8.1830], representing the lowest among all the evaluated estimators. This superior performance was observed even under weak neutrosophic correlation scenarios, where the correlation ranged between [0.0381, 0.1615]. With an increase in population size to 10,000 and a corresponding sample size of 500, a consistent decrease in MSE was observed across all estimators, confirming the expected enhancement in estimation accuracy with larger samples. The MSE for the proposed estimator further declined to [0.3789, 0.9215], maintaining the lowest range among all compared estimators. Notably, this performance was achieved under a negative neutrosophic correlation scenario [0.00721, −0.03439], highlighting that the proposed estimator remains highly efficient even in weak or adverse correlation conditions. These simulation outcomes validate the superiority of the proposed neutrosophic regression estimator over existing estimators. Not only does it perform well in small samples and under weak correlation, but it also scales efficiently to large populations and samples. The PRE values of all competing estimators exceed 100, which typically implies lower efficiency relative to the proposed estimator, whose PRE is standardized to 100. Thus, these results confirm the estimator's robustness, general applicability, and high accuracy in scenarios characterized by indeterminacy and imprecision.
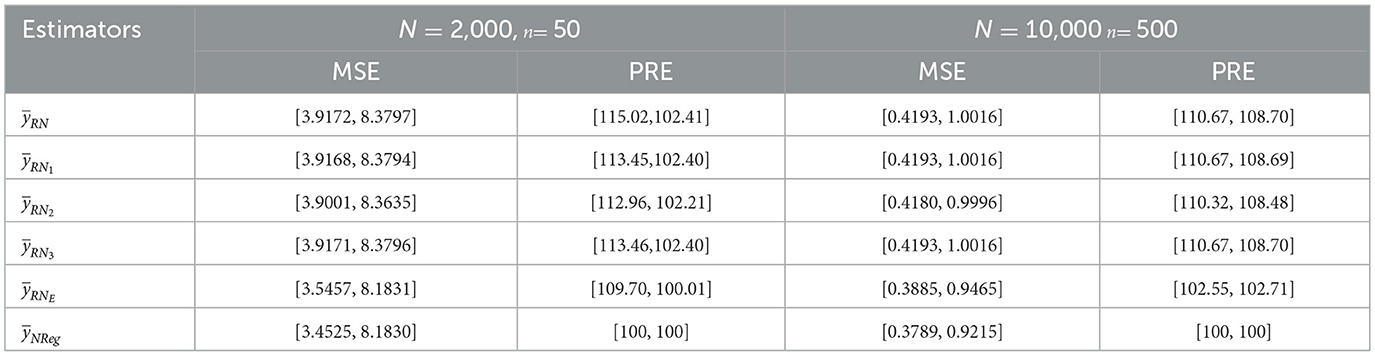
Table 9. Comparison of MSE and PRE for existing vs. proposed estimators under simulation.
It suggests that the proposed neutrosophic regression estimator outperforms all existing estimators. These results align with the study conducted on real-world datasets and further reinforce the robustness, consistency, and superiority of the proposed neutrosophic regression estimator in handling data that contains either high, weak, or moderate correlation as well as negative correlation structure.
5 Conclusion
The proposed neutrosophic regression estimator is an extension of the classical regression estimator. The proposed neutrosophic regression estimator assumes that the neutrosophic study and auxiliary variables follow a linear relationship within the interval-based framework. In this study, a neutrosophic regression estimator was developed for estimating the finite population mean in the presence of indeterminate, imprecise, and vague data. Under conditions IN = 0, where indeterminacy is absent, the proposed neutrosophic estimator reduces to the classical regression estimator, ensuring compatibility with traditional methods. The estimator's bias and mean squared error (MSE) were derived using Taylor series expansion, with the MSE minimized through differentiation to achieve optimal performance. The performance of the proposed estimator was evaluated using a simulated dataset and four real-world datasets related to blood pressure, temperature, natural growth rate, and solar energy in both the neutrosophic and classical frameworks. Beyond the evaluated datasets, the proposed estimator has potential applications in various domains. In agriculture, it can improve crop yield forecasting by accounting for uncertainties in weather and soil conditions. In public health, it can enhance the analysis of medical measurements in the case of cholesterol levels and heart rate variability with inherent variability. In the subject of social sciences, employment rate, economic growth rate, and so on. The “neutroSurvey” R-package further enables its use in large-scale surveys, such as national census data analysis or economic forecasting, where data indeterminacy is common. The correlation between the study variable and auxiliary variable was [0.0381, 0.1615] and [0.00721, −0.03439] for population sizes of 2,000 and 10,000 with sample sizes of 50 and 500, respectively, in the simulated data. In real datasets, correlation varied across different scenarios: [0.3932, 0.5503], [0.6126, 0.6759], [0.9652, 0.9585], and [0.8216, 0.7391]. These values represent weak to strong correlation levels as well as negative correlation. The proposed neutrosophic regression estimator consistently outperforms all existing neutrosophic ratio and neutrosophic exponential estimators across all the ranges of correlation levels, from weak to strong positive and negative. As this study focuses mainly on proving that our proposed estimator based on neutrosophic data is performing better than the existing ones, a comparison with a non-neutrosophic scenario was not performed in this study. It was found that the proposed neutrosophic regression estimator can enhance decision-making in fields where data are often imprecise or incomplete, such as agriculture, health, and environmental studies.
6 Limitations and future studies
The proposed methodology is only for uni-stage sampling designs, whereas in real-life large-scale surveys, complex sampling designs with complex probability structures, i.e., multistage sampling, PPS sampling, multiphase sampling, and so on, were used. Furthermore, model-based and model-assisted estimation is preferred in many survey setups for the generation of the official statistics. The classical regression estimator is a special case of the assisted generalized regression estimator (GREG). Hence, for future research, there is a scope for producing neutrosophic estimators for more advanced complex sampling designs as well as estimation procedures. Furthermore, its extension to multivariate setups, or integration with robust and machine learning-based methods, can also be explored.
Data availability statement
Publicly available datasets were analyzed in this study. This data can be found here: https://ncdrisc.org/index, https://data.gov.in/resource/seasonal-and-annual-minimum-maximum-temperature-series-1901-2017, https://censusindia.gov.in/nada/index.php/catalog/42687.
Author contributions
NP: Data curation, Visualization, Methodology, Project administration, Validation, Conceptualization, Writing – original draft, Software, Formal analysis, Investigation, Writing – review & editing, Resources. KA: Visualization, Resources, Project administration, Data curation, Formal analysis, Validation, Methodology, Software, Writing – review & editing, Investigation, Writing – original draft, Conceptualization, Supervision. Bharti: Data curation, Visualization, Project administration, Validation, Supervision, Writing – original draft, Investigation, Formal analysis, Writing – review & editing. PD: Data curation, Validation, Project administration, Writing – review & editing, Supervision, Formal analysis, Investigation, Writing – original draft, Software. TA: Data curation, Visualization, Writing – original draft, Project administration, Resources, Formal analysis, Writing – review & editing, Supervision.
Funding
The author(s) declare that no financial support was received for the research and/or publication of this article.
Conflict of interest
The authors declare that the research was conducted in the absence of any commercial or financial relationships that could be construed as a potential conflict of interest.
Generative AI statement
The author(s) declare that no Gen AI was used in the creation of this manuscript.
Any alternative text (alt text) provided alongside figures in this article has been generated by Frontiers with the support of artificial intelligence and reasonable efforts have been made to ensure accuracy, including review by the authors wherever possible. If you identify any issues, please contact us.
Publisher's note
All claims expressed in this article are solely those of the authors and do not necessarily represent those of their affiliated organizations, or those of the publisher, the editors and the reviewers. Any product that may be evaluated in this article, or claim that may be made by its manufacturer, is not guaranteed or endorsed by the publisher.
Supplementary material
The Supplementary Material for this article can be found online at: https://www.frontiersin.org/articles/10.3389/fams.2025.1658157/full#supplementary-material
References
1. Office Office of the Registrar General & Census Commissioner, India (ORGI). Sample Registration System (SRS)-Bulletin 2020, Vol. 55-1 (2022). Available online at: https://censusindia.gov.in/nada/index.php/catalog/42687 (Accessed August 27, 2025).
2. Mallik S, Mohanty S, Shankar B, Mishra P. Recommendation system using neutrosophic logic in agriculture. Int J Intell Syst Appl Agric. (2024) 12:735–41. doi: 10.1289/isesisee.2018.P01.1470
3. Smarandache F. Neutrosophy: neutrosophic probability, set, and logic: analytic synthesis & synthetic analysis. Rehoboth: Amsterdam Research Press. (1998) 105:118–23.
4. Smarandache F. Introduction to Neutrosophic Statistics. Craiova: Sitech & Education Publishing (2014).
5. Alhabib R, Ranna MM, Haitham F, Salama AA. Some neutrosophic probability distributions. Neutrosophic Sets Syst. (2018) 22:30–8. doi: 10.5281/zenodo.2160478
6. Aslam M. Neutrosophic analysis of variance: application to university students. Complex Intell Syst. (2019) 5:403–7. doi: 10.1007/s40747-019-0107-2
7. Aslam M. Monitoring the road traffic crashes using NEWMA chart and repetitive sampling. Int J Inj Contr Saf Promot. (2020) 28:39–45. doi: 10.1080/17457300.2020.1835990
8. Aslam M. A study on skewness and kurtosis estimators of wind speed distribution under indeterminacy. Theor Appl Climatol. (2021) 143:1227–34. doi: 10.1007/s00704-020-03509-5
9. Aslam M. Analyzing Gray cast iron data using a new Shapiro-Wilks test for normality under indeterminacy. Int J Cast Met Res. (2021) 34:1–5. doi: 10.1080/13640461.2020.1846959
10. Aslam M. Testing average wind speed using sampling plan for Weibull distribution under indeterminacy. Sci Rep. (2021) 11:1–9. doi: 10.1038/s41598-021-87136-8
11. Woodall WH, Driscoll DC, Montgomery DC. A review and perspective on neutrosophic statistical process monitoring methods. IEEE Access (2022) 10:100456–62. doi: 10.1109/ACCESS.2022.3207188
12. Aslam M. Radar data analysis in the presence of uncertainty. Eur J Remote Sens. (2021) 54:140–4. doi: 10.1080/22797254.2021.1886597
13. Aslam M. Chi-square test under indeterminacy: an application using pulse count data. BMC Med Res Methodol. (2021) 21:201. doi: 10.1186/s12874-021-01400-z
14. Aslam M. On testing autocorrelation in metrology data under indeterminacy. Mapan. (2021) 36:515–9. doi: 10.1007/s12647-021-00429-1
15. Aslam M. Neutrosophic statistical test for counts in climatology. Sci Rep. (2021) 11:1–5. doi: 10.1038/s41598-021-97344-x
16. Aslam M, Shafqat A, Albassam M, Malela-Majika JC, Shongwe SC. A new CUSUM control chart under uncertainty with applications in petroleum and meteorology. PLoS ONE. (2021) 16:e0246185. doi: 10.1371/journal.pone.0246185
17. Aslam M, Sherwani RAK, Saleem M. Vague data analysis using neutrosophic Jarque-Bera test. PLoS ONE. (2021) 16:e0260689. doi: 10.1371/journal.pone.0260689
18. Aslam M, Khan N. Normality test of temperature in Jeddah city using Cochran's test under indeterminacy. Mapan. (2021) 36:589–98. doi: 10.1007/s12647-020-00428-8
19. Aslam M, Algarni A. Analysing the solar energy data using a new Anderson-Darling test under indeterminacy. Int J Photoenergy. (2020) 2020:6662389. doi: 10.1155/2020/6662389
20. Sisodia B, Dwivedi V. Modified ratio estimator using coefficient of variation of auxiliary variable. J Indian Soc Agric Stat. (1981) 33:13–8.
21. Upadhyaya LN, Singh HP. On the estimation of the population mean with known coefficient of variation. Biom J. (1984) 26:915–22. doi: 10.1002/bimj.4710260814
22. Singh HP, Tailor R, Kakran M. An improved estimator of population mean using power transformation. J Indian Soc Agric Stat. (2004) 58:223–30.
23. Kadilar C, Cingi H. Ratio estimators for the population variance in simple and stratified random sampling. Appl Math Comput. (2006) 173:1047–59. doi: 10.1016/j.amc.2005.04.032
24. Bahl S, Tuteja RK. Ratio and product type exponential estimators. J Inf Optim Sci. (1991) 12:159–64. doi: 10.1080/02522667.1991.10699058
25. Gupta S, Shabbir J, Sousa R, Corte Real P. Ratio estimation of the mean of a sensitive variable in the presence of auxiliary information. Commun Stat Theory Methods. (2012) 41:2394–404. doi: 10.1080/03610926.2011.641654
26. Tahir Z, Khan H, Alamri FS, Aslam M, Aljohani HM. Neutrosophic ratio-type estimators for estimating the population mean. Complex Intell Syst. (2021) 7:2991–3001. doi: 10.1007/s40747-021-00439-1
27. Tahir Z, Khan H, Alamri FS, Aslam M. Neutrosophic ratio-type exponential estimators for estimation of population mean. J Intell Fuzzy Syst. (2023) 45:4559–83. doi: 10.3233/JIFS-223539
28. Alqudah MA, Zayed M, Subzar M, Wan SA. Neutrosophic robust ratio-type estimator for estimating finite population mean. Heliyon. (2024) 10:e28934. doi: 10.1016/j.heliyon.2024.e28934
29. Singh R, Kumari A, Smarandache F, Tiwari SN. Construction of almost unbiased estimator for population mean using neutrosophic information. Neutrosophic Sets Syst. (2024) 76:449–63. doi: 10.5281/zenodo.14010268
30. Yadav VK, Majhi D, Alkhathami AA, Prasad S. Neutrosophic mean estimators using extreme indeterminate observations in sample surveys. Neutrosophic Sets Syst. (2025) 80:1. doi: 10.5281/zenodo.14707260
31. Package T, Neutrosophic T, Data S. Package ‘neutroSurvey' (2025). Available online at: https://CRAN.R-project.org/package=neutroSurvey (Accessed August 6, 2025).
Keywords: classical statistics, neutrosophic statistics, neutrosophic estimator, bias, percent relative efficiency (PRE)
Citation: Purwar N, Aditya K, Bharti, Das P and Ahmad T (2025) Neutrosophic regression type estimator for the finite population mean and its applications in real data scenarios. Front. Appl. Math. Stat. 11:1658157. doi: 10.3389/fams.2025.1658157
Received: 02 July 2025; Accepted: 18 August 2025;
Published: 17 September 2025.
Edited by:
Surapati Pramanik, Nandalal Ghosh B.T. College, IndiaReviewed by:
Zakariya Yahya Algamal, University of Mosul, IraqMuhammad Aslam, King Abdulaziz University, Saudi Arabia
Copyright © 2025 Purwar, Aditya, Bharti, Das and Ahmad. This is an open-access article distributed under the terms of the Creative Commons Attribution License (CC BY). The use, distribution or reproduction in other forums is permitted, provided the original author(s) and the copyright owner(s) are credited and that the original publication in this journal is cited, in accordance with accepted academic practice. No use, distribution or reproduction is permitted which does not comply with these terms.
*Correspondence: Kaustav Aditya, a2F0dTQ0OTNAZ21haWwuY29t