Abstract
Introduction:
Biofilm production is an important yet currently overlooked aspect of diagnostic microbiology that has implications for antimicrobial stewardship. In this study, we aimed to validate and identify additional applications of the BioFilm Ring Test® (BRT) for Pseudomonas aeruginosa (PA) isolates from patients with bronchiectasis (BE).
Materials and methods:
Sputa were collected from BE patients who had at least one PA positive culture in the previous year. We processed the sputa to isolate both mucoid and non-mucoid PA, and determined their susceptibility pattern, mucA gene status, and presence of ciprofloxacin mutations in QRDR genes. The Biofilm production index (BPI) was obtained at 5 and 24 hours. Biofilms were imaged using Gram staining.
Results:
We collected 69 PA isolates, including 33 mucoid and 36 non-mucoid. A BPI value below 14.75 at 5 hours predicted the mucoid PA phenotype with 64% sensitivity and 72% specificity.
Conclusion:
Overall, our findings suggest that the fitness-cost associated with the mucoid phenotype or ciprofloxacin resistance is shown through a time-dependent BPI profile. The BRT has the potential to reveal biofilm features with clinical implications.
1 Introduction
Non-cystic fibrosis (non-CF) bronchiectasis (BE) is a chronic structural and inflammatory respiratory disease characterized by irreversible destruction and dilatation of the bronchi that result in recurrent infections and exacerbations. Physiopathologically, the tissular destruction involves a vicious circle of impaired mucociliary clearance, bronchial infection and chronic inflammation (Cohen and Sahn, 1999; Barker, 2002; King et al., 2006; Hill et al., 2017; Polverino et al., 2017; Flume et al., 2018).. Haemophilus influenzae and Pseudomonas aeruginosa (PA) are the most frequently isolated microorganisms in non-CF BE exacerbations (Chandrasekaran et al., 2018). Furthermore, PA is an independent factor contributing to a threefold increase in the risk of death. It is also associated with a higher number of exacerbations and hospitalizations, and higher symptomatology perceived by the patient (Finch et al., 2015). Given the relationship between PA and poor clinical outcomes in patients with BE, its early detection and appropriate management are essential (Fernández-Barat et al., 2021).
Early PA colonization is frequently associated with the isolation of the non-mucoid phenotype. However, unless eradicated, the non-mucoid strain can shift to a mucoid PA phenotype through genetic changes such as mutations in mucA gene (Fernández-Barat et al., 2017; Crisafulli et al., 2018; Dhand, 2018). These mutations are considered to play an important role in the genetic adaptive evolution of PA. It has been demonstrated that mutator populations are amplified in the lung by presenting adaptive mutations (Ciofu et al., 2017). Loss-of-function mutations in mucA cause an overproduction of alginate exopolysaccharide, which is characteristic of the mucoid phenotype. The mucoid phenotype has been shown to be a hallmark of chronic infections, higher viscoelasticity of sputum (Alcaraz-Serrano et al., 2019) and biofilm maturation, which impair both the effect of antibiotics and host immune functions (Malhotra et al., 2018). In addition, the metabolic rate of PA within biofilm aggregates is lower than its planktonic counterparts, driving bacterial cells to a dormant state in which some of them become “persister cells” that do not divide and are highly tolerant to antimicrobials (Lewis, 2007; Yang et al., 2008).
It is important to highlight that the Minimum Inhibitory Concentration (MIC) routinely reported by the microbiology laboratories does not reflect the Minimum Biofilm Inhibitory Concentration (MBIC) since the MBIC is often several times greater than the MIC of a planktonic PA strain (Ciofu et al., 2017). Thus, the diagnostic value of biofilm formation is currently underestimated hindering the management of patients with chronic respiratory diseases (Wang et al., 2012; Thieme et al., 2019).
Multiple methods are available to measure bacterial biofilm production, although none of them are currently applied in the routine standard of care (Peeters et al., 2008; Pantanella et al., 2013). The microtiter plate method is extensively used to quantify the in vitro biofilm capability of bacteria, but it is limited by the inability to confidently extrapolate those results to in vivo scenarios (Fernández-Barat et al., 2018). BioFilm Ring Test® (BRT) is a novel technology developed to determine biofilm formation production by the measurement of the adhesion between bacteria. It has shown increased sensitivity and specificity compared to the traditional crystal violet test. The BRT does not require staining, is easy to handle and the results can be obtained in a few hours, being more suitable for clinical practice than previous techniques (Chavant et al., 2007; Sulaeman et al., 2010; Olivares et al., 2016). The BRT has been recently shown to have a potential application in the selection of antimicrobials in CF (Olivares et al., 2016). However, additional applications of the BRT, such as its correlation with microbiological and clinical features have not been previously reported (Di Domenico et al., 2016). We aimed to validate the BRT assay using a significant number of PA clinical isolates from Non-CF BE patients. We also aimed to investigate additional applications of the BRT by comparing the biofilm production index (BPI) between mucoid and non-mucoid PA isolates, susceptible and resistant PA, presence and absence of biofilm pattern by Gram and intermittent and chronic infection status, in addition to assess the sensitivity and specificity for significant associations. Finally, we correlated the BPI with the mutations in mucA gene.
2 Material and methods
2.1 Definitions
2.1.1 Bronchiectasis
A diagnosis of BE of any cause in the absence of chronic obstructive pulmonary disease (COPD) using high-resolution computed tomography (HRCT) of the chest.
2.1.2 Bronchiectasis with chronic obstructive pulmonary disease
Diagnosis of BE as mentioned above and a diagnosis of COPD (persistent respiratory symptoms and airflow limitation with a history of smoking, according to the GOLD criteria (Vogelmeier et al., 2017).
2.1.3 Chronic infection
≥2 PA isolates in respiratory specimens ≥3 months apart in 1 year (Polverino et al., 2017).
2.1.4 Intermittent infection
PA isolates in respiratory specimens not accomplishing the chronic infection definition (Fernández-Barat et al., 2021).
2.1.5 Exacerbation
Deterioration in three or more key symptoms: cough, sputum volume and/or consistency, sputum purulence, dyspnea and/or exercise tolerance, fatigue or malaise, and hemoptysis, in accordance with European guidelines (Hill et al., 2017).
2.1.6 Slow growing PA
PA with an increased BPI in 24 h of incubation when compared to 5 h of incubation.
2.2 Patients and strains
The studies involving human participants were reviewed and approved by the Internal Review Board of the Hospital Clinic of Barcelona (registry number HCB/0236). Written informed consent was obtained from all patients. The study was carried out in compliance with the Declaration of Helsinki (current version: Fortaleza, Brazil, October 2013) and with the requirements of the 2007 Spanish Biomedical Research Act.
All patients (≥18 years) had BE (confirmed by a CT scan) with or without COPD and had at least one recent positive sputum culture for PA prior to study recruitment. Valid sputa were immersed in 1:1 Dithiothreitol (DTT) solution and sonicated for 5 min at 40KHz in an ultrasonic cleaning equipment (Branson 3510 E-MT; Bransonic, Danbury, CT, USA), before being serially diluted in 0.9% saline solution and cultured both in MacConkey agar and Blood agar (BD). PA strains were isolated and identified by MALDI-TOF. They were classified as mucoid or non-mucoid phenotypes depending on the colony morphology. An extension of each fresh sample was obtained for the Gram staining.
2.3 Imaging PA biofilms by Gram staining
The quality of the sample was evaluated by Gram staining in the area of maximal purulence, according to the criteria of Murray and Washington (1975). To image the Gram staining, an Olympus BX41TF microscope (Olympus, Tokyo, Japan) with a 100X oil immersion lens was used. Gram-negative bacilli susceptible of PA (PA was confirmed in culture from the same sputum sample) were classified into 3 groups: planktonic PA (Gram-negative rods present without aggregates), PA biofilm (Gram-negative rods present in aggregates) and PA alginate (Gram-negative rods in aggregates embedded in alginate).
2.4 Susceptibility testing
Strains were classified as resistant, intermediate or susceptible to amikacin, tobramycin, imipenem, meropenem, ceftazidime, ciprofloxacin, piperacillin-tazobactam, aztreonam, and colistin according to the EUCAST (2017) breakpoints using the disk diffusion method (BD) following the EUCAST protocol. ATCC 27853 was used as quality control. Strains were then categorized as non-multidrug resistant (non-MDR) or resistant strains (including multidrug resistant (MDR) and extensive drug resistant (XDR) strains) according to current definitions (Magiorakos et al., 2012).
2.5 Biofilm ring test
The test was performed using the reagents in the Biofilm Ring Test kit (KIT01) (Biofilm Control, Saint Beauzire, France), following Chavant T. et al. protocol (Chavant et al., 2007). Bead aggregation was analyzed by the BFC Elements 3.0 software (Biofilm reader, Biofilm Control, Saint Beauzire, France). In order to minimize variability on the BPI, 8 intra-assay replicates and inter-assay triplicates were performed. PA were then classified into weak BPI<5, moderate BPI≥5 but <10, strong BPI≥10 but <15 and very strong BPI≥15 biofilm producers based on their BPI. In a subset of 20 mucoid and 9 non-mucoid PA suspected of slow biofilm production at 5h, an extended experiment was performed, using the aforementioned protocol but with a 24h incubation instead of the 5h of the standard protocol in order to elucidate the role of the PA slow growth in the BPI results. We classified the strains showing an increase in BPI from 5 to 24 hours as slow-growing Pseudomonas aeruginosa strains. To estimate their growth rate, we used the percentage of the total BPI at 5 hours. We then compared the growth rates between mucoid and non-mucoid strains that exhibited slow growth.
2.6 Mutations in mucA and QRDR genes
The mucA gene of all PA and for quinolone resistant QRDR genes (gyrA, gyrB, parC and parE) for 43 PA isolates included in this study were amplified by PCR. Primers used for amplification and sequencing are reported in Table 1 or previously published (Cabrera et al., 2022). PCR products were sequenced by Sanger methods (Genewiz, Germany), and were analyzed by alignment with the corresponding template sequence of PAO1 mucA at GenBank (Ciofu et al., 2010). PCR was performed in a Veriti PCR Thermal Cycler (Applied Biosystems, France) for 2 min denaturation at 94°C followed by 30 cycles of 1 min at 94°C, 1 min at 60°C and 1 min at 72°C, with a final extension of 7 min at 72°C.
Table 1
| mucA1 | F (5’ 3’) | CTCTGCAGCCTTTGTTGCGAGAAG |
| mucA1 | R (5’ 3’) | CTGCCAAGCAAAAGCAACAGGGAGG |
| mucA2 | F (5’ 3’) | GTGCGTCTGTACAACCAGAACGACG |
| mucA2 | R (5’ 3’) | GTCGTTCTGGTTGTACAGACGCACG |
Amplification and sequencing primers for mucA.
2.7 Statistical analysis
Categorical variables were reported as number (%), while continuous variables were reported as mean ± standard deviation (SD) or median (interquartile range, IQR), if the distribution was normal or non-normal, respectively. Continuous variables between groups were compared using the one-way analysis of variance (ANOVA) followed by a post-hoc pairwise Tukey’s honestly significant difference (HSD) or Kruskal-Wallis tests, as appropriate. Paired samples were compared with a paired t-test or the nonparametric Wilcoxon signed-rank test when appropriate. Chi-squared test was performed for categorical comparisons.
Receiver operating characteristic (ROC) curves (*) were constructed to determine the best cut-point for BPI to predict the PA phenotype or resistance to ciprofloxacin. Youden’s index (Youden, 1950) was defined for all points along the ROC curve, and the maximum value of the index was used as a criterion for selecting the optimum cut-off point. To determine the predictive capacity of BPI for identification of PA mucoid phenotype or resistance to ciprofloxacin, we determined sensitivity, specificity, positive and negative predictive values (*), along with the 95% confidence intervals (CIs).
All statistical analyses were performed with the SPSS program version 22.0. The level of significance was adjusted at 0.05 (two-tailed).
3 Results
3.1 Patients and strains
Sixty-nine BE patients were included (25 of them with BE-COPD). Forty-eight patients had been chronically infected by PA for a period of 5.5 [2.25-12] years whilst 21 were intermittently colonized. Thirty-three mucoid and 36 non-mucoid PA isolates similarly distributed between the BE-COPD and BE (p=0.78) were found. The distribution of mucoid vs non-mucoid PA strains was different between chronically infected and intermittently colonized patients (94% vs 6% for the mucoid strains and 47.2% vs 52.8% for the non-mucoid strains, respectively, p < 0.001).
3.2 Gram visualization
Presence of alginate in sputa Gram stains was observed in 44% of the patients with a chronic PA respiratory infection, but was not found in the non-chronically infected patients (p = 0.004). Alginate was more frequently when the mucoid PA was isolated than when the non-mucoid PA was isolated (93.3% vs 6.7%, respectively, p < 0.001) and more frequently observed in the non-MDR PA isolates than in the resistant ones (MDR and XDR) (78.6% vs 21.4%, respectively, p = 0.010). The presence of alginate in the Gram stains did not show a statistically significant association with differences in the BPI, although the sputum samples with alginate were associated with lower BPI values at 5 h than those without alginate (13.38 [6.98-19.73] vs 16.7 [7.18-20.00], p = 0.202) (Figure 1).
Figure 1
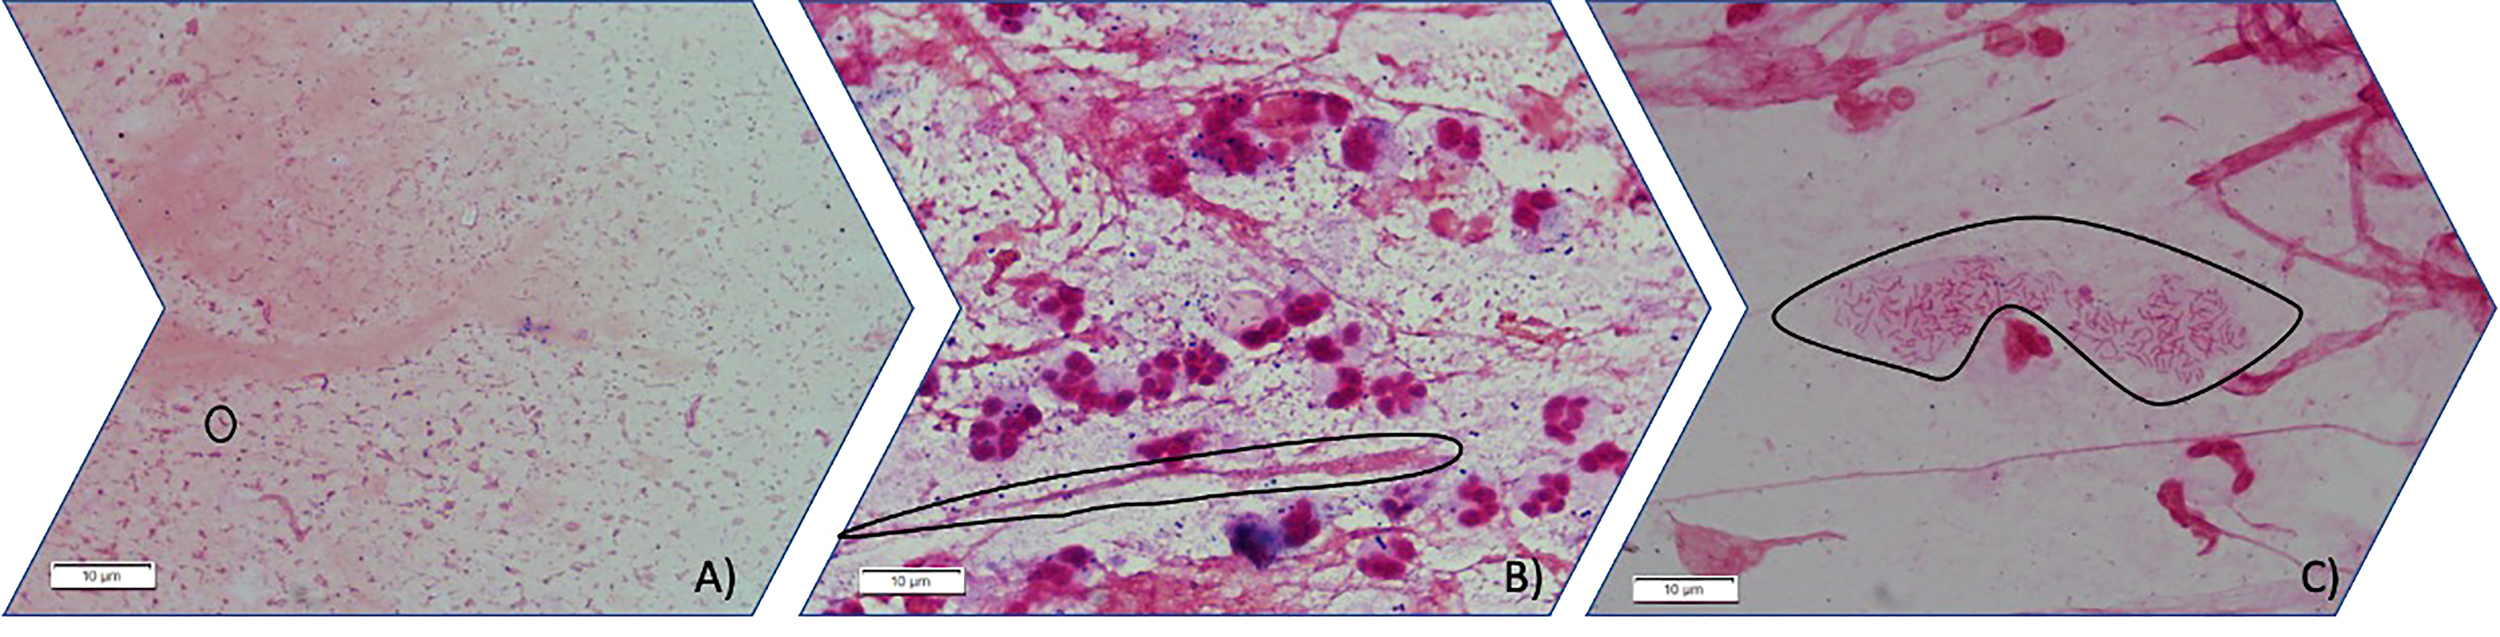
Three different stages of PA mode of growth in sputum observed by light microscopy (100X). (A) Planktonic stage in which Gram-negative bacilli are seen free floating in planktonic mode of growth (circled an individual gram-negative bacilli). (B) Gram-negative bacilli grow aggregated forming immature biofilms. (circled an aggregate of gram-negative bacilli inside mucus) (C) Gram-negative bacilli can be found aggregated embedded in an optically distinguishable alginate extracellular matrix circled in the image.
3.3 Biofilm ring test
The BPI after 5 h was significantly different between the mucoid and non-mucoid strains, being higher in the non-mucoid isolates (12.36 [5.55-18.74] vs 19.08 [10.63-20.00], respectively, p = 0.006) (Figure 2A). In a subset of 22 mucoid and 18 non-mucoid PA strains with slow growth, BPI was compared at 5 h vs 24 h of incubation. The percentage of BPI achieved at 5 h was different between mucoid and non-mucoid strains (35.33 ± 23.78 vs. 68.37 ± 23.07 ± 23.07, p<0.0001), which demonstrated that the delay in growth was superior in mucoid than in non-mucoid strains. The BPI increased in a time-dependent manner for mucoids at 5 vs 24h (4.55 [1.18-7.86] vs 19.75 [18.60-20.00], respectively, p = 0.001). By contrast, no statistically significant increase in the BPI was found for non-mucoid strains at 5 h vs 24 h (6.84 [6.01-9.05] vs 19.55 [12.09-19.96], respectively, p = 0.068) (Figure 2B).
Figure 2
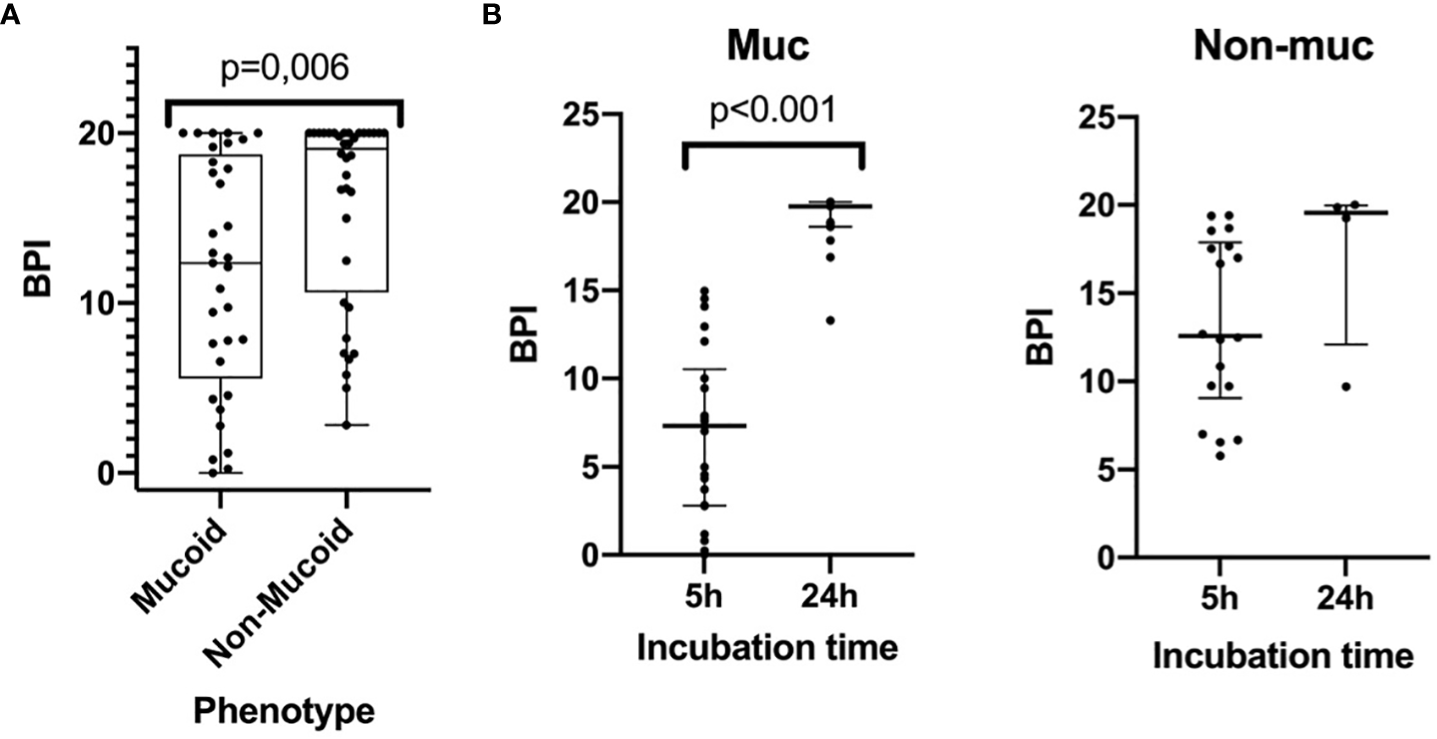
The Biofilm index of mucoid and non-mucoid PA phenotypes and its time-dependent increase during incubation. (A) Boxplot showing BPI of the 69 PA isolates, by mucoid and non-mucoid PA, read at 5h as recommended by manufacturer. Median and interquartile ratio are represented by the box and whiskers show the maximum and minimum values. The non-mucoid vs mucoid PA phenotype is associated with an increased BPI (19,08 [10,63-20,00] vs 12,36 [5,55-18,74] p=0.006, respectively). (B) BPI at 5 vs 24h by phenotype. Median is represented by the central line whilst interquartile ratio is represented by the two lines at the extremes. A statistically significant increase of the BPI can be seen in mucoid strains when incubating at 24 h whilst a greater heterogenous non-statistically significant result is achieved in non-mucoid strains).
In particular, all the 8 mucoid strains with a low BPI that were weak biofilm producers at 5 h exhibited a strong and very strong biofilm producer phenotype at 24 h based on their BPI (1.98 [0.38-4.19] vs 19.31 [17.13-20.00], respectively, p = 0.012). Additionally, the categorical stratification of the BPI (at 5 h) into weak, moderate, strong and very strong biofilm producers presented significant differences when comparing mucoid and non-mucoid PA strains (p = 0.022). After 24 hours, 85% of the mucoid vs 56% of the non-mucoid strains demonstrated a strong or very strong ability to produce biofilms (see Table 2). Comparing the BPI of resistant and susceptible strains for all the antimicrobial agents, no significant differences were found in the BPI, except for ciprofloxacin. Ciprofloxacin-resistant strains presented a lower BPI than susceptible strains (12.94 [6.58-19.37] vs 19.38 [9.73-20.00], respectively, p = 0.039) (Figure 3).
Table 2
| 5h (n=69) | 24h (n=29) | ||||
|---|---|---|---|---|---|
| Phenotype | |||||
| Mucoid | Non-Mucoid | Mucoid | Non-Mucoid | ||
| Biofilm production | Weak | 8 (24.2%) | 2 (5.6%) | 0 (0%) | 1 (11.1%) |
| Moderate | 6 (18.2%) | 6 (16.2%) | 0 (0%) | 1 (11.1%) | |
| Strong | 7 (21.2%) | 3 (8.3%) | 3 (15.0%) | 2 (22.2%) | |
| Very strong | 12(36.4%) | 25(69.4%) | 17 (85.0%) | 5 (55.6%) | |
Categorical stratification of the BPI among mucoid and non-mucoid Pseudomonas aeruginosa strains.
Figure 3
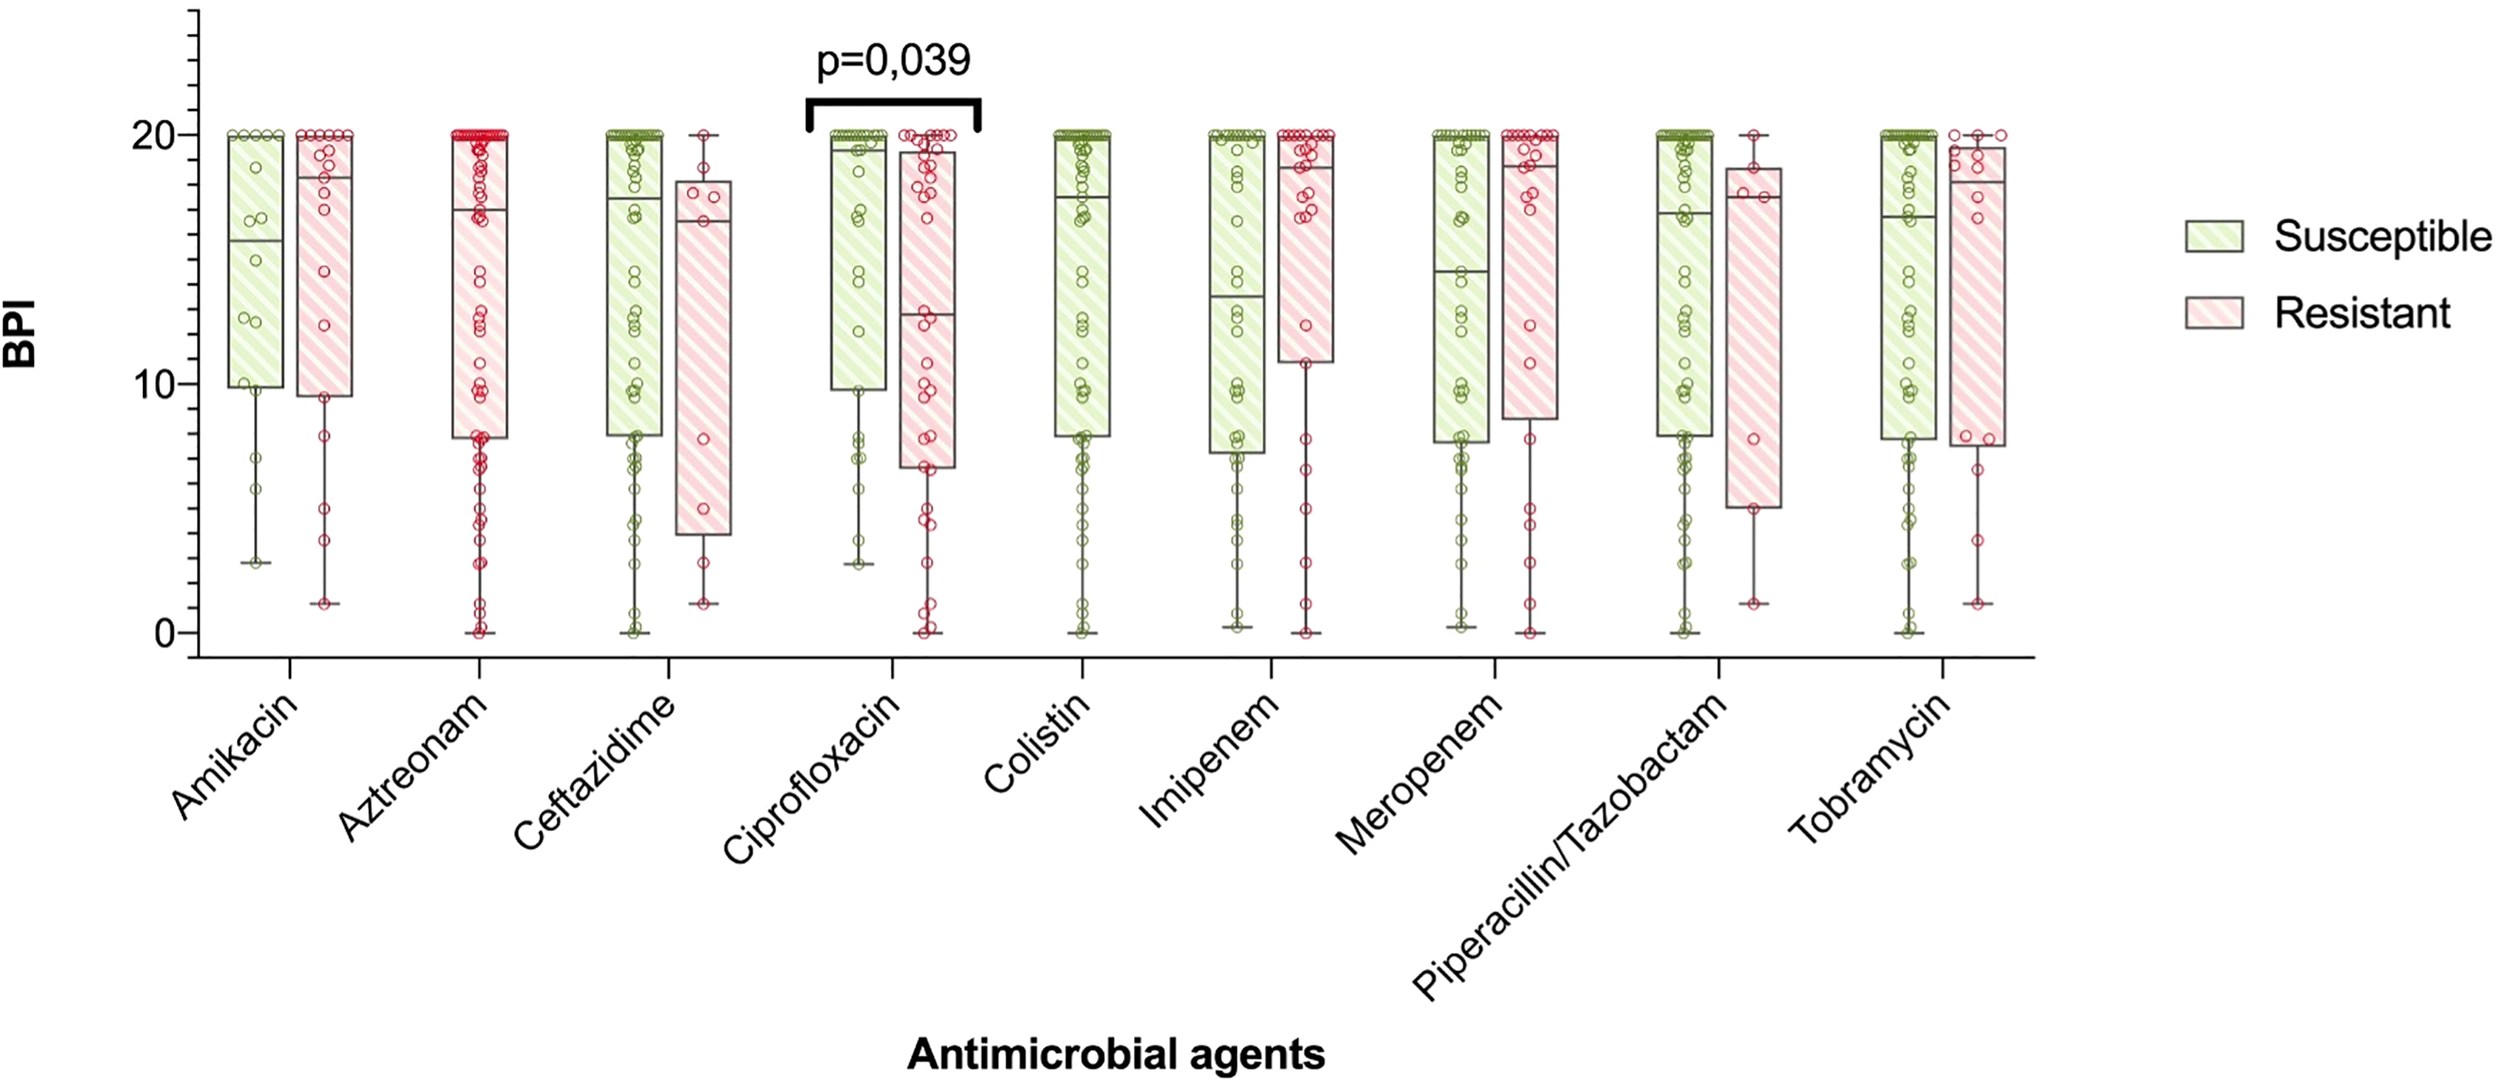
BPI in accordance to antibiotic resistance. The boxplot represents median and interquartile ratio, whiskers represent minimum and maximum values. Differences in the BPI in accordance to antibiotic resistance pattern where only statistically significant comparing ciprofloxacin resistant vs. susceptible PA (12,94 [6,58-19,37] vs. 19,38 [9,73-20,00], p=0.039, respectively).
Although a trend of an increased BPI was found in the PA isolates from intermittently colonized patients compared to those from chronically infected patients, this was not statistically significant (15.27 ± 1.21 vs 13.24 ± 1.00, respectively, p = 0.20). PA isolates from patients with BE and from those with BE-COPD did not differ in their BPI (13.47 ± 1.076 vs 14.55 ± 1.09, respectively, p = 0.49). No differences were found in the categorical stratification of the BPI when comparing the chronicity of infection (intermittent vs chronic PA infection), resistance pattern (MDR or XDR vs non-MDR) or the underlying respiratory disease (BE or BE-COPD).
3.4 MucA mutations
Out of the 67 PA strains tested, 13 had mutations in the mucA gene (mutant mucA), whilst 54 did not (wild-type mucA). The BPI at 5 h of the mutants was lower compared to the wild-type PA strains (7.61 [1.98-19.27] vs 17.79 [9.94-20], respectively, p = 0.028) (Figure 4). In contrast, at 24 h, differences were not statistically significant between the mutants vs. the wild type BPI (20.00 [18.80-20.00] vs 18.64 [15.79-19.59], respectively, p = 0.051).
Figure 4
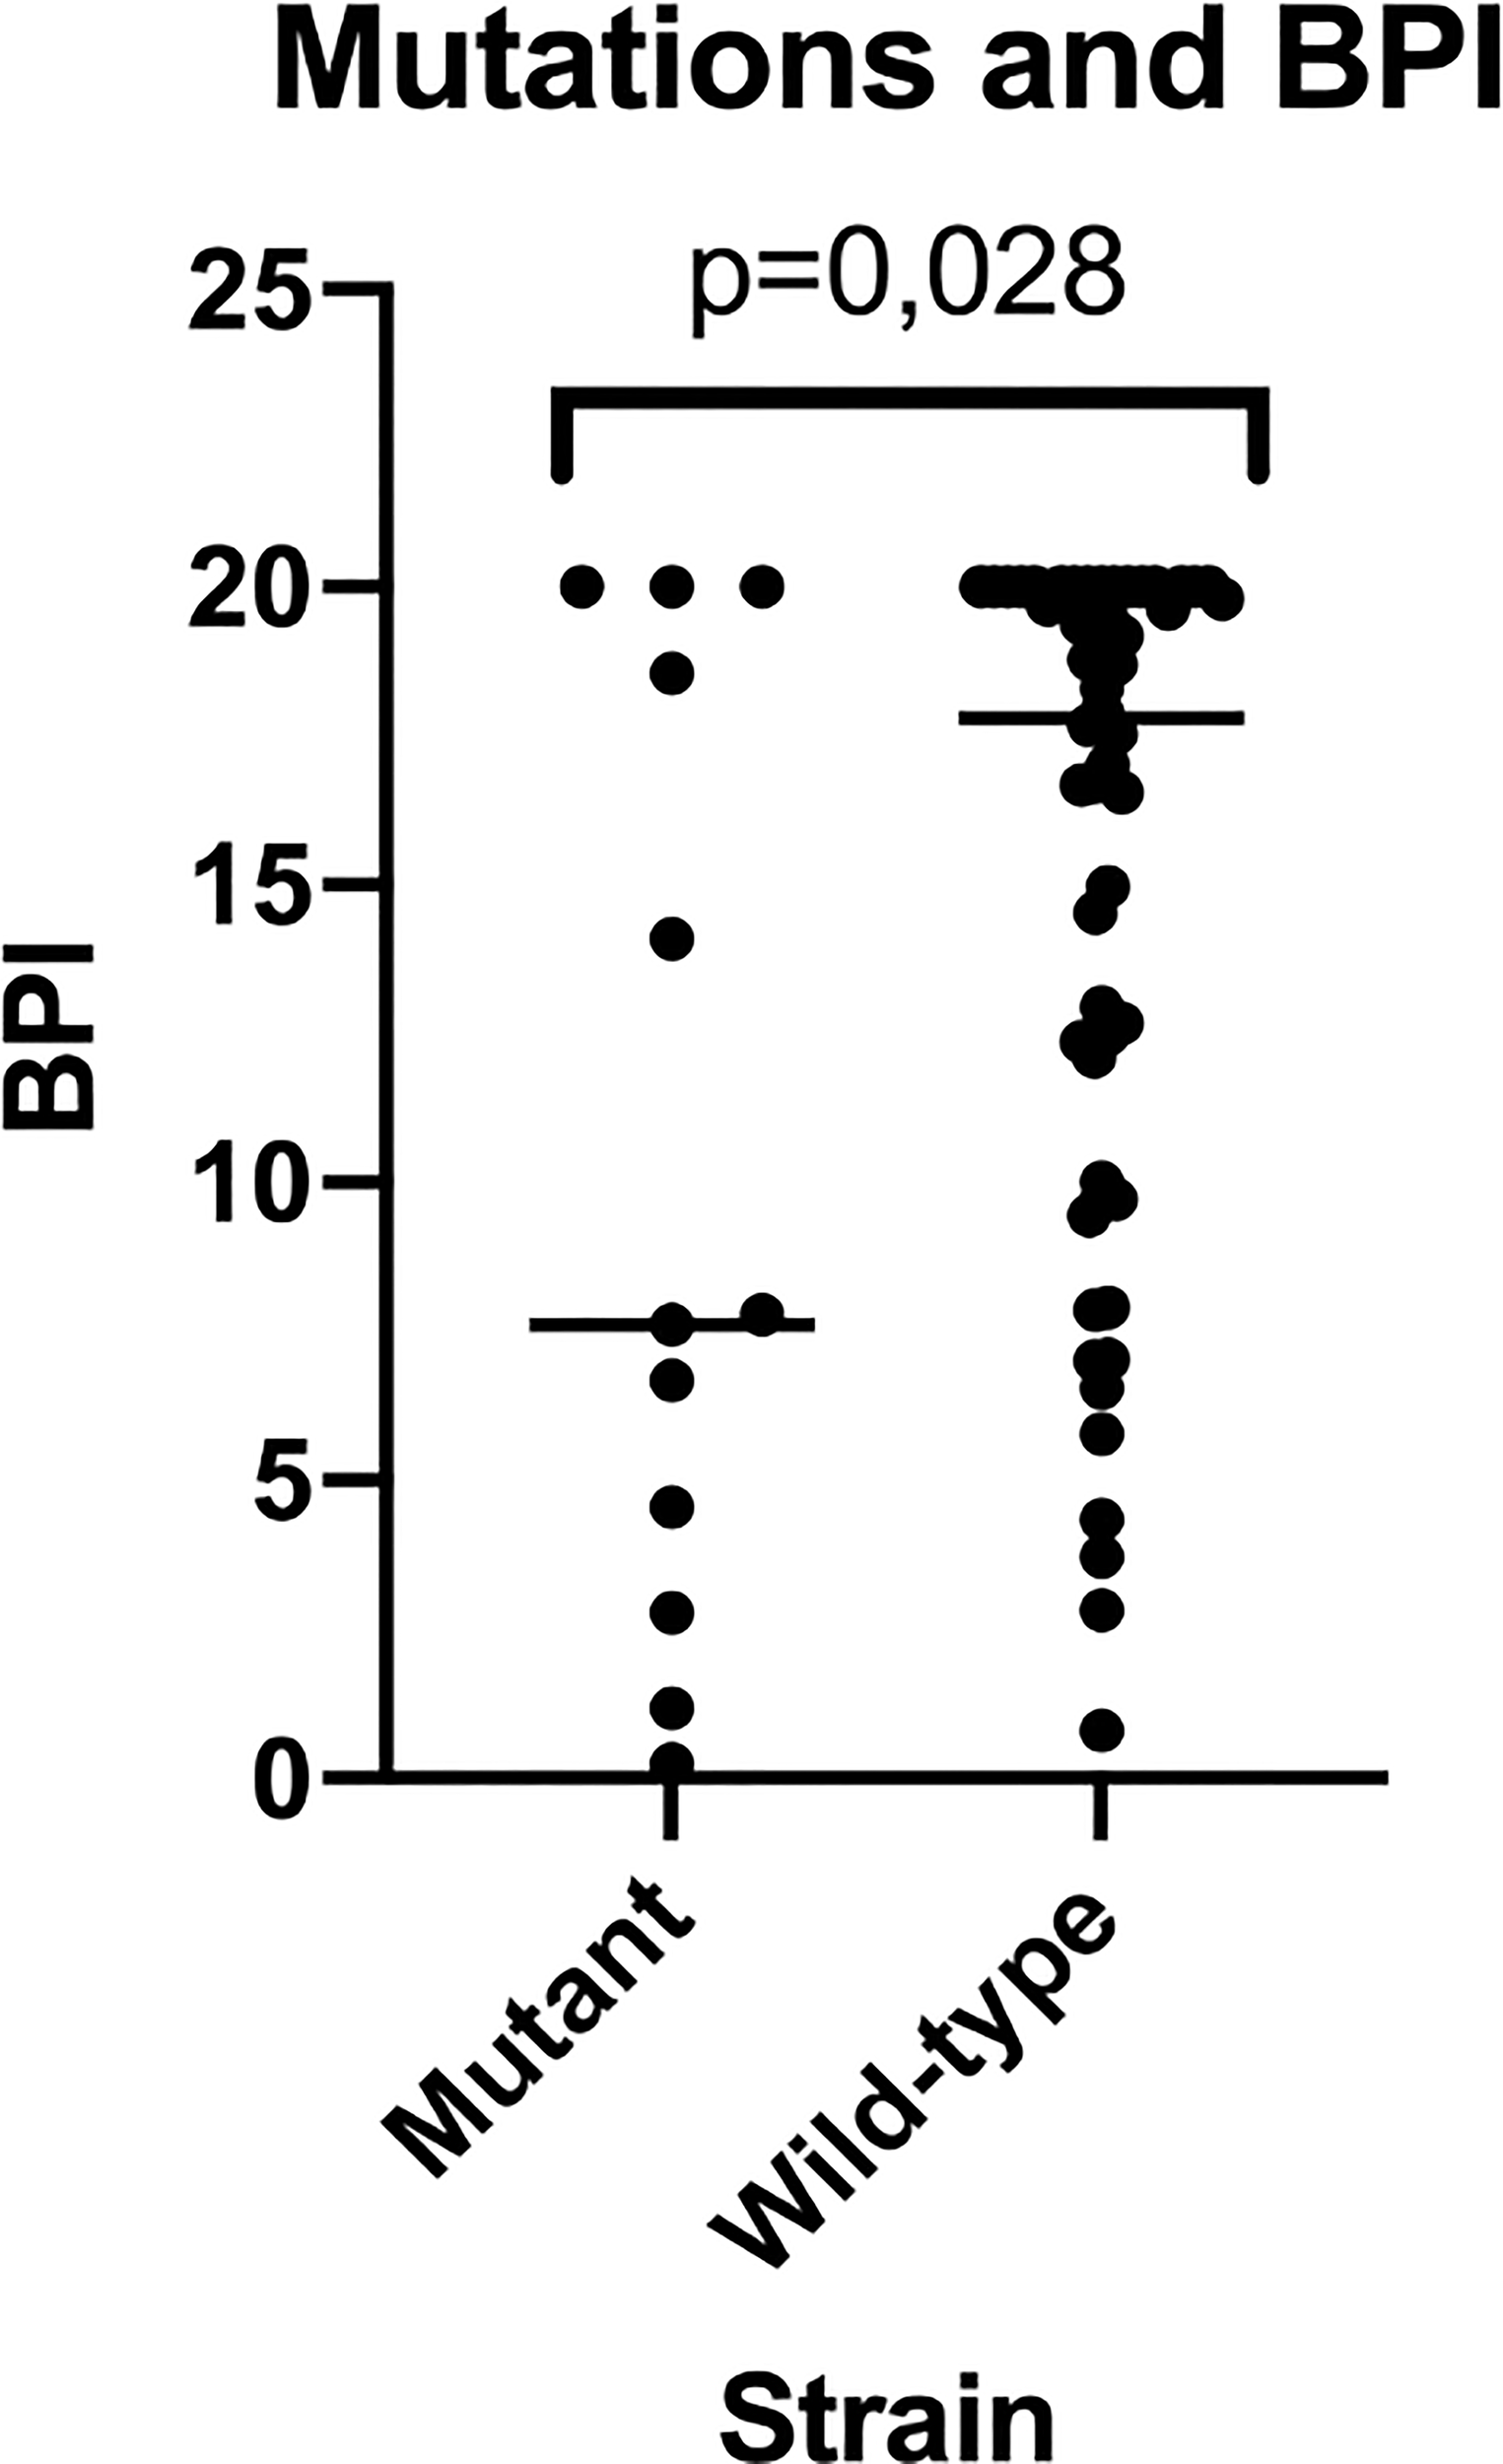
BPI of mutant vs wild-type strains for mucA gene. This figure shows how mutant strains present a reduced BPI when compared to wild-type strains being this last population much more heterogeneous in BPI testing results.
Interestingly, 50% of the strains that showed slow growth (BPI differed at 5 h vs 24 h) presented mutations in the mucA gene, whilst all the non-slow-growing strains had the wild-type mucA gene (p = 0.005). Wild-type strains presented an increased proportion of resistance compared to the mucA mutant strains (87.9% vs 12.1%, respectively, p = 0.05). In particular, amikacin resistance was higher in the wild-type strains than in the mutant PA strains (84.2% vs 15.8%, p = 0.032).
No differences were found in the distribution of the mucoids vs non-mucoids in mutant and wild-type PA strains, BE vs BE-COPD, intermittent vs chronic PA colonization or the 3 categories of Gram.
3.5 Ciprofloxacin resistance mechanism
Twenty four out of 43 (56%) PA isolates did not present any mutation on QRDR genes and they were quinolone susceptible as confirmed by disc diffusion (group 0). Five out of 43 (12%) presented <3 mutations on QRDR genes (group 1) and they were quinolone resistant as confirmed by disc diffusion with and an average MIC of 9 mg/L. Finally, 14 out of 43 (33%) presented ≥3 mutations on QRDR genes (group 2) and they were quinolone resistant as confirmed by disc diffusion and with an average MIC of 20-32mg/L. Comparing those strains of group 0, group 1 and group 2 we observed that the group 2 ones had the lowest BPI (17.64 [7.68-2.00], 12.67 [10.91-20.00] and 8.20 [3.45-13.88], p=0.030, respectively). Pairwise comparisons found significantly lower BPI in group 2 compared with group 0 (p=0.012) without any other statistically significant differences.
3.6 Predictive performance of BPI compared to phenotype or resistance to ciprofloxacin
Following Youden’s index methodology, we selected 14.75 as the optimal cut-off point for BPI to predict the PA phenotype (<14.75 = Mucoid, ≥14.75 = Non-mucoid; sensitivity, specificity, positive and negative predictive values were 64% [95% CI 46% to 82%], 72% [95% CI 56% to 88%], 68% [95% CI 50% to 86%], and 68% [95% CI 52% to 85%], respectively), and 19.28 as the optimal cut-off point for BPI in relation to resistance to ciprofloxacin (<19.28 = Ciprofloxacin resistant, ≥19.28 = Ciprofloxacin susceptible; sensitivity, specificity, positive and negative predictive values were 75% [95% CI 59% to 91%], 52% [95% CI 32% to 71%], 64% [95% CI 49% to 80%], and 64% [95% CI 43% to 85%], respectively) (Figure 5).
Figure 5
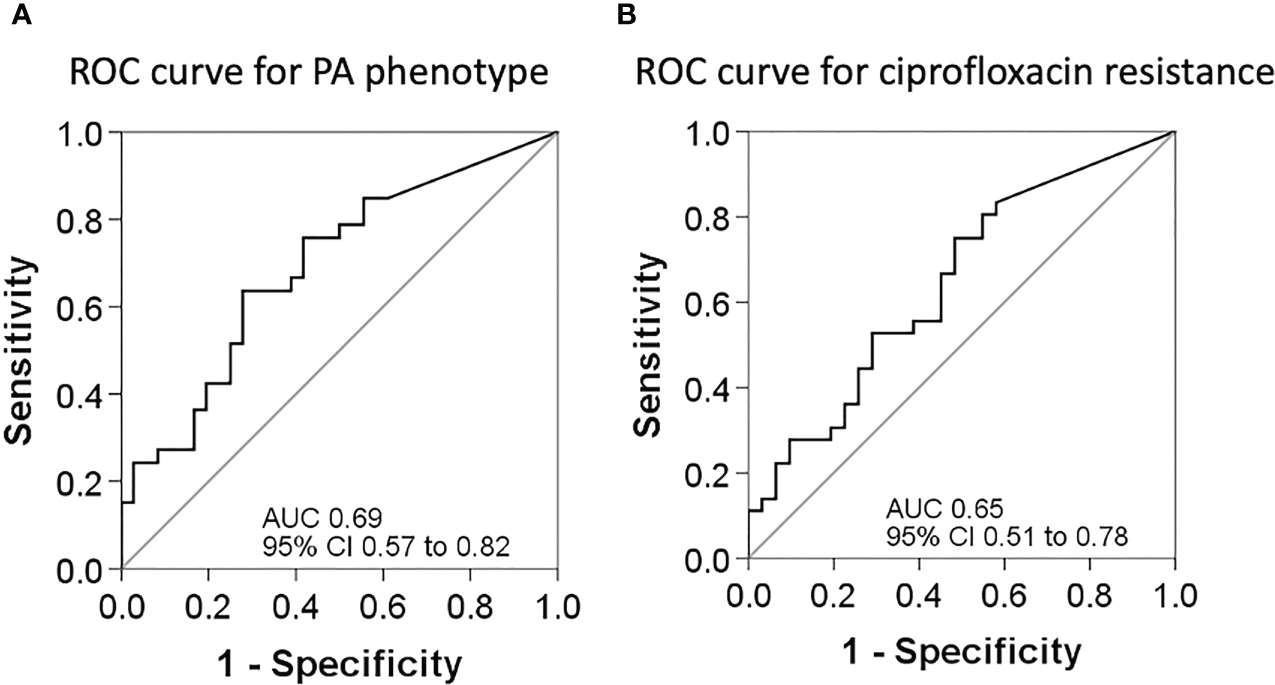
ROC curves for sensitivity and specificity. (A) ROC curve to assess the best cut-off point of the BPI for PA phenotype determination. (B) ROC curve to assess the best cut-off point of the BPI for PA resistance to ciprofloxacin.
4 Discussion
To the best of our knowledge, this is the first study that validates BioFilm Ring Test® (BRT) in a significant number of PA strains from patients with bronchiectasis and which describes BioFilm production Index (BPI) associations with microbiology and clinical outcomes. We found that at 5h of incubation, non-mucoid PA and ciprofloxacin susceptible showed higher BPI than mucoid and ciprofloxacin resistant PA strains, respectively; We suggested a new application of BRT using BPI cut off points to predict the mucoid (<14.75) or Ciprofloxacin resistant (<19.28) phenotype, two outcomes of clinical interest in the context of chronic respiratory diseases. In addition, the presence of alginate in Gram images was associated with the mucoid phenotype, non-MDR PA strains and with the chronic respiratory infection status of the patient. Considering the current lack of routine methods in hospital settings to diagnose biofilm and their clinical implications, this translational approach reveals new diagnostic applications for BRT.
Biofilm formation is a dynamic process that occurs in the first phase, when strains switch from the planktonic to a sessile mode of growth in which they increase their production of adhesins (Youden, 1950), grow in aggregates and are regulated by quorum-sensing signaling pathways (Berne et al., 2015). Biofilm maturation in human PA infections involves the overproduction of extracellular matrix, which is carried out by mucoid strains, and a sustained lethargic metabolism (Figure 6). We found that mucoid PA strains, associated with mature biofilms, presented a lower BPI compared to non-mucoid strains at 5 h. However, when the BRT was extended to 24 h, all the mucoid strains exhibited the highest BPI score, indicating that the performance of the mucoid PA strains in the BRT was influenced by the downregulated metabolism of the mucoid phenotype, which needed extra time to reveal their true BPI. Further analyses demonstrated that a BPI < 14.75 predicted the mucoid phenotype with 64% sensitivity and 72% specificity at 5 h. Such values could be, hopefully, improved with a greater sample size.
Figure 6
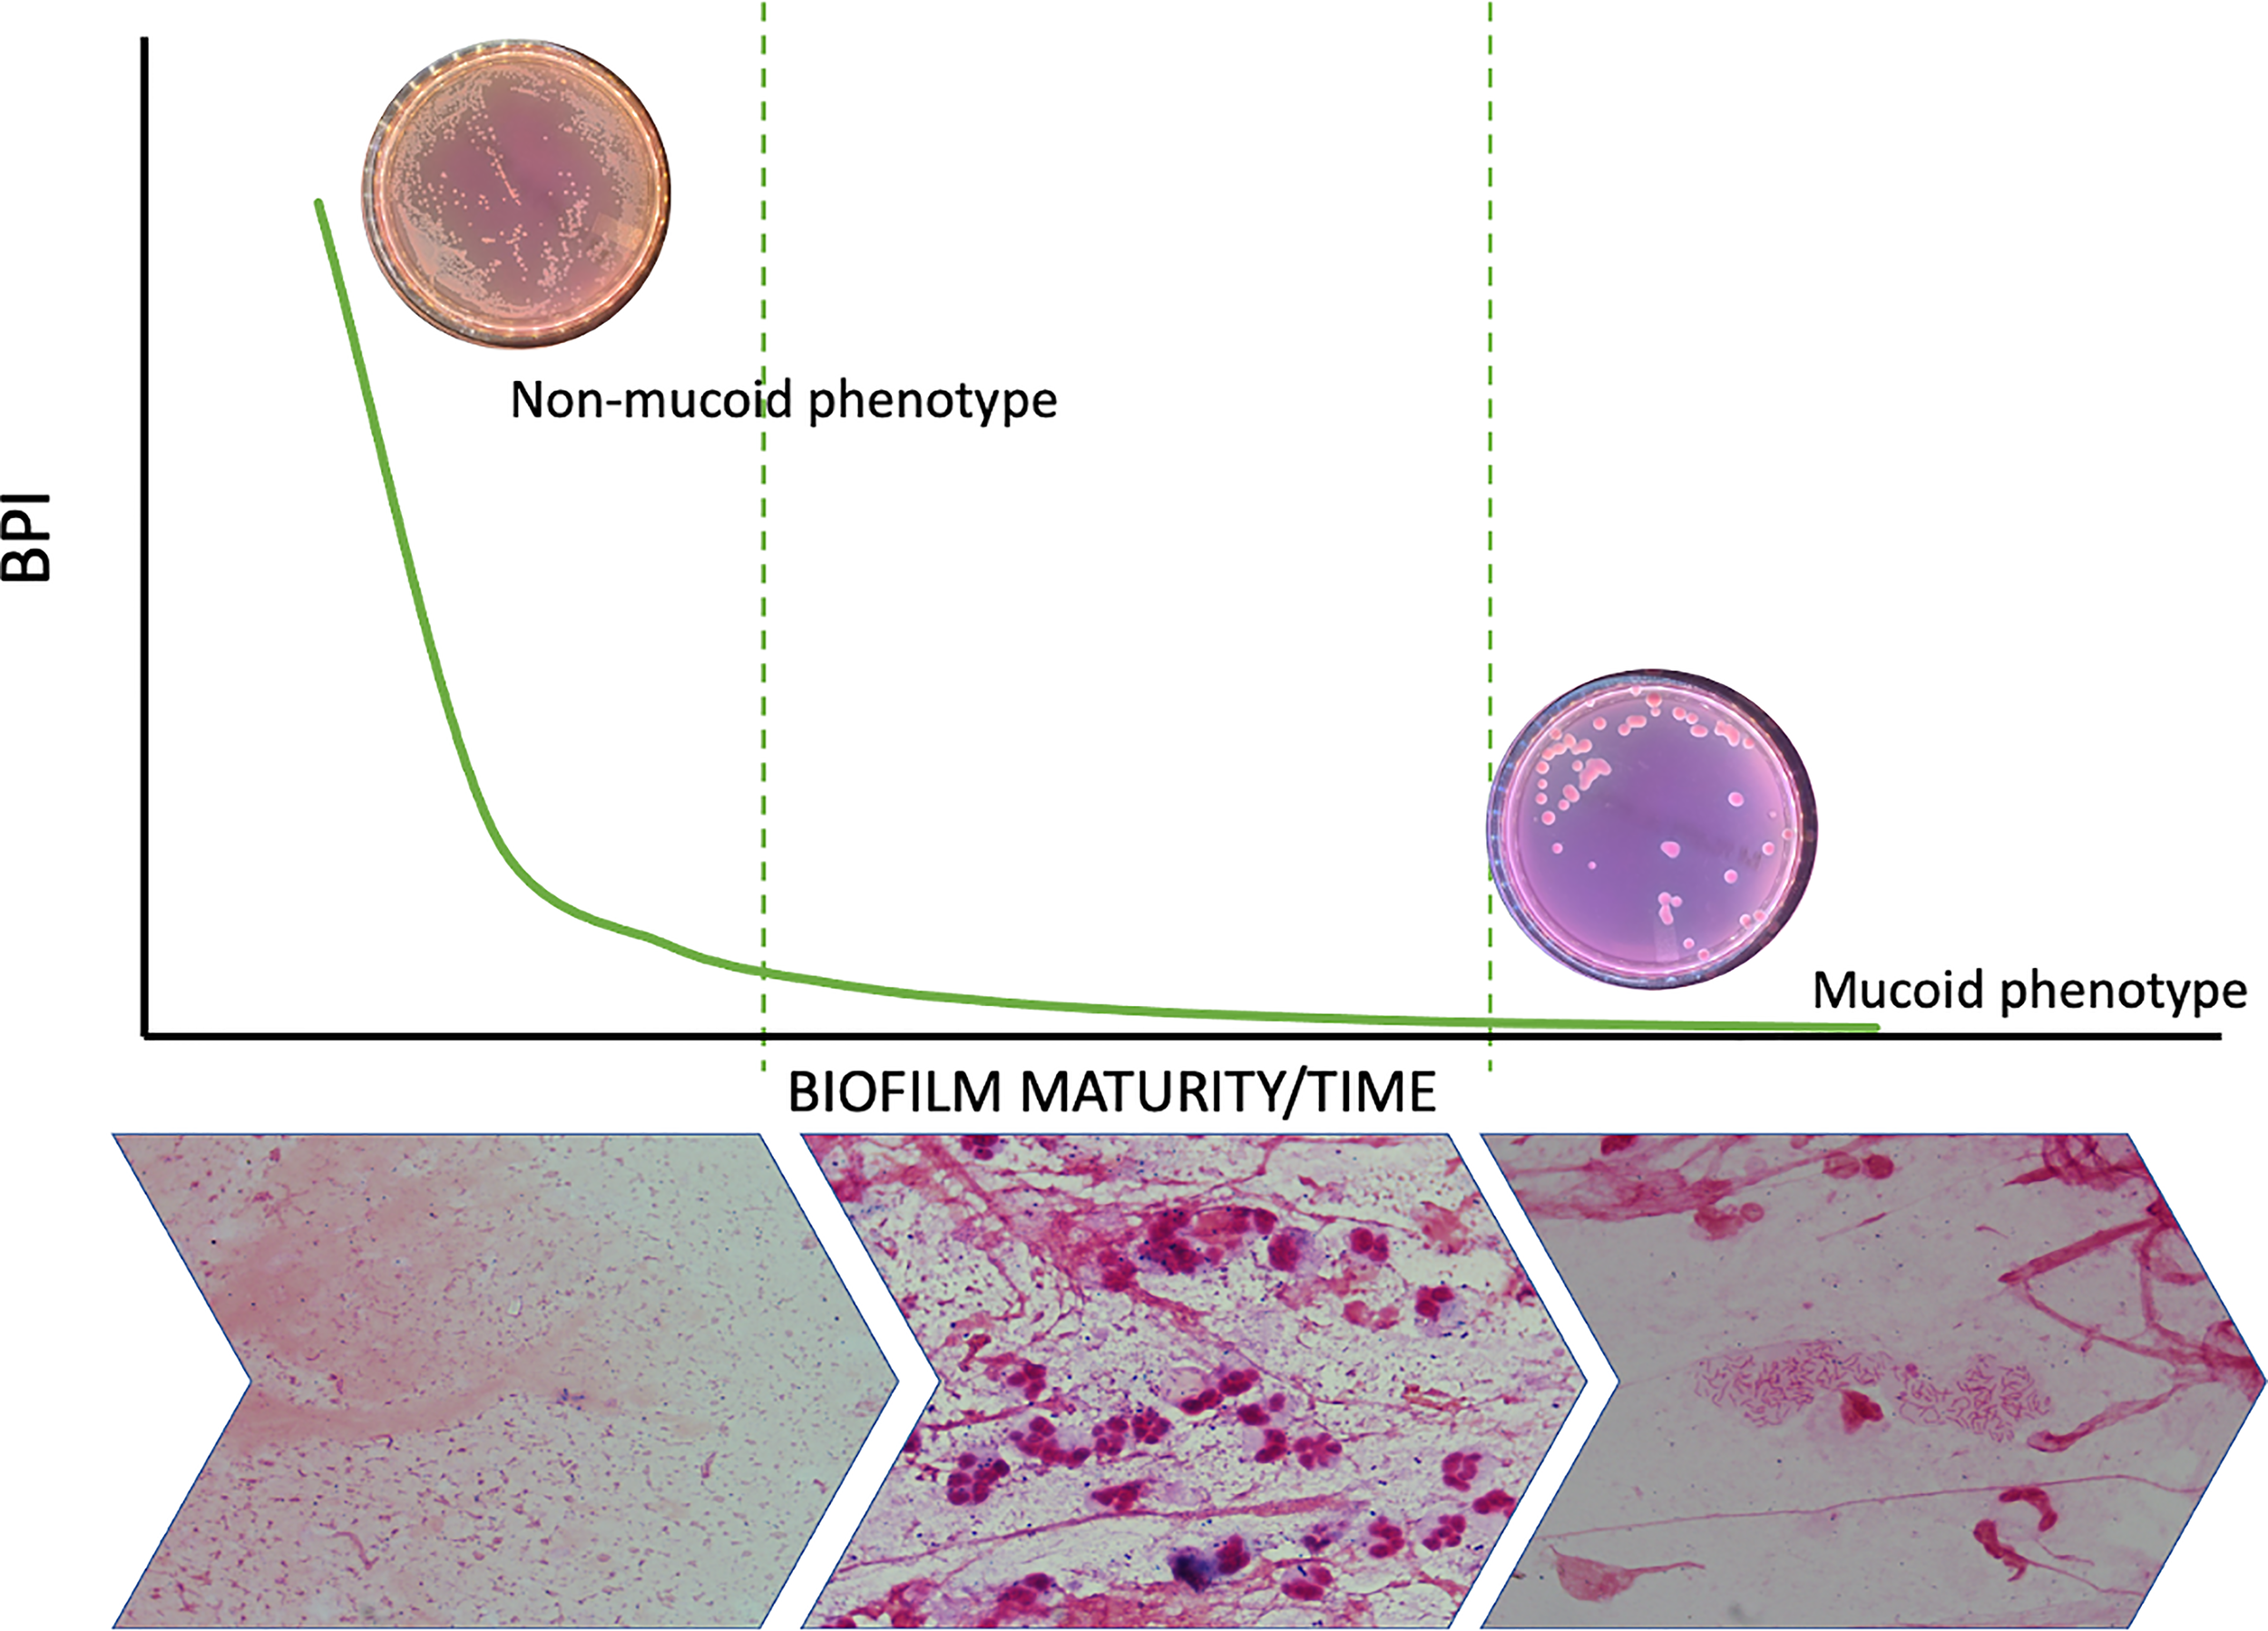
Biofilm dynamic during time and phenotype switch. The figure shows how the metabolic ratio of PA decreases whilst phenotype switches from a non-mucoid state to a mucoid phenotype and at the same time PA starts growing in biofilms instead of being found in planktonic state.
Interestingly, despite no differences were found for other antibiotics, ciprofloxacin resistant PA presented lower BPI than susceptible strains as it has already been seen in E. coli for extensive spectrum beta lactamase (Mukherjee and Bassler, 2019). This is important since ciprofloxacin is the first recommended treatment for Pseudomonas aeruginosa eradication in bronchiectasis patients (Polverino et al., 2017). In spite of this, the mucoid PA has been previously linked to a more susceptible antimicrobial profile compared to the non-mucoid (Batoni et al., 2019). Here we found that PA isolates with more than 3 mutations on QRDR genes were those exhibiting the lowest BPI. Based on our data, the observed correlation between decreased BPI and ciprofloxacin resistance can be explained by an increase in the number of mutations in QRDR and the fitness-cost associated to these mutations. Strains exposed to high levels of environmental stress are more likely to undergo mutations in QRDR, particularly when their metabolism is downregulated. This downregulation could account for the observed link between quinolone resistance and decreased BPI at the 5-hour time point. Further investigation into the use of BRT to predict ciprofloxacin resistance is warranted, given that the traditional method requires a turnaround time of at least 48 hours, whereas BRT can provide results in as little as 5 hours. Recent research has shown that subinhibitory concentrations of β-lactams can induce the BioFilm index (Fernández-Barat et al., 2017), highlighting the potential of BRT as a promising diagnostic tool for Pseudomonas respiratory infections
Herein, we describe for the first time the association between mutations in mucA gene and BPI performance. Interestingly, our results are in accordance to what was observed for the mucoid phenotype. As mucoids, the 13 mutant PA presented a time dependent increase in BPI at 5 h to 24h. In contrast, wild type PA, as well as non-mucoid, presented a less time dependent BPI. In addition, we confirmed slow growth was associated with mucA mutations.
The lack of differences found in the BPI of patients with BE-COPD and BE is attributed to the fact that mucoid and non-mucoid were similarly distributed between BE-COPD and BE alone. Our findings are in line with previous reports indicating that the presence of BE does not influence mortality in long-term follow-up hospitalized COPD exacerbations (Olivares et al., 2020). Thus, the underlying respiratory disease may not have such a relevant role on PA phenotype and biofilm production which rather responds to the stage of chronic infection.
A limitation of this study was the variability in metabolic rates between PA strains, with some strains growing faster than others. To overcome this limitation, we assessed BRT at two different time points. It is also important to note that while we tested the BRT for PA, as it is the most common pathogen in our population, this test could also be applied to other biofilm producing microorganisms.
5 Conclusions
The BioFilm Ring Test® (BRT) is a promising technology that can be integrated into clinical practice due to its ability to rapidly assess the biofilm-forming capabilities of microorganisms within just 5 hours. While further validation is needed to assess its predictive value for the mucoid phenotype and the ciprofloxacin resistance, the BRT has the potential to shed light on biofilms that are currently underestimated in antimicrobial stewardship efforts.
Statements
Data availability statement
The original contributions presented in the study are included in the article/Supplementary Material. Further inquiries can be directed to the corresponding authors.
Ethics statement
The studies involving human participants were reviewed and approved by the Internal Review Board of the Hospital Clinic of Barcelona (registry number HCB/0236). Written informed consent was obtained from all patients.
Author contributions
LF-B and NV designed and performed the experimental work, analyzed the results and wrote the manuscript. AT, RA, AP, AC, VA, LB-F and PO contributed to the clinical follow-up and sample collection of BE patients. RL-A and RC did the genetic analysis on mucA. AM and AG assisted on the statistics and figure design. LM and JV assisted on the PA confirmation by MALDI and CP and TB assisted in the BPI technology and biofilm data collection. All authors reviewed the present manuscript before publication.
Funding
CB 06/06/0028/CIBER de enfermedades respiratorias- Ciberes, Intramural ciberes 2018 (ES18PI01X1-2021), ISCIII-FEDER (FIS18-PI18/00145 awarded to AT and LF-B; FI19/00090 awarded to RL-A), ICREA Academy/Institució Catalana de Recerca i Estudis Avançats, 2.603/IDIBAPS, SGR/Generalitat de Catalunya, SEPAR 2017, 2018 grants to LF-B. Funders did not play any role in paper design, data collection, data analysis, interpretation, writing of the paper.
Acknowledgments
We would like to thank the advanced microscopy service from the Scientific and Technological Centers of the University of Barcelona for the microscopy equipment.
Conflict of interest
AT has received grants from MedImmune, Cubist, Bayer, Theravance, and Polyphor and personal fees as Advisory Board member from Bayer, Roche, The Medicines CO, and Curetis. He has received bureau fees for keynote speaker presentations from GSK, Pfizer, Astra Zeneca, and Biotest Advisory Board, and are unconnected to the study submitted here. TB and CP were employed by BioFilm Pharma SAS and BioFilm Control SAS.
The remaining authors declare that the research was conducted in the absence of any commercial or financial relationships that could be construed as a potential conflict of interest.
Publisher’s note
All claims expressed in this article are solely those of the authors and do not necessarily represent those of their affiliated organizations, or those of the publisher, the editors and the reviewers. Any product that may be evaluated in this article, or claim that may be made by its manufacturer, is not guaranteed or endorsed by the publisher.
Supplementary material
The Supplementary Material for this article can be found online at: https://www.frontiersin.org/articles/10.3389/fcimb.2023.1142274/full#supplementary-material
References
1
Alcaraz-Serrano V. Fernández-Barat L. Scioscia G. Llorens-Llacuna J. Gimeno-Santos E. Herrero-Cortina B. et al . (2019). Mucoid pseudomonas aeruginosa alters sputum viscoelasticity in patients with non-cystic fibrosis bronchiectasis. Respir. Med.154, 40–46. doi: 10.1016/j.rmed.2019.06.012
2
Barker A. F. (2002). Bronchiectasis. N Engl. J. Med.346 (18), 1383–1393. doi: 10.1056/NEJMra012519
3
Berne C. Ducret A. Hardy G. G. Brun Y. V. (2015). Adhesins Involved in Attachment to Abiotic Surfaces by Gram-Negative Bacteria. In Microbial Biofilms (eds GhannoumM.ParsekM.WhiteleyM.MukherjeeP. K.). doi: 10.1128/9781555817466.ch9
4
Cabrera R. Fernández-Barat L. Vázquez N. Alcaraz-Serrano V. Bueno-Freire L. Amaro R. et al . (2022). Resistance mechanisms and molecular epidemiology of pseudomonas aeruginosa strains from patients with bronchiectasis. J. antimicrobial chemotherapy77 (6), 1600–1610. doi: 10.1093/jac/dkac084
5
Chandrasekaran R. Mac Aogáin M. Chalmers J. D. Elborn S. J. Chotirmall S. H. (2018). Geographic variation in the aetiology, epidemiology and microbiology of bronchiectasis. BMC Pulmonary Med.18. doi: 10.1186/s12890-018-0638-0
6
Chavant P. Gaillard-Martinie B. Talon R. Hébraud M. Bernardi T. (2007). A new device for rapid evaluation of biofilm formation potential by bacteria. J. Microbiol. Methods68 (3), 605–612. doi: 10.1016/j.mimet.2006.11.010
7
Ciofu O. Mandsberg L. F. Bjarnsholt T. Wassermann T. Høiby N. (2010). Genetic adaptation of pseudomonas aeruginosa during chronic lung infection of patients with cystic fibrosis: strong and weak mutators with heterogeneous genetic backgrounds emerge in mucA and/or lasR mutants. Microbiology156 (4), 1108–1119. doi: 10.1099/mic.0.033993-0
8
Ciofu O. Rojo-Molinero E. Macià M. D. Oliver A. (2017). Antibiotic treatment of biofilm infections. Apmis125. doi: 10.1111/apm.12673
9
Cohen M. Sahn S. A. (1999). Bronchiectasis in systemic diseases. Chest.116 (4), 1063–1074. doi: 10.1378/chest.116.4.1063
10
Crisafulli E. Guerrero M. Ielpo A. Ceccato A. Huerta A. Gabarrús A. et al . (2018). Impact of bronchiectasis on outcomes of hospitalized patients with acute exacerbation of chronic obstructive pulmonary disease: a propensity matched analysis. Sci. Rep.8 (1), 1–12. doi: 10.1038/s41598-018-27680-y
11
Dhand R. (2018). The rationale and evidence for use of inhaled antibiotics to control pseudomonas aeruginosa infection in non-cystic fibrosis bronchiectasis. J. Aerosol Med. Pulmonary Drug Delivery31. doi: 10.1089/jamp.2017.1415
12
Di Domenico E. G. Toma L. Provot C. Ascenzioni F. Sperduti I. Prignano G. et al . (2016). Development of an in vitro assay, based on the biofilm ring test®, for rapid profiling of biofilm-growing bacteria. Front. Microbiol.7, 1429. doi: 10.3389/fmicb.2016.01429
13
Fernández-Barat L. Alcaraz-Serrano V. Amaro R. Torres A. (2021). Pseudomonas aeruginosa in bronchiectasis. Semin. Respir. Crit. Care Med.42 (4), 587–594. doi: 10.1055/s-0041-1730921
14
Fernández-Barat L. Ben-Aicha S. Motos A. Vila J. Marco F. Rigol M. et al . (2018). Assessment of in vivo versus in vitro biofilm formation of clinical methicillin-resistant staphylococcus aureus isolates from endotracheal tubes. Sci. Rep.8 (1), 11906. doi: 10.1038/s41598-018-30494-7
15
Fernández-Barat L. Ciofu O. Kragh K. N. Pressler T. Johansen U. Motos A. et al . (2017). Phenotypic shift in pseudomonas aeruginosa populations from cystic fibrosis lungs after 2-week antipseudomonal treatment. J. Cyst Fibros16 (2), 222–229. doi: 10.1016/j.jcf.2016.08.005
16
Finch S. McDonnell M. J. Abo-Leyah H. Aliberti S. Chalmers J. D. (2015). A comprehensive analysis of the impact of pseudomonas aeruginosa colonization on prognosis in adult bronchiectasis. Ann. Am. Thorac. Soc.12 (11), 1602–1611. doi: 10.1513/AnnalsATS.201506-333OC
17
Flament-Simon S. C. Duprilot M. Mayer N. García V. Alonso M. P. Blanco J. et al . (2019). Association between kinetics of early biofilm formation and clonal lineage in escherichia coli. Frontiers in microbiology10, 1183. doi: 10.3389/fmicb.2019.01183
18
Flume P. A. Chalmers J. D. Olivier K. N. (2018). Advances in bronchiectasis: endotyping, genetics, microbiome, and disease heterogeneity. Lancet Lancet Publishing Group;392, 880–890. doi: 10.1016/S0140-6736(18)31767-7
19
Hill A. T. Haworth C. S. Aliberti S. Barker A. Blasi F. Boersma W. et al . (2017). Pulmonary exacerbation in adults with bronchiectasis: a consensus definition for clinical research. Eur. Respir. J.49 (6). doi: 10.1183/13993003.00051-2017
20
King P. T. Holdsworth S. R. Freezer N. J. Villanueva E. Holmes P. W. (2006). Characterisation of the onset and presenting clinical features of adult bronchiectasis. Respir. Med.100 (12), 2183–2189. doi: 10.1016/j.rmed.2006.03.012
21
Lewis K. (2007). Persister cells, dormancy and infectious disease. Nat. Rev. Microbiol.5 (1), 48–56. doi: 10.1038/nrmicro1557
22
Magiorakos A. P. Srinivasan A. Carey R. B. Carmeli Y. Falagas M. E. Giske C. G. et al . (2012). Multidrug-resistant, extensively drug-resistant and pandrug-resistant bacteria: an international expert proposal for interim standard definitions for acquired resistance. Clin. Microbiol. Infect.18 (3), 268–281. doi: 10.1111/j.1469-0691.2011.03570.x
23
Malhotra S. Limoli D. H. English A. E. Parsek M. R. Wozniak D. J. (2018). Mixed communities of mucoid and nonmucoid pseudomonas aeruginosa exhibit enhanced resistance to host antimicrobials. MBio9 (2). doi: 10.1128/mBio
24
Mukherjee S. Bassler B. L. (2019). Bacterial quorum sensing in complex and dynamically changing environments. Nat. Rev. Microbiol.17 (6), 371–382. doi: 10.1038/s41579-019-0186-5
25
Murray P. R. Washington J. A. (1975). Microscopic and baceriologic analysis of expectorated sputum. Mayo Clin. Proc.50 (6), 339–344.
26
Olivares E. Badel-Berchoux S. Provot C. Jaulhac B. Prévost G. Bernardi T. et al . (2016). The BioFilm ring test: a rapid method for routine analysis of pseudomonas aeruginosa biofilm formation kinetics. J. Clin. Microbiol.54 (3), 657–661. doi: 10.1128/JCM.02938-15
27
Olivares E. Tasse J. Badel-Berchoux S. Provot C. Prévost G. Bernardi T. (2020). Clinical biofilm ring test® reveals the potential role of β-lactams in the induction of biofilm formation by p. aeruginosa in cystic fibrosis patients. Pathogens9 (12), 1065. doi: 10.3390/pathogens9121065
28
Pantanella F. Valenti P. Natalizi T. Passeri D. Berlutti F. (2013). Analytical techniques to study microbial biofilm on abiotic surfaces: pros and cons of the main techniques currently in use. Ann. Ig25 (1), 31–42. doi: 10.7416/ai.2013.1904
29
Peeters E. Nelis H. J. Coenye T. (2008). Comparison of multiple methods for quantification of microbial biofilms grown in microtiter plates. J. Microbiol. Methods72 (2), 157–165. doi: 10.1016/j.mimet.2007.11.010
30
Polverino E. Goeminne P. C. McDonnell M. J. Aliberti S. Marshall S. E. Loebinger M. R. et al . (2017). European Respiratory society guidelines for the management of adult bronchiectasis. Eur. Respir. J.50 (3), 1700629. doi: 10.1183/13993003.00629-2017
31
Sulaeman S. Le Bihan G. Rossero A. Federighi M. Dé E. Tresse O. (2010). Comparison between the biofilm initiation of campylobacter jejuni and campylobacter coli strains to an inert surface using BioFilm ring test®. J. Appl. Microbiol.108 (4), 1303–1312. doi: 10.1111/j.1365-2672.2009.04534.x
32
Thieme L. Hartung A. Tramm K. Klinger-Strobel M. Jandt K. D. Makarewicz O. et al . (2019). MBEC versus MBIC: the lack of differentiation between biofilm reducing and inhibitory effects as a current problem in biofilm methodology. Biol. Proced Online21 (1). doi: 10.1186/s12575-019-0106-0
33
Vogelmeier C. F. Criner G. J. Martinez F. J. Anzueto A. Barnes P. J. Bourbeau J. et al . (2017). Global strategy for the diagnosis, management, and prevention of chronic obstructive lung disease 2017 report. Am. J. Respir. Crit. Care Med.195 (5), 557–582. doi: 10.1164/rccm.201701-0218PP
34
Hengzhuang W. Wu H. Ciofu O. Song Z. Høiby N. (2011). Pharmacokinetics/pharmacodynamics of colistin and imipenem on mucoid and nonmucoid Pseudomonas aeruginosa biofilms. Antimicrob. Agents Chemother.55 (9), 4469–4474. doi: 10.1128/AAC.00126-11
35
Yang L. Haagensen J. A. J. Jelsbak L. Johansen H. K. Sternberg C. Høiby N. et al . (2008). In situ Growth rates and biofilm development of pseudomonas aeruginosa populations in chronic lung infections. J. Bacteriol190 (8), 2767–2776. doi: 10.1128/JB.01581-07
36
Youden W. J. (1950). Index for rating diagnostic tests. Cancer3 (1), 32–35. doi: 10.1002/1097-0142(1950)3:1<32::AID-CNCR2820030106>3.0.CO;2-3
Summary
Keywords
Pseudomonas aeruginosa , antimicrobial agents, antimicrobial resistances, biofilm diagnose, biofilm
Citation
Fernández-Barat L, Vázquez Burgos N, Alcaraz V, Bueno-Freire L, López-Aladid R, Cabrera R, Gabarrús A, Palomeque A, Oscanoa P, Ceccato A, Motos A, Amaro R, Bernardi T, Provot C, Soler-Comas A, Muñoz L, Vila J and Torres A (2023) The value of biofilm testing to guide antimicrobial stewardship in chronic respiratory diseases. Front. Cell. Infect. Microbiol. 13:1142274. doi: 10.3389/fcimb.2023.1142274
Received
11 January 2023
Accepted
04 April 2023
Published
02 May 2023
Volume
13 - 2023
Edited by
Ashraf Zarkan, University of Cambridge, United Kingdom
Reviewed by
Roberto Rusconi, Humanitas University, Italy; María Guembe, Gregorio Marañón Hospital, Spain; Oana Ciofu, University of Copenhagen, Denmark
Updates
Copyright
© 2023 Fernández-Barat, Vázquez Burgos, Alcaraz, Bueno-Freire, López-Aladid, Cabrera, Gabarrús, Palomeque, Oscanoa, Ceccato, Motos, Amaro, Bernardi, Provot, Soler-Comas, Muñoz, Vila and Torres.
This is an open-access article distributed under the terms of the Creative Commons Attribution License (CC BY). The use, distribution or reproduction in other forums is permitted, provided the original author(s) and the copyright owner(s) are credited and that the original publication in this journal is cited, in accordance with accepted academic practice. No use, distribution or reproduction is permitted which does not comply with these terms.
*Correspondence: Laia Fernández-Barat, lfernan1@recerca.clinic.cat; Antoni Torres, atorres@clinic.cat
†These authors have contributed equally to this work and share first authorship
This article was submitted to Biofilms, a section of the journal Frontiers in Cellular and Infection Microbiology
Disclaimer
All claims expressed in this article are solely those of the authors and do not necessarily represent those of their affiliated organizations, or those of the publisher, the editors and the reviewers. Any product that may be evaluated in this article or claim that may be made by its manufacturer is not guaranteed or endorsed by the publisher.