 Ann M. Arfken1
 Juli Foster Frey2Nora Isabel Carrillo2
 Nneka Ijeoma Dike2Ogechukwu Onyeachonamm2Daniela Nieves Rivera2
 Cary Pirone Davies2
 Katie Lynn Summers2*
- 1Oak Ridge Institute for Science and Education, Center for Disease Control, Atlanta, GA, United States
- 2Animal Biosciences and Biotechnology Laboratory, Beltsville Agricultural Research Center, Agricultural Research Service, United States Department of Agriculture, Beltsville, MD, United States
Introduction: The gut microbiome is an integral partner in host health and plays a role in immune development, altered nutrition, and pathogen prevention. The mycobiome (fungal microbiome) is considered part of the rare biosphere but is still a critical component in health. Next generation sequencing has improved our understanding of fungi in the gut, but methodological challenges remain. Biases are introduced during DNA isolation, primer design and choice, polymerase selection, sequencing platform selection, and data analyses, as fungal reference databases are often incomplete or contain erroneous sequences.
Methods: Here, we compared the accuracy of taxonomic identifications and abundances from mycobiome analyses which vary among three commonly selected target gene regions (18S, ITS1, or ITS2) and the reference database (UNITE - ITS1, ITS2 and SILVA - 18S). We analyze multiple communities including individual fungal isolates, a mixed mock community created from five common fungal isolates found in weanling piglet feces, a purchased commercial fungal mock community, and piglet fecal samples. In addition, we calculated gene copy numbers for the 18S, ITS1, and ITS2 regions of each of the five isolates from the piglet fecal mock community to determine whether copy number affects abundance estimates. Finally, we determined the abundance of taxa from several iterations of our in-house fecal community to assess the effects of community composition on taxon abundance.
Results: Overall, no marker-database combination consistently outperformed the others. Internal transcribed space markers were slightly superior to 18S in the identification of species in tested communities, but Lichtheimia corymbifera, a common member of piglet gut communities, was not amplified by ITS1 and ITS2 primers. Thus, ITS based abundance estimates of taxa in piglet mock communities were skewed while 18S marker profiles were more accurate. Kazachstania slooffiae displayed the most stable copy numbers (83-85) while L. corymbifera displayed significant variability (90-144) across gene regions.
Discussion: This study underscores the importance of preliminary studies to assess primer combinations and database choice for the mycobiome sample of interest and raises questions regarding the validity of fungal abundance estimates.
Introduction
The mycobiome is an often overlooked, but critical component in animal health (Cui et al., 2013; Huffnagle and Noverr, 2013; Huseyin et al., 2017; Enaud et al., 2018; Chin et al., 2020; Summers and Arfken 2022). While studies investigating the bacteriome (bacterial microbiome) have become prevalent in the literature, studies involving fungal populations are less common. Amplicon-based workflows, which employ next generation sequencing, are commonly used for fungal profiling, but there is no current consensus over which methods are optimal. Challenges associated with diverse fungal cell wall structures, similarity of conserved fungal marker regions with those of other eukaryotes, and sparse or inaccurate reference databases lead to biases during sample collection/storage, DNA extraction, marker and primer selection, sequencing, and bioinformatic analyses (Henrik et al., 2008; Nilsson et al., 2019). Thus, technical studies investigating potential confounding factors are vital in pushing this field forward.
The selection of an appropriate gene marker is a critical aspect of amplicon-based mycobiome profiling. Markers may differ in length, taxonomic resolving power, and ease with which they amplify different species, all of which affect taxonomic classifications (Begerow et al., 2010; Berruti et al., 2017; Banos et al., 2018; George et al., 2019). The Internal Transcribed Spacer (ITS) of the rRNA ribosomal gene is most frequently used for fungal barcoding. The ITS sequences are highly variable and provide species level resolution of diverse taxa (Schubert et al., 2007; Nilsson et al., 2008; Schoch et al., 2012; Lücking et al., 2020). However, ITS may not differentiate some species, such as those from the genus Fusarium (Karlsson et al., 2017; Walder et al., 2017; Bakker, 2018), or some molds and pathogens (Lücking et al., 2020), and this region is only useful when closely related sequences are present in the database (Eldred et al., 2021). Further, variability in ITS length can confound taxonomic identifications and abundance estimates (Lindahl et al., 2013; Tedersoo et al., 2015; Tedersoo and Lindahl, 2016; Reich and Labes, 2017). Limitations in Illumina sequencing preclude sequencing the entire ITS region, and there is debate as to whether the ITS1 or ITS2 region is best (Nilsson et al., 2008).
The 18S region of rRNA is also commonly employed for fungal community profiling (Raja et al., 2017b; Reich and Labes, 2017; Frau et al., 2019). This region is highly conserved and valued for its ability to resolve phylogenetic relationships at high taxonomic levels (Begerow et al., 2010; Schoch et al., 2012). Although ITS is generally preferred for species level profiling (Schoch et al., 2012; Nilsson et al., 2019), in some taxonomic groups,18S can better resolve species than ITS (Berruti et al., 2017; Frau et al., 2019), and in some cases, community diversity measures may be comparable using 18S or ITS (George et al., 2019).
The selection of a reference database is also a major factor in the identification of species. The development of fungal databases has lagged behind those of bacteria, and current databases are often incomplete or erroneous (Nilsson et al., 2019). Sequence errors, or the lack of sequences for some taxonomic groups, can skew taxonomic identifications which are based on the similarity between amplicon and reference sequences. Errors can occur in both database and experimental sequences due to polymerase mistakes, chimera formation, and incorrect base-calling (Amend et al., 2010; Lindahl et al., 2013; Gohl et al., 2016; Tedersoo and Lindahl, 2016; Bakker, 2018). In addition, sequences that are labeled with the incorrect taxonomic assignments can further confound classifications (Schoch et al., 2012; Glockner et al., 2017; Yarza et al., 2017; Nilsson et al., 2019) and complications surrounding the identification of sexual and asexual forms of fungi contribute to these errors (Halwachs et al., 2017). Further, classification algorithms which compare experimental and database sequences may also skew results (Wang et al., 2007). Currently, the largest collection of 18S and ITS sequences are found in the SILVA (Quast et al., 2013) and UNITE (Nilsson et al., 2019) databases, respectively.
In order enhance the accuracy of mycobiome studies in agricultural animals, we assessed the cumulative impact of experimental biases on identification and quantification accuracy through Illumina MiSeq sequencing with three different workflows performed on synthetic and in-house constructed mock communities. We utilized combinations of three gene regions (18S, ITS1, ITS2) and analyzed each with either the SILVA or UNITE databases: 18S-SILVA, ITS1-UNITE, and ITS2-UNITE. We then determined how taxonomic identifications and abundance estimates varied among workflows. Communities included in-house constructed piglet fecal mock fungal communities (Isolate and Mixed), a piglet fecal community (Fecal), and a commercially available fungal mock community (ATCC Reference Standard). We also estimated the number of gene copies of 18S, ITS1, and ITS2 present in each member of the piglet fecal mock community as copy numbers of chromosomes vary and the number of ITS and 18S regions vary significantly among species, and even strains, in fungi (Herrera et al., 2009; Black et al., 2013; Steenwyk and Rokas, 2018; Lofgren et al., 2019), and high numbers of the target marker gene can lead to an over-estimation of certain species or strains. These findings help set a framework for experimental design and considerations when investigating the mycobiome in porcine and other agricultural samples.
Materials and methods
This study utilized a combination of environmental and commercial samples to investigate four defined mock fungal communities: (1) Isolate, (2) Mixed, (3) Fecal, and (4) ATCC Reference Standard. Below are the details on the construction of each community type.
Piglet fecal sample collection
This animal study was reviewed and approved by the USDA-ARS Institutional Animal Care and Use Committee of the Beltsville Agricultural Research Center. No antibiotics, antifungals, or supplementary additives were administered to the piglets at any time during the experiment. The diet was formulated to meet the National Research Council estimate of nutrient requirements (Supplemental Table 1). Piglets were weaned at 21 days of age and fecal samples were collected from 6 post-weaning piglets (age 24d) using sterile cotton-tipped swabs (Puritan, Guilford, ME, USA) to stimulate defecation into sterile weigh basins. Fecal samples were transferred to sterile 50 mL conical tubes and transported back to the laboratory directly.
Construction of isolate and mixed mock communities derived from piglet feces
Two mL of sterile 1X PBS was added to 0.2 g of collected feces and homogenized in a biological safety cabinet with a tissue tearer (Omni International, Kennesaw, GA, USA) and sterilization steps between each sample. Post-homogenization, samples were serially diluted and plated in triplicate on Sabouraud Dextrose Agar (SDA) and Yeast Potato Dextrose Agar (YPD) plates (BD Difco, Franklin Lakes, NJ, USA). Both agar types were supplemented with 0.1 mg/ml cefoperazone, a third-generation broad-spectrum cephalosporin, to reduce bacterial growth on the agar plates (Sigma-Aldrich, St. Louis, MO, USA). Agar plates were incubated under different temperature conditions (37° C, 20° C) and with and without 5% CO2 supplementation to optimize growth for multiple fungi. Each fungal isolate was preliminarily identified under a phase contrast microscope to assess the presence or absence of year cells (shape, size), conidia presence (size, shape), or hyphae (septate or aseptate, branching or not, pigment presence, and width evenness). These assessments were utilized in combination with sequencing results to confirm identification. Colonies that grew and were assessed under the microscope were then individually Sanger sequenced utilizing primers for the ITS1, ITS2, and 18S regions in fungi (Table 1 and Figure 1). ITS1 primers refer to: ITS1 Forward – 5’ CTTGGTCATTTAGAGGAAGTCC 3’, ITS1 Reverse – 5’ GCTGCGTTCTTCATCGATGC 3’. ITS2 primers refer to: ITS2 Forward – 5’ GCATCGATGAAGAACGCAGC 3’, ITS2 Reverse – 5’ TCCTCCGCTTATTGATATGC 3’. 18S primers refer to: 18S Forward – 5’ CGATAACGAACGAGACCT 3’, 18S Reverse – 5’ ANCCATTCAATCGGTANT 3’. Sequences were identified by comparison to the nr/nt database using BLAST (blast.ncbi.nlm.nih.gov) (pident >99%, qcov=100).
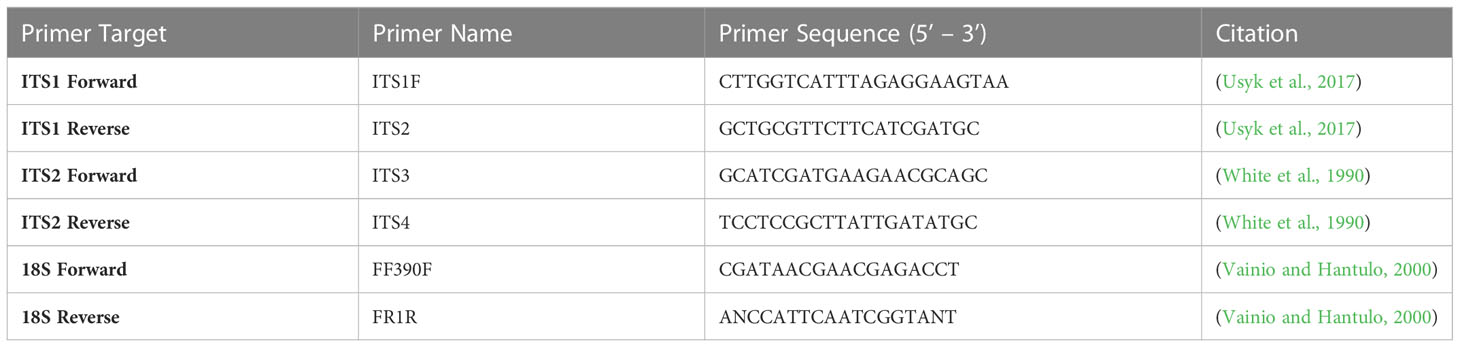
Table 1 Primers utilized in amplifying fungi.
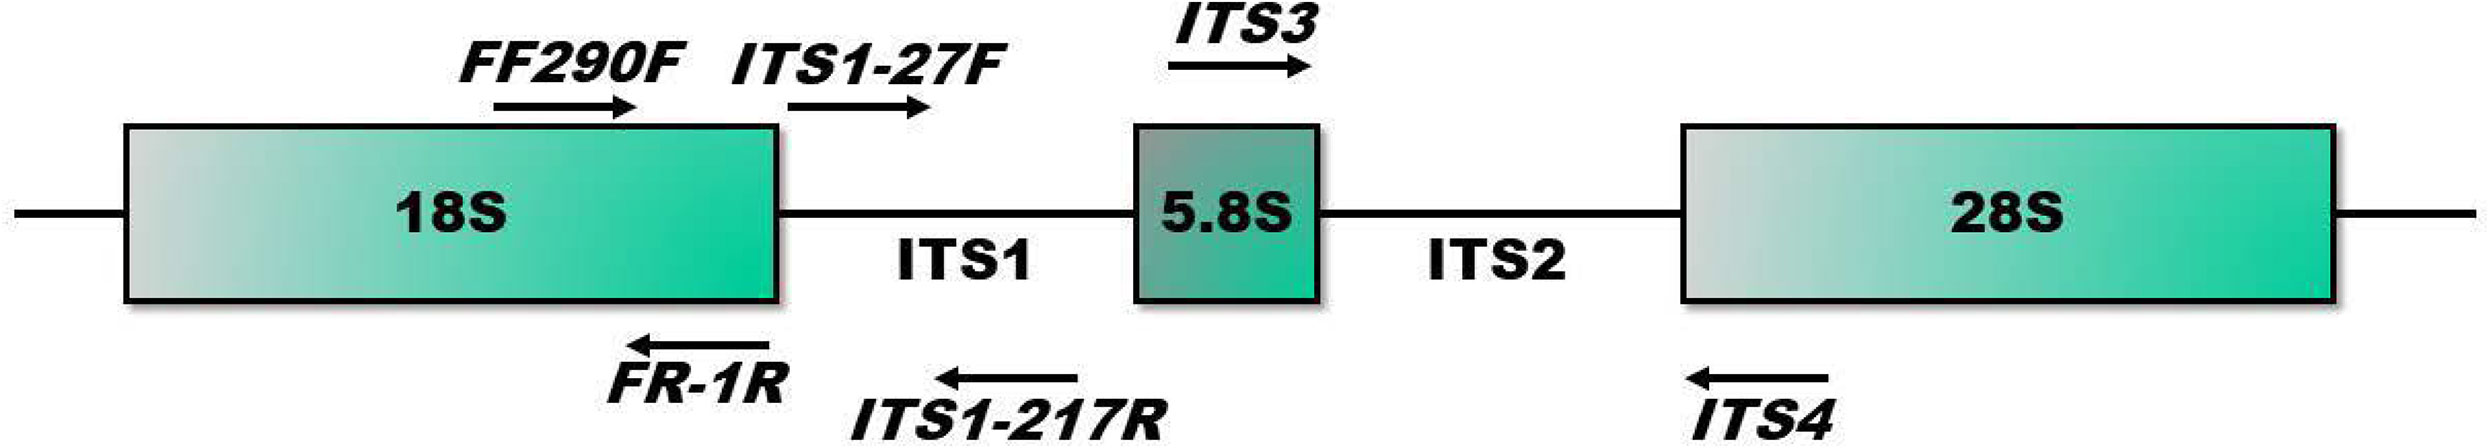
Figure 1 ITS1, ITS2, and 18S primer targets tested. Primers targeting ITS1(ITS1-27F, ITS1-217R), ITS2 (ITS3, ITS4), and 18S (FF290F, FR-1R) were assessed for amplicon accuracy.
Five fungal isolates identified from piglet feces were utilized for mock community construction and further analysis: Kazachstania slooffiae (K), Trichosporon asahii (T), Pichia fermentans (P), Lichtheimia corymbifera (L), and Candida albicans (C). In brief, colonies of each identified species were cultured in 5 mL of YPD+cef or SDA+cef. After 24 h of growth at 37° C and 5% CO2, whole DNA was isolated using the DNeasy PowerSoil Pro Kit according to Qiagen protocol (Qiagen, Hilden, Germany) with the addition of mechanical bead beating for 20 min at 20 frequency/second. Negative extraction controls were run by incorporating 1X sterile PBS at the beginning of isolation instead of a biological sample. Single isolate communities were made from each of the 5 single isolates with 125 ng DNA in each PCR reaction (Isolate Community). From each isolate, combinations of the fungal isolates were used to create mixed mock communities ranging in complexity from two isolates up to five isolates (Mixed Mock Community). These mixed mock communities included equivalent DNA from each included isolate (Table 2).
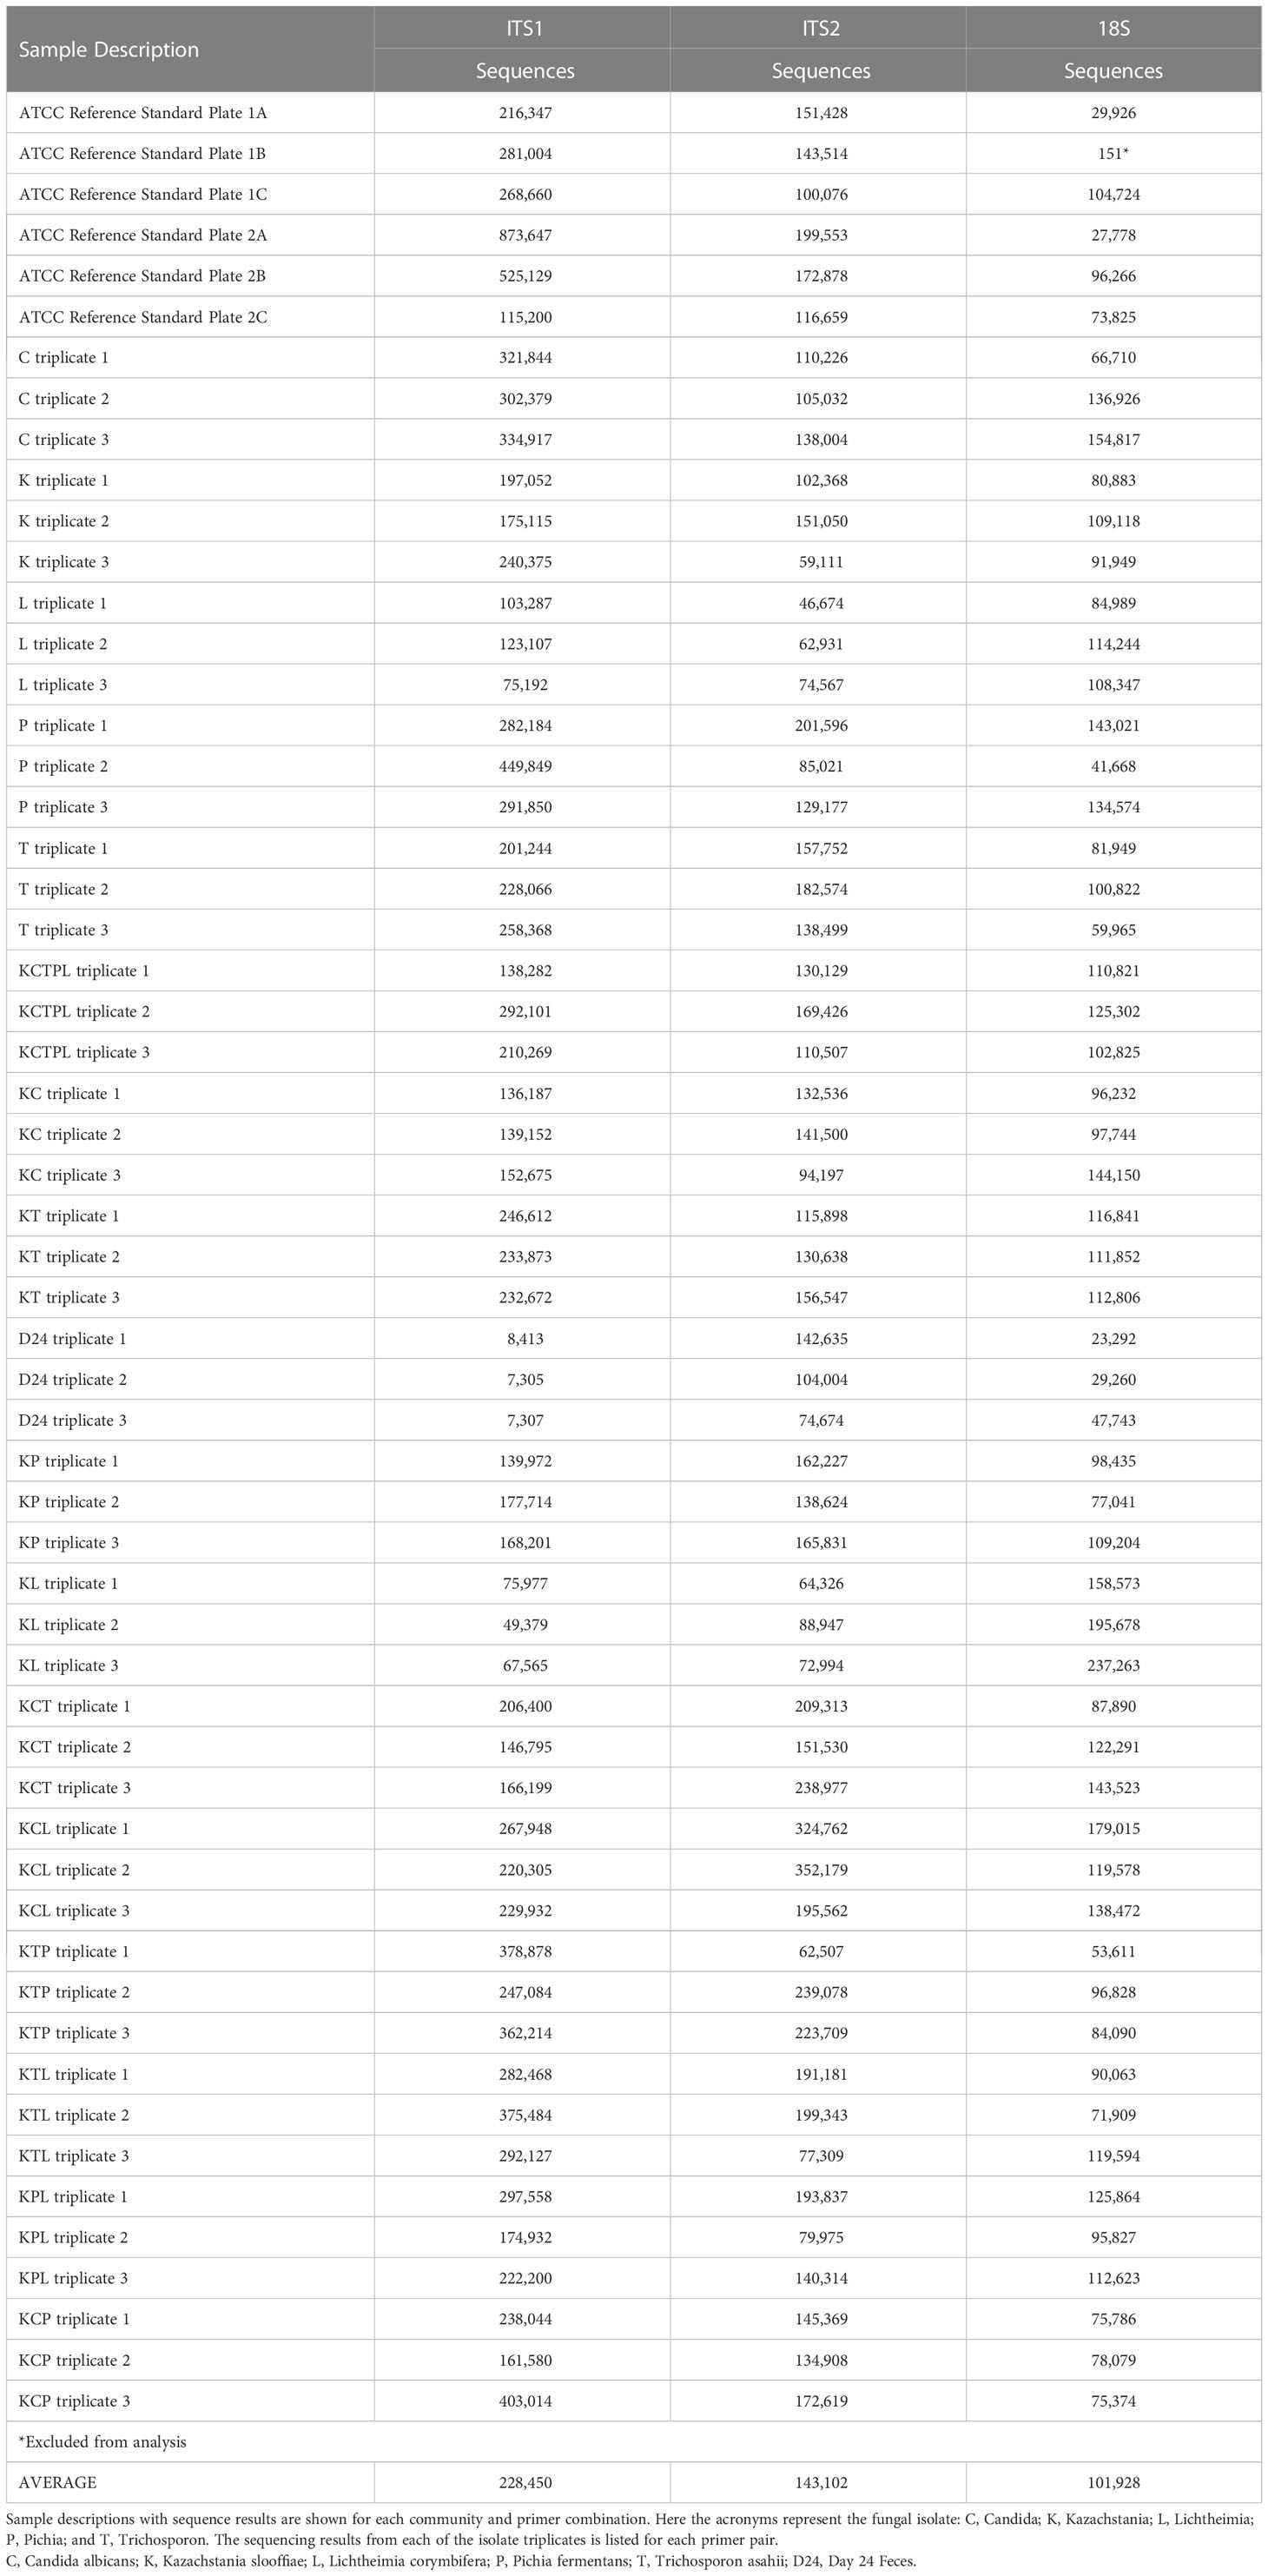
Table 2 ITS1, ITS2, and 18S sequencing results for fungal mock communities.
Fecal and ATCC Reference Standard mock communities
6 piglet (d24) feces were sterilely collected from piglets (as above) and 250mg was used to prepare DNA for MiSeq to represent a typical fecal sample used in a microbiome study (Fecal Community). The DNA was isolated as above utilizing the DNeasy PowerSoil Pro Kit (Qiagen, Hilden, Germany) with the same parameters as the isolates. A commercial mycobiome genomic DNA mix from ATCC (MSA 1010) (ATCC, Manassas, VA, USA) was also included in this study to serve as a positive control (ATCC Reference Standard). This community is composed of genomic DNA from diverse environmental fungi at known concentrations (Table 3). Technical replicates of the commercial community were named “ATCC Reference Standard 1” and “ATCC Reference Standard 2”.
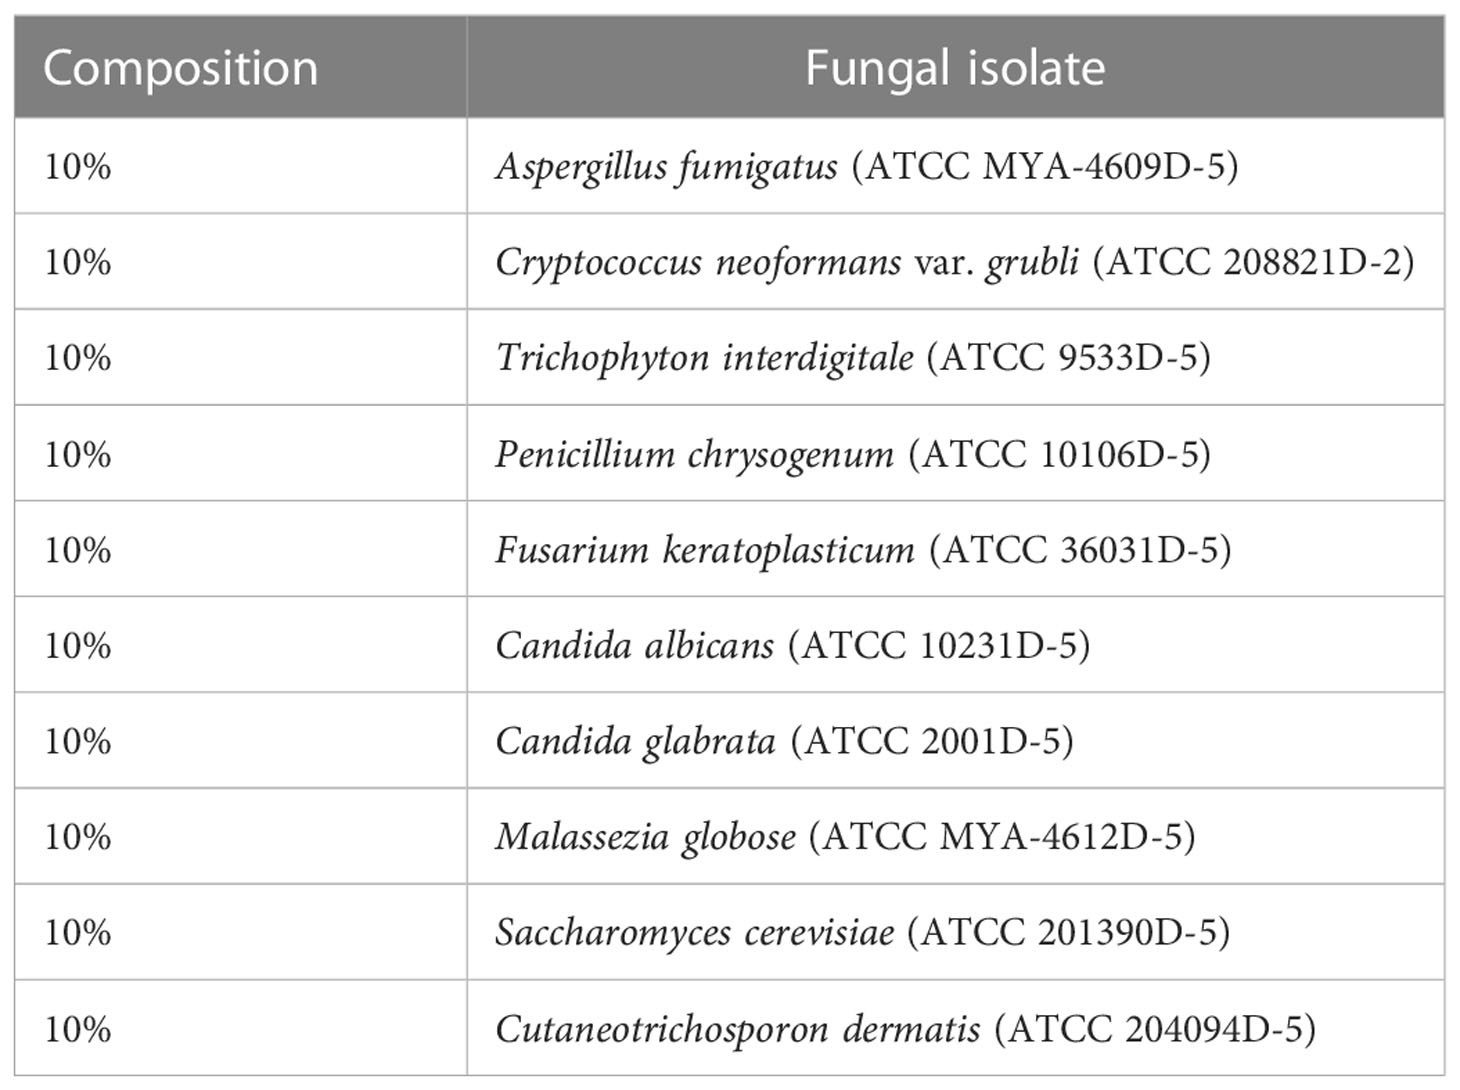
Table 3 Composition of fungal genomic DNA found in ATCC MSA 1010 mix (ATCC Reference Standard).
ITS1, ITS2, and 18S amplification, and Illumina Sequencing
For each of the four different community types: (1) Isolate, (2) Mixed, (3) Fecal, and (4) ATCC Reference Standard, the ITS1, ITS2, and 18S regions were amplified in triplicate using gene specific primers listed in Table 1 with the Illumina adaptor sequence added to the 5’ end (5′-TCGTCGGCAGCGTCAGATGTG TATAAGAGACAG—ITS3-3′) and (5′GCTTCGTGGGCTCGGAGATGTGTATAAG AGACAG—ITS4-3′). The Illumina 16S Metagenomic Sequencing Library Preparation protocol was utilized and samples were sequenced on the Illumina MiSeq platform (https://support.illumina.com/documents/documentation/chemistry_documentation/16s/16s-metagenomic-library-prep-guide-15044223-b.pdf).
Experimental controls
To assess contamination during DNA extraction and sequencing, and to detect biases in database identifications, we implemented several controls. Negative controls were included at each step of extraction (see above) and sequencing (wells with no template) to track any contamination. The ATCC mock community served as a positive control. As all samples were unable to be sequenced on one Illumina MiSeq sequencing run, cross-plate samples for ITS and 18S targets served as internal controls to assess plate sequencing efficiency. No significant difference in sequencing efficiency was found between plates (data not shown). Samples were run in technical triplicate for each community type and those utilized as cross-plate controls were run in triplicate on each plate and duplicate on comparison plates.
Illumina sequence processing and taxonomic identification
Forward and reverse primers were removed from paired end reads using cutadapt v 1.18 for ITS sequences and BBDuk in BBTools v 38.79 for 18S sequences (Martin, 2011). Trimmomatic v 0.39 and the SLIDINGWINDOW 4:15 and MINLEN:40 options were used to quality trim individual sequences for all three data sets (Bolger et al., 2014). Merging, denoising, chimera removal and amplicon sequence variant (ASV) determination and ASV sequence lengths for each data set was conducted using the DADA2 plugin in QIIME2 v 2020.8 with truncation and trimming parameters set to 0. Taxonomic databases for classification were trained using a Naïve Bayes classifier for ITS and 18S with the q2-feature-classifier commands in QIIME2 using the developer’s QIIME-formatted UNITE v8 2020.4 full-length dynamic dataset and the QIIME-formatted SILVA 138 SSURef NR99 full-length dataset (Bokulich et al., 2020), respectively. ASVs that were classified as either “unclassified” or “unidentified” at the phylum level were searched against the NCBI nt database using BLAST and reclassified as either “Fungi Unclassified” or “Non-Fungi” or discarded (no hit or query coverage and percent identity < 80%). Except for negative controls, samples < 5000 sequences were removed from analysis (ITS1 n=0; ITS2 n=0; 18S n = 1). All sequences are publicly available (BioProject PRJNA693350).
Copy number determination by qPCR
The 18S, ITS1, and ITS2 regions of each of the five fungal mock community species were first amplified and sequenced. Each qPCR primer set was designed for the ITS1, ITS2, and 18S regions of all 5 fungal mock community species from these sequences (Supplemental Table 2). The qPCR primers were also designed for the actin gene of all 5 mock community species, using GenBank sequences as reference. Preliminary studies were done to assess standard curves and melting points for each of the 4 primer sets for each fungal species (Supplemental Table 4). The Primer 3 program (https://bioinfo.ut.ee/primer3-0.4.0/) was used to assist with qPCR primer design, and trial PCR reactions were performed using the newly designed PCR primers to ensure a single product of the predicted size. All PCR products were between 108-150 bp. qPCR was performed in triplicate on 6 different concentrations of DNA template ranging from 0-25 ng for each of the five fungal species, using actin, ITS1, ITS2, and 18S primers. SsoAdvanced Universal SYBR Green Supermix (BioRad) was used and primers had a final concentration of 0.5 µM. The qPCR program was as follows: 95˚ C 3 min, followed by 40 cycles of 95˚ C 10 sec and 60˚ C 30 sec. A melt curve of 60-95˚ C at 0.5˚ C was performed. Calculations were performed as previously published (Bakker, 2018) to determine the range of gene copy number. Ribosomal RNA gene copy number within the genome was estimated as: Copy number = 2 [C(t)single copy-C(t)rRNA].
Results
Amplicon sequencing outcomes for ITS1, ITS2, and 18S gene targets
Gene targets, ITS1, ITS2, and 18S were separately amplified and sequenced in triplicate from 19 communities including 5 Isolates, 11 Mixed, 1 Fecal, and 2 ATCC Reference Standards for a total of 171 samples (Table 2). Sequence outputs ranged from 7,305 to 873,647 total read pairs (Table 2). One replicate (of triplicates) for the ATCC Reference Standard community was excluded from the 18S sequencing library for further analysis due to low sequencing yield (n = 151 reads; Table 2). The ITS1 libraries resulted in the highest number of total paired reads (1.30x10⁷) with an average read depth per sample of 228,450 ± 18,226. The ITS2 libraries resulted in 8.16x10⁶ reads with an average read depth per sample of 143,102 ± 8,044. The 18S libraries resulted in the least number of paired reads, with 5.17x10⁶ reads and a read depth per sample of 101,928 ± 5,398.
Contamination levels in the sequencing negative controls and DNA extractions were low (Supplemental Table 3), representing between 0.002-0.013% of total reads, with the majority of the contamination sequences (>68%) coming from the extraction controls. While isolate sequences from the piglet fecal mock community appeared in the contamination sequences in very low abundance, the majority of the contaminants were not from isolates.
Of the ITS1, ITS2, and 18S libraries, ≥99.7% of reads for the Isolate, Mixed Mock, and ATCC Reference Standard communities were taxonomically identified as fungi using either UNITE ITS or SILVA 18S databases (Table 4) (Supplemental Table 3). For the Fecal community, 92.5% ± 0.8 of reads per sample were identified as fungus from the ITS2 library (162 total fungal ASVs), while only 74.3% ± 0.5 of the reads in the 18S library (57 total fungal ASVs) and 61.9% ± 0.7 reads in the ITS1 library (111 total fungal ASVs) were identified as fungus (Figure 2). This data supports the use of ITS2 for fungal taxa amplification in pig feces. Sequencing of this region resulted not only in the greatest sequencing yields and the highest number of identified ASVs, but also the lowest non-target amplification (Supplemental Table 4).
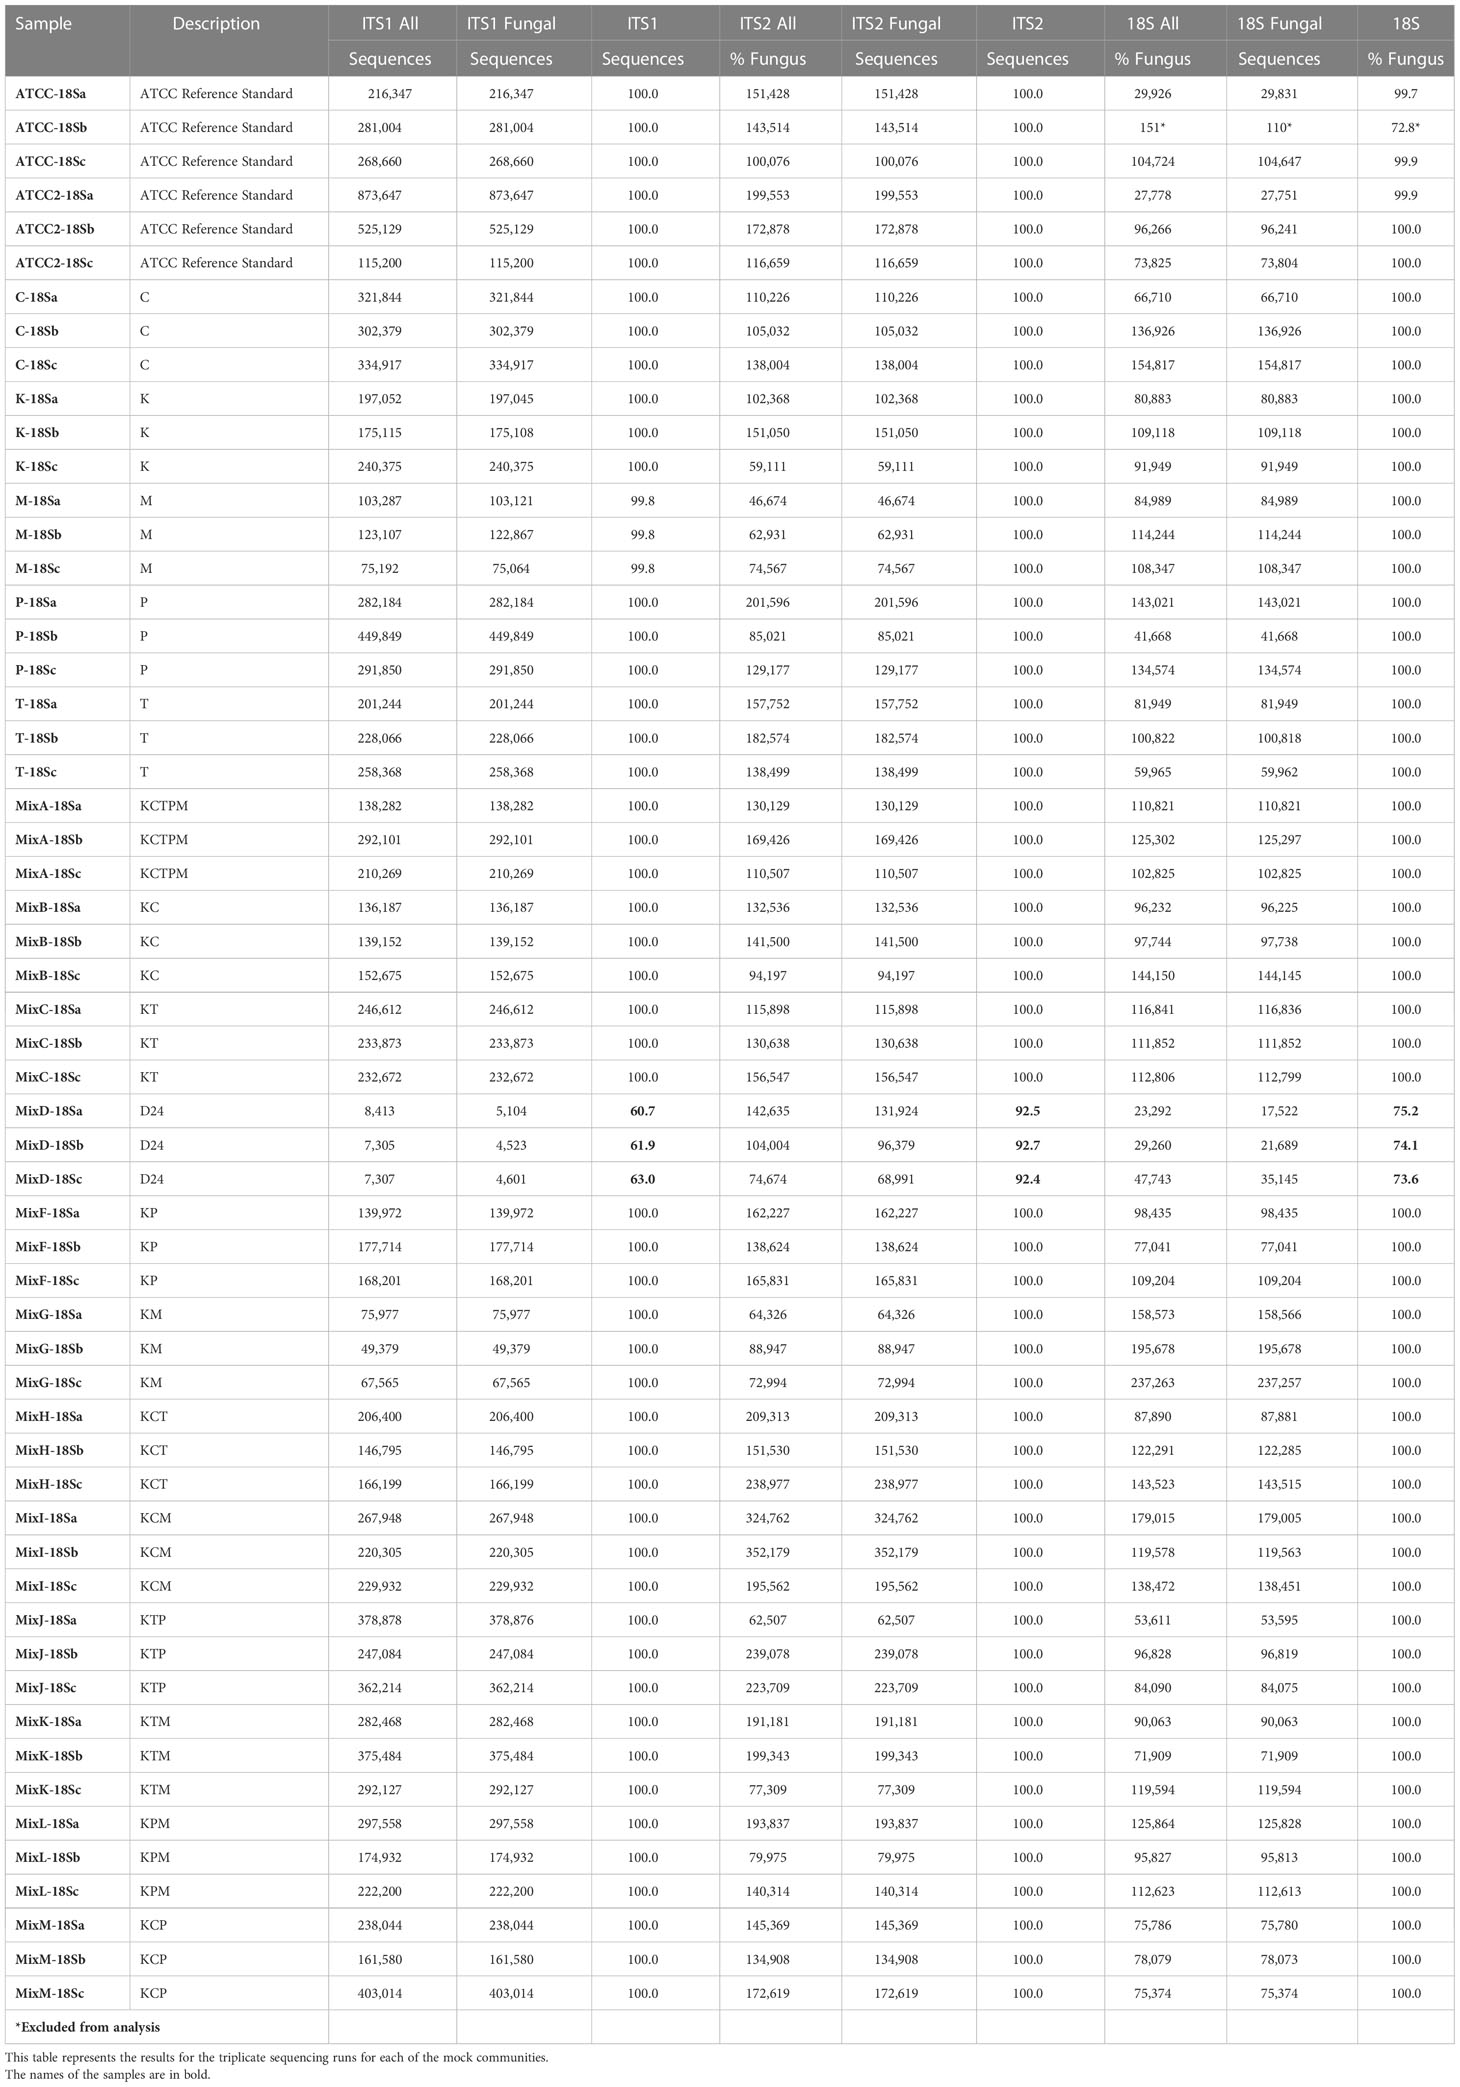
Table 4 Sequences identified as fungal from ITS1, ITS2, and 18S amplicon sequencing using the UNITE ITS or Silva 18S databases.
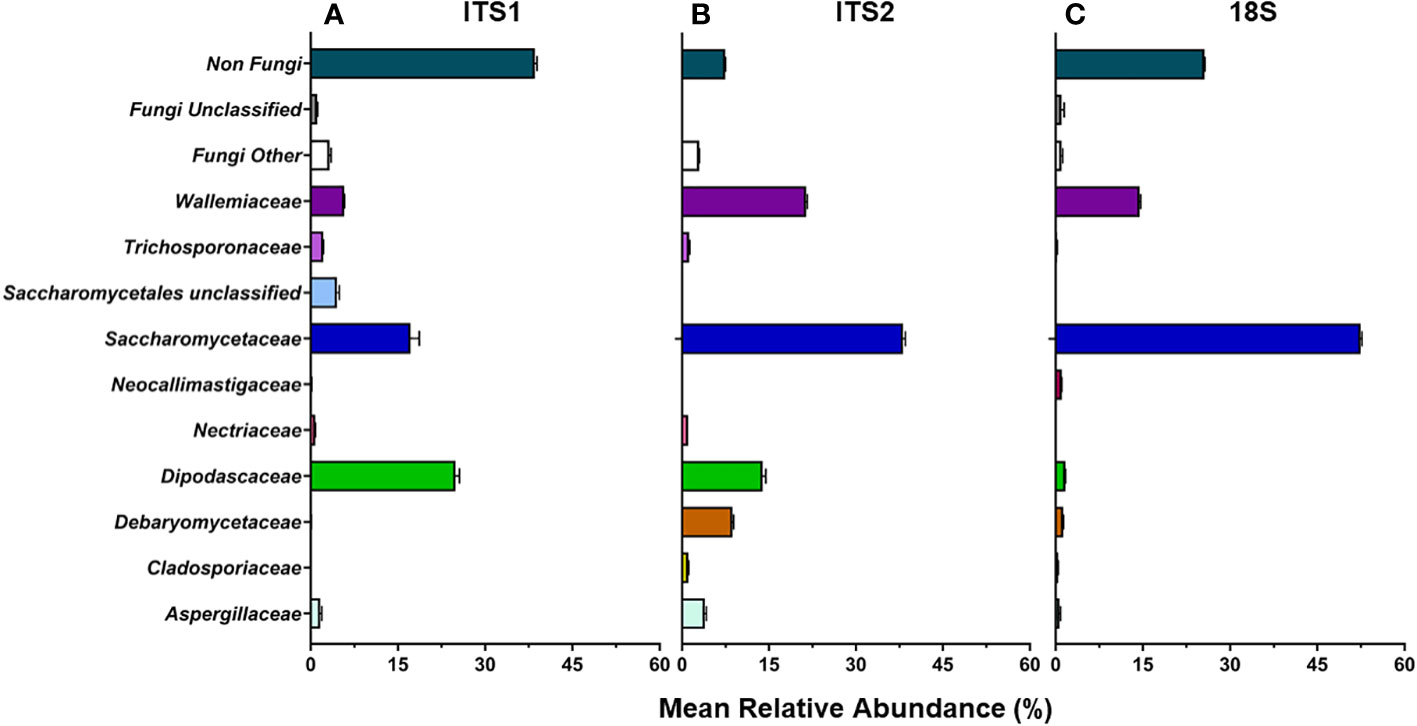
Figure 2 D24 fecal community. ITS1 (A), ITS2 (B), and 18S (C) primers were used to determine mean relative abundance of fungi found in post-weaning piglets (d24).
Next, we assessed total community ASV lengths (Supplemental Table 4). The fungal ASV and amplicon lengths varied significantly between the ITS1, ITS2, and 18S libraries. 111 fungal ASVs with a mean length of 239 bp ± 7.9 bp (min = 106, max = 478) were identified in the ITS1 library. In the ITS2 library, 162 fungal ASVs with a mean length of 307 bp ± 5.0 (min = 101, max = 436) were identified and 57 fungal ASVs with a mean length of 324 bp ± 7.6 (min = 196, max = 535) in the 18S library were identified.
The ITS1 ASV libraries from individual isolates had the greatest range in ASV lengths from 154 bp (P. fermentens) to 395 bp (K. slooffiae), while the 18S library had the smallest range from 312 bp (P. fermentens) to 335 bp (L. corymbifera) (Supplemental Table 5). With the exception of K. slooffiae, respective ITS1 ASV lengths were between 54 and 119 bp shorter than ITS2 ASV lengths. ASVs for K. slooffiae ITS2 was 5-6 bp longer than ITS1.
Taxonomic classification of isolates, mixed, and ATCC Reference Standard ASVs
Taxonomic classifications of Isolate, Mixed, and ATCC Reference Standard ASVs were determined using a trained Naïve Bayes classifier with the UNITE v 8 database for ITS1 and ITS2 libraries and the SILVA 138 database for the 18S library (Table 5). All ASVs were additionally identified using BLAST (blastn) against the NCBI nt database (selecting for TYPE material, specimens used to originally describe species).
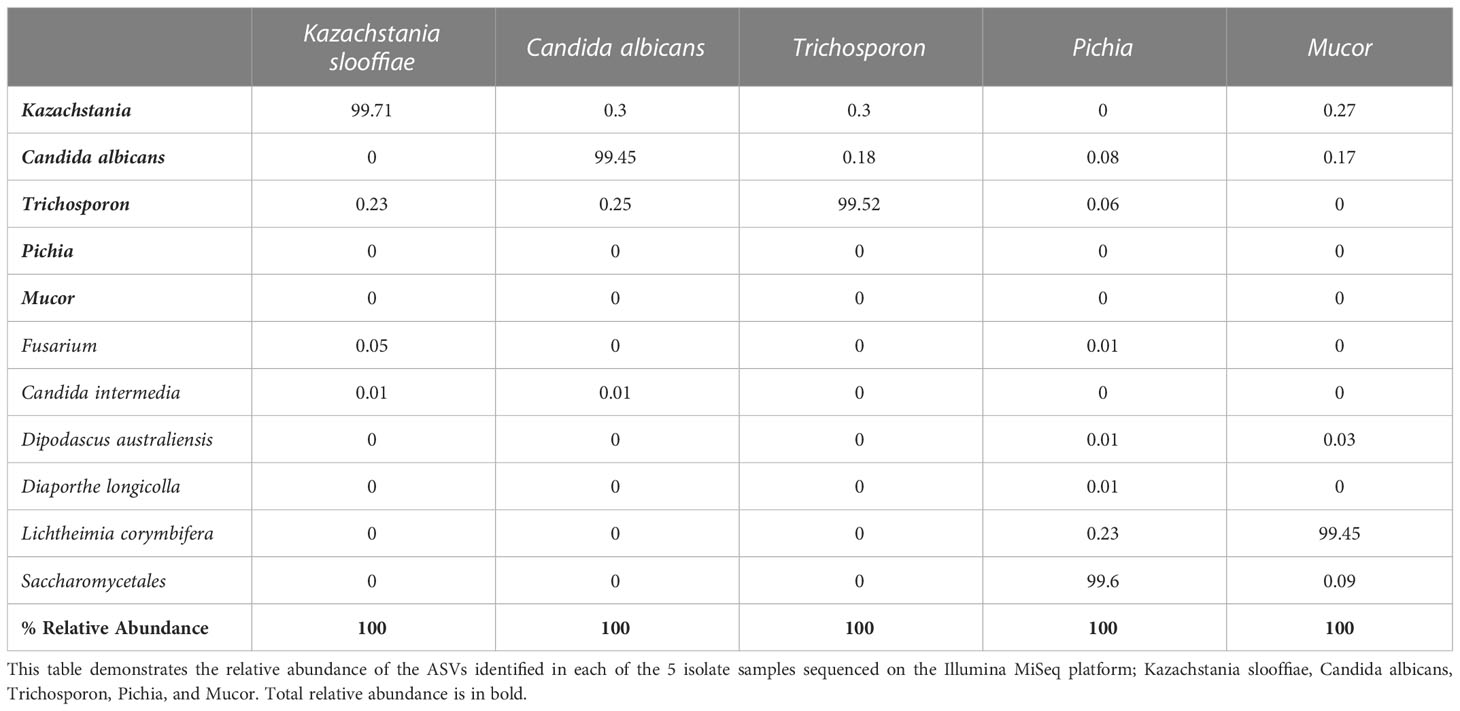
Table 5 Single species sequencing results.
Of the amplicons generated from the five individually sequenced isolates, the 18S amplicons were the only ones that were classified into a single ASV in all five isolates. The ITS1 and ITS2 amplicons from C. albicans and T. asahaii were also classified into a single ASV, while those from K. slooffiae, L. corymbifera, and P. fermentens were classified into 2-4 ASVs each (Figures 3A, 4A, 5A).
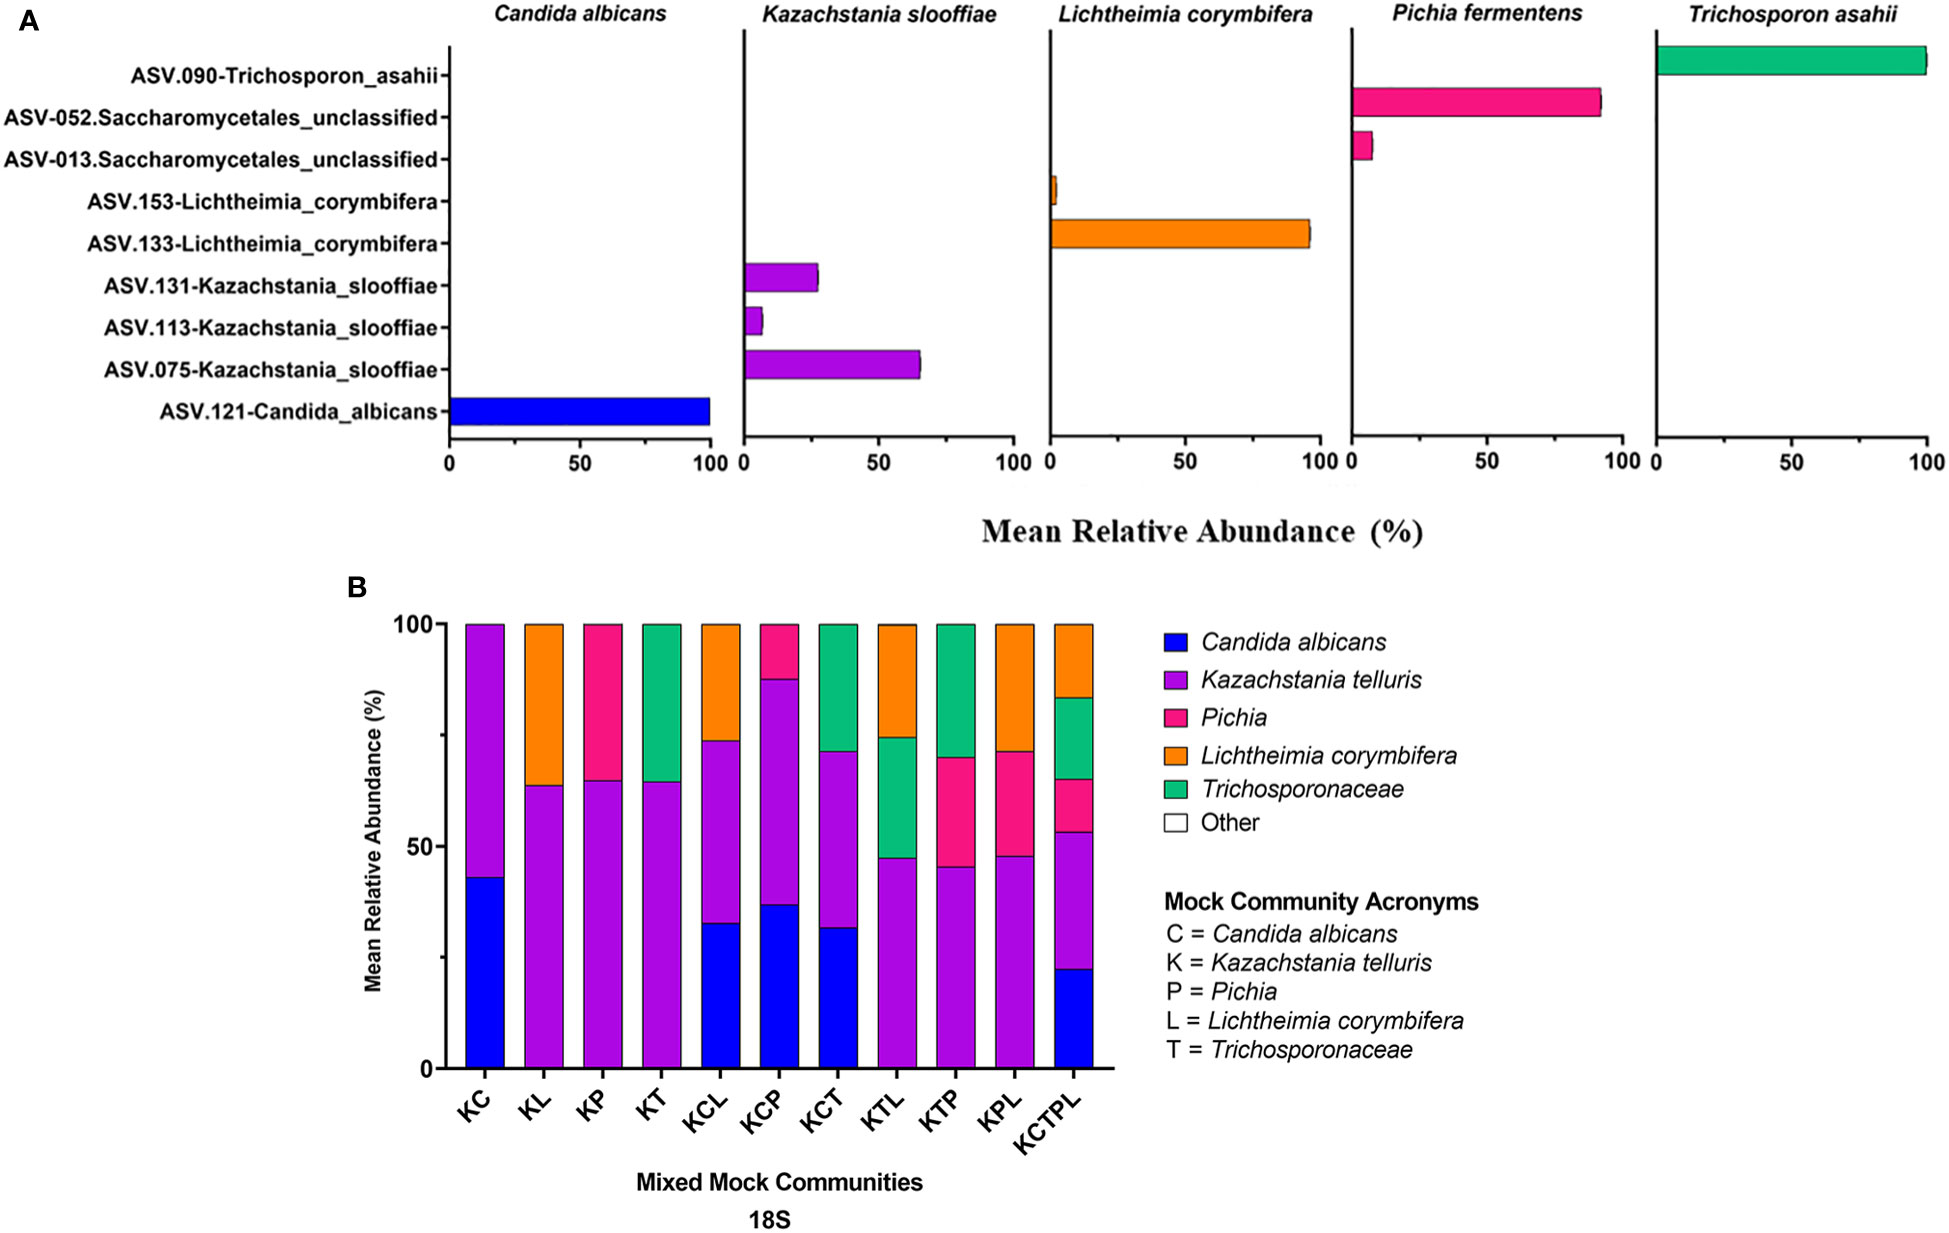
Figure 3 ITS1 Sequencing Results. ITS primers were used to sequence individual fungal isolates; C albicans, K slooffiae, L. corymbifera, P. fermentans, and T. asahii (A) or mock communities ranging from 2 isolate combinations up to all 5 in one mock community (B). Each mock community is represented on the x axis with an acronym representing the fungi in the mock community. C, Candida albicans; K, Kazachstania telluris; P, Pichia; L, Lichtheimia corymbifera; and T, Trichosporonaceae. Combinations are represented with the first letter of each fungus found in each mock community, for example, KC, Kazachstania and Candida. Negative controls for PCR reactions are found in the supplemental data.
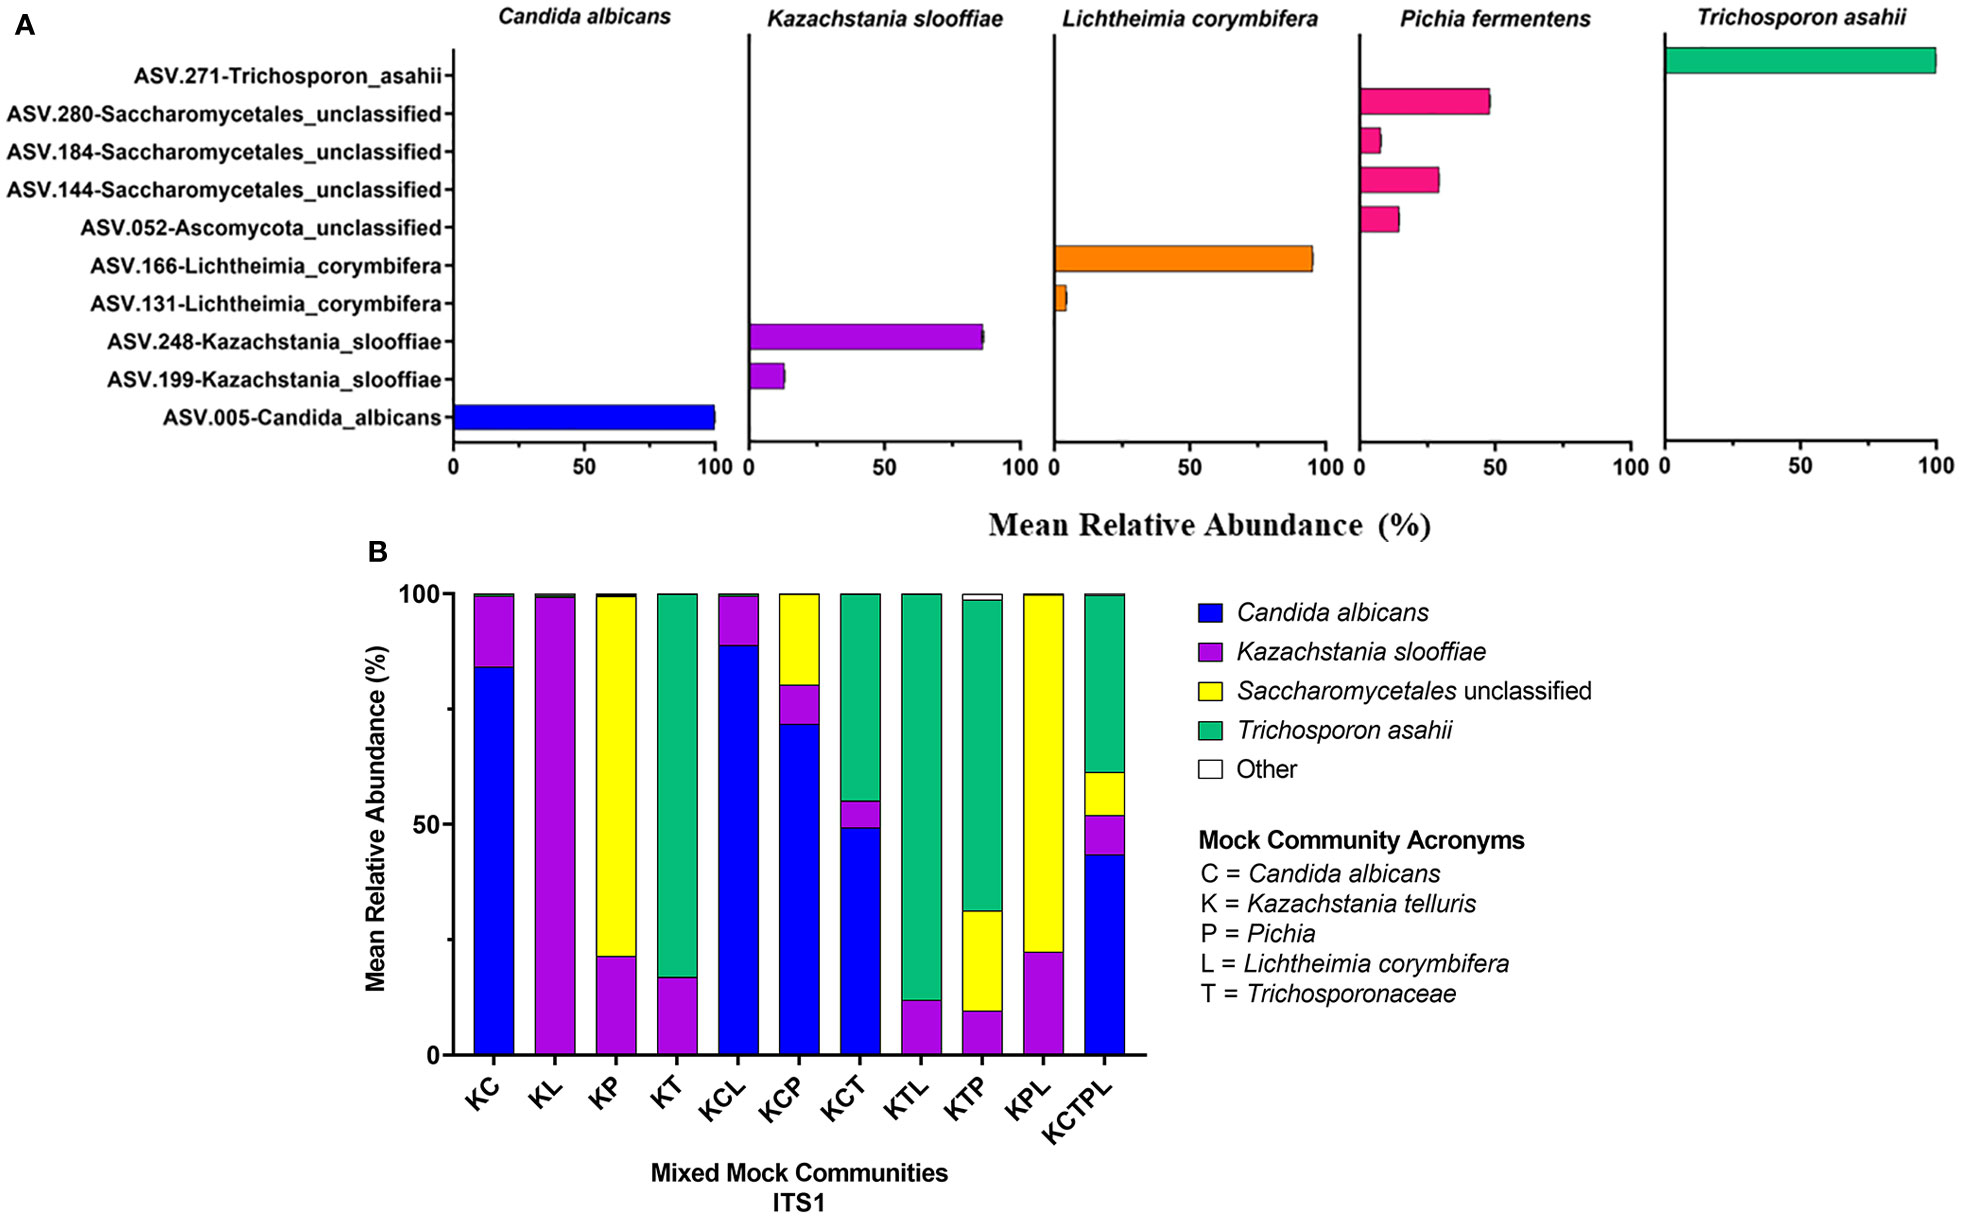
Figure 4 ITS2 Sequencing Results. ITS primers were used to sequence individual fungal isolates, C albicans, K slooffiae, L. corymbifera, P. fermentans, and T. asahii (A) or mock communities ranging from 2 isolate combinations up to all 5 in one mock community (B). Each mock community is represented on the x axis with an acronym representing the fungi in the mock community. C, Candida albicans; K, Kazachstania telluris; P, Pichia; L, Lichtheimia corymbifera, and T, Trichosporonaceae. Combinations are represented with the first letter of each fungus found in each mock community, for example, KC, Kazachstania and Candida.
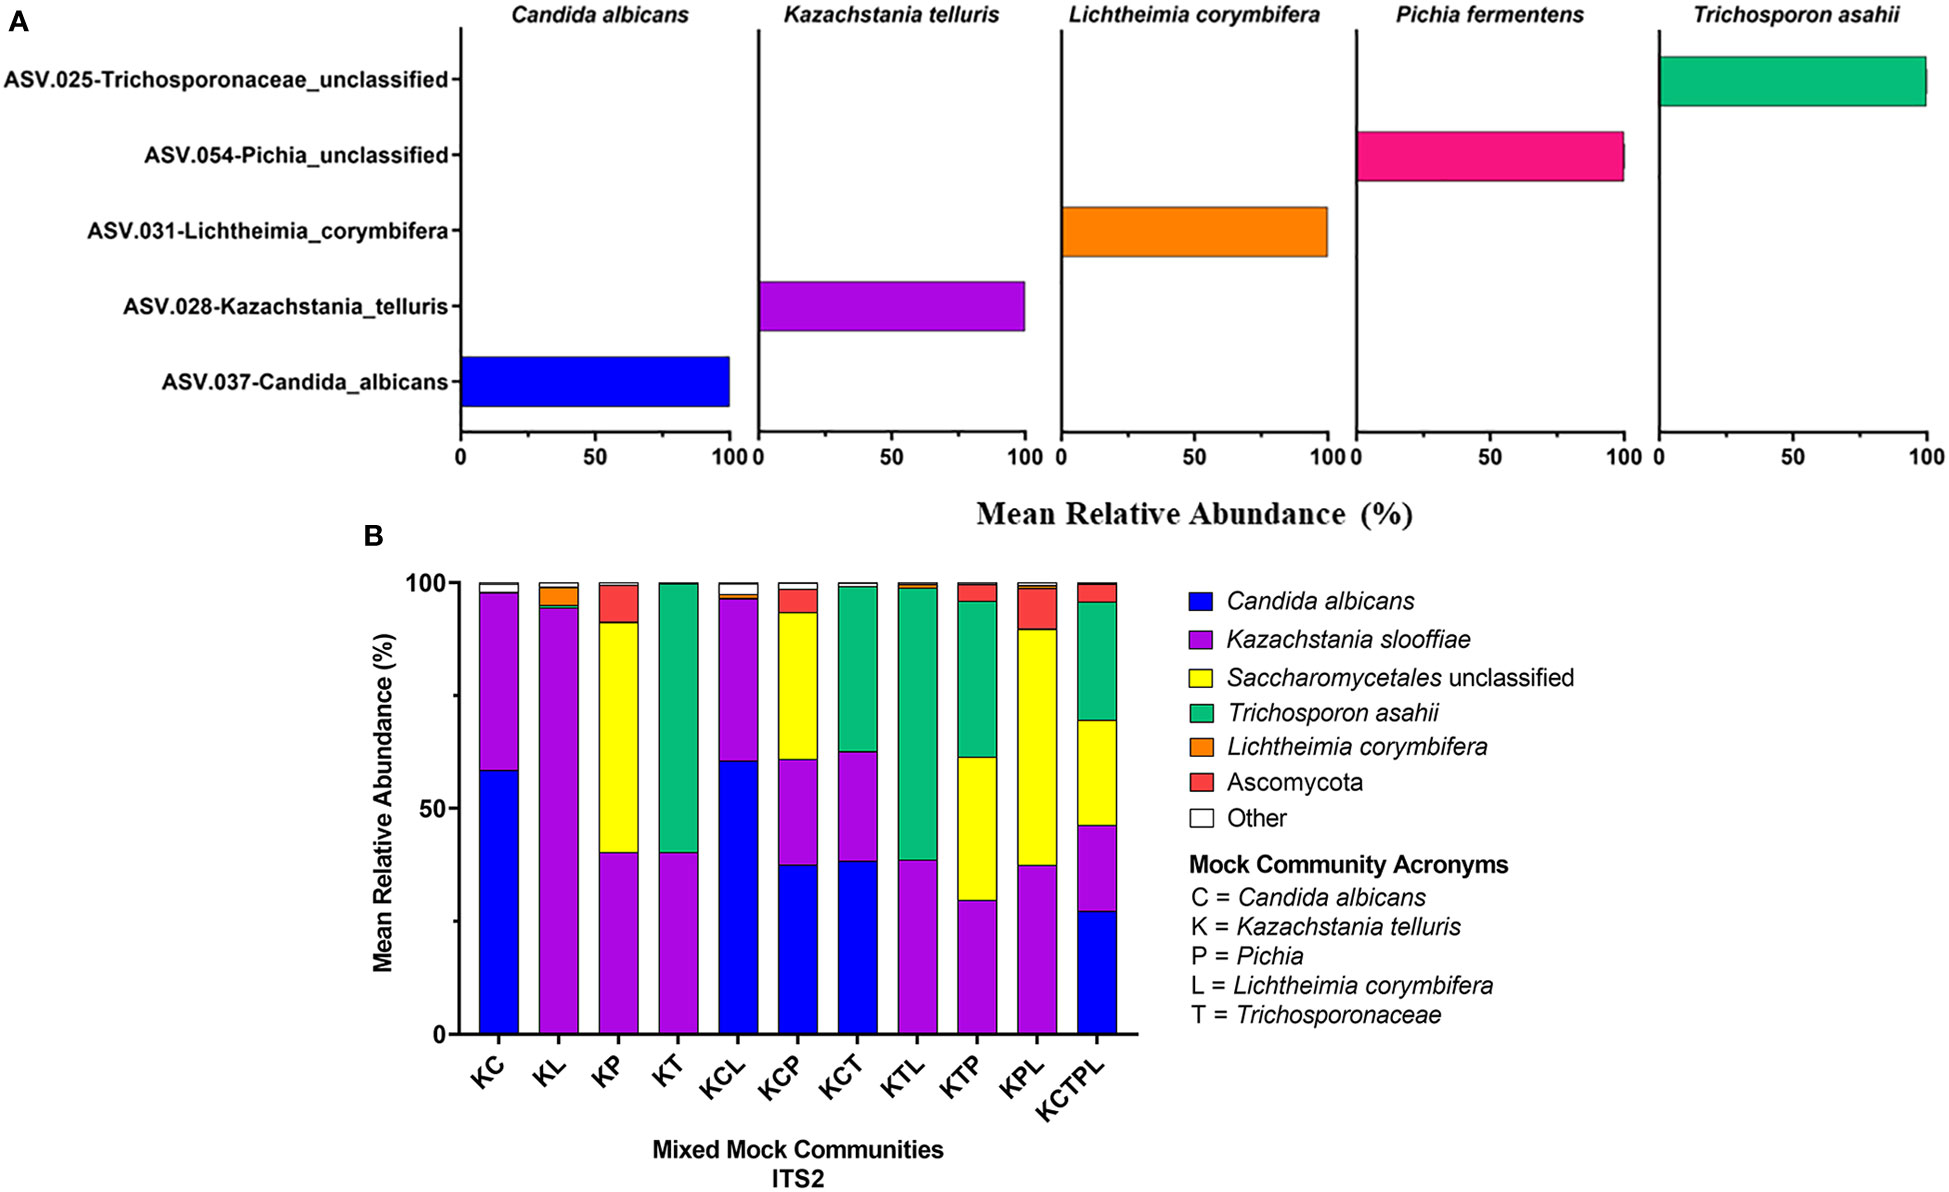
Figure 5 18S Sequencing Results. 18S primers were used to sequence individual fungal isolates, C albicans, K slooffiae, L. corymbifera, P. fermentans, and T. asahii (A) or mock communities ranging from 2 isolate combinations up to all 5 in one mock community (B). Each mock community is represented on the x axis with an acronym representing the fungi in the mock community. C = Candida albicans, K = Kazachstania telluris, P = Pichia, L = Lichtheimia corymbifera, and T = Trichosporonaceae. Combinations are represented with the first letter of each fungus found in each mock community, for example, KC = Kazachstania and Candida.
Kazachstania slooffiae. The ASVs from the K. slooffiae isolates were correctly identified in the ITS1 and ITS2 libraries by the UNITE database and using BLAST. In the 18S library, however; the K. slooffiae isolate was taxonomically identified as the closely related K. telluris species due to the absence of K. slooffiae in the SILVA database and NCBI nr/nt database for the 18S gene.
Candida albicans & Lichtheimia. corymbifera. The ASVs associated with the C. albicans and L. corymbifera isolates were correctly identified in all three libraries by both BLAST and the UNITE/SILVA databases. However, in the 18S library, BLAST returned other similarly close fungal matches in addition to L. corymbifera for the L. corymbifera isolate, including L. (Absidia) blakesleeana.
Trichosporon asahaii. The ASVs associated with the T. asahaii isolate were correctly identified in both the ITS1 and ITS2 libraries by the UNITE database, but only classified down to the family level (Trichosporonaceae) in the 18S library by the SILVA database. Additionally, the closest BLAST match to the T. asahii ASV from the ITS1 library was T. faecale, while several different fungal species were similarly closely matched to the ASV from the 18S library, including genera Pascua, Cryptococcus, and Apiotrichum.
Pichia fermentens. None of the ASVs associated with P. fermentens isolate were identified at the species level in any of the libraries by the UNITE/SILVA databases. In the 18S library, P. fermentens was correctly identified down to the genus level, while only identified to the order level Saccharomycetales in the ITS1 and Saccharomycetales or Ascomycota ITS2 libraries. However, BLAST results of the ASVs from all three libraries accurately identified the isolate as P. fermentens.
ATCC Reference Standard community. Using the UNITE database, 6 of the isolates found in the ATCC Reference Standard community were correctly identified in the ITS2 library down to the species level, while 4 were correctly classified at the genus level, with 3 having improper species identification (Figures 3B, 4B, 5B and Table 5). In the ITS1 library, 3 were correctly identified at the species level, 6 at the genus level (3 having improper species identifications), and one isolate could not be taxonomically identified (Candida glabrata) from the library. The 18S library with the SILVA database had the poorest taxonomic classification, with only 2 members having the proper genus-species identification, 5 classified down to the genus level, and 3 at the family or order level.
Mixed communities. The ITS1 and ITS2 workflows identified all species except for L. corymbifera in all samples, but the ITS2 workflow did identify this species in one of five mixed communities. Similar to the single isolate samples, P. fermentens was only identified to the order level Saccharomycetales in the ITS1 and Saccharomycetales or Ascomycota ITS2 libraries. The 18S + SILVA workflow T. asahaii was identified only to the family level (Trichosporonaceae), and K. slooffiae was misidentified as K. telluris.
Abundance estimates of ATCC Reference Standard and mixed mock communities
The relative abundances of ASVs identified from isolates were determined for each of the constructed and ATCC Reference Standard mock communities (Figures 3–5 and Supplemental Tables 5–8).
ITS1. K. slooffiae was under-represented in relative abundance in the mixed mock communities, while C. albicans and T. asahii were over-represented (Figure 3). The ASV amplified from the P. fermentans isolate (Saccharomycetales unclassified) was over-represented in mock communities KP and KPM, but under-represented in mock communities containing C. albicans or T. asahii. L. corymbifera was almost entirely absent in the ITS1 library, with <1% relative abundance of reads in the mixed mock communities containing the isolate.
ITS2. C. albicans and T. asahii were slightly over-represented in relative abundance in the ITS2 library for dual mixed communities, but less than ITS1 (Figure 4). For mixed communities KCP, KCT, KTP containing 3 isolates, C. albicans and T. asahii were close to the expected abundances. K. slooffiae was only slightly under-represented in the ITS2 library. L. corymbifera was greatly under-represented in the ITS2 library for all mixed communities in which it was present, with only the KM library having a mean relative abundance of L. corymbifera >1% (3.88% ± 0.25).
18S. The 18S library was the only library in which L. corymbifera ASVs were successfully represented, although still under-represented compared to the other isolates (Figure 5). All isolates were slightly under-represented in the mix mock communities except for K. slooffiae, which was slightly over-represented. In general, the 18S library was the closest representation of the original mock communities when considering all isolates used in this study.
ATCC Reference Standard mock community. A. fumigatus, T. interdigitale, and P. chrysogenum were under-represented in relative abundances in the ATCC Reference Standard communities with relative abundances <50% the expected composition (Figure 6 and Table 5). In contrast, C. dermatis was more than ~1.7-3.2x over-represented in all libraries. Only C. albicans was close to the expected composition by relative abundance in the libraries, ranging from ~15.0% in the 18S library to ~9.5% in the ITS2 library. Of the 3 libraries, the ITS2 library was the closest match in the distribution of relative abundances to the original ATCC Reference Standard mixed mock community (cumulative difference of 64.89), followed closely by 18S (cumulative difference of 69.6), with ITS1 the least similar (cumulative difference of 93.8). The poorest represented isolates from the ATCC Reference Standard mock community were P. glandicola and C. glabrata in the ITS1 library and M. globosa in the ITS2 library with mean relative abundances of ~1.0%
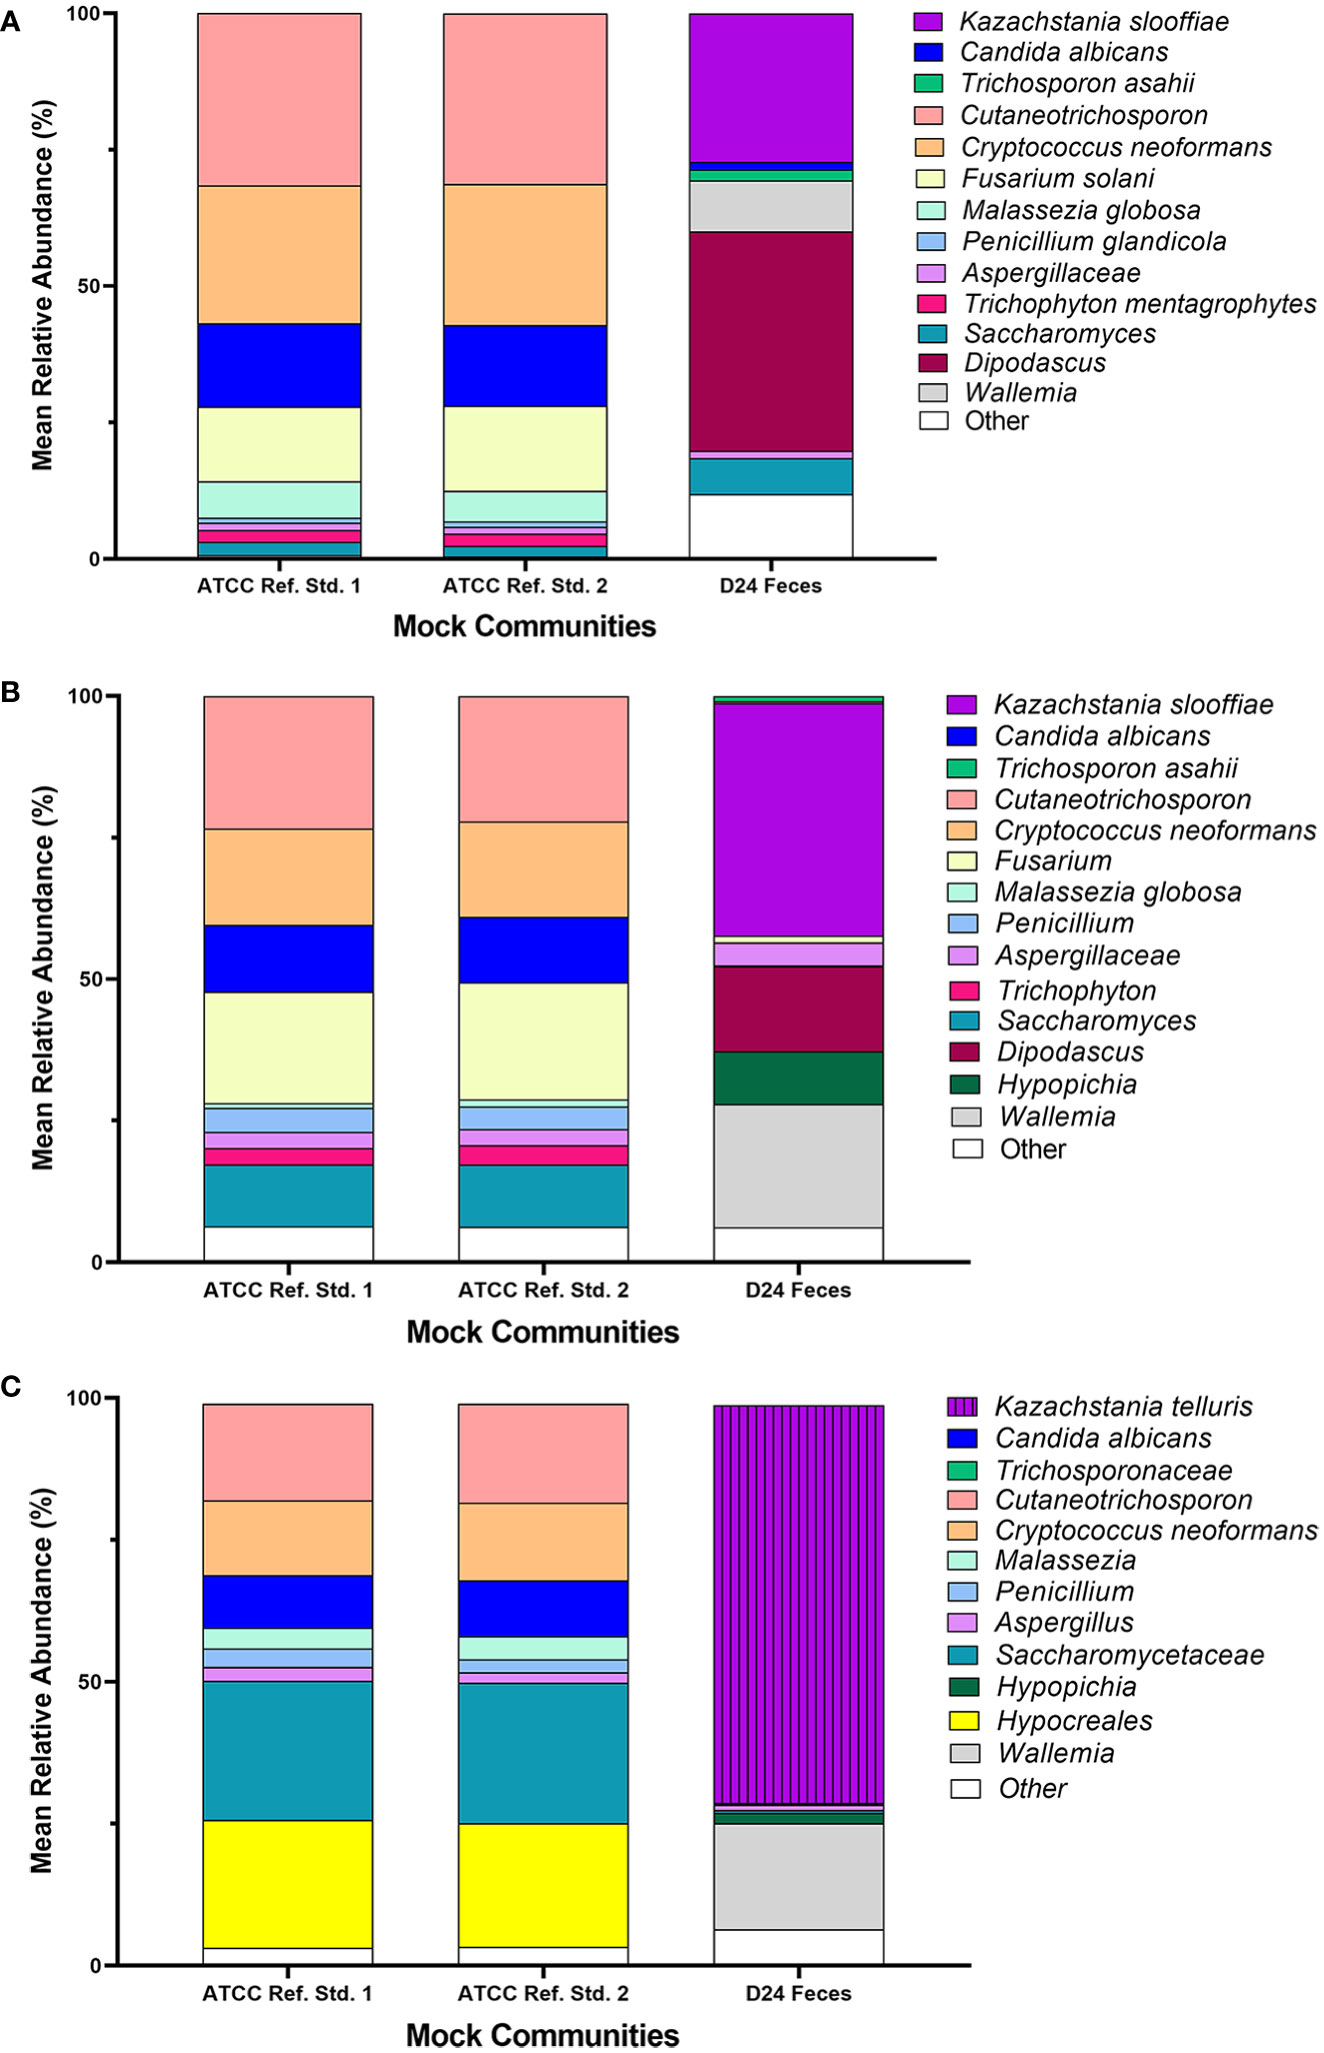
Figure 6 (A) ATCC Reference Standard Sequencing Results ITS1. Technical replicates of the ATCC mock fungal community (ATCC Reference Standard 1 and ATCC Reference Standard 2) and DNA extracted from piglet feces (D24 feces) were sequenced on a MiSeq Illumina platform utilizing ITS1 primers. The UNITE database was utilized to identify taxonomy of the population. (B) ATCC Reference Standard Sequencing Results ITS2. Technical replicates of the ATCC mock fungal community (ATCC Reference Standard 1 and ATCC Reference Standard 2) and DNA extracted from piglet feces (D24 feces) were sequenced on a MiSeq Illumina platform utilizing ITS2 primers. The UNITE database was utilized to identify taxonomy of the population. (C). ATCC Reference Standard Sequencing Results 18S. Technical replicates of the ATCC mock fungal community (ATCC Reference Standard 1 and ATCC Reference Standard 2) and DNA extracted from piglet feces (D24 feces) were sequenced on a MiSeq Illumina platform utilizing 18S primers. The SILVA database was utilized to identify taxonomy of the population.
Fecal community composition
For the Fecal community, the ITS1 library had the highest number of non-target ASVs (38.5%) followed by the 18S library (25.6%) (Figure 2A). The ITS2 library had the least number of non-target ASVs (7.5%). Of the non-target ASVs in the Fecal community, 17.2% ± 0.4 matched to Blastocystis sp. in the ITS1 library, 12.1% ± 0.1 matched to Glycine max in the ITS2 library, and 86.25% ± 0.1 matched to Blastocystis sp. in the 18S library using BLAST with the NCBI nt database.
At the family level, ITS2 overall showed more taxonomic richness (numerical count of different species) in the Fecal community compared to the other 2 libraries (Figure 2B). At the ASV level, ITS2 had the highest number of ASVs with 51 fungal ASVs found. 47 fungal ASVs were identified in the ITS1 library and 31 fungal ASVs were identified in the 18S library.
The ASVs from the L. corymbifera isolate were not detected in any of the Fecal samples for ITS1, ITS2 or 18S. ASVs from isolates T. asahii, C. albicans, P. fermentens, and K. slooffiae were identified in the ITS1 library for D24, while only ASVs from isolates from K. slooffiae and T. asahii were detected in the ITS2 and 18S library, with T. asahii representing <1% abundance in the 18S library.
Copy number bias
We estimated the copy number of each of the ITS or 18S regions within each fungal cell. To estimate the copy number of the ribosomal RNA gene within the genome of each fungal strain, qPCR assays were designed based on the genome sequence data available for each strain or the most closely related strain available. The copy number for each strain in the mock community demonstrated variability based on amplification region (Figure 7). While K. slooffiae demonstrated the most stable number of copy numbers of the five species analyzed (Figure 7C) the most variability was seen in L. corymbifera (Figure 7E). T. asahii had the most copy numbers on average across region amplified (Figure 7B) and P. fermentans displayed the fewest copy numbers (Figure 7D).
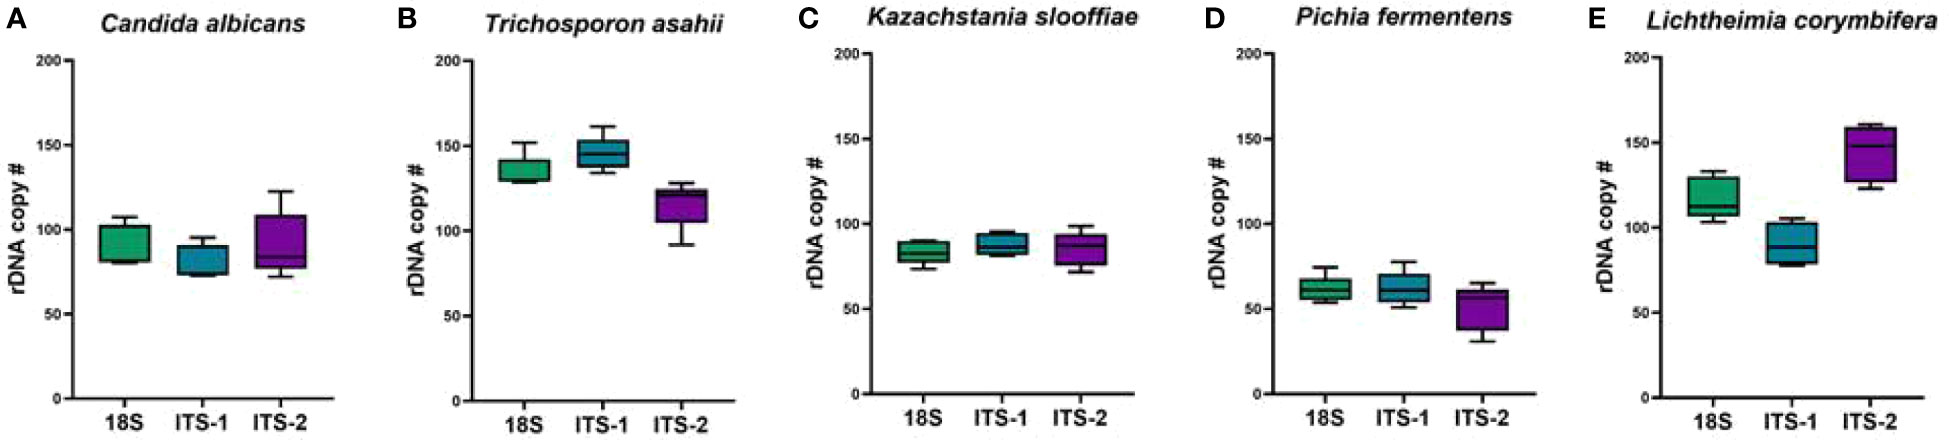
Figure 7 Estimated rDNA copy numbers. Primers targeting 18S, ITS1, and ITS2 were analyzed for copy number in each of the five fungal species utilized in the mock community. (A) Candida albicans, (B) Trichosporon asahii, (C) Kazachstania slooffiae, (D) Pichia fermentans and (E) Lichtheimia corymbifera.
Discussion
Fungi are considered part of the rare biosphere in the gut, due to their numerical inferiority compared to bacteria, but still play an important role in host health (Huffnagle and Noverr, 2013). Yet, relatively little information is available regarding the mycobiome, particularly in agricultural animals. Previous work suggests that the porcine mycobiome has a pattern of α-diversity that is distinct than that of the human gut bacteriome (Arfken et al., 2020), highlighting the need for more animal mycobiome studies. Fungal sequencing has lagged in part due to difficulties in DNA extraction protocols, primer design, database inaccuracies and missing data (Huffnagle and Noverr, 2013; Huseyin et al., 2017; Thielemann et al., 2022). Thus, technical studies which determine the most accurate sequencing protocols are needed to reduce biases and incorrect research results. In this study, we created a porcine fungal mock community for use in understanding potential biases in an Illumina MiSeq sequencing workflow. We analyzed this community, along with a commercial mock community, piglet fecal samples, and individual fungal isolates from piglet feces using a workflow which varied in the gene region targeted and the reference database.
We did not determine that a single marker and database combination correctly identified all species in the mock communities. In Mixed communities, ITS marker workflows correctly identified K. slooffiae, C. albicans, and T. asahaii, but L. corymbifera was not identified except in a single community by the ITS2 workflow, and P. fermentens was only identified to the order or phylum level. In contrast, the 18S + SILVA workflow correctly identified C. albicans, L. corymbifera, and P. fermentens, but K. slooffiae was identified as K. telluris, and T. asahaii was only identified to the family level. In ATCC Reference Standard communities consisting of 10 environmental species, workflow performance could be ranked as ITS2 > ITS1 > 18S, with the number of correct species identified as 6,4, and 2, respectively. In the Fecal community, the greatest percentage of fungal taxa were identified from ITS2 amplicons (92.5% ± 0.8), while only 74.3% ± 0.5 of the reads in the 18S library were fungi, and 61.9% ± 0.7 in the ITS1 library. The absence of L. corymbifera in Mixed communities is likely due to unequal amplification of species by ITS primers, as the species was correctly identified in the single isolate communities. The lack of detection of L. corymbifera is especially problematic in pig studies as it is often found in pre-weanling piglets. M. globera (Mucor is synonymous with Corymbifera) was not amplified by ITS2 primers in the ATCC Reference Standard community, although it was amplified in the 18S dataset, suggesting a potential ITS2 primer design issue for this genus.
The preferential amplification of certain species by some markers and not others has been previously described (Karlsson et al., 2017; Walder et al., 2017; Bakker, 2018) and Nilsson et al. demonstrated that primers are the driving factor in which fungal species will be identified in samples (Nilsson et al., 2019). In studies of environmental fungi, some primers have mismatches to certain classes of fungi including Saccharomycetes and Chytridiomycota. The ITS1 forward primer utilized in multiple studies found a 3’ terminal mismatch that lowers the efficacy of amplifying these classes, which provides ITS2 primers an advantage for sequencing Saccharomycetes (Tedersoo et al., 2015; Mbareche et al., 2020). One factor accounting for taxonomic identification differences between ITS1 and ITS2 primers is the presence of introns within primer sites. One documented phylum effected by intron presence is Ascomycota (Bhattacharya et al., 2000; Perotto et al., 2000). To avoid biases due to differential amplification, and increase taxonomic breadth of identified taxa, a dual-marker approach using both 18S and ITS has been proposed (Raja et al., 2017; D’Andreano et al., 2021). Given the complimentary species identifications observed here among the markers, this approach may be fruitful for porcine mycobiome studies.
Fungal marker gene lengths, particularly those of ITS regions, are variable, and marker length may affect both taxonomic assignments and abundance estimates. We detected a range of lengths in all three amplicons (Supplemental Table 5), which is in line with previous studies. For example, in the Ascomycota and Basidiomycota, complete ITS sequences (ITS1, ITS2, + 5.8) range in length from 600 to 900 bp (Toju et al., 2012). Longer amplicons may include a greater percentage of low-quality sequences compared to shorter amplicons, due either to quality reduction at the end of the read due to polymerase fall-off, or through a reduction in paired-end ligation which can also decrease sequence quality (Kircher et al., 2011; Rae et al., 2015; Amarasinghe et al., 2020). Furthermore, longer reads may be amplified at lower rates than shorter amplicons as some polymerases preferentially amplify shorter fragments (Reich and Labes, 2017). Some ITS2 primers, including the ones utilized in this study, include a portion of the 5.8 rRNA gene in the amplification of the ITS2 region, which results in a longer amplicon (Lindahl et al., 2013; Tedersoo et al., 2015; Tedersoo and Lindahl, 2016). Here, it is unclear whether longer sequences led to biases during amplification or sequencing. Suggested methods to avoid such complications are to dilute fungal DNA, keep PCR amplification cycle numbers low, and utilize high-fidelity polymerases with low GC bias (D'Amore et al., 2016; Gohl et al., 2016; Castle et al., 2018; Nilsson et al., 2019), thus future studies could include these steps.
Different marker genes may yield different numbers of ASVs, as was the case in our study. ITS2 sequences yielded the highest fungal richness as defined by the highest number of ASVs, 162, while 18S amplicons were the most conservative in fungal richness with 57 ASVs. The ITS region is more variable than 18S, and therefore it is not surprising that ITS markers yielded a greater number of ASVs (Nilsson et al., 2019). However, a greater number of ASVs may not indicate increased taxonomic resolution if observed variability does not correlate with new species or subspecies boundaries. Furthermore, sequence conservation can vary even within marker regions, and the selection of different primers amplifying these regions may impact amplicon variability, and thus the number of identified ASVs. Recently, Mbareche et al. assessed the performance of ITS1 and ITS2 primers in amplifying fungal species from bioaerosols and demonstrated that their chosen ITS1-targeting primers were most effective at detecting the most richness and taxonomic coverage (Mbareche et al., 2020).
The extent of off-target amplification varies across markers, with 92.5% ± 0.8 of ITS2 reads mapping to fungi, 74.3% ± 0.5 of 18S reads and 61.9% ± 0.7 of ITS1 reads. These results are in line with previous studies demonstrating the amplification of non-fungal taxa. Primers for ITS amplify protozoa such as Blastocystis (Martin and Rygiewicz, 2005; Bellemain et al., 2010; AbuOdeh et al., 2016; Stensvold and Clark, 2016) and Ciliophora (Summers and Arfken 2022), some bacterial species such as Escherichia coli and Bacteroides (Summers and Arfken 2022) and some Plantae, presumably from food sources (Summers and Arfken 2022). Off-target amplified species differ depending on whether ITS1 and ITS2 are employed (Summers and Arfken 2022). Kounosu et al., reported that commonly used 18S primers amplified bacterial 16S genes (Kounosu et al., 2019), while another found that their tested 18S markers did not amplify prokaryotic species (Hadziavdic et al., 2014). Non-fungi eukaryotic organisms may also be amplified by 18S primers (Liu et al., 2019).
Abundance estimates may also be affected by the choice of marker. In our study, relative abundance values derived from 18S amplicons best represented abundances of all fungal Mixed mock communities due in part to the accurate representation of L. corymbifera and Pichia (Figures 3–5). Abundances derived from ITS data were less accurate than those of 18S, with ITS1 data showing the lowest accuracy (Figures 3–5). Although input DNA for all species was equivalent, ITS based abundance profiles rarely represented each taxon in equal proportions. However, ITS primers most accurately represented the abundances of ATCC Reference Standard mock community species, with the exception of M. globosa. Regardless of primer choice, Malassezia and Aspergillus, both members of the Ascomycota, were underrepresented in all ATCC Reference Standard community samples (Figures 6A–C). It is not possible to determine which markers yielded the most accurate abundances in fecal samples, since real abundances are unknown. However, our previous culture-based studies have detected moderate levels of Aspergillus in piglet fecal samples, and here, only ITS2 detected a moderate level of Aspergillus (Figure 2).
In addition to marker gene selection, database choice is a critical factor in mycobiome analyses. The development of databases such as SILVA for 18S data and UNITE for ITS data has greatly facilitated the study of fungi, but additional effort is needed to develop these resources. Not all taxonomic groups are represented in the databases, which can result in an amplicon being either unclassified or misclassified. For example, K. slooffiae was identified as K. telluris in our 18S dataset, because K. slooffiae is not present in SILVA. Sequencing or other errors within database sequences can further introduce errors during the classification process. Lastly, sequences may be assigned incorrect taxonomic labels. Incorrect classification of species may also result in erroneous downstream interpretation of data. For example, estimates of community richness may be skewed. Current studies indicate that healthy animals have lower fungal α-diversity in the gut than bacterial α-diversity (reviewed in (Summers and Arfken, 2022)), but these observations may be due to missing database sequences. Thus, increasing the number and quality of database sequences should be a priority, and sequencing of both marker genes and whole genomes of uncharacterized fungi will advance these efforts.
In our study, we used two primary methods for fungal taxonomic identification: (1) a QIIME2 trained Naïve Bayes classifier with either the UNITE ITS or SILVA 18S database and a (2) traditional blastn search with the NCBI nr/nt database. The UNITE ITS classifications using a trained Naïve Bayes classifier in QIIME2 were more accurate than those based on SILVA 18S classification from Trichosporon and Kazachstania, but the trend was opposite for Pichia. The UNITE database was developed and is maintained specifically for the classification of fungi and eukaryotic organisms based on the ITS region, and thus, is likely more reliable for the most current and high-level fungal identification. While we selected to choose taxonomic workflows that were most often used in mycobiome analyses, running blastn against a stand-alone UNITE database with P. fermentans yielded the correct taxonomical identification, suggesting that the issue lies in the QIIME 2 classifier or taxonomic assignment, rather than the database. Search on BLAST with the NCBI nr/nt database were generally accurate for most of the fungal genera amplified with ITS1 and ITS2. The only exception was ITS1 T. asahii. The NCBI nr/nt database was not as useful for identifying 18S amplicons, however, due to multiple close database matches for isolates such as those closely related to Trichosporon and lacking representative sequences in the database, such as those for K. slooffiae. Based on our findings, the UNITE database targeting the ITS gene region is likely the best database for high-level fungal taxonomic identification. However, some fungal species may require more than one classifier/search method or require an additional database for accurate fungal classification.
Copy numbers were estimated for each fungal isolate by qPCR assays as previously published (Bakker, 2018). Each of the five isolates demonstrated variability in copy number for each amplification region. Overall, K. slooffiae had the most consistent copy numbers across 18S, ITS1, and ITS2 while L. corymbifera demonstrated the most variability. The fungal isolate with the most copy numbers across region amplified on average was T. asahii and P. fermentans had the fewest copy numbers. While T. asahii had the most copy numbers of the ITS1 region and outperformed K. slooffiae and L. corymbifera in the Mixed mock communities, it did not outperform C. albicans, suggesting that copy number does not result in a significant bias in our study. The level of T. asahii was not overabundant for ITS2 or 18S. While our copy number calculations are an estimate, we do not demonstrate correlation with copy number and abundances for these five fungal isolates.
Previous studies have demonstrated that K. slooffiae is the predominant fungi found in the GI tract and feces of post-weaning piglets (Urubschurov et al., 2008; Urubschurov et al., 2011; Urubschurov et al., 2017; Urubschurov et al., 2018; Arfken et al., 2019; Summers et al., 2019), and its genome contains multiple copies of ITS1 and ITS2 (Davies et al., 2021). This study indirectly assessed if the prevalence of K. slooffiae is an artifact of fungal sequencing biases found in mycobiome workflows. Our data demonstrate that 18S-based amplification with SILVA database analyses did not inflate or over-calculate the abundance of K. slooffiae in any of the mixed communities. Interestingly with ITS1 or ITS2 primers, K. slooffiae did not become overrepresented in any of the Mixed mock communities except for the dual community of mixed K. slooffiae and L. corymbifera, where L. corymbifera was not recognized in the workflow. Further, the estimated range of copy numbers of ITS1, ITS2, and 18S were lower than all other isolates except for P. fermentans. This data is especially useful in the porcine mycobiome field in confirming that the dominance of K. slooffiae in the swine gut is not over-assessed and may be, in fact, underestimated.
Our study has several caveats. Our study utilized five fungal isolates from piglet feces three days post-weaning. These isolates were chosen for their ability to be grown in vitro in the laboratory and therefore do not represent the entire fecal mycobiome of piglets (as represented in the fecal sample sequenced). We acknowledge that further isolates could be cultured, but our study was purposefully limited to five for simplicity of creating the Mixed mock communities. We cannot rule out the possibility that individual fungal colonies derived from piglet feces originated from a single, unique colony upon sequencing. In this case, the number of identified amplicons would be artificially inflated. It is also possible that sequencing errors resulted in a slight increase in the number of identified ASVs, as Illumina sequencing produces errors in 0.1% of nucleotides on average (Pfeiffer et al., 2018). Additionally, fungal genome size was not considered when creating mock communities, as genome sizes are unavailable or incomplete for all five of the fungal isolates and should be investigated further in the future. Genome size can be correlated with chromosome copy numbers in some species (Steenwyk and Rokas, 2018). However, to assess a potential copy number bias in this study, copy number ranges for 18S, ITS1, and ITS2 were estimated using qPCR assays (Figure 7). Future studies could utilize digital droplet PCR to perform a more targeted quantification or whole genome sequencing and annotation could result in more accurate copy number values.
Future studies should consider the utilization of multiple amplicon targets to determine whether this multi-step process improves the accuracy of taxonomic identifications and abundance estimates. A dual primer approach, using 18S and ITS primers have improved results of other fungal studies (Arfi et al., 2012; Reich and Labes, 2017; Banos et al., 2018). Additional studies should also address biases due to collection methods, storage conditions (10.1186/s40168-016-0186-x), DNA extraction technique (Enaud et al., 2018), as fungal cells walls are diverse and there is no current consensus on how to best extract DNA from all cells. Different primer pairs that target the same region could also be tested, as results may differ based on these choices.
This study demonstrates the importance of preliminary studies to evaluate biases present in amplicon-based sequencing workflows due to marker gene selection and database content. The use of appropriate mock community controls is a particularly useful strategy to differentiate true from biased results and should be utilized when possible. Ultimately, we did not identify one marker-database combination which outperformed all others, but instead observed strengths and weaknesses apparent in each combination tested. Thus, a dual-marker approach may be fruitful for pig mycobiome studies by sequencing 18S and ITS regions for optimal database information for taxonomic identifications. Careful consideration of the sample type and its potential fungal targeted populations are critical preliminary experimental design steps that assist in optimizing primer choices. Future studies of fungi in the gut, which minimize biases, will provide robust community profiles and provide opportunities to improve pig health through mycobiome manipulations.
Data availability statement
The datasets presented in this study can be found in online repositories. The names of the repository/repositories and accession number(s) can be found in the article/Supplementary Material. All sequences are publicly available (BioProject PRJNA693350).
Ethics statement
The animal study was reviewed and approved by USDA-ARS Institutional Animal Care and Use Committee of the Beltsville Agricultural Research Center. Written informed consent was obtained from the owners for the participation of their animals in this study.
Author contributions
AA, JF, and KS are responsible for substantial contributions to the study conception and design. KS, NC, ND, OO, and DR were responsible for animal sampling, data acquisition, and preliminary data analyses. AA and KS were responsible for bioinformatics and analyses. AA, JF, CD, and KS were responsible for drafting of the manuscript and critical revision of the manuscript. All authors contributed to the article and approved the submitted version.
Funding
All research was supported by internal funding provided by the USDA-ARS.
Conflict of interest
The authors declare that the research was conducted in the absence of any commercial or financial relationships that could be construed as a potential conflict of interest.
Publisher’s note
All claims expressed in this article are solely those of the authors and do not necessarily represent those of their affiliated organizations, or those of the publisher, the editors and the reviewers. Any product that may be evaluated in this article, or claim that may be made by its manufacturer, is not guaranteed or endorsed by the publisher.
Supplementary material
The Supplementary Material for this article can be found online at: https://www.frontiersin.org/articles/10.3389/fcimb.2023.928353/full#supplementary-material
References
AbuOdeh, R., Ezzedine, S., Samie, A., Stensvold, C. R., ElBakri, A. (2016). Prevalence and subtype distribution of Blastocystis in healthy individuals in sharjah, united Arab Emirates. Infect. Genet. Evol. 37, 158–162. doi: 10.1016/j.meegid.2015.11.021
Amarasinghe, S. L., Su, S., Dong, X., Zappia, L., Ritchie, M. E., Gouil, Q. (2020). Opportunities and challenges in long-read sequencing data analysis. Genome Biol. 21, 30. doi: 10.1186/s13059-020-1935-5
Amend, A. S., Seifert, K. A., Bruns, T. D. (2010). Quantifying microbial communities with 454 pyrosequencing: does read abundance count? Mol. Ecol. 19, 5555–5565. doi: 10.1111/j.1365-294X.2010.04898.x
Arfi, Y., Buee, M., Marchand, C., Levasseur, A., Record, E. (2012). Multiple markers pyrosequencing reveals highly diverse and host-specific fungal communities on the mangrove trees Avicennia marina and Rhizophora stylosa. FEMS Microbiol. Ecol. 79, 433–444. doi: 10.1111/j.1574-6941.2011.01236.x
Arfken, A. M., Frey, J. F., Ramsay, T. G., Summers, K. L. (2019). Yeasts of burden: exploring the mycobiome-bacteriome of the piglet GI tract. Front. Microbiol. 10, 2286. doi: 10.3389/fmicb.2019.02286
Arfken, A. M., Frey, J. F., Summers, K. L. (2020). Temporal dynamics of the gut bacteriome and mycobiome in the weanling pig. Microorganisms 8. doi: 10.3390/microorganisms8060868
Bakker, M. G. (2018). A fungal mock community control for amplicon sequencing experiments. Mol. Ecol. Resour 18, 541–556. doi: 10.1111/1755-0998.12760
Banos, S., Lentendu, G., Kopf, A., Wubet, T., Glockner, F. O., Reich, M. (2018). A comprehensive fungi-specific 18S rRNA gene sequence primer toolkit suited for diverse research issues and sequencing platforms. BMC Microbiol. 18, 190. doi: 10.1186/s12866-018-1331-4
Begerow, D., Nilsson, H., Unterseher, M., Maier, W. (2010). Current state and perspectives of fungal DNA barcoding and rapid identification procedures. Appl. Microbiol. Biotechnol. 87, 99–108. doi: 10.1007/s00253-010-2585-4
Bellemain, E., Carlsen, T., Brochmann, C., Coissac, E., Taberlet, P., Kauserud, H. (2010). ITS as an environmental DNA barcode for fungi: An in silico approach reveals potential PCR biases. BMC Microbiol. 10, 189. doi: 10.1186/1471-2180-10-189
Berruti, A., Desirò, A., Visentin, S., Zecca, O., Bonfante, P. (2017). ITS fungal barcoding primers versus 18S AMF-specific primers reveal similar AMF-based diversity patterns in roots and soils of three mountain vineyards. Environ. Microbiol. Rep. 9, 658–667. doi: 10.1111/1758-2229.12574
Bhattacharya, D., Lutzoni, F., Reeb, V., Simon, D., Nason, J., Fernandez, F. (2000). Widespread occurrence of spliceosomal introns in the rDNA genes of ascomycetes. Mol. Biol. Evol. 17, 1971–1984. doi: 10.1093/oxfordjournals.molbev.a026298
Black, J., Dean, T., Byfield, G., Foarde, K., Menetrez, M. (2013). Determining fungi rRNA copy number by PCR. J. Biomol Tech 24, 32–38. doi: 10.7171/jbt.13-2401-004
Bokulich, N. A., Robeson, M. S., Dillon, M., Kaehler, B., Ziemski, M., Rourke, D. O. '. (2020) 11. 'bokulich-lab/RESCRIPt.
Bolger, A. M., Lohse, M., Usadel, B. (2014). Trimmomatic: a flexible trimmer for illumina sequence data. Bioinformatics 30, 2114–2120. doi: 10.1093/bioinformatics/btu170
Castle, S. C., Song, Z., Gohl, D. M., Gutknecht, J. L. M., Rosen, C. J., Sadowsky, M. J., et al. (2018). DNA Template dilution impacts amplicon sequencing-based estimates of soil fungal diversity. Phytobiomes 2 100–107. doi: 10.1094/PBIOMES-09-17-0037-R
Chin, V. K., Yong, V. C., Chong, P. P., Amin Nordin, S., Basir, R., Abdullah, M. (2020). Mycobiome in the gut: A multiperspective review. Mediators Inflammation 2020, 9560684. doi: 10.1155/2020/9560684
Cui, L., Morris, A., Ghedin, E. (2013). The human mycobiome in health and disease. Genome Med. 5, 63. doi: 10.1186/gm467
D'Amore, R., Ijaz, U. Z., Schirmer, M., Kenny, J. G., Gregory, R., Darby, A. C., et al. (2016). A comprehensive benchmarking study of protocols and sequencing platforms for 16S rRNA community profiling. BMC Genomics 17, 55. doi: 10.1186/s12864-015-2194-9
D’Andreano, S., Cusco, A., Francino, O. (2021). Rapid and real-time identification of fungi up to species level with long amplicon nanopore sequencing from clinical samples. Biol. Methods Protoc. 6. doi: 10.1093/biomethods/bpaa026
Davies, C. P., Arfken, A. M., Foster Frey, J., Summers, K. L. (2021). Draft genome sequence of Kazachstania slooffiae, isolated from postweaning piglet feces. Microbiol. Resour Announc 10, e0019821. doi: 10.1128/MRA.00198-21
Eldred, L. E., Thorn, R.G., Smith, D. R. (2021). Simple matching using QIIME 2 and RDP reveals misidentified sequences and an underrepresentation of fungi in reference datasets. Front. Genet. 12. doi: 10.3389/fgene.2021.768473
Enaud, R., Vandenborght, L. E., Coron, N., Bazin, T., Prevel, R., Schaeverbeke, T., et al. (2018). The mycobiome: A neglected component in the microbiota-gut-brain axis. Microorganisms 6. doi: 10.3390/microorganisms6010022
Frau, A., Kenny, J. G., Lenzi, L., Campbell, B. J., Ijaz, U. Z., Duckworth, C. A., et al. (2019). DNA Extraction and amplicon production strategies deeply inf luence the outcome of gut mycobiome studies. Sci. Rep. 9, 9328. doi: 10.1038/s41598-019-44974-x
George, P. B.L., Creer, S., Griffiths, R. I., Emmett, B. A., Robinson, D. A., Jones, D. L. (2019). Primer and database choice affect fungal functional but not biological diversity findings in a national soil survey. Front. Environ. Sci. 7. doi: 10.3389/fenvs.2019.00173
Glockner, F. O., Yilmaz, P., Quast, C., Gerken, J., Beccati, A., Ciuprina, A., et al. (2017). 25 years of serving the community with ribosomal RNA gene reference databases and tools. J. Biotechnol. 261, 169–176. doi: 10.1016/j.jbiotec.2017.06.1198
Gohl, D. M., Vangay, P., Garbe, J., MacLean, A., Hauge, A., Becker, A., et al. (2016). Systematic improvement of amplicon marker gene methods for increased accuracy in microbiome studies. Nat. Biotechnol. 34, 942–949. doi: 10.1038/nbt.3601
Hadziavdic, K., Lekang, K., Lanzen, A., Jonassen, I., Thompson, E. M., Troedsson, C. (2014). Characterization of the 18S rRNA gene for designing universal eukaryote specific primers. PloS One 9, e87624–e87e24. doi: 10.1371/journal.pone.0087624
Halwachs, B., Madhusudhan, N., Krause, R., Nilsson, R. H., Moissl-Eichinger, C., Hogenauer, C., et al. (2017). Critical issues in mycobiota analysis. Front. Microbiol. 8, 180. doi: 10.3389/fmicb.2017.00180
Henrik, N. R., Kristiansson, E., Ryberg, M., Hallenberg, N., Larsson, K.-H. (2008). Intraspecific ITS variability in the kingdom fungi as expressed in the international sequence databases and its implications for molecular species identification. Evolutionary Bioinf. 4, EBO.S653. doi: 10.4137/ebo.s653
Herrera, M. L., Vallor, A. C., Gelfond, J. A., Patterson, T. F., Wickes, B. L. (2009). Strain-dependent variation in 18S ribosomal DNA copy numbers in Aspergillus fumigatus. J. Clin. Microbiol. 47, 1325–1332. doi: 10.1128/JCM.02073-08
Huffnagle, G. B., Noverr, M. C. (2013). The emerging world of the fungal microbiome. Trends Microbiol. 21, 334–341. doi: 10.1016/j.tim.2013.04.002
Huseyin, C. E., O'Toole, P. W., Cotter, P. D., Scanlan, P. D. (2017). Forgotten fungi-the gut mycobiome in human health and disease. FEMS Microbiol. Rev. 41, 479–511. doi: 10.1093/femsre/fuw047
Huseyin, C. E., Rubio, R. C., O'Sullivan, O., Cotter, P. D., Scanlan, P. D. (2017). The fungal frontier: A comparative analysis of methods used in the study of the human gut mycobiome. Front. Microbiol. 81432. doi: 10.3389/fmicb.2017.01432
Karlsson, I., Friberg, H., Kolseth, A. K., Steinberg, C., Persson, P. (2017). Agricultural factors affecting Fusarium communities in wheat kernels. Int. J. Food Microbiol. 252, 53–60. doi: 10.1016/j.ijfoodmicro.2017.04.011
Kircher, M., Heyn, P., Kelso, J. (2011). Addressing challenges in the production and analysis of illumina sequencing data. BMC Genomics 12, 382. doi: 10.1186/1471-2164-12-382
Kounosu, A., Murase, K., Yoshida, A., Maruyama, H., Kikuchi, T. (2019). Improved 18S and 28S rDNA primer sets for NGS-based parasite detection. Sci. Rep. 9, 15789. doi: 10.1038/s41598-019-52422-z
Lindahl, B. D., Nilsson, R. H., Tedersoo, L., Abarenkov, K., Carlsen, T., Kjoller, R., et al. (2013). Fungal community analysis by high-throughput sequencing of amplified markers–a user's guide. New Phytol. 199, 288–299. doi: 10.1111/nph.12243
Liu, C., Qi, R.-J., Jiang, J.-Z., Zhang, M.-Q., Wang, J.-Y. (2019). Development of a blocking primer to inhibit the PCR amplification of the 18S rDNA sequences of litopenaeus vannamei and its efficacy in crassostrea hongkongensis. Front. Microbiol. 10. doi: 10.3389/fmicb.2019.00830
Lofgren, L. A., Uehling, J. K., Branco, S., Bruns, T. D., Martin, F., Kennedy, P. G. (2019). Genome-based estimates of fungal rDNA copy number variation across phylogenetic scales and ecological lifestyles. Mol. Ecol. 28, 721–730. doi: 10.1111/mec.14995
Lücking, R., Aime, M.C., Robbertse, B., Miller, A. N., Ariyawansa, H. A., Aoki, T., et al. (2020). Unambiguous identification of fungi: where do we stand and how accurate and precise is fungal DNA barcoding? IMA Fungus 11, 14. doi: 10.1186/s43008-020-00033-z
Martin, M. (2011). Cutadapt removes adaptor sequences from high-throughput sequencing reads. EMBnet.journal 17, 10–12. doi: 10.14806/ej.17.1.200
Martin, K. J., Rygiewicz, P. T. (2005). Fungal-specific PCR primers developed for analysis of the ITS region of environmental DNA extracts. BMC Microbiol. 5, 28. doi: 10.1186/1471-2180-5-28
Mbareche, H., Veillette, M., Bilodeau, G., Duchaine, C. (2020). Comparison of the performance of ITS1 and ITS2 as barcodes in amplicon-based sequencing of bioaerosols. PeerJ 8, e8523. doi: 10.7717/peerj.8523
Nilsson, R. H., Anslan, S., Bahram, M., Wurzbacher, C., Baldrian, P., Tedersoo, L. (2019). Mycobiome diversity: High-throughput sequencing and identification of fungi. Nat. Rev. Microbiol. 17, 95–109. doi: 10.1038/s41579-018-0116-y
Nilsson, R. H., Kristiansson, E., Ryberg, M., Hallenberg, N., Baldrian, L., Karl-Henrik, L. (2008). Intraspecific ITS Variability in the Kingdom Fungi as Expressed in the International Sequence Databases and Its Implications for Molecular Species Identification. Evol. Bioinformatics 4. doi: 10.4137/EBO.S653
Perotto, S., Nepote-Fus, P., Saletta, L., Bandi, C., Young, J. P. (2000). A diverse population of introns in the nuclear ribosomal genes of ericoid mycorrhizal fungi includes elements with sequence similarity to endonuclease-coding genes. Mol. Biol. Evol. 17, 44–59. doi: 10.1093/oxfordjournals.molbev.a026237
Pfeiffer, F., Grober, C., Blank, M., Handler, K., Beyer, M., Schultze, J. L., et al. (2018). Systematic evaluation of error rates and causes in short samples in next-generation sequencing. Sci. Rep. 8, 10950. doi: 10.1038/s41598-018-29325-6
Quast, C., Pruesse, E., Yilmaz, P., Gerken, J., Schweer, T., Yarza, P., et al. (2013). The SILVA ribosomal RNA gene database project: Improved data processing and web-based tools. Nucleic Acids Res. 41, D590–DD96. doi: 10.1093/nar/gks1219
Rae, D. T., Collins, C. P., Hocum, J. D., Browning, D. L., Trobridge, G. D. (2015). Modified genomic sequencing PCR using the MiSeq platform to identify retroviral integration sites. Hum. Gene Ther. Methods 26, 221–227. doi: 10.1089/hgtb.2015.060
Raja, H. A., Miller, A. N., Pearce, C. J., Oberlies, N. H. (2017). Fungal identification using molecular tools: A primer for the natural products research community. J. Nat. Prod 80, 756–770. doi: 10.1021/acs.jnatprod.6b01085
Reich, M., Labes, A. (2017). How to boost marine fungal research: A first step towards a multidisciplinary approach by combining molecular fungal ecology and natural products chemistry. Mar. Genomics 36, 57–75. doi: 10.1016/j.margen.2017.09.007
Schoch, C. L., Seifert, K. A., Huhndorf, S., Robert, V., Spouge, J. L., Levesque, C. A., et al. (2012). Nuclear ribosomal internal transcribed spacer (ITS) region as a universal DNA barcode marker for fungi. Proc. Natl. Acad. Sci. U.S.A. 109, 6241–6246. doi: 10.1073/pnas.1117018109
Schubert, K., Groenewald, J. Z., Braun, U., Dijksterhuis, J., Starink, M., Hill, C. F., et al. (2007). Biodiversity in the Cladosporium herbarum complex (Davidiellaceae, Capnodiales), with standardization of methods for Cladosporium taxonomy and diagnostics. Stud. Mycol 58, 105–156. doi: 10.3114/sim.2007.58.05
Steenwyk, J. L., Rokas, A. (2018). Copy number variation in fungi and its implications for wine yeast genetic diversity and adaptation. Front. Microbiol. 9, 288. doi: 10.3389/fmicb.2018.00288
Stensvold, C. R., Clark, C. G. (2016). Current status of blastocystis: A personal view. Parasitol. Int. 65, 763–771. doi: 10.1016/j.parint.2016.05.015
Summers, K. L., Arfken, A. M. (2022). “The gut mycobiome and animal health,” in Gut microbiota, immunity (Springer). doi: 10.1007/978-3-030-90303-9
Summers, K. L., Frey, J. F., Ramsay, T. G., Arfken, A. M. (2019). The piglet mycobiome during the weaning transition: A pilot study. J. Anim. Sci. 97, 2889–2900. doi: 10.1093/jas/skz182
Tedersoo, L., Bahram, M., Polme, S., Anslan, S., Riit, T., Koljalg, U., et al. (2015). FUNGAL BIOGEOGRAPHY. response to comment on "Global diversity and geography of soil fungi". Science 349, 936. doi: 10.1126/science.aaa5594
Tedersoo, L., Lindahl, B. (2016). Fungal identification biases in microbiome projects. Environ. Microbiol. Rep. 8, 774–779. doi: 10.1111/1758-2229.12438
Thielemann, N., Herz, M., Kurzai, O., Martin, R. (2022). Analyzing the human gut mycobiome - a short guide for beginners. Comput. Struct. Biotechnol. J. 20, 608–614. doi: 10.1016/j.csbj.2022.01.008
Toju, H., Tanabe, A. S., Yamamoto, S., Sato, H. (2012). High-coverage ITS primers for the DNA-based identification of Ascomycetes and Basidiomycetes in environmental samples. PloS One 7, e40863. doi: 10.1371/journal.pone.0040863
Urubschurov, V., Busing, K., Freyer, G., Herlemann, D. P., Souffrant, W. B., Zeyner, A. (2017). New insights into the role of the porcine intestinal yeast, Kazachstania slooffiae, in intestinal environment of weaned piglets. FEMS Microbiol. Ecol. 93. doi: 10.1093/femsec/fiw245
Urubschurov, V., Busing, K., Souffrant, W. B., Schauer, N., Zeyner, A. (2018). Porcine intestinal yeast species, Kazachstania slooffiae, a new potential protein source with favourable amino acid composition for animals. J. Anim. Physiol. Anim. Nutr. (Berl) 102, e892–e901. doi: 10.1111/jpn.12853
Urubschurov, V., Janczyk, P., Pieper, R., Souffrant, W. B. (2008). Biological diversity of yeasts in the gastrointestinal tract of weaned piglets kept under different farm conditions. FEMS Yeast Res. 8, 1349–1356. doi: 10.1111/j.1567-1364.2008.00444.x
Urubschurov, V., Janczyk, P., Souffrant, W. B., Freyer, G., Zeyner, A. (2011). Establishment of intestinal microbiota with focus on yeasts of unweaned and weaned piglets kept under different farm conditions. FEMS Microbiol. Ecol. 77, 493–502. doi: 10.1111/j.1574-6941.2011.01129.x
Usyk, M., Zolnik, C. P., Patel, H., Levi, M. H., Burk, R. D. (2017). Novel ITS1 fungal primers for characterization of the mycobiome. mSphere 2. doi: 10.1128/mSphere.00488-17
Vainio, E. J., Hantulo, J. (2000). Direct analysis of wood-inhabiting fungi using denaturing gradient gel electrophoresis of amplified ribosomal DNA. Mycol. Res. 104, 927–936. doi: 10.1017/S0953756200002471
Walder, F., Schlaeppi, K., Wittwer, R., Held, A. Y., Vogelgsang, S., van der Heijden, M. G. A. (2017). Community profiling of Fusarium in combination with other plant-associated fungi in different crop species using SMRT sequencing. Front. Plant Sci. 8, 2019. doi: 10.3389/fpls.2017.02019
Wang, Q., Garrity, G. M., Tiedje, J. M., Cole, J. R. (2007). Naive Bayesian classifier for rapid assignment of rRNA sequences into the new bacterial taxonomy. Appl. Environ. Microbiol. 73, 5261–5267. doi: 10.1128/AEM.00062-07
White, T. J., Burns, T., Lee, S., Taylor, J. (1990). “Amplification and sequencing of fungal ribosomal RNA genes for phylogenetics,” in PCR protocols: A guide to methods and applications. Eds. Innis, M. A., Gelfand, D. H., Sninsky, J. J., White, T. J. (San Diego, California: Academic Press, Inc).
Keywords: fungi, mock community, microbiome, mycobiome, swine, pig, Kazachstania slooffiae
Citation: Arfken AM, Frey JF, Carrillo NI, Dike NI, Onyeachonamm O, Rivera DN, Davies CP and Summers KL (2023) Porcine fungal mock community analyses: Implications for mycobiome investigations. Front. Cell. Infect. Microbiol. 13:928353. doi: 10.3389/fcimb.2023.928353
Received: 25 April 2022; Accepted: 16 January 2023;
Published: 08 February 2023.
Edited by:
Veeranoot Nissapatorn, Walailak University, ThailandReviewed by:
Madis Metsis, Independent researcher, Tallinn, EstoniaScott W. Tighe, University of Vermont, United States
Riza Putranto, Indonesian Research Institute for Biotechnology and Bioindustry (IRIBB), Indonesia
Copyright © 2023 Arfken, Frey, Carrillo, Dike, Onyeachonamm, Rivera, Davies and Summers. This is an open-access article distributed under the terms of the Creative Commons Attribution License (CC BY). The use, distribution or reproduction in other forums is permitted, provided the original author(s) and the copyright owner(s) are credited and that the original publication in this journal is cited, in accordance with accepted academic practice. No use, distribution or reproduction is permitted which does not comply with these terms.
*Correspondence: Katie Lynn Summers, a2F0aWUuc3VtbWVyc0B1c2RhLmdvdg==