- 1Program in Speech-Language-Hearing Sciences, City University of New York, New York, NY, United States
- 2Haskins Laboratories, New Haven, CT, United States
- 3Department of Linguistics, Yale University, New Haven, CT, United States
Speech is notoriously variable, but our understanding of this variability continues to evolve. Variability has typically been taken as an indication of failure to reach a desired target due to physical or neurological limits. However, it is likely that some variability is beneficial, an effect that has been found in other domains. Part of the effort to separate beneficial from destructive variability must be to understand the distribution of values around a speech target. One aspect that is commonly measured is the standard deviation of some objective aspect of speech. The standard deviation is most meaningful for normal distributions, and the assumption in speech research has been that values are indeed normally distributed. This has not been rigorously tested, however, as the test of normality requires a large number of samples (some studies suggest a minimum of 200) to determine whether the data is normally distributed or not. Speech research (and, indeed, most research with humans) seldom reaches such numbers for a consistent environment. Here, an initial estimate for 300 repetitions of English words by a single speaker are presented. The words were pseudo-randomized with an equal number of filler items, so that immediate repetitions (and the neural and physical fatigue repetition can cause) were avoided. One hundred trials were collected on each of 3 days. Words were chosen to have very little coarticulatory influence (“heed,” “ode”/“owed”) or sizable coarticulatory influence (“geek,” “dote”). Measurements of vowel formants at acoustic midpoints indicated that the distributions were indeed normal. This was true even of the high coarticulatory environment, which some theories would predict would be skewed by the vowel's reaching the edge of an acceptable region. The current results indicate that vowel targets are consistent for different environments. Further, the range of the distributions was quite similar across the two types of environment, being, for example, about 100 Hz for F1. The amount of variability is fairly substantial but can be presumed to be beneficial, as all items were heard correctly. The normality of the distribution nonetheless indicates a control structure that accommodates the coarticulatory environment at the level of planning.
Introduction
Variability is a well-known feature of speech, as it is with other biological systems. Although excessive variability can signify lack of motor control, lack of variability can itself be pathological (e.g., Dinstein et al., 2015). Variability in input has been shown to be helpful in learning (e.g., Bradlow et al., 1997; Preston et al., 2018), and variability in production can give a range of options for adapting to novel situations (e.g., Ossmy et al., 2018).
A typical assumption is that variability is normally distributed; indeed, it is typical to the point that most studies do not explicitly state that assumption. The successful analysis of results in those studies suggests that the assumption is justified to a great extent. Although many statistical tests provide replicable results even when their requirements are violated (Lix et al., 1996), there are indications that other results can be greatly affected (Cain et al., 2017). Concerns over the effects of skew and kurtosis have motivated the move to linear mixed effects models (Baayen et al., 2008; Pouplier et al., 2017), but the meaning of the distributions themselves is not addressed by such analyses.
Non-normal distributions of data can indicate that more than one process is affecting the distribution [A normal distribution can arise from multiple sources if the samples are independent and identically distributed (central limit theorem)]. If the distribution is bimodal, then the single measurement under consideration may be treating two effects as if they were one. If there is skew in the distribution, there may be influences at work that need to be addressed. For statistical purposes, skew may invalidate some tests, such as ANOVA (e.g., Harwell et al., 1992). The more interesting effect is that it may indicate an influence on the behavior under study. The most common of these, of course, is a boundary effect, when the mean of a distribution is close to a physical limit, that is, when the standard deviation simply cannot extend as far as it would without the constraint. Both of these effects can be informative rather than a hindrance to analysis if they are examined on their own. That is one purpose of the present experiment.
In this study, we examined the pattern of articulatory variability in vowel targets for English. Although direct articulatory measurements are more readily obtained now than in previous years, they are still demanding in data collection and analysis, making them challenging for large-scale studies [though see discussion below of a physiological study in Tilsen (2017)]. Here, we needed many repetitions in order to examine the distributional characteristics of the productions, and so we, like many others, relied on the acoustic output to index the articulatory activity. Not only is the acoustic output reliably shaped by the articulation (Fant, 1960; Iskarous, 2010), there is also evidence that variability in the acoustic domain is highly related to the variability in the articulatory domain (Whalen et al., 2018). The use of acoustics therefore is a reasonable first step in analyzing production variability.
The focus here is on random variability, not structured variability, so we needed to focus on single targets. There is a great deal of structured variability due to vocal tract length, coarticulation, emotion, etc. (e.g., Best, 2015), and such variation is of great importance for understanding the entirety of the phonetic system. If it were possible to code all of those structured effects on formant values, we might be able to assess distributions from large speech corpora; the residual after removing the structured effects would be the unstructured variability. However, no corpora are annotated to that extent, and it may be that none ever will be. The number of systematic sources of variability is sizable and generally expanding as more studies are completed. Relying on our accurate account of those factors is not possible at present, given, for example, the relatively inaccurate methods for vocal tract normalization (e.g., Flynn, 2011). Thus, we relied on multiple repetitions of non-contextualized words by a single speaker.
The level of variability due to motor noise and other intrinsic factors must be examined with productions that lack, to the extent possible, structured variability. “Intrinsic” factors are here conceptualized as distinct from structured ones, and they would include such variables as arousal state, location in the breath cycle, and changes in the motor program (either “intentional” or not). The boundary between intrinsic and systematic is not firm, however, and they may not really affect variability differently. We nonetheless wanted to avoid as many factors unrelated to the motor program as we could. To that end, we elicited multiple repetitions of target words so that, ideally, only variability in motor planning and execution remained. Fatigue of motor systems in sustained repetition is well-attested even if the underlying cause (central nervous system, the neuromuscular junction, or metabolic changes in the muscle fiber) is difficult to ascertain (e.g., Bigland-Ritchie, 1981). Thus, the paradigm of having a speaker produce many repetitions of a word [such as the 1,000 sequential repetitions of the word “bucket” in Kello et al. (2008)] can be expected to induce variability based on sheer physical and neural fatigue that are not relevant to understanding what speakers do when they are producing their ideal version of a word. We therefore collected our target words in lists which contained an equal number of filler items, allowing the neurons and muscles to reset between productions.
Direct instructions to eliminate variability do not appear to be successful and may even be counterproductive. In a study of multiple repetitions of target items, Tilsen (2017) provided feedback about consistency in an attempt to eliminate variability. It failed: Speakers continued to have variability, and the variability was structured across independent motor systems. For our purposes, the results indicated that providing feedback about individual productions was not effective in eliminating variability and therefore increased the cognitive load on the speaker without necessarily modifying the speaker's behavior. We therefore strove for consistency simply by asking the speaker to be consistent.
Formant measurements are known to be influenced by fundamental frequency (F0), but large datasets require automatic measurements that currently include such influences. Vowels are well-described by the formants (Fant, 1960), but it is really the resonances that are the true object of interest (Titze et al., 2015). Acoustic formant analysis tends to follow the most intense harmonic near a resonance (F0-effect) (Klatt, 1986; Shadle et al., 2016), but listeners respond to the true resonances, not the measured formants (Klatt, 1986). In the present study, we found that F0 effects were minimal due to the great consistency of F0 by our speaker, so that automatic measurements of formants were usable.
Many tokens are required to analyze the distribution of variability, but studies of speech seldom obtain the required amount. If 20 tokens are collected, we can obtain a fairly defensible estimate of the central tendency (mean) of the distribution, but a sample of only 20 tokens will almost always appear to be normally distributed, even if the true distribution is not normal. Mardia (1970) found that there was more than twice as much evidence for either atypical skewness or kurtosis when the sample size exceeded 106 (46 vs. 94%), indicating that large samples are needed for these measures. In a simulation of models with many parameters, Lerche et al. (2017) found that 200 trials provided good estimations for three- and four-parameter models (p. 522). These are not exact matches to the current experiment, but they give an indication of how many trials can be expected to give solid results. Thus, a sample size of 200 should provide good evidence of distributional properties; we oversampled by obtaining 300 repetitions.
Two environments were studied, allowing us to study intrinsic variability in two extrinsic changes in coarticulation. The first was an /(h)Vd/ environment, which has been shown to have small if any effects on vowel midpoint formant measures in comparison to isolated vowels (Stevens and House, 1963; Ohde and Sharf, 1975). The second was an environment of consonants that differed maximally from the vowel's position, that is [g_k] for [ij] (“geek”) and [d_t] for [ow] (“dote”).
Our first analysis contrasts two hypotheses about the effect of coarticulation on the distribution of formant values. The first hypothesis, based on the “window” model of coarticulation (Keating, 1990) is that a neutral environment would have small skewness values while a coarticulated one would have larger skewness. The alternative model, labeled more generically as the non-window model, predicts non-skewed distributions for both environments. The rationale for this can be seen in Figure 1. The window model hypothesizes that the planning stage contains no central target for a segment, only a range (the window) of variability. The implementation is then the result of an interpolation process that finds an optimal path through connected windows with minimum articulatory effort. A window is defined as a pair of minimum and maximum values in a physical dimension that the observed productions are bounded by Keating (1990, pp. 455–456). Thus, a boundary effect on the skewness of distribution should occur if the path from one window to another is most easily accomplished by moving close to an edge. The predictions of Guenther's (1995) “convex region theory” would seem to be the same as the window model's, because the region is meant to be sufficient for the production of a target. His regions are multidimensional and include somatosensory space, so the acoustic predictions are not straightforward. Nonetheless, because the theory is meant to account for such features as vowel reduction (undershoot) (Lindblom, 1963, 1983), it would seem that it would make the same prediction as the window model in this case: Vowels must enter the convex region to be successful, so there should be few productions outside the convex region. Productions that enter the region more deeply will also be successful, but less common. Formant values would therefore be expected to show a skewed distribution. A further complication is that segments have somatosensory targets as well as acoustic ones, resulting in separate error calculations for each (e.g., Terband et al., 2009). Whether this later interaction would affect the distribution has not been tested.
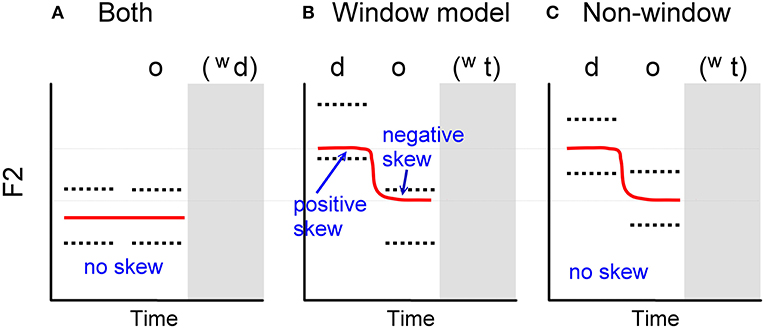
Figure 1. Predictions of skewness in the F2 distributions. Red solid lines are the predicted central tendency of F2 trajectories. Black dotted lines are the hypothesized target ranges. (A) Prediction by both the window model and non-window hypothesis for /owd/. (B) Prediction by the window model for /dowt/. (C) Prediction by non-window hypothesis for /dowt/ from the onset to the end of /o/. The offglide /w/ and the stop coda parts are omitted.
Figure 1 shows, schematically for F2 alone, the executed path of F2 (red solid lines) for /owd/ and /dowt/, necessarily the same in both the window model and the opposing non-window model. Hypothetical resultant F2 trajectories are shown from the onset of the syllable to the end of the first component of the vowel (omitting the offglide /w/ and the stop coda). The difference in the models is the control parameters, shown by the black dotted lines (the range of target). For the window model, this range defines planning parameters that are the same regardless of context. For the non-window model, this range represents a confidence interval of a normal distribution generated by, for example, a non-linear dynamical system (Saltzman and Munhall, 1989). For /owd/ (Figure 1A), both the window and non-window models predict that the F2 trajectory will concentrate in the middle of the target range without skewness. For /dowt/, the window model predicts that the F2 trajectory in the onset will accommodate the desired minimum effort by being toward the lower boundary of the target range, resulting in positive skew. In the middle of /o/, the skewness will be negative as the path enters the upper part of the range (Figure 1B). The non-window model predicts that the F2 distributions for /dowt/ should be normal throughout the whole trajectory (Figure 1C). Note that the two predictions have the same central tendency of the output trajectory but different predicted patterns of skewness. This is because the target range for a segment in the window model is always the same in all contexts, while in the non-window model the target range can be variable in different contexts as the result of gestural interactions. We chose /o/, despite its known diphthongal offglide (Pike, 1947), because the mid vowels have less chance of abutting a physiological limit, as we expect for /i/.
The second hypothesis is that /i/ should exhibit formant distributions that are somewhat skewed (i.e., positive skew in F1), given that the constriction for /i/ is limited as it approaches the hard palate.
Formants for vowels are rarely stable throughout the vocalic segment, whether the vowel is perceived as diphthongal or not (Hillenbrand and Nearey, 1999). Our analysis examines both the midpoint of the vocalic segment, often seen at the target of the vowel, and the trajectories as well.
Experiment
Many repetitions of linguistic utterances are needed to address the issue of the normality of the distributions of vowel formants. This need dictated that the target words be produced in isolation so that the recording sessions would be short enough to be tolerable by the speaker. Filler items were needed to avoid excessive repetition and its concomitant shift in neural and muscular response.
Method
Speaker
The speaker was a native speaker of American English. He is a trained phonetician as well as an instructor for the singing voice. He provided written informed consent as approved by the CUNY University Integrated IRB (City University of New York).
Materials
The target words were “heed,” “geek,” “owed”/“ode,” and “dote.” The homophones “owed” and “ode” were used as a condition for the experiment that was addressed by the filler items (not discussed here). Results for those items will be presented both separately and combined. Filler words were 25 homophones such as “air”/“ere” and “plain”/“plane.”
Procedure
Recordings were made in a sound-attenuated booth at the Graduate Center of the City University of New York (CUNY). A free-field microphone (PCB Piezotronics 482C16) with built-in pre-amp (PCB Piezotronics 378B02) was used. An AD Instruments Power Lab (8/35-1008) data acquisition device with a Dell Optiplex 9010 computer processed signals, which were sampled at a rate of 44.1 kHz.
Recordings were made on 3 separate days, separated by 4 months in the first case and 18 months in the second. Each target word (or two words, in the case of “ode”/“owed”) occurred 100 times in the randomized list for each day. Each group of 8 items contained one example of each target word (with “ode” and “owed” randomly assigned) along with 4 filler items. The 50 filler items were randomized twice, once for the first half of the session and another time for the second half.
Words were presented in standard orthography, one at a time, on a computer screen controlled by the Presentation program (https://www.neurobs.com/).
Measurements
The recorded audio files were downsampled to 16 kHz and forced-aligned via FAVE-align tool (Rosenfelder et al., 2014), then manually corrected when necessary. Formant frequencies were measured by the Burg method of linear predictive coding (LPC) (window size = 45 ms; step size = 2 ms, number of poles = 14, pre-emphasis from 50 Hz; Nyquist frequency = 5,000 Hz) with Viterbi tracking using Praat (Boersma and Weenink, 2019). The tracked formant frequencies were time-normalized into 11 points, representing measurements from 0 to 100% in steps of 10%.
Statistics
We carried out univariate normality tests on static formant values, separately for each word produced in each day. We ran the Shapiro et al. (1968) tests of skewness and kurtosis using the “normtest” package in R, taking F1 and F2 as separate dependent variables. To control for the inflation of Type I error due to multiple hypothesis testing, p-values of normality tests were adjusted by Benjamini and Hochberg's (1995) approach of “False Discovery Rate” (FDR). To predict the dynamic formant patterns from the data, we fit a Smoothing Spline ANOVA (SSANOVA) (Gu, 2002) model by adding “Context” and “Time” factors and their interaction, with a random effect of “Day,” separately for each vowel and each formant.
Results
Vowel Midpoint
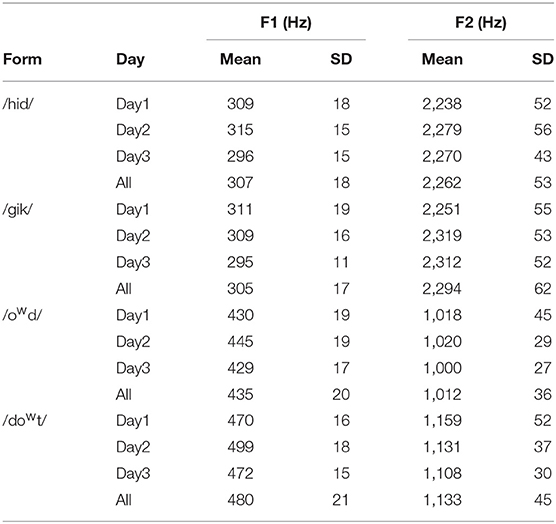
In order to make the initial analysis tractable, a single time point was used: 50% of the duration of the vocalic segment. Table 1 summarizes the formant values along with their standard deviations (SDs). Results are shown for the 3 recording days separately as well as for the four forms (/hid/, /gik/, /owd/, and /dowt/) across days. Values for “ode” and “owed” are combined in the form /owd/.
Distributions and Normality Tests
Normality of the formant distributions was tested statistically, but it can also be visually represented by the kernel density estimation (KDE). Figure 2 presents the distributions of F1 (left column) and F2 (right column) for the four forms (in each row) separately for each day (Day 1: blue solid lines; Day 2: red dotted lines; Day 3: green dashed lines). As can be seen in Figure 2, the distributions were quite regular for each day (i.e., 100 repetitions of each target form), but each day was somewhat different. From Figure 2, we can observe skewness on F2 distribution for /gik/ and /owd/ produced in Day 1 and for /hid/ in Day 2, as well as on F1 distribution for /gik/ in Day 3. Table 2 summarizes the statistics of the moment coefficient of skewness and the excess kurtosis based on the distributions of F1 and F2 values measured at the vowel midpoint (Figure 2). Excess kurtosis is calculated as kurtosis (the fourth moment) minus three. The expected values for both skewness and excess kurtosis are zero for a normal distribution. Positive values of skewness indicate that the distribution was higher than the mean more often than expected (longer tail in higher frequency). An absolute value of skewness >1 is considered as highly skewed, and an absolute value in between 0.5 and 1 indicates moderately skewed. Positive excess kurtosis indicates the distribution is “skinnier” than a normal distribution with “fatter” tail presumably due to outliers, while negative excess kurtosis indicates the opposite. The indications of significance symbols were based on the p-values adjusted by Benjamini and Hochberg's (1995) FDR method for each block. For example, in the top-left block (F1 for /hid/) of Table 1, the six p-values (not shown) for the tests of both skewness and kurtosis in the 3 days were entered into FDR-adjustment; the (family-wise) null hypothesis is that none of the six statistics came from a normal distribution; any one FDR-adjusted p-value in a block that meets the significance level suggests rejection of such null hypothesis. The statistics in Table 2 showed that the distribution of F1 for /gik/ produced in Day 1 and those of F2 for /gik/ and /owd/ produced in Day 1 are significantly skewed, which conformed to the shapes of distributions observed in Figure 2.
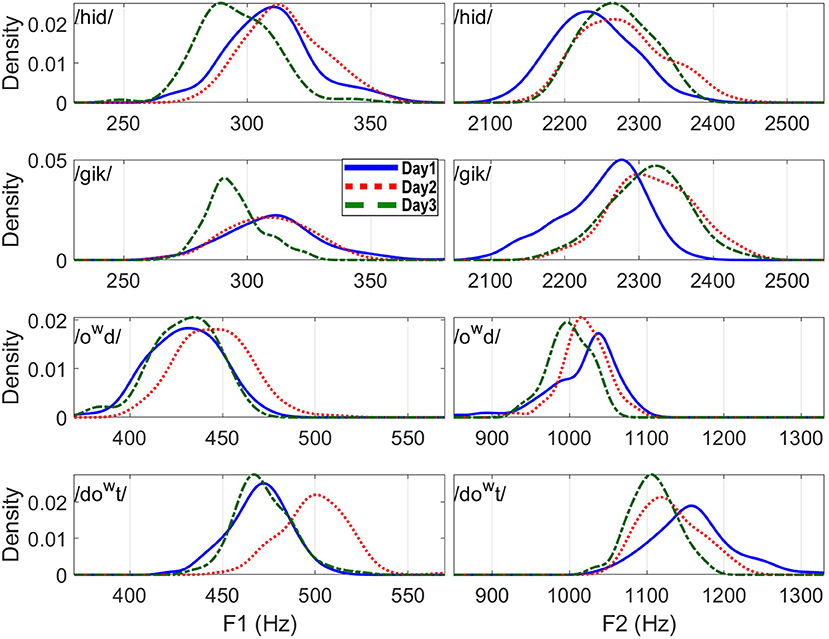
Figure 2. F1 and F2 distributions for the four words (measured at the vowel midpoint) separately for each day.
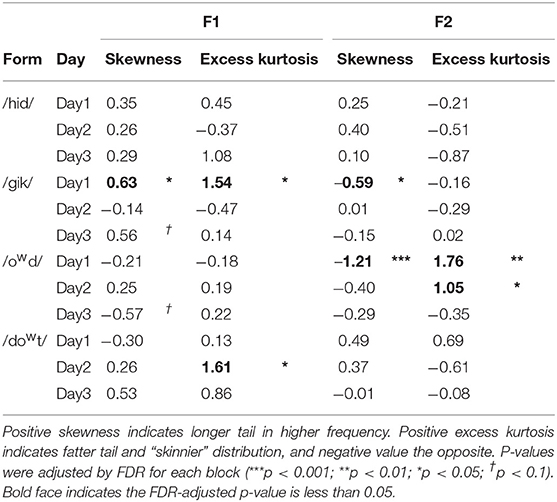
Table 2. Moment coefficients of skewness and excess kurtosis (the fourth moment minus 3) for F1 and F2 measured at the vowel midpoint.
The dynamic pattern of skewness makes the evidence for an effect on the distributions even less likely. In Figure 3, skewness is calculated for each of the 11 time points of the time-normalized data. Solid circles indicate significant skewness while empty circles non-significant. Significance was based on FDR-adjusted p-values across 11 points of skewness separately for each day and for each formant, with a family-wise null hypothesis as none of the measured values of skewness in the 11 points conforms to normal distribution. Because the consonant(s) at the syllable boundary should have windows of their own, the skew could be expected to change over the course of the syllable, perhaps with a midpoint differing from both ends. Such a pattern is seen for F2 of /owd/ on day 1. However, two aspects of that pattern are inconsistent with our predictions: The onset of /owd/ should not be skewed, given that the target can be achieved from the beginning of the utterance. Even if there were an explanation for the presence of the skew, there is no obvious reason that the skew would not be present throughout the vocalic segment (up until the transitions for the final stop). Days 2 and 3, as can be seen, had radically different patterns; there is no clear interpretation for the differences. In short, whatever was skewing some of the formant distributions on some days was not systematic enough to be explained by either the window model or by the non-window model (see Figure 1).
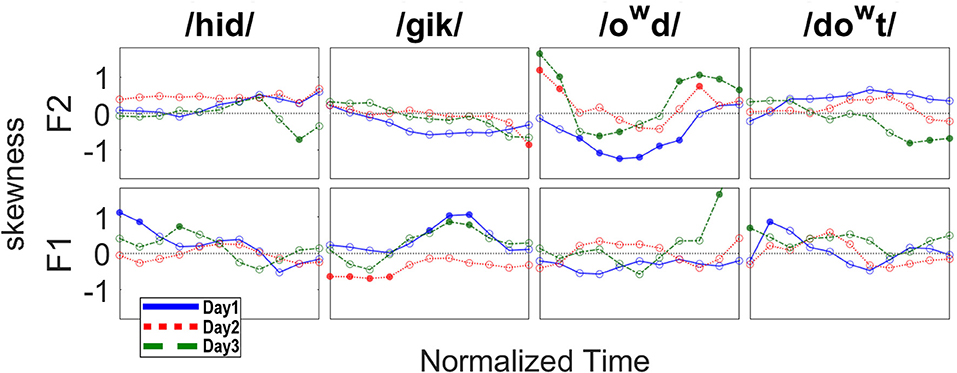
Figure 3. Skew values for each time point, separately by day (1 = blue, 2 = red, 3 = green). Solid circles indicate significant skewness (significance level set at 0.05).
Figure 4 further visualizes the distributions of formant frequencies for all time points. Each gray-scaled contour represents the KDE-estimated probability density function (as those distributions displayed in Figure 2) at each time point; darker color indicates higher probability. Red crosses track the means of the distributions along the time course, and blue circles the mode (estimated by measuring the peak of probability density function) of distributions. The difference between mean and mode is known as the nominator of Pearson's mode skewness [(mean–mode)/SD]: If the mean is higher than the mode, it indicates positive skewness, which is a conservative visualization of the direction of skewness. Note that mode skewness may not be perfectly consistent with moment coefficient of skewness (as in Table 2). Figure 4 is largely consistent with Figure 3 and provides more information of probability distributions of formant values at each time point.
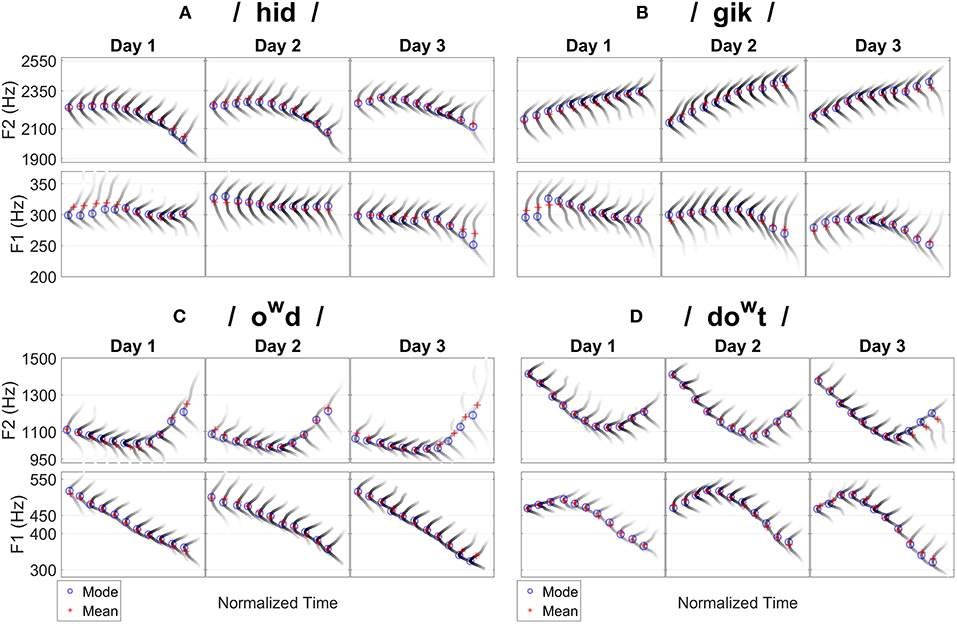
Figure 4. Probability distributions of F1 and F2 measured at all the time points for the four words separately for each day. Each gray-scaled contour represents the probability density function estimated at one time point; darker color indicates higher probability. Red crosses track the means of distributions and blue circles track the modes (peak). Difference between mean and mode indicates the direction of skewness. (A) /hid/. (B) /gik/. (C) /owd/. (D) /dowt/.
Dynamic Formant Patterns
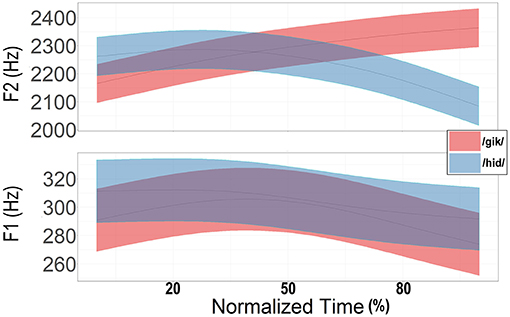
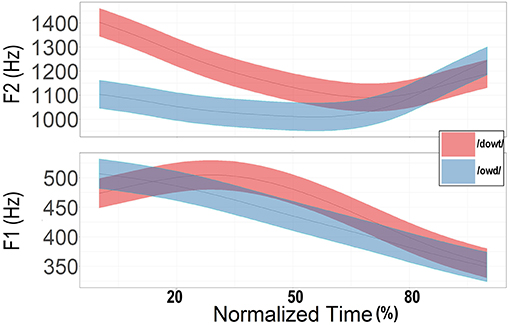
The changes in formant location for the words across all 3 days were examined. The time-normalized values were used. A smoothing spline ANOVA (SSANOVA) was computed separately for F1 and F2 for /hid/ vs. /gik/ (Figure 5) and for /owd/ vs. /dowt/ (Figure 6). In such displays, the 95% Bayesian confidence intervals (shown in color around the mean formant values) are assumed to be statistically different when they do not overlap. The amount of divergence that is needed before the result is “significant” is debatable, but the existence of a visually distinct region suggests that the trajectories do differ in some ways. As can be seen in Figures 5, 6, the first two formants were constantly changing, leaving no portion that was truly “steady-state.” Indeed, inclusion of such minor variability has been shown to improve identification of synthetic versions of the target vowels (Hillenbrand and Nearey, 1999). Other predictable aspects appeared. A separate SSANOVA (not presented here) comparing the homonyms “ode” and “owed” showed that they were, indeed, virtually identical. The formants for the shared alveolar stop at the end of the /ow/ words converged (Figure 6). The formants for the distinct places of articulation of the final stops for the /i/ words diverged (Figure 5). F2 was distinguished at the final portion of the trajectory in Figure 5 and the first half of the trajectory in Figure 6. What was perhaps somewhat surprising was the overall dissimilarity of F1 for the two contexts for the /ow/ words but not for the /i/ words. Still, the differences were small (45 Hz for /ow/ words, and 2 Hz for /i/ words at the midpoint).
Although “geek” was intended to have velar productions on either side of the vowel, the low F2 values at onset indicate that this speaker used a very fronted place of articulation for the initial stop. Thus, the F2 pattern was quite linear, while the F2 of “dote” (Figure 6) behaved as intended. The vowel of “ode”/“owed” was, as expected, rather diphthongal, with F1 changing by about 65 Hz from time points 4 to 8 (the likely limits of coarticulatory effects of the stop). The vowel of “heed,” by contrast, changed by about 10 Hz over those same time points.
Discussion
Multiple repetitions of English words in a fairly isolated state were found to have formants that were only slightly different from normality. Having a sizable number of tokens is necessary for such an analysis, but the biological constraints on speakers make collection challenging. Here, we reduced the constraints as much as possible by interleaving the tokens with filler items, but that limited us to collecting 100 repetitions in any one session. As can be seen in Figures 2, 3, the formants obtained were quite consistent within those sessions; the small differences across sessions were smaller than the likely measurement error of the LPC analysis. Although changes in articulation across different days or even time of day (Heald and Nusbaum, 2015) have been reported before, the differences here are negligible.
The window model hypothesis that coarticulation would skew the distributions was not supported, while the non-window model was consistent with the lack of skewness. The trajectories were normally distributed not only near the midpoint of the vocalic segment, but throughout the production (Figures 3, 4). Such a result is inconsistent with the “window” model in which the motor plan contains only target regions and not trajectories; in execution, segments reach the edge of one target region before moving on to the next (Keating, 1990). It is consistent with non-window model in which a motor plan takes the entire context into account from the beginning; overlapping activations for the gestures or segments then unfold in execution in such a way that variability is structured by the interactions of the overlapping control parameters of gestures or segments.
The second hypothesis, that the /i/ formants would have skewed distributions because of the boundary effect of the hard palate, was not supported. Not only were there very few individual time points with significant skew, there was no discernable pattern to the skew either. For this speaker, at least, the constraints on articulation of the high front vowel were well-accommodated, so that the distributions of formants were unaffected by the physiological limits. Standard deviations were small but non-negligible (at midpoint, for /i/, 5.8% for F1, 2.3% for F2; for / ow/, 4.6% for F1, 3.8% for F2). It would seem that there is enough variability for a skewed distribution to be evident, if it were present. Instead, the formant distributions appear to be normal through the duration of the syllable.
Future studies are desirable to explore these issues further. Only one speaker was analyzed here, and he was chosen in part for his many years of practice and instruction in broadcast speaking. The resulting consistency was useful for having manageable amounts of variability, but less skilled speakers may show different patterns. Indeed, the kinds of variability that result may differ by such factors as speech sound disorder or speaking in a second language. Other acoustic or articulatory measures could be made, although the strongest predictions in the field have been about formant values. Measuring variability across the vowel system rather than for just two vowels would be useful (Whalen et al., 2018), although the number of tokens required becomes rather large. Finding word tokens that maintain the voicing of the final consonant would also be desirable. Other statistical approaches, such as Generalized Additive Mixed Models, may provide further insight.
Overall, the results for this speaker support the use of statistics that rely on normal distributions for analyzing formant values. As such, the results also support the use of Gaussian priors in Bayesian linear mixed models (Vasishth et al., 2018). Using the results of a single speaker has intrinsic drawbacks, so the current results can only be preliminary. Further, the formant values themselves are subject to many measurement errors (Klatt, 1986; Shadle et al., 2016), but, within those limits, estimation of the central tendencies for formants are relatively good, at least for F0s <200 Hz (Chen et al., 2019). The present data did not support models that assume target regions; instead, entire trajectories were normally distributed throughout the vocalic segment. Variable productions, therefore, appear to be variable in their global shape, not just in their relationship to local targets.
Data Availability
All datasets generated for this study are included in the manuscript/Supplementary Files.
Ethics Statement
The study was reviewed and approved by the CUNY University Integrated IRB. Written and informed consent was obtained from the participant.
Author Contributions
DW contributed conception and design of the study and wrote the first draft of the manuscript. W-RC organized the database, performed the statistical analysis, and wrote sections of the manuscript. DW and W-RC contributed to manuscript revision, read, and approved the submitted version.
Funding
Research was supported by US NIH grant DC-002717 to Haskins Laboratories.
Conflict of Interest Statement
The authors declare that the research was conducted in the absence of any commercial or financial relationships that could be construed as a potential conflict of interest.
Acknowledgments
We thank Jason Shaw, Adamantios I. Gafos and two reviewers for helpful comments, and Richard Lissemore, Vilena Livinsky and Grace Kim-Lambert for technical assistance.
Supplementary Material
The Supplementary Material for this article can be found online at: https://www.frontiersin.org/articles/10.3389/fcomm.2019.00049/full#supplementary-material
References
Baayen, R. H., Davidson, D. J., and Bates, D. M. (2008). Mixed-effects modeling with crossed random effects for subjects and items. J. Memory Language 59, 390–412. doi: 10.1016/j.jml.2007.12.005
Benjamini, Y., and Hochberg, Y. (1995). Controlling the false discovery rate: a practical and powerful approach to multiple testing. J. R. Stat. Soc. Ser. B 57, 289–300. doi: 10.1111/j.2517-6161.1995.tb02031.x
Best, C. T. (2015). “Devil or angel in the details? Perceiving phonetic variation as information about phonological structure,” in The Phonetics-phonology Interface: Representations and Methodologies, eds J. Romero and M. Riera (Amsterdam: John Benjamins, 3–31.
Bigland-Ritchie, B. (1981). EMG/Force relations and fatigue of human voluntary contractions. Exer. Sport Sci. Rev. 9, 75–118. doi: 10.1249/00003677-198101000-00002
Boersma, P., and Weenink, D. (2019). Praat: Doing Phonetics by Computer [Computer program] (Version 6.0.49). Retrieved from: http://www.praat.org/
Bradlow, A. R., Pisoni, D. B., Akahane-Yamada, R., and Tohkura, Y. (1997). Training Japanese listeners to identify English /r/ and /l/: IV: some effects of perceptual learning on speech production. J. Acoust. Soc. Am. 101, 2299–2310. doi: 10.1121/1.418276
Cain, M. K., Zhang, Z., and Yuan, K. H. (2017). Univariate and multivariate skewness and kurtosis for measuring nonnormality: prevalence, influence and estimation. Behav. Res. Methods 49, 1716–1735. doi: 10.3758/s13428-016-0814-1
Chen, W. R., Whalen, D. H., and Shadle, C. H. (2019). F0-induced formant measurement errors result in biased variabilities. J. Acoust. Soc. Am. 145, EL360–EL366. doi: 10.1121/1.5103195
Dinstein, I., Heeger, D. J., and Behrmann, M. (2015). Neural variability: friend or foe? Trends Cogn. Sci. 19, 322–328. doi: 10.1016/j.tics.2015.04.005
Flynn, N. (2011). Comparing vowel formant normalisation procedures. York Papers Linguist. Ser. 2, 1–28. Available online at: https://www.york.ac.uk/language/ypl/ypl2/11/YPL2-11-01-Flynn.pdf
Guenther, F. H. (1995). Speech sound acquisition, coarticulation, and rate effects in a neural network model of speech production. Psychol. Rev. 102, 594–621. doi: 10.1037/0033-295X.102.3.594
Harwell, M. R., Rubinstein, E. N., Hayes, W. S., and Olds, C. C. (1992). Summarizing Monte Carlo results in methodological research: the one- and two-factor fixed effects ANOVA cases. J. Edu. Stat. 17, 315–339. doi: 10.3102/10769986017004315
Heald, S. L. M., and Nusbaum, H. C. (2015). Variability in vowel production within and between days. PLoS ONE 10:e0136791. doi: 10.1371/journal.pone.0136791
Hillenbrand, J. M., and Nearey, T. M. (1999). Identification of resynthesized /hVd/ utterances: effects of formant contour. J. Acoust. Soc. Am. 105, 3509–3523. doi: 10.1121/1.424676
Iskarous, K. (2010). Vowel constrictions are recoverable from formants. J. Phonetics 38, 375–387. doi: 10.1016/j.wocn.2010.03.002
Keating, P. A. (1990). “The window model of coarticulation: articulatory evidence,” in Papers in Laboratory Phonology I: Between the Grammar and Physics of Speech, eds J. Kingston and M. E. Beckman (Cambridge: Cambridge University Press), 451–470. doi: 10.1017/CBO9780511627736.026
Kello, C. T., Anderson, G. G., Holden, J. G., and Van Orden, G. C. (2008). The pervasiveness of 1/f scaling in speech reflects the metastable basis of cognition. Cogn. Sci. 32, 1217–1231. doi: 10.1080/03640210801944898
Klatt, D. H. (1986). “Representation of the first formant in speech recognition and in models of the auditory periphery,” in Proceedings of the Montreal Satellite Symposium on Speech Recognition, 12th International Congress on Acoustics, ed P. Mermelstein (Montreal: Canadian Acoustical Society, 5–7.
Lerche, V., Voss, A., and Nagler, M. (2017). How many trials are required for parameter estimation in diffusion modeling? A comparison of different optimization criteria. Behav. Res. Methods 49, 513–537. doi: 10.3758/s13428-016-0740-2
Lindblom, B. E. (1963). Spectrographic study of vowel reduction. J. Acoust. Soc. Am. 35, 1773–1781. doi: 10.1121/1.1918816
Lindblom, B. E. (1983). “Economy of speech gestures,” in The Production of Speech, ed P. F. MacNeilage (New York, NY: Springer, 217–245.
Lix, L. M., Keselman, J. C., and Keselman, H. J. (1996). Consequences of assumption violations revisited: a quantitative review of alternatives to the one-way analysis of variance F test. Rev. Edu. Res. 66, 579–619. doi: 10.2307/1170654
Mardia, K. V. (1970). Measures of multivariate skewness and kurtosis with applications. Biometrika 57, 519–530. doi: 10.1093/biomet/57.3.519
Ohde, R. N., and Sharf, D. J. (1975). Coarticulatory effects of voiced stops on the reduction of acoustic vowel targets. J. Acoust. Soc. Am. 58, 923–927. doi: 10.1121/1.380746
Ossmy, O., Hoch, J. E., MacAlpine, P., Hasan, S., Stone, P., and Adolph, K. E. (2018). Variety wins: Soccer-playing robots and infant walking. Front. Neurorobot. 12, 1–12. doi: 10.3389/fnbot.2018.00019
Pike, K. L. (1947). On the phonemic status of English diphthongs. Language 23, 151–159. doi: 10.2307/410386
Pouplier, M., Cederbaum, J., Hoole, P., Marin, S., and Greven, S. (2017). Mixed modeling for irregularly sampled and correlated functional data: speech science applications. J. Acoust. Soc. Am. 142, 935–946. doi: 10.1121/1.4998555
Preston, J. L., McAllister, T., Phillips, E., Boyce, S., Tiede, M., Kim, J. S., et al. (2018). Treatment for residual rhotic errors with high and low frequency ultrasound visual feedback: a single case experimental design. J. Speech Language Hearing Res. 61, 1875–1892. doi: 10.1044/2018_JSLHR-S-17-0441
Rosenfelder, I., Fruehwald, J., Evanini, K., Seyfarth, S., Gorman, K., Prichard, H., et al. (2014). FAVE (Forced Alignment and Vowel Extraction) Program Suite (Version 1.2.2).
Saltzman, E., and Munhall, K. G. (1989). A dynamical approach to gestural patterning in speech production. Ecol. Psychol. 1, 333–382. doi: 10.1207/s15326969eco0104_2
Shadle, C. H., Nam, H., and Whalen, D. H. (2016). Comparing measurement errors for formants in synthetic and natural vowels. J. Acoust. Soc. Am. 139, 713–727. doi: 10.1121/1.4940665
Shapiro, S. S., Wilk, M. B., and Chen, H. J. (1968). A comparative study of various tests for normality. J. Am. Stat. Assoc. 63, 1343–1372. doi: 10.1080/01621459.1968.10480932
Stevens, K. N., and House, A. S. (1963). Perturbation of vowel articulations by consonantal context: an acoustical study. J. Speech Hear. Res. 6, 111–128. doi: 10.1044/jshr.0602.111
Terband, H., Maassen, B., Guenther, F. H., and Brumberg, J. (2009). Computational neural modeling of speech motor control in childhood apraxia of speech (CAS). J. Speech Language Hear. Res. 52, 1595–1609. doi: 10.1044/1092-4388(2009/07-0283)
Tilsen, S. (2017). Exertive modulation of speech and articulatory phasing. J. Phonet. 64, 34–50. doi: 10.1016/j.wocn.2017.03.001
Titze, I. R., Baken, R. J., Bozeman, K. W., Granqvist, S., Henrich, N., Herbst, C. T., et al. (2015). Toward a consensus on symbolic notation of harmonics, resonances, and formants in vocalization. J. Acoust. Soc. Am. 137, 3005–3007. doi: 10.1121/1.4919349
Vasishth, S., Nicenboim, B., Beckman, M. E., Li, F., and Kong, E. J. (2018). Bayesian data analysis in the phonetic sciences: a tutorial introduction. J. Phonetics 71, 147–161. doi: 10.1016/j.wocn.2018.07.008
Keywords: vowels, formants, variability, motor control, speech production
Citation: Whalen DH and Chen W-R (2019) Variability and Central Tendencies in Speech Production. Front. Commun. 4:49. doi: 10.3389/fcomm.2019.00049
Received: 03 May 2019; Accepted: 23 August 2019;
Published: 10 September 2019.
Edited by:
Adamantios Gafos, University of Potsdam, GermanyReviewed by:
Daniel Williams, University of Potsdam, GermanySam Kirkham, Lancaster University, United Kingdom
Copyright © 2019 Whalen and Chen. This is an open-access article distributed under the terms of the Creative Commons Attribution License (CC BY). The use, distribution or reproduction in other forums is permitted, provided the original author(s) and the copyright owner(s) are credited and that the original publication in this journal is cited, in accordance with accepted academic practice. No use, distribution or reproduction is permitted which does not comply with these terms.
*Correspondence: D. H. Whalen, d2hhbGVuQGhhc2tpbnMueWFsZS5lZHU=
 D. H. Whalen
 Wei-Rong Chen