 Charalambos Themistocleous
- 1Department of Neurology, Johns Hopkins Medicine, Baltimore, MD, United States
- 2Språkbanken, Department of Swedish, University of Gothenburg, Gothenburg, Sweden
During spoken communication, the fine acoustic properties of human speech can reveal vital sociolinguistic and linguistic information about speakers and thus, these properties can function as reliable identification markers of speakers' identity. One key piece of information speech reveals is speakers' dialect. The first aim of this study is to provide a machine learning method that can distinguish the dialect from acoustic productions of sonorant sounds. The second aim is to determine the classification accuracy of dialects from the temporal and spectral information of a single sonorant sound and the classification accuracy of dialects using additional co-articulatory information from the adjacent vowel. To this end, this paper provides two classification approaches. The first classification approach aims to distinguish two Greek dialects, namely Athenian Greek, the prototypical form of Standard Modern Greek and Cypriot Greek using measures of temporal and spectral information (i.e., spectral moments) from four sonorant consonants /m n l r/. The second classification study aims to distinguish the dialects using coarticulatory information (e.g., formants frequencies F1 − F5, F0, etc.) from the adjacent vowel in addition to spectral and temporal information from sonorants. In both classification approaches, we have employed Deep Neural Networks, which we compared with Support Vector Machines, Random Forests, and Decision Trees. The findings show that neural networks distinguish the two dialects using a combination of spectral moments, temporal information, and formant frequency information with 81% classification accuracy, which is a 14% accuracy gain over employing temporal properties and spectral moments alone. In conclusion, Deep Neural Networks can classify the dialect from single consonant productions, making them capable of identifying sociophonetic shibboleths.
1. Introduction
Listeners associate different productions of sonorant consonants with information about speakers' social identities. For example, in African American Vernacular English, nasals are often weakened or deleted and the preceding vowel becomes more nasalized (Labov, 1977; Brown, 1991; Edwards, 2008); the lateral approximant /l/ can be deleted before labial consonants (e.g., help → hep) (Rickford and Labov, 1999) and rhotics drop in rhotic pronunciations of vowels, as in bird → /bɛd/, car → /kɑ/. So, sonorant consonants (e.g., nasals, laterals, and rhotics) in English can provide acoustic information that can distinguish African American Vernacular English from Standard American English (Bleile and Wallach, 1992) (see also Ladefoged and Maddieson, 1996, for other language varieties). Unlike stop and fricative consonants, sonorant sounds provide unique opportunities to study the effects of dialect on acoustic frequencies and on sound spectra. The development of good identification models of dialects from individual sounds/phones is of key importance, as it can inform conversational systems about the dialect; explain sociophonetic variation of individual sounds; and enable practical applications, such as dialect identification in language disorders' diagnosis and therapy; yet, to our knowledge no other studies attempt to classify dialects using information from sonorants.
The main goal of this study is to provide a classification model of dialects that can achieve high classification accuracy by relying both on sonorant productions and on their coarticulatory effects on adjacent vowels. We analyze sonorant consonants from two modern Greek varieties: Athenian Greek, which is the prototypical form of Standard Modern Greek and Cypriot Greek, a local variety of Greek spoken in Cyprus. Sonorants are perceptually and morpho-phonologically different in these two dialects (Menardos, 1894; Newton, 1972a,b; Vagiakakos, 1973), so, they can offer good examples for evaluating classification models of dialects based on sonorants.
Two main trends of research aim to explain dialectal differences from speech acoustics. On the one hand, research from sociolinguistics, language variation and change, and sociophonetics analyzes language productions to identify variables that distinguish dialects using linguistic analysis (e.g., discourse and conversation analysis) and employs research tools, such as questionnaires, language surveys, telephone interviews, and dialectal maps (Purnell et al., 1999). Sociophonetic research utilizes acoustic recordings and studies variation in sounds, such as vowels and consonants and quantifies phenomena, such as vowel shifts and mergers [e.g., the merger of the high front lax and tense vowels in fill vs. feel in certain dialects of American English (Foulkes and Docherty, 2006; Foulkes et al., 2010; Thomas, 2013)]. One important finding from these studies is that acoustic differences in speech from different varieties of a language that are often imperceivable to the human ear, as they intensify over time and from one generation of speakers to another, have the potential to drive language change (Labov, 1994). Nevertheless, sociolinguistics and sociophonetics are less interested in providing automatic classification models of dialects but rather their main focus remains on identifying the sociolinguistic effects of dialects on acoustic properties of speech sounds.
More recently, automatic dialect identification and automatic language identification have offered methodological approaches, such as i-vector models that provide currently the state-of-the-art on automatic language and dialect identification (Dehak et al., 2010, 2011; Song et al., 2013; Matejka et al., 2014; Richardson et al., 2015). I-vector models commonly employ Gaussian mixture models (GMMs) and factor analysis to reduce the dimensionality of the input into simpler representations, i.e., i-vectors. A probabilistic linear discriminant analysis (pLDA) is then employed to classify dialects and speakers. More recently, Snyder et al. (2018) proposed a system that replaces i-vectors with embeddings, which they term x-vectors, that are extracted from a deep neural network. Automatic dialect identification models have the advantage that they can be implemented to evaluate speech signals fast, without identification of vowels and consonants, and offer high classification accuracy of dialects (e.g., Dehak et al., 2010, 2011; Song et al., 2013; Matejka et al., 2014; Ali et al., 2015; Richardson et al., 2015; Najafian et al., 2016; Ionescu and Butnaru, 2017; Shon et al., 2018). However, for the purposes of this study, this approach cannot be employed to explain the crossdialectal differences of sonorants, for several reasons: first, because the input features commonly employed [e.g., Mel-Frequency Cepstral Coefficients (MFCCs), log Mel-scale Filter Bank energies (FBANK) features] are not elicited from specific phonemes or phones but rather from larger parts of speech that may not correspond to linguistic categories; second, it is very hard to find cognitive and articulatory correspondence for these features; and third, input features undergo dimensionality reduction, which further makes difficult an interpretation of features that contribute to the classification.
In Themistocleous (2017a), we wanted to show how well vowels can distinguish Athenian Greek and Cypriot Greek and to show how vowel spectral encode information about the dialect. To this end, we provided a classification model of Athenian Greek, as it is spoken in Athens and Cypriot Greek, using information from vowels. That is, we measured formant dynamics from F1…F4 formant frequencies and vowel duration (Themistocleous, 2017a). To model formant dynamics, we employed second degree polynomials and modeled the contour of vowel formant frequencies measured at multiple time points from the onset to the offset of vowels. Using a decision tree model, known as C5.0 Quinlan (1993); Salzberg (1994), we showed that vowel formants and vowel dynamics enable the identification of Athenian Greek and Cypriot Greek (Accuracy = 74, 95% CI [71, 77%]).
To classify the two language varieties in this study, we are employing a feed-forward artificial neural network, which is a form of a deep neural network architecture (DNN) (see also Gelly et al., 2016; Gelly and Gauvain, 2017). This model can learn non-linear function approximators that enable the classification of the two dialects. To evaluate the DNN model, we compare its performance to three different machine learning models: Decision Trees (DTs), Random Forests (RFs), and Support Vector Machines (SVMs). DTs and RFs split the data in a binary manner based on the attribute that best explains the data; the result is a series of branching nodes that form the classification tree. However, unlike DTs, RFs, instead of one tree, provide ensemble results from multiple decision tree models. Finally, SVMs employ hyperplanes to best separate the data into groups. Moreover, we evaluated the performance of the models using 3-fold crossvalidation and validation split and provided the following evaluation measures: the precision, recall, and f1 scores. The details of the methods are discussed in the following section.
We are analyzing sonorant consonants in Athenian Greek and Cypriot Greek, as sonorants in these two dialects differ perceptually and morpho-phonologically, so we expect them to provide good markers for the classification of these two dialects. Sonorants are consonants produced with a wide stricture formed by the approximation of the active and passive articulator. Nasals, rhotics, and laterals differ from fricatives and stops in that their degree of stricture is wider, approaching that of vowels (Boyce and Espy-Wilson, 1997; Espy-Wilson et al., 2000; Harrington, 2010) (for a crosslinguistic study of sonorants and exceptions, see Ladefoged and Maddieson, 1996). To produce nasals, speakers block the airflow somewhere in the oral cavity, e.g., at the lips for the bilabial nasal /m/ or the alveoli for the production of the alveolar nasal /n/, allowing the airflow to escape through the nasal cavity after passing from an opening that results from the lowering of the velum; this creates distinct formants and anti-formants. Lateral and rhotic consonants are characterized by complex articulatory gestures that enable the lateralization and rapid interruption of the airflow, in laterals and rhotics, respectively. Laterals are produced with distinct formants and anti-formants created in the oral cavity. To model differences of sonorant spectra, we have calculated from the acoustic signals of sonorants the spectral moments: the center of gravity, which is the mean of the spectral energy distribution, the spectral standard deviation, which is a measure of the variance, the spectral skewness, which is a measure of the symmetry of the spectral distribution, and the spectral kurtosis, which is a measure of the degree of thickness of the tails of the distribution (Davidson and Loughlin, 2000). Spectral moments can enable the comparison of the spectral properties of sonorants in the two dialects (e.g., Forrest et al., 1988; Gottsmann and Harwardt, 2011; Schindler and Draxler, 2013; Themistocleous, 2016a,b, 2017b,c).
We are also analyzing the coarticulatory effects of sonorants on the adjacent vowel frequencies (for an early study, see Mann, 1980), as these also carry information about sonorants and about speakers' dialect. In fact, in Swedish and in other languages, the lowering of the third formant frequency (F3) of the following vowel is a major cue for the perception of rhotics (Van De Weijer, 1995; Recasens and Espinosa, 2007; Heinrich et al., 2010) (for the role of F3 in Greek, see Themistocleous, 2017c). Since each sonorant exercises different coarticulatory effects on vowel formant frequencies, these effects can be employed to identify the sonorant sound. Moreover, as the production of sonorants can differ from one dialect to another, both the acoustics of sonorants and their coarticulatory effects can distinguish speakers as belonging to different sociolinguistic groups; in our case, sonorants can index a speaker as a member of Athenian Greek and Cypriot Greek.
To explain the differences of Athenian Greek and Cypriot Greek on sonorants, let us now provide an overview of sonorants in Greek dialects. The Greek dialectal space is traditionally distinguished into two main groups of language varieties or “idioms”: the northern idioms whose unstressed vowels can be raised and/or reduced and the southern idioms, where vowel raising and reduction does not apply. Standard Modern Greek is spoken in the main urban centers of Greece, especially in Athens and Thessaloniki. Cypriot Greek is a local variety of Greek spoken in Cyprus; other local varieties of Greek, including Cretan Greek, Pontic Greek, and Tsakonian Greek. Athenian Greek and Cypriot Greek are not characterized by vowel raising and reduction, so they are classified as southern varieties, yet acoustically Athenian vowels are more raised than Cypriot Greek vowels (Themistocleous, 2017c). Cypriot Greek and Athenian Greek differ in their pronunciation due to phonetic and phonemic differences (Botinis et al., 2004; Eftychiou, 2010; Themistocleous, 2014, 2017a,b,c; Themistocleous et al., 2016), and although Cypriot Greek speakers understand and usually code-switch to Athenian Greek in official settings and in the presence of speakers that are not familiar to the dialect, Athenian Greek speakers, especially if they are unfamiliar to Cypriot Greek, often report difficulties understanding Cypriot Greek speakers.
Athenian Greek sonorants are shown in Table 1 and Cypriot Greek sonorants are shown in Table 2. A close comparison of these phonemic systems reveals some notable crossdialectal similarities and differences. In both varieties, [ɱ] is allophone of /m/ before other labiodental sounds; [ɲ] and [ŋ] are allophones of /n/ that occur before front and back vowels, respectively; also, [ʎ] is an allophone of /l/ before a front vowel. There are also differences between these two varieties (Menardos, 1894; Newton, 1972a,b; Vagiakakos, 1973). Cypriot Greek distinguishes long /nː mː lː rː/ and short /n m l ɾ/ sonorant sounds. The duration is the main perceptual difference between long and short sonorants; in the case of /r/, the long phoneme is realized with a trill /rː/, whereas the short is flap /ɾ/. Also in Cypriot Greek there is a devoiced rhotic sound, which occurs usually in environments before stops as in [ˈpo ta] “door.” Cypriot Greek is characterized by stronger nasal pronunciation than Athenian Greek and preserves nasals in nasal + voiced stop clusters (e.g., /ˈlampa/ → [ˈlamba], “lamp/light bulb”; /ˈpente/ → /ˈpende/ “five”) whereas Athenian Greek usually elides them (i.e., /ˈlampa/ → [ˈlaba], “lamp/light bulb”; pente /ˈpente/ → /ˈpede/ “five”) (see Householder et al., 1964, who discusses denasalized clusters in Athenian Greek). Also, Cypriot Greek unlike Athenian Greek retains the nasal /n/ in the accusative in determiners (articles), adjectives, and nouns; this results in several assimilation phenomena with respect to place of articulation; for example, some of these morpho-phonological effects are the following:
• /tin ˈmamːan mu/, the-ACC.SG mother-ACC.SG my → [tiˈmːamːamːu], “my mother”; assimilation of nasals in an /n/ + /m/ environment affecting the place of articulation of the first sound and results in a long/geminate [mː], cf. Athenian Greek [timaˈmamu].
• /tin ˈnikin/, the-ACC.SG victory-ACC.SG, “the victory” → tiˈnːicin; assimilation of the two nasals resulting in a geminate/long nasal production, cf. Athenian Greek [tiˈnici]].
• /tin ˈpolin/, the-ACC.SG city-ACC.SG, “the city” → [tiˈmbolin] assimilation results in a change of the nasal consonant's place of articulation; the following voiceless stop consonant assimilates with the nasal with respect to voice, so that a pre-nasalized voiced stop occurs (i.e., [mb]), cf. Athenian Greek tiˈboli].
• /ton ˈlikon/, the-ACC.SG wolf-ACC.SG, “the wolf” → [toˈlːikon], the nasal assimilates with the following lateral aproximant in place of articulation, the duration is retained which corresponds to a long/geminate /lː/ sound, cf. Athenian Greek, toˈliko.
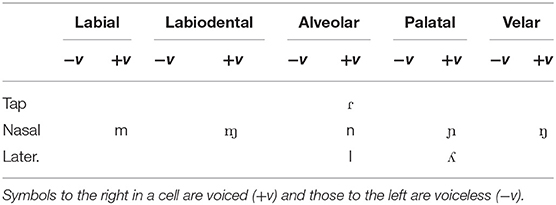
Table 1. Athenian Greek Consonants.
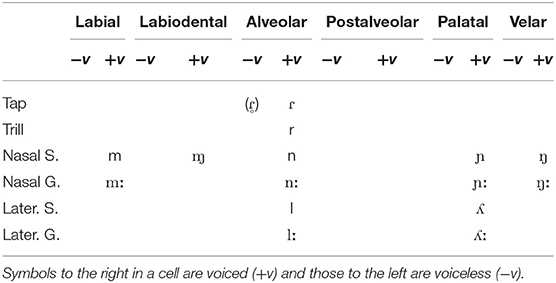
Table 2. Cypriot Greek Consonants.
Overall, this is the first large scale study that employs spectral and frequency information from Athenian Greek and Cypriot Greek sonorants (but for the duration of sonorant consonants, see Arvaniti and Tserdanelis, 2000; Tserdanelis and Arvaniti, 2001; Armostis, 2009; Themistocleous, 2014, 2016b).
2. Methodology
2.1. Participants
Forty speakers participated in this study: 20 female speakers born and raised in Athens, Greece and 20 female speakers born and raised in Nicosia, Cyprus. The recordings were conducted between 2011 and 2012 as part of a bigger study of Athenian Greek and Cypriot Greek vowels and consonants (see Themistocleous, 2017a,b,c). Speakers formed homogeneous groups with respect to gender (e.g., only female speakers), age (most differ 2–3 years only), educational background (all were university students), and socioeconomic condition (all were from middle-class urban families). All subjects were native speakers in their dialects. Overall, all Athenian and Nicosian speakers employed in their everyday speech that which corresponds to their age and urban lifestyle, namely urban Athenian and urban Nicosian speech style. The degree of inter-dialectal familiarity depends on the language variety: overall, Athenian speakers had very little previous knowledge of Cypriot Greek whereas Cypriot Greek speakers were exposed to Athenian Greek pronunciation very early in their lives through education and the media.
2.2. Procedure
We recorded the speakers in their hometowns, that is, the Athenian Greek speakers were recorded in a recording studio in Athens and the Cypriot Greek speakers were recorded in a sound proof room at the University of Cyprus in Nicosia, which ensures that speakers are primed to speak their native language variety. To avoid influences from the experimenter—for example, it is known that Cypriot Greek speakers tend to code-switch to Athenian Greek when an Athenian Greek speaker interacts with them—the instructions to Athenian Greek speakers were provided by an Athenian Greek speaker and the instructions to Cypriot Greek speakers were provided by a speaker of Cypriot Greek. Only instructions that were relevant to the recording procedure were provided, e.g., to keep a designated distance from the microphone, to avoid focusing their attention on keywords. The materials were recorded using a Zoom H4n audio recorder, and the voice was sampled at 44.1 kHz and analyzed using Praat (see Boersma and Weenink, 2017). After the recordings, speech productions were segmented into vowels and consonants manually.
2.3. Data
We have analyzed the acoustic spectra of sonorant consonants, namely we have analyzed nasal (e.g., /m/ and /n/), lateral approximant (e.g., /l/), and rhotic (e.g., /r/) sonorant sounds produced by Cypriot Greek and Athenian Greek speakers. To elicit sonorant productions, we designed a controlled reading experiment where we manipulated the sonorant sound, its position in a keyword, and the vowel environment. Sonorants were embedded in CVCV keywords (see Table 3). The controlled CVCV environment facilitates the elicitation of acoustic effects that are of interest for the study only, namely the effect of the dialect on sonorant by controlling for the segmental environment, stress, and sonorant position in the utterance. This approach has the advantage that it enables the collection of less data, whereas selecting sonorants from conversational speech can induce greater variability in the input and to address this issue will require more data for training. The bilabial nasal [m], the alveolar nasal [n], alveolar lateral approximant [l], and alveolar flap [ɾ] were embedded in the speech material at the beginning and the middle of a word preceding two vowel environments, the vowel /a/ and the vowel /i/. To facilitate the crossdialectal comparison in this study, we compare Athenian Greek sonorants to the corresponding Cypriot Greek singleton sonorants, which are the unmarked case in the short–long consonant pair (see the discussion on Greek sonorants in the Introduction).
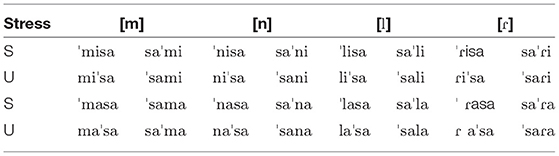
Table 3. Experimental material.
The Athenian Greek keywords were embedded in the carrier phrase written in standard Greek orthography: /ˈipes keyword ˈpali/ (You told keyword again) and the Cypriot Greek keywords were embedded in the carrier phrase: /ˈipes keyword ˈpale/ You told keyword again, where only the last word differs in one sound (e.g., /i/ vs. /e/) to make the carrier phrase more natural to Athenian Greek and Cypriot Greek speakers, respectively; this difference in the carrier phrase does not affect the production of the sonorant. To add variation in the materials and distract speakers from the targeted sounds, we added other words as distractors (which were the keywords of another experiment). All stimuli were presented in random order.
A total sum of 5,120 sonorant productions were produced; namely, 40 speakers × 4 consonants × 4 repetitions × 2 word positions × 2 stress conditions × 2 vowels. From the sonorant spectra, we elicited the following properties:
1. Sonorant duration
2. Intensity
3. Center of gravity
4. Standard deviation
5. Skewness
6. Kurtosis.
We also measured the first five formant frequencies (i.e., F1…F5) of the following vowel that were measured at the 25, 50, 75% of the vowel's duration: F1 25, F1 50, F1 75…F5 25, F5 50, F5 75%. The acoustic measurements were conducted in Praat (see Boersma and Weenink, 2017).
2.4. Deep Neural Networks
An overview of the process followed for the classification is shown in Figure 1.
Classification Tasks: To estimate the contribution of the acoustic properties of sonorants and the contribution of sonorant-vowel sequences to the classification accuracy, we have conducted two classification tasks. Classification 1 aims to distinguish the two dialects, using information from the spectral moments and duration of sonorants. Classification 2 aims to distinguish dialects by combining spectral moments, sonorant duration, and frequency information from sonorant+vowel sequences, i.e., spectral moments, F1…F5 and mean F0, maximum and minimum F0.
Model comparison: In both classification tasks, we have trained four machine learning models: DNN, SVMs, RFs, and DTs. All models have been employed in speech-related classification tasks in the past (Graves et al., 2013; Themistocleous, 2017c).
Model evaluation: Models were designed and evaluated using two evaluation methods: validation split and group crossvalidation. Validation split was motivated by the fact that it can enable us to present further measures, namely, the precision, recall, AUC, and f1 score. F1 score and AUC provide standardized scores of the accuracy for unbalanced designs. The receiver operating characteristic curve (ROC curve) is a curve that is created by plotting the true positive rate against the false positive rate. The area under ROC provides an estimate of the model performance. An optimal model has an AUC curve closer to one (1) whereas a model with 0.5 AUC means that its predictions are closer to chance. For the group cross-validation, each classifier has been evaluated three times using different speakers in the training and test sets. Using different speakers for the training phase and evaluation phase ensures that the evaluation makes use of completely new independent samples. For the validation split, the data were split into 80% training and 20% evaluation sets and randomized within each set. Speakers in the training and test sets were different.
Model optimization: A. Hyperpameters for the optimization algorithm, training epochs of neural nets, number of layers, and batch size were selected during model optimization. Specifically, all DNN models were optimized as follows: i. A min-max scaler was fitted on the training set and transformed the training and evaluation sets separately. This approach ensures that there is no information about the speaker in the training set. ii. A ReLU activation function was employed in the input and hidden layers, only the output layer had a sigmoid activation to perform the binary classification of dialect (that is Athenian Greek vs. Cypriot Greek) (Maas et al., 2013; He et al., 2015). iii. The optimization algorithm was “stochastic gradient descent” (SGD) with 0.1 learning rate, 0.9 momentum, and decay which was learningrate/epochs. iv. DNN models were trained for 500 epochs for each fold in the crossvalidation task and for 800 epochs in the 80–20% validation split task. v. The batch size was set to 15.
B. The SVMs, RFs, and DTs were optimized separately for each classification. Namely, we ran several SVMs, with different number of kernels and RFs with different number of trees. DTs were employed without optimizations.
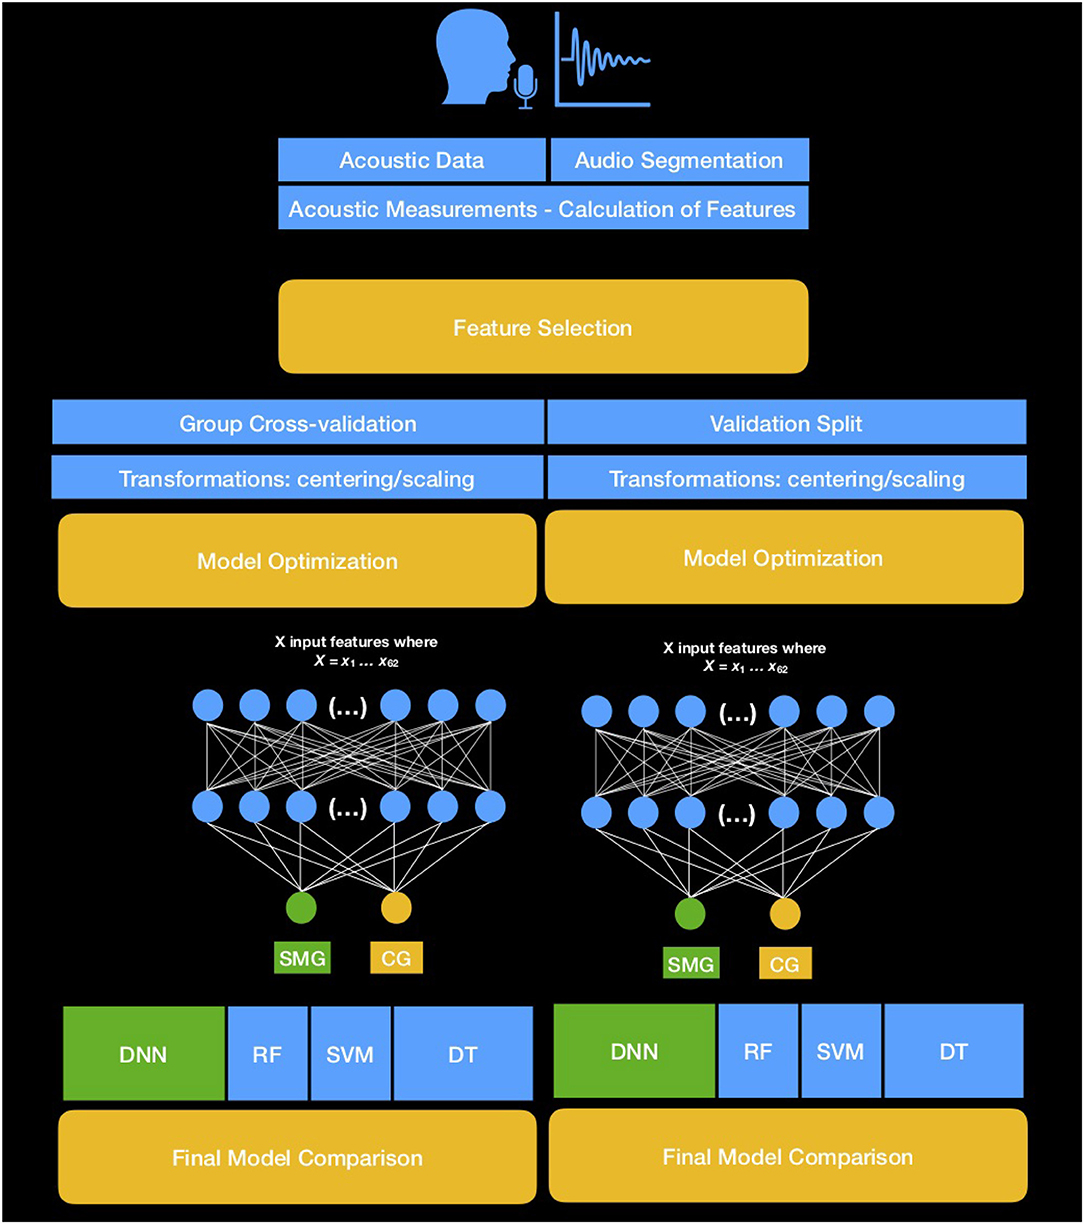
Figure 1. Process diagram showing the steps required to select the best model for the classification of Standard Modern Greek (SMG) and Cypriot Greek (CG) for each one of the two classification approaches.
Next, we present the architecture with the best performance, for each classification.
2.4.1. Classification 1
i. DNN: The design for the DNN in both the crossvalidation and in the validation split is shown in Table 4. The predictors employed in Classification 1 include information from sonorants only, namely there were seven input features: sonorant duration, intensity, spectral center of gravity, spectral standard deviation, spectral skewness, spectral kurtosis, and the type of sonorant.
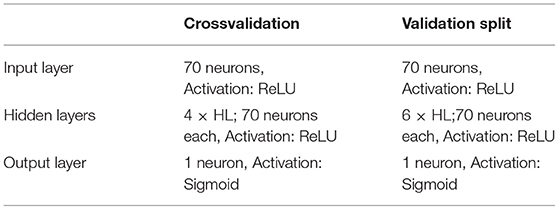
Table 4. DNN design for the crossvalidation and validation split using input features from sonorants (classification 1).
The DNN had four dense hidden layers with 70 neurons in the crossvalidation task and six dense hidden layers with 70 dense layers in the validation split. The output layer had one unit.
ii. SVM, RF, DT: We ran SVMs and RFs with different numbers of kernels and trees correspondingly; the model that had the best performance was for SVMs, the model with three linear kernels for the RF, the model with 60 trees; we did not modify DT's hyper-parameters.
2.4.2. Classification 2
i. DNN: The design for the DNN in both the crossvalidation and in the validation split is shown in Table 5. Classification 2 contained 25 predictors measured from the sonorant+vowel: Duration, Mean F0, Minimum F0, Maximum F0, F1…F5 measured at the 25, 50, 75% of vowel duration, intensity, center of gravity, standard deviation, skewness, kurtosis, and the type of sonorant. In addition to the input and output layers, the DNN had 5 hidden layers. All layers were dense with 110 neurons each; only the output layer had a single unit for the classification. The DNN was run for 800 epochs.
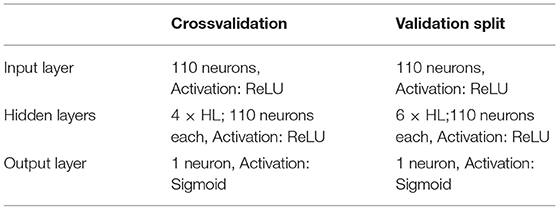
Table 5. DNN design for the crossvalidation and validation split using 24 input features from sonorant + vowel sequences (classification 2).
ii. SVM, RF, DT: As in Classification 1, we ran SVMs and RFs with different numbers of kernels and trees correspondingly; the best performing SVM model had 3 linear kernels and the best performing RF model had 512 trees; there was no optimization for DTs.
All machine learning models were implemented in Python 3.7.3 using the libraries NUMPY, MATPLOTLIB, PANDAS, and SCIKIT-LEARN (Jones et al., 2001); for the deep neural networks we employed the KERAS (Chollet, 2015), a high-level application programming interface that runs on top of TENSORFLOW an “end-to-end open source platform for machine learning” developed by Google (Abadi et al., 2016).
3. Results
In this section, we report the results from the validation split and the results from the 3-fold grouped cross-validation for Classification 1 and Classification 2. Table 6 and Figure 2 shows correspondingly the output of the models from the validation split and crossvalidation; Figures 3, 4 shows the ROC/AUC for the validation split and crossvalidation correspondingly.
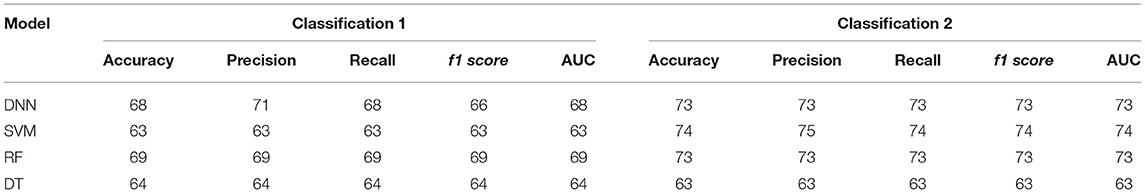
Table 6. DNN, SVM, RF, and DT model accuracy, precision, recall, and f1 score from validation split in classification 1 and classification 2.

Figure 2. Mean accuracy for classification 1 and classification 2 from the 3-fold crossvalidation of random forests (RF), support vector machines (SVM), decision trees (DT), and deep neural networks (NN) classification models; error bars show the SD.
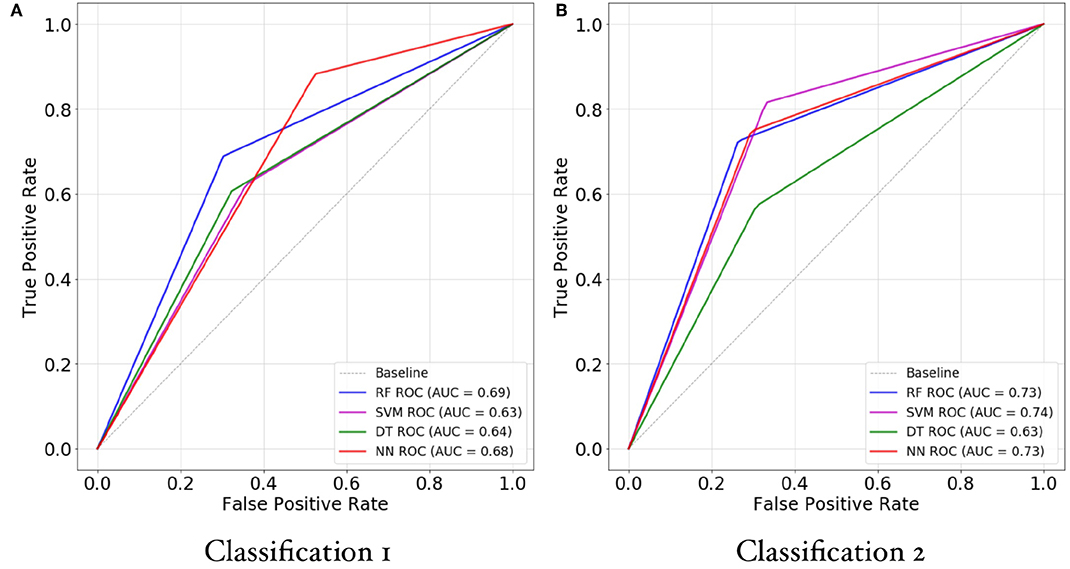
Figure 3. ROC/AUC for random forests (RF), support vector machines (SVM), decision trees (DT), and deep neural networks (DNN) for classification 1 (A) and classification 2 (B). The y-axis represents the true positive rate (i.e., the precision) against the false positive rate (i.e., 1-recall). The best model has an ROC that is closer to 1 whereas a bad model has an ROC closer to 0.
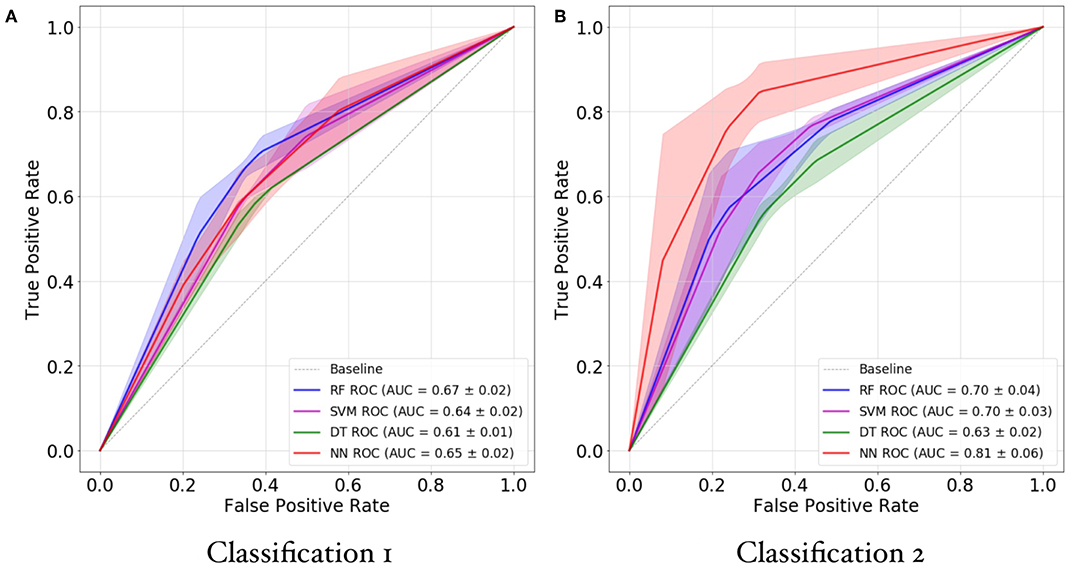
Figure 4. ROC(AUC) curves of random forests (RF), support vector machines (SVM), decision trees (DT), and deep neural networks (DNN) for classification 1 (A) and classification 2 (B). The y-axis represents the true positive rate against the false positive rate. The best model has an ROC that is closer to 1 whereas a bad model has an ROC closer to 0. The shaded area indicates the SD from the cross-validation mean.
3.1. Validation Split
Table 6 shows models' accuracy, precision, recall, and f1 scores in Classification 1 and Classification 2, respectively. Figure 3 shows the ROC and the AUC of Classification 1 and 2 machine learning models. In Classification 1 the best AUC is provided by RF (69%), followed by DNN (68%) whereas in Classification 2, the best AUC is provided by SVMs (74%). ROC/AUC measures and f1 scores are in agreement with accuracy measures. In validation split, most Classification 2 models had higher accuracy than in Classification 1, except from the DT, which had a slightly higher accuracy in Classification 1. Overall, the best accuracy in the validation split is provided by SVMs in Classification 2, i.e., 74%.
3.2. Cross-Validation
The results from the crossvalidation are presented in Figure 2. The RF model provided the highest accuracy, i.e., 67% in Classification 1. In contrast, DNNs provided the highest classification accuracy, namely 81% accuracy in Classification 2 that resulted in a 14% accuracy gain over the best model of Classification 1. In fact, a Wilcoxon rank sum test showed that Classification 1 accuracy and Classification 2 accuracy were significantly different (W = 9, p < 0.05). Figure 4 shows the mean ROC/AUC; the shading indicates the SD from the AUC mean. The AUC results correspond to that of the accuracy, which suggests that the design is balanced.
4. Discussion
When speakers produce speech, they reveal compelling information about themselves through the fine acoustic properties of their voice, in a subtle, highly personal, and hard to fake manner. For example, they reveal information about their emotional state (happy, sad, etc.), physiological condition (body size, health, age etc.), and social characteristics (education, occupation etc.), along with the linguistic message they communicate. Listeners can elicit this information by decoding the acoustic signals (Zatorre et al., 2002; Boemio et al., 2005; Giraud et al., 2007; Hickok and Poeppel, 2007, 2016; Abrams et al., 2008; Wright et al., 2018). However, it is a challenge to explain how listeners distinguish sociolinguistic information in the acoustic signals. In the case of dialects, this can be demanding as dialects often share many similarities in their sound structures.
The aim of this study was to provide a classification model that can distinguish dialects from sonorant productions. The study offered two machine learning classification approaches. In each classification approach, four different machine learning models were trained: DNNs, SVMs, RFs, and DTs. Then, the performance of the models was evaluated on new data. During this phase, the prediction of the model, i.e., whether the sonorant was produced by an Athenian Greek speaker or a Cypriot Greek speaker was compared to the actual label of the dialect. (Note that during the evaluation, the dialect is not known by the model). We showed that two Greek dialects, Athenian Greek and Cypriot Greek, can be distinguished eight (8) times out ten (10) correctly from a sequence of a sonorant /m, n, r, l/ consonant and a vowel. Overall, this result demonstrates that information from vowel frequencies in combination with spectral and temporal information from sonorants distinguishes the two dialects and increases the classification accuracy of the dialect. Both the crossvalidation and the validation split provide support for this finding. Machine learning models, especially DNNs, provide superb opportunities to distinguish patterns in the acoustic structure of sounds by considering both individual measurements of acoustic properties and the patterns they form with other predictors.
Earlier research showed that information from vowels can distinguish Athenian Greek and Cypriot Greek (Themistocleous, 2017a). In this study, we designed two classification approaches to explain whether i. sonorants alone can distinguish Athenian Greek and Cypriot Greek and/or ii. sonorants and vowels are required to distinguish the two dialects. In Classification 1, we had employed spectral moments and temporal information as predictors, whereas in Classification 2, we employed a combination of spectral moments and frequency information from vowels. The best performing model in Classification 1 was provided by RFs, which resulted in 69% classification accuracy. This outcome shows that speakers of the two dialects produce sonorants differently and suggests that spectral moments provide significant information that can distinguish the two dialects. To put it differently, RFs can distinguish the dialect from a single sonorant sound correctly as Athenian Greek and Cypriot Greek, almost seven times out of ten.
Nevertheless, Classification 2 models resulted in a greater accuracy than Classification 1 models. In Classification 2, DNNs outperformed all other models, by providing 81% classification accuracy in the crossvalidation task, which is a 14% increase of the classification accuracy with respect to Classification 1. Also, the DNN model had the smallest standard deviation, which suggests that this model provided more consistent results than the other models. However, Classification 2 models also outperformed the results from Themistocleous (2017a) that employed information from vowels only. That study resulted in 74% classification accuracy. So overall, Classification 2 provided the best results compared to Classification 1 (Themistocleous, 2017a). This finding suggests that combining information from sonorants and vowels increases the prediction accuracy.
It is possible to draw analogies to this finding with the way humans distinguish dialects. Humans acquire sociolinguistic competence very early in their lives, and specifically their dialect (Grohmann et al., 2017), then using this information they elicit information about their social environments and become more socially aware (Labov et al., 1964; Jones et al., 2017). During human speech perception, speech information is analyzed and combined in the cortex, so that subphonemic and phonemic features may arise in a compositional manner (Mesgarani et al., 2014; Binder, 2016). Humans can identify the dialect of the speaker often with a single sound. Similarly, the machine learning models provided in this study can learn and become more aware of the social distinctions of Athenian Greek and Cypriot Greek speakers by identifying phonetic properties that characterize the particular groups of speakers from their sonorants. Second, we become more confident that these models will distinguish the two dialects when more information is provided to the models as it was evidenced from the comparison of Classification 2 models with those from Classification 1.
So how does the model provided here fare with respect to dialect classification models? First, it should be noted that when comparing different approaches that employ different methodological tools, many different parameters should be taken into account. For example, how different are the dialects or language varieties they try distinguish; if two dialects are very similar then it may be harder for listeners and machine learning models to identify patterns that discriminate the two dialects. Also, there are may be differences in the aims and designs of two dialect identification systems. For example, a broad system that classifies dialects from longer parts of speech may be able to identify patterns that distinguish dialects, but it may have to deal with more variation in the input signal (e.g., Ali et al., 2015; Najafian et al., 2016; Ionescu and Butnaru, 2017) whereas a narrow system that distinguishes dialects from a few sounds produced in controlled settings may fare better to explain how well the dialects differ given these sounds but not others. For example (e.g., Shon et al., 2018), compared two systems that employ FBANK features and MFCCs and showed that a single feature set achieves 73% accuracy, while the best system that combined multiple features achieved 78% on a dialect test set consisting of 5 dialects. In this regard, the system presented in this study is a narrow dialect classification system and in many respects it provides accuracy close to that of other state-of-the-art systems.
To conclude, this study showed that a tiny segment of a sonorant sound can convey multi-dimensional information, both linguistic and sociolinguistic information. By employing machine learning, this study demonstrated that two dialects of Greek, Athenian Greek and Cypriot Greek, can be distinguished better by spectral and temporal information from sonorants, yet a combination of spectral and temporal information from sonorants and acoustic information from adjacent vowel frequencies provides more robust classification outcomes. We have employed specific features to classify speech sounds. In our future research, we will provide classification models that can classify types of phonemic, physiological, sociolinguistic, and pathological, etc., information from speech productions.
Data Availability Statement
The datasets generated for this study are available on request to the corresponding author.
Ethics Statement
Data for this study were collected during 2011 in Nicosia and Athens as part of a sociolinguistics study that involved collecting information about Greek dialects. A total of 40 healthy female adult speakers participated voluntarily in the study, by providing a short recording of their voice; the task of the recording was comfortable, not stressful, and relatively short; also, it did not put speakers' health and physical condition in risk in any way. For these reasons, further ethics approval was not required. Nevertheless, all participants provided written informed consent.
Author Contributions
CT conducted the designed and run the experiments, conducted the statistical analysis, and prepared the manuscript.
Funding
Funding was received from the research project Transcranial Direct Current Stimulation for Primary Progressive Aphasia conducted at Johns Hopkins University (NCT:02606422) PI Kyrana Tsapkini and from Riksbankens Jubileumsfond–The Swedish Foundation for Humanities and Social Sciences, through the grant agreement no: NHS 14-1761:1 PI Dimitrios Kokkinakis.
Conflict of Interest
The author declares that the research was conducted in the absence of any commercial or financial relationships that could be construed as a potential conflict of interest.
References
Abadi, M., Agarwal, A., Barham, P., Brevdo, E., Chen, Z., Citro, C., et al. (2016). TensorFlow: Large-Scale Machine Learning on Heterogeneous Systems. arXiv:1603.04467 [Preprint].
Abrams, D. A., Nicol, T., Zecker, S., and Kraus, N. (2008). Right-hemisphere auditory cortex is dominant for coding syllable patterns in speech. J. Neurosci. 28, 3958–3965. doi: 10.1523/JNEUROSCI.0187-08.2008
Ali, A. M., Bell, P., and Renals, S. (2015). Automatic dialect detection in Arabic broadcast speech. CoRR abs/1509.06928. 1–7. doi: 10.21437/Interspeech.2016-1297
Armostis, S. (2009). The phonetics of plosive and affricate gemination in Cypriot Greek (thesis), Cambridge, MA: University of Cambridge.
Arvaniti, A., and Tserdanelis, G. (2000). On the Phonetics of Geminates: Evidence From Cypriot Greek. Vol. 2, Beijing, 559–562. Available online at: https://www.isca-speech.org/archive/icslp_2000/#Introduction
Binder, J. R. (2016). “Phoneme perception,” in Neurobiology of Language, eds G. Hickok, and S. L. Small (San Diego: Academic Press), 447–461.
Bleile, K. M., and Wallach, H. (1992). A sociolinguistic investigation of the speech of African American preschoolers. Am. J. Speech Lang. Pathol. 1, 54–62.
Boemio, A., Fromm, S., Braun, A., and Poeppel, D. (2005). Hierarchical and asymmetric temporal sensitivity in human auditory cortices. Nat. Neurosci. 8:389. doi: 10.1038/nn1409
Boersma, P., and Weenink, D. (2017). Praat: Doing Phonetics by Computer. Version 6.0.32. Available online at: http://www.praat.org/ (accessed February 11, 2017).
Botinis, A., Christofi, M., Themistocleous, C., and Kyprianou, A. (2004). “Duration correlates of stop consonants in Cypriot Greek,” in FONETIK 2004, eds P. Branderud, O. Engstrand, and H. Traunmüller (Stockholm: Dept. of Linguistics, Stockholm University), 140–143.
Boyce, S., and Espy-Wilson, C. Y. (1997). Coarticulatory stability in American English/r. J. Acoust. Soc. Am. 101, 3741–3753.
Brown, V. R. (1991). Evolution of the merger of/i/and/ε/before nasals in Tennessee. Am. Speech 66, 303–315.
Chollet, F. (2015). Keras. Available online at: https://github.com/keras-team/keras
Davidson, K. L., and Loughlin, P. J. (2000). Instantaneous spectral moments. J. Franklin Inst. 337, 421–436. doi: 10.1016/S0016-0032(00)00034-X
Dehak, N., Kenny, P. J., Dehak, R., Dumouchel, P., and Ouellet, P. (2010). Front-end factor analysis for speaker verification. IEEE Trans. Audio Speech Lang. Process. 19, 788–798. doi: 10.1109/TASL.2010.2064307
Dehak, N., Torres-Carrasquillo, P., Reynolds, D., and Dehak, R. (2011). “Language recognition via ivectors and dimensionality reduction,” in Proceedings of the Annual Conference of the International Speech Communication Association, INTERSPEECH (San Francisco, CA), 857–860.
Edwards, W. F. (2008). “African American Vernacular English: phonology,” in Varietes of English 2: the Americas and the Caribbean, ed E. Shneider (Berlin: Mouton de Gruyter), 181–191.
Eftychiou, E. (2010). Routes to lenition: an acoustic study. PLoS ONE 5:e9828. doi: 10.1371/journal.pone.0009828
Espy-Wilson, C. Y., Boyce, S. E., Jackson, M., Narayanan, S., and Alwan, A. (2000). Acoustic modeling of American English/r. J. Acoust. Soc. Am. 108, 343–356. doi: 10.1121/1.429469
Forrest, K., Weismer, G., Milenkovic, P., and Dougall, R. N. (1988). Statistical analysis of word-initial voiceless obstruents: preliminary data. J. Acoust. Soc. Am. 84, 115–123.
Foulkes, P., and Docherty, G. (2006). The social life of phonetics and phonology. J. Phonet. 34, 409–438. doi: 10.1016/j.wocn.2005.08.002
Foulkes, P., Scobbie, J. M., and Watt, D. (2010). Sociophonetics, Chapter 19. New York, NY: John Wiley & Sons, Ltd., 703–754.
Gelly, G., and Gauvain, J.-L. (2017). “Spoken language identification using lstm-based angular proximity,” in INTERSPEECH (Stocholm), 2566–2570.
Gelly, G., Gauvain, J.-L., Le, V. B., and Messaoudi, A. (2016). “A divide-and-conquer approach for language identification based on recurrent neural networks,” in INTERSPEECH (San Francisco, CA), 3231–3235.
Giraud, A. L., Kleinschmidt, A., Poeppel, D., Lund, T. E., Frackowiak, R. S., and Laufs, H. (2007). Endogenous cortical rhythms determine cerebral specialization for speech perception and production. Neuron 56, 1127–1134. doi: 10.1016/j.neuron.2007.09.038
Gottsmann, F., and Harwardt, C. (2011). “Investigating robustness of spectral moments on normal-and high-effort speech,” in INTERSPEECH 2011 (Florence), 2937–2940.
Graves, A., Mohamed, A. R., and Hinton, G. (2013). “Speech recognition with deep recurrent neural networks,” in 38th International Conference on Acoustics, Speech, and Signal Processing (ICASSP) (Vancouver, BC), 6645–6649.
Grohmann, K. K., Papadopoulou, E., and Themistocleous, C. (2017). Acquiring clitic placement in bilectal settings: interactions between social factors. Front. Commun. 2:5. doi: 10.3389/fcomm.2017.00005
Harrington, J. (2010). “Acoustic phonetics,” in The Handbook of Phonetic Sciences. 2nd Edn., eds W. J. Hardcastle, J. Laver, J., and E. G. Fiona (Oxford: Blackwell Publishing), 81–129.
He, K., Zhang, X., Ren, S., and Sun, J. (2015). “Delving deep into rectifiers: Surpassing human-level performance on imagenet classification,” in Proceedings of the IEEE International Conference on Computer Vision (Santiago), 1026–1034.
Heinrich, A., Flory, Y., and Hawkins, S. (2010). Influence of english r-resonances on intelligibility of speech in noise for native english and german listeners. Speech Commun. 52, 1038–1055. doi: 10.1016/j.specom.2010.09.009
Hickok, G., and Poeppel, D. (2007). The cortical organization of speech processing. Nat. Rev. Neurosci. 8:393. doi: 10.1038/nrn2113
Hickok, G., and Poeppel, D. (2016). “Neural basis of speech perception,” in Neurobiology of Language, eds G. Hickok and S. L. Small (Cambridge, MA: Academic Press), 299–310.
Householder, F., Kazazis, K., and Koutsoudas, A. (1964). Reference Grammar of Literary Dhimotiki, Vol. 30 of International Journal of American Linguistics. Bloomington: Indiana University.
Ionescu, R. T., and Butnaru, A. (2017). “Learning to identify arabic and german dialects using multiple kernels,” in Proceedings of the Fourth Workshop on NLP for Similar Languages, Varieties and Dialects (VarDial) (Valencia), 200–209.
Jones, E., Oliphant, T., and Peterson, P. (2001). SciPy: Open Source Scientific Tools for Python. Available online at: https://www.scipy.org (accessed February 11, 2017).
Jones, Z., Yan, Q., Wagner, L., and Clopper, C. G. (2017). The development of dialect classification across the lifespan. J. Phonet. 60, 20–37. doi: 10.1016/j.wocn.2016.11.001
Labov, W. (1977). Language in the Inner City: Studies in the Black English Vernacular. Oxford: Blackwell.
Labov, W. (1994). Principles of Linguistic Change. Internal Factors, Vol. I. Oxford: Wiley-Blackwell.
Labov, W., Shuy, R., Davis, A., and Hogan, R. (1964). Social Dialects and Language Learning. Champaign, IL: National Council of Teachers of English.
Ladefoged, P., and Maddieson, I. (1996). The Sounds of the World's Languages. Oxford: Wiley-Blackwell.
Maas, A. L., Hannun, A. Y., and Ng, A. Y. (2013). “Rectifier nonlinearities improve neural network acoustic models,” in Proceedings of the 30th International Conference on Machine Learning (Atlanta, GA), 1–6.
Mann, V. A. (1980). Influence of preceding liquids on stop-consonant perception. J. Acoust. Soc. Am. 67, S99–S99.
Matejka, P., Zhang, L., Ng, T., Glembek, O., Ma, J. Z., Zhang, B., et al. (2014). “Neural network bottleneck features for language identification,” in Odyssey 2014 The Speaker and Language Recognition Workshop (Joensuu), 299–304.
Menardos, S. (1894). Fonitiki tis dialektou ton simerinon kyprion (phonetics of the dialect of modern cypriots). Athena 6, 146–173.
Mesgarani, N., Cheung, C., Johnson, K., and Chang, E. F. (2014). Phonetic feature encoding in human superior temporal gyrus. Science 343, 1006–1010. doi: 10.1126/science.1245994
Najafian, M., Safavi, S., Weber, P., and Russell, M. J. (2016). “Identification of british english regional accents using fusion of i-vector and multi-accent phonotactic systems,” in Odyssey, 132–139.
Newton, B. E. (1972b). The Generative Interpretation of Dialect. A Study of Modern Greek Phonology. Cambridge: University Press.
Purnell, T., Idsardi, W., and Baugh, J. (1999). Perceptual and phonetic experiments on american english dialect identification. J. Lang. Soc. Psychol. 18, 10–30.
Quinlan, R. (1993). C4.5: Programs for Machine Learning. San Francisco: Morgan Kaufmann Publishers, Inc.
Recasens, D., and Espinosa, A. (2007). Phonetic typology and positional allophones for alveolar rhotics in catalan. Phonetica 64, 1–28. doi: 10.1159/000100059
Richardson, F., Reynolds, D., and Dehak, N. (2015). Deep neural network approaches to speaker and language recognition. IEEE Signal Process. Lett. 22, 1671–1675. doi: 10.1109/LSP.2015.2420092
Rickford, J. R., and Labov, W. (1999). African American Vernacular English: Features, Evolution, Educational Implications. Malden, MA: Blackwell.
Salzberg, S. L. (1994). C4.5: Programs for machine learning by J. Ross Quinlan. Mach. Learn. 16, 235–240.
Schindler, C., and Draxler, C. (2013). “Using spectral moments as a speaker specific feature in nasals and fricatives,” in INTERSPEECH 2013 (Lyon), 2793–2796.
Shon, S., Ali, A., and Glass, J. R. (2018). Convolutional neural networks and language embeddings for end-to-end dialect recognition. CoRR abs/1803.04567. 98–104. doi: 10.21437/Odyssey.2018-14
Snyder, D., Garcia-Romero, D., McCree, A., Sell, G., Povey, D., and Khudanpur, S. (2018). “Spoken language recognition using x-vectors,” in Proceedings of Odyssey 2018 The Speaker and Language Recognition Workshop, 105–111. doi: 10.21437/Odyssey.2018-15
Song, Y., Jiang, B., Bao, Y., Wei, S., and Dai, L.-R. (2013). I-vector representation based on bottleneck features for language identification. Electron. Lett. 49, 1569–1570. doi: 10.1049/el.2013.1721
Themistocleous, C. (2014). Edge-tone effects and prosodic domain effects on final lengthening. Linguist. Variat. 14, 129–160. doi: 10.1075/lv.14.1.06the
Themistocleous, C. (2016a). The bursts of stops can convey dialectal information. J. Acoust. Soc. Am. 140, EL334–EL339. doi: 10.1121/1.4964818
Themistocleous, C. (2016b). Seeking an anchorage. Stability and variability in tonal alignment of rising prenuclear pitch accents in Cypriot Greek. Lang. Speech 59, 433–461. doi: 10.1177/0023830915614602
Themistocleous, C. (2017a). Dialect classification using vowel acoustic parameters. Speech Commun. 92, 13–22. doi: 10.1016/j.specom.2017.05.003
Themistocleous, C. (2017b). Effects of two linguistically proximal varieties on the spectral and coarticulatory properties of fricatives: evidence from Athenian Greek and Cypriot Greek. Front. Psychol. 8:1945. doi: 10.3389/fpsyg.2017.01945
Themistocleous, C. (2017c). The nature of phonetic gradience across a dialect continuum: evidence from modern Greek vowels. Phonetica 74, 157–172. doi: 10.1159/000450554
Themistocleous, C., Savva, A., and Aristodemou, A. (2016). “Effects of stress on fricatives: evidence from standard modern Greek,” in Interspeech 2016 (San Francisco), 1–4.
Tserdanelis, G., and Arvaniti, A. (2001). The Acoustic Characteristics of Geminate Consonants in Cypriot Greek. Thessaloniki: University Studio Press, 29–36.
Vagiakakos, D. (1973). “I kypriaki dialektos kai to istorikon lexikon tis akadimias athinon (cypriot dialect and the historical dictionary of the academy of Athens),” in 1o Diethnes Kyprologiko Synedrio Lefkosia 14–19 Apriliou 1969, Volume C: Neoteron Tmima, Meros V': Filologia Laografia (Athens), 23–102.
Wright, A., Saxena, S., Sheppard, S. M., and Hillis, A. E. (2018). Selective impairments in components of affective prosody in neurologically impaired individuals. Brain Cogn. 124, 29–36. doi: 10.1016/j.bandc.2018.04.001
Keywords: sonorant consonants, deep neural networks, dialect classification, spectral moments, machine learning
Citation: Themistocleous C (2019) Dialect Classification From a Single Sonorant Sound Using Deep Neural Networks. Front. Commun. 4:64. doi: 10.3389/fcomm.2019.00064
Received: 17 April 2019; Accepted: 25 October 2019;
Published: 21 November 2019.
Edited by:
Ludovic Ferrand, Centre National de la Recherche Scientifique (CNRS), FranceReviewed by:
Gabriel Mindlin, University of Buenos Aires, ArgentinaIvilin Peev Stoianov, Italian National Research Council, Italy
Copyright © 2019 Themistocleous. This is an open-access article distributed under the terms of the Creative Commons Attribution License (CC BY). The use, distribution or reproduction in other forums is permitted, provided the original author(s) and the copyright owner(s) are credited and that the original publication in this journal is cited, in accordance with accepted academic practice. No use, distribution or reproduction is permitted which does not comply with these terms.
*Correspondence: Charalambos Themistocleous, Y3RoZW1pczFAamh1LmVkdQ==