- 1Department of Ecology and Evolutionary Biology, University of Connecticut, Storrs, CT, United States
- 2Department of Communication, University of Connecticut, Storrs, CT, United States
- 3Department of Journalism, University of Connecticut, Storrs, CT, United States
There is widespread agreement about the need to assess the success of programs training scientists to communicate more effectively with non-professional audiences. However, there is little agreement about how that should be done. What do we mean when we talk about “effective communication”? What should we measure? How should we measure it? Evaluation of communication training programs often incorporates the views of students or trainers themselves, although this is widely understood to bias the assessment. We recently completed a 3-year experiment to use audiences of non-scientists to evaluate the effect of training on STEM (Science, Technology, Engineering and Math) graduate students’ communication ability. Overall, audiences rated STEM grad students’ communication performance no better after training than before, as we reported in Rubega et al. 2018. However, audience ratings do not reveal whether training changed specific trainee communication behaviors (e.g., jargon use, narrative techniques) even if too little to affect trainees’ overall success. Here we measure trainee communication behavior directly, using multiple textual analysis tools and analysis of trainees’ body language during videotaped talks. We found that student use of jargon declined after training but that use of narrative techniques did not increase. Flesch Reading Ease and Flesch-Kincaid Grade Level scores, used as indicators of complexity of sentences and word choice, were no different after instruction. Trainees’ movement of hands and hesitancy during talks was correlated negatively with audience ratings of credibility and clarity; smiling, on the other hand, was correlated with improvement in credibility, clarity and engagement scores given by audience members. We show that objective tools can be used to measure the success of communication training programs, that non-verbal cues are associated with audience judgments, and that an intensive communication course does change some, if not all, communication behaviors.
Introduction
Programs training scientists to communicate successfully with non-scientist audiences have been operational for decades, but rigorous long-term assessments of those efforts are rare. There is a growing need to resolve that deficit not only to ensure the most viable training is offered but also to allow an informed citizenry to decide public policy questions related to globally threatening scientific issues. Through respectful dialogue, scientists and others in society educate themselves and build support and legitimacy for scientific research (Lessner 2009; Nisbet and Scheufele 2009). Science communication training programs aim to prepare scientists for such dialogues, but how do we know if they succeed?
The few assessments reported are primarily based on anecdotes and self-report evaluations. Comparisons between methods are isolated (Silva and Bultitude 2009). Evaluation of communication training programs often incorporates the views of students or trainers themselves (Baram-Tsabari and Lewenstein 2013, Baram-Tsabari and Lewenstein 2017; Rodgers et al., 2018; Norris et al., 2019; Carroll and Grenon 2021; Dudo et al., 2021), although this has been demonstrated to provide a poor measure of actual skills (McCroskey and McCroskey, 1988; Dunning et al., 2004; Mort and Hansen, 2010). Calls are increasing for the need to assess science communication training (Fischoff 2013; Sharon and Baram-Tsabari 2014; David and Baram-Tsabari 2019), and more attempts are being made, but they still largely lack assessment from non-scientists. For instance, even a recently-developed scale to measure science communication training effectiveness (SCTE) focuses on the perspective of the scientist (Rodgers, et al., 2020). Thus, there is still little agreement about how that should be done: What do we mean when we talk about “effective science communication”? What should we measure? How should we measure it?
The need for more evaluation is made urgent by the proliferation of science communication training programs and by the breadth of approaches being used. Training programs vary from those lasting no more than an hour to full degree programs (Baram-Tsabari and Lewenstein 2017). The students range from graduate students to established STEM (Science, Technology, Engineering and Math) professionals; the pedagogical tools being used can include brief exercises as well as thick textbooks (Dean 2009; Baron 2010; Meredith 2010); and the emphasis can be on modifying communication behavior—emphasizing narrative techniques (Brown and Scholl 2014) or reducing jargon (Stableford and Mettger 2007)–or they can concentrate more on the need to understand audiences, including specific targets such as media and opinion leaders (Miller and Fahy 2009; Beasley and Tanner 2011). Training programs also have emphasized that the news media can be valuable in helping to translate scientific findings to the public (Suleski and Ibaraki 2009). Brevity, taking responsibility for statements, and the value of positive sentence construction are other values considered important for effective science communication (Biber 1995). Workshops and active exercises are a paramount tool of many trainings, although assessments of their value remain lacking (Miller and Fahy 2009; Beasley and Tanner 2011).
In a rare assessment that included experimental control and rigorous statistical analysis, Rubega et al. (2021) conducted a 3-year experiment to evaluate the effect of training on STEM graduate students’ communication ability, as judged by a large audience of undergraduate students in a large public university. In that study, graduate students who took a semester-long course in Science Communication were paired with untrained controls. Both the trained students and controls recorded short videos, both before and after the course, in which they explained the same science concept. Those videos were evaluated by an audience drawn from a large pool of undergraduates in a Communication course. Overall, audiences detected no significant change in STEM graduate students’ communication performance after training as compared to graduate students who were not trained. However, this surprising result left unanswered questions about whether student communication behavior changed in some areas but not others and whether changes were simply too slight to affect the assessment of overall communication success. Was use of jargon reduced, for instance, but not the complexity of sentence structure? Did some communication behaviors change but not others?
In this paper, we explore the usefulness of text analysis tools and behavioral coding to evaluate change in communication behavior and any resulting improvement in communication effectiveness. We analyze transcripts of short, standardized talks given by trainees before and after science communication training, and examine the relationship of body language (e.g., smiling, gesticulating) to audience assessments. Our aim was to determine whether grad student performance changed in particular areas in response to the training, even if that change did not improve their overall effectiveness as judged by audience members who may have been younger than but otherwise were representative of a specific, basically literate audience that is often a target of science outreach efforts.
Materials and Methods
Once yearly, for 3 years (2016–2018), we taught a semester-long science communication course for graduate students in STEM disciplines; undergraduate journalism students also participated in the course. Working with non-scientists and aiding in the production of accurate news stories was one stated goal of the course. Working directly with journalists-in-training helped make the challenges concrete, and contributed to the journalists’ training, as well. We conducted the course as an experiment in which graduate students’ communication success was evaluated before the training and again at the end; the trainees were matched to controls who did not take the course and were evaluated at the same time steps. Our training focused on a communicator’s ability 1) to provide information clearly and understandably (clarity), 2) to appear knowledgeable and trustworthy (credibility), and 3) to make the audience interested in the subject (engagement). We hold that, while communication is a complicated, multistep process and communication experts disagree about the meaning of “effectiveness,” it cannot be achieved in science communication or anywhere else unless each of these conditions exists. Evaluation was done by undergraduate students in a large Communication class, who viewed short videos of the STEM graduate students explaining the scientific process and rated their performance. The undergraduate evaluators answered questions (see Supplementary Table S1) related to the clarity of each presentation, the credibility of the presenter and the evaluators’ engagement with the subject. We briefly describe the course, student selection and data collection procedures here; further details are available in Rubega et al., 2021.
The course consisted of a 4-weeks introductory phase in which readings on communication theory highlighted the role of scientists and journalists in public communication of science. We also discussed barriers to effective science communication (including jargon, abstract language, complexity and non-verbal behavior that could distract audience members), and we introduced various approaches to overcoming those barriers (e.g., Message Boxing, COMPASS Science Communication Inc., 2017; framing, Davis 1995; Morton et al., 2011; narrative structure, Dahlstrom 2014; Intellectual Humility, that is, openness to audience expertise and viewpoint: Lynch 2017; Lynch et al., 2016; for additional detail on course content, see Rubega et al., 2021 and its online Supplementary Material).
The 11 subsequent weeks of the semester were devoted to active practice and post-practice reflection on science communication performance. Each STEM student was interviewed twice by journalism students; the 20-min interviews were conducted outside of class and were video recorded. After each interview, the journalism student then produced a short (500-word) news story based on the interview. In subsequent course meetings, the entire class watched each video and reviewed the news story, discussing whether the news story was clear, whether there were any factual errors, whether the journalism student neglected to ask any important questions, whether analogies used by the STEM student were useful, and identifying the source of any misunderstanding by the journalist. Each student in the course was required to submit a written peer analysis/feedback form completed while watching each video. We discussed and critiqued with students the level of success the scientists had in communicating technical research issues, drawing connections between the communication behaviors of the scientist in each video with the conceptual material covered earlier. STEM grad student enrollment was limited to 10 students each semester. One student dropped out of the course too late to be replaced, leaving a total pool of 29 trainees.
STEM graduate students recruited as controls in the experiment were matched as closely as possible to the experimental subjects, based on discipline, year of degree program, gender, first language, and prior exposure to science communication training, if any. At the beginning and end of the semester, we asked both trainees and controls to respond to the prompt: “How does the scientific process work?” while we recorded them with a video camera. The prompt was unrelated to any specific tasks that were assigned in class; the aim of the training was to prepare them to apply what they had learned, and to successfully communicate about science, in any context. We selected this prompt because it is a question that any graduate STEM student should be able to answer, regardless of scientific discipline, and it removed the potential for audience bias that could be introduced by controversial subjects (e.g., climate change, evolution). In the video recordings, students were allowed to speak for up to 3 minutes but could stop as early as they felt appropriate. All recordings were made in the same studio, using the same cameras, positioning and lighting and a featureless background, under the direction of a university staff member. Videos showed only the head and shoulders of the trainee or control who was speaking.
The videos were evaluated by undergraduate students in the research participation pool of a large Communication class. Each semester, we uploaded “before” and “after” videos for trainees and controls to a Qualtrics XM (Qualtrics, Provo, UT, United States) portal. Students in the research participation pool could choose to participate in our research by selecting one of the videos to watch and evaluate. Each evaluator was assigned randomly by Qualtrics to view one video and provide ratings based on 16 questions designed to assess the trainees’ communication success in the areas of Clarity (six questions such as “The presentation was clear”), Credibility (four questions such as “The speaker seems knowledgeable about the topic”) and Engagement (six questions such as “The speaker seems enthusiastic about the subject”). All ratings used a 7-point Likert-type scale (1 = strongly disagree; 7 = strongly agree). Overall, 400 to 700 evaluators (M = 550) participated each semester, providing, after data quality control eliminations, a minimum of eight ratings per video, with most having 10 or more.
We downloaded survey data from the Qualtrics portal for analysis. We removed all responses from evaluators who incorrectly answered a “speed bump” question designed to eliminate ratings by evaluators who were not paying close attention to the videos. The video evaluation data were analyzed in a hierarchical generalized linear mixed-effects model, using a Bayesian statistical framework (see Rubega et al., 2021 for details). We found that trainees’ overall communication ability improved slightly but not significantly differently from the change in control group scores. Here we use correlation analysis to investigate any relationships that Clarity, Credibility and Engagement scores have with individual trainee’s communication behavior.
We also transcribed the audio from trainee and control videos, using the online transcription service Rev, resulting in one text document per video (N = 116). Each transcript was coded for three areas of interest: 1) overall language use; 2) jargon used; and 3) the use of metaphors, analogies, and stories. In addition, we used the videos themselves to analyze body language, and its relation to scoring by evaluators.
In order to assess language use, we used Linguistic Inquiry and Word Count (LIWC) analysis of student transcripts. LIWC analysis (Pennebaker et al., 2015) provides an automated count of the total number of words in a transcript and of the types of words used (e.g., pronouns, verbs, adjectives). Then, it matches words to a standard dictionary to generate scores of four summary dimensions: Analytical Thinking, Clout, Authenticity, and Emotional Tone. We also ran each transcript through Microsoft Word’s Flesch Reading Ease and Flesch-Kincaid Grade Level calculators. While these are meant to assess the difficulty of written (not spoken) text, we believe they offer insight into the complexity of language used before and after training.
In order to measure whether trainees used less jargon after training, we submitted every transcript to the De-Jargonizer (Rakedzon et al., 2017). The De-Jargonizer is a software application that assigns words to categories based on how frequently those words appear in a corpus of more than 500,000 words published on BBC news websites from 2012 to 2015. The De-Jargonizer produces a final score (higher scores are more free of jargon) that depends on the proportion of rare or uncommon words to total words used. We cleaned all transcripts before analysis to remove partial words and “fillers” such as “um” and “uh,” which the tool erroneously classified as rare words, inflating the final jargon use scores. We also modified the De-Jargonizer so that some words commonly used in spoken American English and/or not relating directly to science or scientific concepts would no longer be identified by the tool as jargon. The authors made the modification by submitting all transcripts to the De-Jargonizer, and then reviewing the list of all words identified as “Red” (or, rare, and therefore jargon) by the De-Jargonizer algorithm; all authors then reached a consensus on which should be considered scientific jargon. We eliminated words such as “fig,” “burp,” “yummy,” “toaster” and “houseplant” that seemed in common use, and not arcane words that would be familiar only to a scientist or used in a scientific context (such as “ecosystem,” “protist” and “photosynthesis”), which we felt could legitimately be considered scientific jargon. In addition, we moved some words originally assigned to a mid-frequency (“normal words”) group to the jargon list (“hypothesis,” “habitat” and “variable,” for example). The modification reduced the total number of words used by all trainees and controls that were recognized as jargon from 125 to 73. A complete list of the reclassifications we enacted in the De-Jargonizer is in Supplementary Table S2. We compared STEM trainees’ De-Jargonizer scores after training with those from before training, and also compared the difference to the before-and-later difference in scores from the control group.
Two of the authors (MAR and RSC) independently coded every transcript for the use of metaphors, analogies, or stories (narratives). Each coder separately counted and then summed the total number of text elements of analogies, metaphors or stories in the video transcriptions in each text.
Two research assistants independently coded videos for speech behaviors and body language. They coded for: speech rate (1 = Very slow—5 = Very fast); speech tone (1 = Very monotone—5 = Very dynamic); and how often each participant stuttered, paused, smiled, laughed, looked at or away from the camera, leaned forward, or moved their hands. Not all movements made by trainees and controls were captured in the videos so the numbers recorded represent a conservative estimate of the true number of movements. The coding sheet was developed in collaboration between the coders and one author (AOH) by watching sample videos to note possible behaviors to code. Both coders independently tested the coding sheet on a subset (10%) of the videos and discussed the results to increase consistency in coding. Coding uncertainties were resolved between coders and AOH, and the coders split the full set of videos for coding.
Results
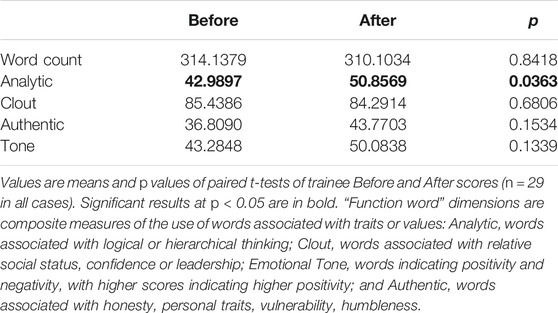
The LIWC summary variable “Analytic,” which is based on eight “function word” dimensions, increased significantly, indicating that our trainees used more words associated with logical or hierarchical thinking after training than before (Table 1). Among other summary variables, Clout (words associated with relative social status, confidence or leadership), Emotional Tone (combines words indicating of positivity and negativity, with higher scores indicating higher positivity) and Authenticity (words associated with honesty, personal traits, vulnerability, humbleness) did not change after training. Word Count also did not change after training. The change between before and after did not differ significantly for any of the LIWC summary variables between trainee and control transcripts (Table 2).
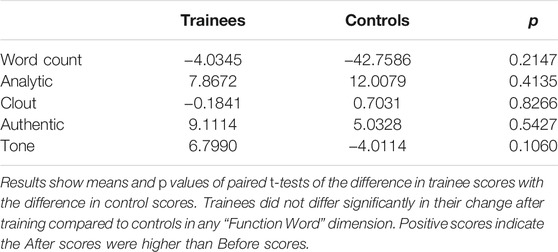
TABLE 2. Change in trainees’ LIWC scores (After scores minus Before scores) compared to change in control scores.
The LIWC scoring of trainees’ transcripts before and after training also provided output for 68 singular (non-summary) variables that could be calculated (four scores could not be calculated because all of the Before or After scores were zeroes; twelve standard LIWC variables were eliminated from scoring because they related to punctuation use, which could not be appropriately assessed with video transcripts). The large number of variables LIWC creates, and the resulting large number of potential pairwise comparisons means that at least four false positive results could be expected by chance alone. Since we had no a priori hypotheses about any of the singular variables generated, we do not report those comparisons here, and did not pursue a more complex form of analysis of these variables. However, for those interested, we provide the output for each singular variable in the Supplementary Table S3).
The Flesch Reading Ease (Figure 1A) and Flesch-Kincaid Grade Level (Figure 1B) scores of trainees were not significantly different after instruction than before in paired t-tests. The mean Flesch score was 59.03 ± 2.7441 before training and 60.61 ± 2.0603 after training (t = −0.5693, p = 0.5737), and the Flesch-Kincaid score was 11.28 ± 0.8707 before and 11.16 ± 0.6737 after training (t = 0.1186, p = 0.9065). In contrast, we found some indication that the simplicity of presentation matters, though not in the direction expected: Reading Ease scores of transcripts correlated negatively with audience responses to the Credibility prompt “The subject is relevant to my interests” (i.e., the easier the transcript was to read, the less the audience reviewers felt the subject being spoken about was relevant to them; Figure 2).
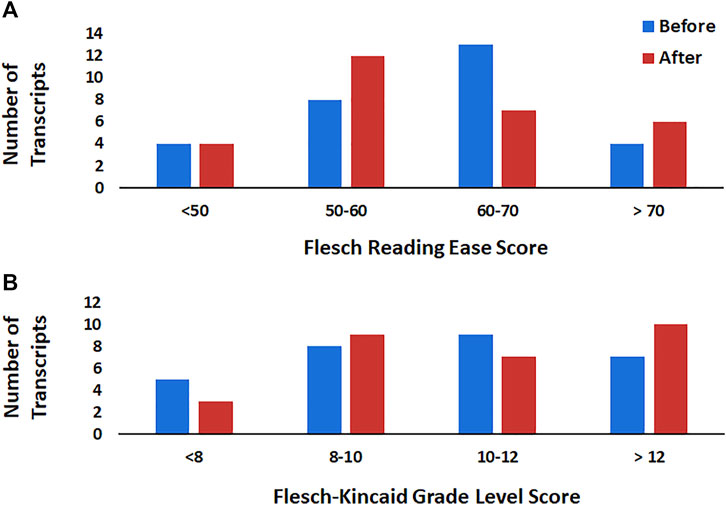
FIGURE 1. Scores reflecting the (A) reading ease and (B) grade level assignment of the transcripts of trainees before (blue) and after (red) science communication training. There was no significant change in the mean reading ease or grade level scores after training, suggesting that, overall, trainees did not simplify the way that they spoke to audiences after training.
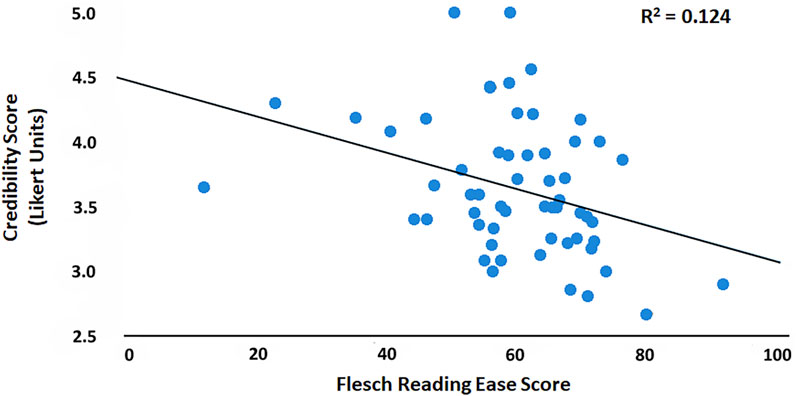
FIGURE 2. Audience scoring of Credibility (“The subject is relevant to my interests”) declines as transcript Reading Ease scores go up. The higher the Reading Ease score, the easier the text of the transcript is to read, i.e., the words and sentence structure are less complex.
Overall, we did not find a significant change in the De-Jargonizer scores after training (means ± SE before/after in paired t-tests: 95.9 ± 0.3771/96.3 ± 0.3797; t = −1.02, p = 0.31). However, the mean number of times jargon words were used in trainee transcripts declined significantly (Figure 3; 4.7 ± 0.7142 before and 3.3 ± 0.6342 after; t = 1.95, p = 0.0307 in a one-sided test of the hypothesis that training reduced jargon use). In addition, the mean number of discrete jargon words that were used by trainees, on average, declined significantly (Figure 4; 2.2 ± 0.3257 before, 1.5 ± 0.3003 after; t = 1.74, p = 0.0450 in a one-sided test of the hypothesis that training reduced jargon use). The apparent contradiction in these results–no change in De-Jargonizer scores, even though jargon use declined–results from the way the De-Jargonizer score is calculated; specifically, it is the proportion of rare or uncommon (“normal” words is the term used in the De-Jargonizer; uncommon but not jargon) words to total words used. Although trainees used fewer rare (= jargon) words, they used more uncommon words, rather than replacing jargon with common words. Thus, any gain in the De-Jargonizer score that would have resulted from reducing jargon words was largely erased by the increase in uncommon words, on average.
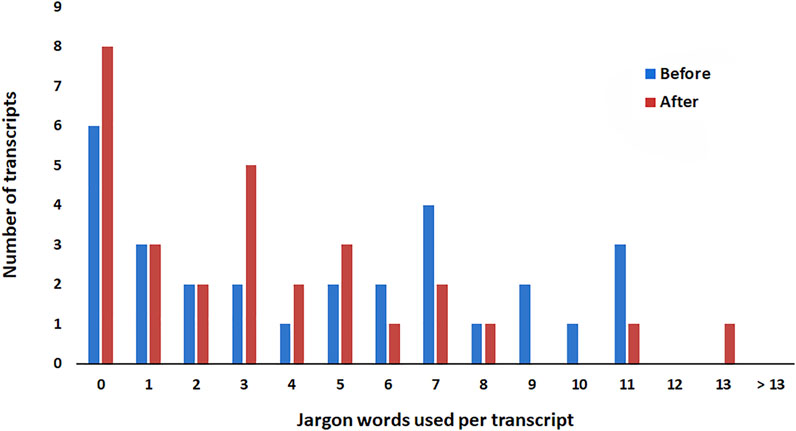
FIGURE 3. Frequency of jargon use, per transcript, before (blue) and after (red) science communication training. After training, the number of transcripts in which trainees used jargon three or fewer times rose as the number of transcripts with high jargon frequency fell.
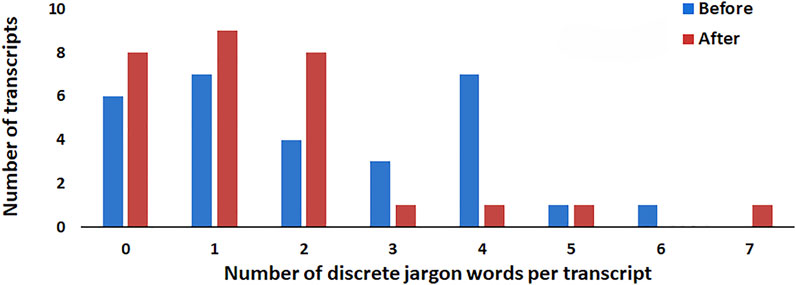
FIGURE 4. The number of discrete jargon words used, per transcript, before (blue) and after (red) science communication training. After training, the number of transcripts in which trainees used two or fewer different jargon words rose, as the number of transcripts in which trainees used many different jargon words fell.
Neither the mean number of times jargon was used nor the mean number of discrete jargon words used in a transcript changed in the control group (5.1 ± 0.9249 before, 4.9 ± 0.7187 after for total number of times jargon words were used, t = 0.3060, p = 0.7619; 2.0 ± 0.2914 before and 2.0 ± 0.2829 after for the number of different jargon words used, t = 0, p = 1). Further evidence that trainee jargon use declined came from examining the number of trainees using jargon at low vs. high frequencies. The number of trainees who used jargon three times or fewer rose from 13 before to 18 after training. The number of trainees using jargon words seven times or more dropped from 11 before to 5 after. The number of trainees using two or fewer different jargon words increased from 17 (59%) before to 25 (86%) after. Before the class, 12 trainees used three or more different jargon words, but after the class only four trainees did. Overall, we conclude that training reduced the use of jargon.
In contrast to the shift in jargon use, we found that training did not significantly increase the number of trainees who used metaphors, analogies, or narrative techniques in explaining the scientific method to a non-scientist audience. In one coding (RSC), 17 of 29 trainees used at least one story, metaphor or analogy before training and 22 of them used at least one such tool afterwards. In a second, independent coding (MR), 16 of 29 trainees used at least one story, metaphor, or analogy before and 21 used at least one after training. The increase was not significant in Fisher’s exact test, regardless of coder (p = 0.263 in the first analysis and p = 0.274 in the second). However, audiences responded to the use of stories when it occurred; frequency of story or metaphorical elements in a transcript correlated with higher scores on an element of Clarity related to audience understanding (Figure 5).
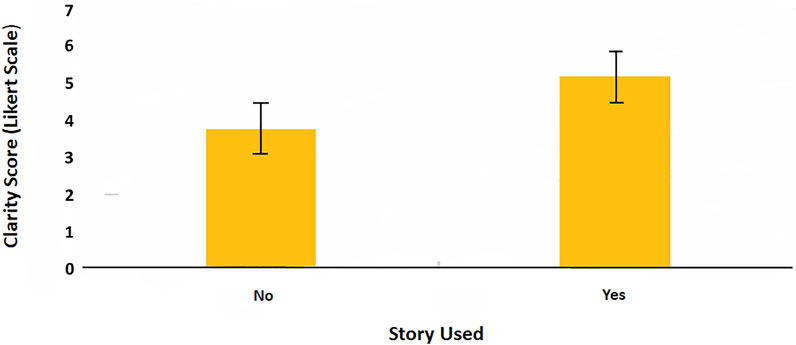
FIGURE 5. Clarity scores for transcripts in which trainees did (right hand panel) and did not (left hand panel) use elements of story, metaphor and/or analogy.
We found no change in elements of non-verbal communication after training compared with behavior before training when we analyzed the number of stutters, pauses, laughter, use of “verbal fillers,” incidence of smiling, changes in speech tone, or frequency of head movements, hand movements or body movements used by trainees. However, we found that some behaviors were clearly correlated with the scores for Clarity, Credibility and Engagement given to students by undergraduate audiences in our experiment (Figure 6; Table 3). Pausing and stop-and-start speech were negatively correlated with both Clarity and Credibility. Smiling was correlated positively with Clarity, Credibility and audience Engagement. Varying a speaker’s tone was correlated with higher Clarity, Credibility and audience Engagement.
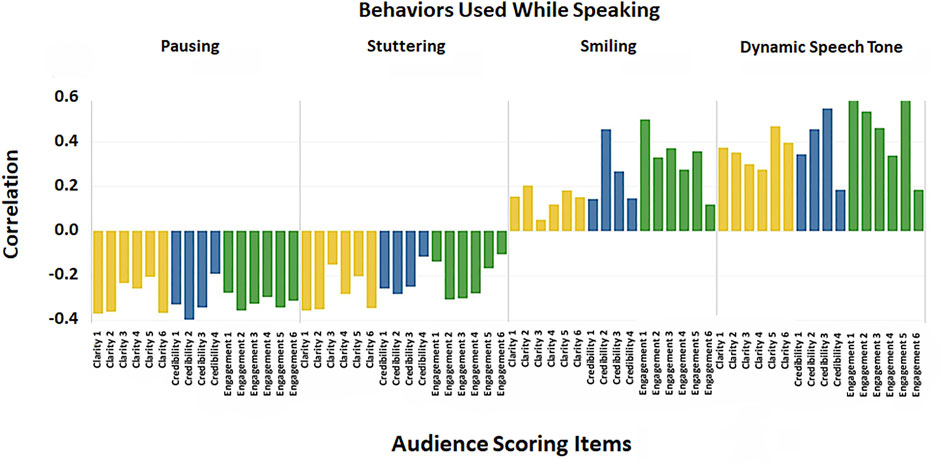
FIGURE 6. The relationship of behaviors exhibited during speaking to clarity (yellow, left bar in each panel), credibility (blue, middle bar in each panel) and audience engagement (green, right bar in each panel). Pausing and stuttering during speaking are associated with low scores from audiences on all dimensions of communication performance; smiling and a dynamic speaking tone are associated with high scores from audiences. See Table 3 for correlation values.

TABLE 3. Correlations among trainee communication behaviors and audience ratings on measures of Clarity, Credibility, and Audience Engagement (see Supplementary Table S1 for specific items).
Discussion
Our results show that it is possible to gain insight into the effects of science communication training on the specific ways in which trainees do, and equally importantly, don’t change their approach to communicating science. On one hand, our analysis shows that, on average, training reduced the number of jargon words trainees used, and the number of times they used them. On the other hand, most trainees still used some jargon, and overall, their speech remained pitched at about the same level of difficulty in understanding for the audience as before training. In some dimensions, such as their use of words associated with logic and hierarchical thinking, their speech became more complex, rather than simpler. They were no more likely after training to use metaphors, analogies or stories, which are widely viewed as effective science communication techniques, and which were covered extensively in their training.
These results underpin, and help explain, our earlier results (Rubega et al., 2021) showing that audiences did not find the communication of trainees more effective after training than before. To a large, and disheartening, degree, trainees simply are not enacting the techniques and behavior that training aims to instill. Our data cannot address why this might be, though our anecdotal observations during the after-training video recordings suggest strongly that trainees simply did not actively prepare by using techniques they had been trained to use in class, such as the Message Box: they just extemporized in the same way that they had before training. While none of the trainers expected, and we would not have allowed, the use of notes or an outline, it is not too much to say that we were astonished at the lack of strategic preparation. A 3-min time limit is a demanding form, and the difficulty of being brief while also being clear and engaging was often discussed in class. Acknowledging that, it is all the more surprising that they apparently did not prepare. They were informed at the beginning of the course that they would be expected to re-record their attempt to explain how the scientific process works; they had control over when they were scheduled to do so; they spent 15 weeks in active practice and engagement with the ways in which communication fails without active preparation. Why didn’t they prepare for this relatively simple, predictable task? We suspect that the lack of preparation for the after-training communication task that we saw in our students is a side effect of the inflated sense of self-efficacy demonstrated in a variety of other training contexts, as well as in our study (McCroskey and McCroskey, 1988; Dunning et al., 2004; Mort and Hansen, 2010; Rubega et al., 2021): a trainee tends to conflate understanding with the ability to perform.
Although behaviors often addressed in science communication training (e.g., smiling to increase the impression of friendliness and relatability; speaking without verbal fillers), did not change, we did find evidence that these behaviors matter: audiences rate students who frequently pause during speaking lower on scales of Clarity and Credibility; they rate students who smile frequently, and who avoid speaking in a monotone, as more clear, more credible, and more engaging. Those students who did employ stories were rated more highly for Clarity. As an illustration of the complexity of what we might view as “success” in science communication training, the more simply a student spoke (as measured by the reading ease of transcripts of speech), the less relevant the audience found their topic. This surprising result ought to give us pause when thinking about how science communication training is structured, and for whom. In some contexts, such as interactions with policy makers, the goal of making the subject relevant and credible may have to be balanced against other goals, such as jargon reduction.
What are we to take away from these results? One point that stands out clearly is the importance, before beginning any science communication training program, of defining what will count as successful training in terms of metrics that are clearly defined, repeatably measurable, do not rely on self-reporting or assessment by either the trainer(s) or trainees, and are related to evidence-based effects on audiences. While the results of our work were not what we hoped for in terms of students’ communication effectiveness, this failure did nothing to shake our belief that objective measurement of communication success is both possible and essential. Some tools are available already and more are needed. While we felt it needed adjustment, the De-Jargonizer was easily adapted to use with written transcripts of video recordings of short talks for non-professional audiences. The reading ease and LIWC tools were even more easily applied, and both provided valuable information on student performance, free of the bias associated with student or teacher assessments.
While a cognitive grasp of the barriers to communication is unquestionably a necessary precursor to successful performance, it is clearly insufficient, just as you can’t improve your backhand by only reading about following through with the racket. Assuming the analogy is correct, introduction to evidence-based concepts underlying successful science communication is only one component of training, distinct from, and arguably less important than, an emphasis on the need for active preparation for every encounter, and actual practice. A single, short training is likely to be valuable for making trainees aware of science communication concepts; it is unlikely to have any effect on performance. How much practice, and what kind of practice, is necessary before changes in communication behavior begin to take hold for trainees? We are unaware of any rigorous study of that question but view it as an important question for future development of time- and cost-effective science communication training programs.
It’s plausible that no science communication training course can provide enough time and practice to change communication behaviors within the time stamp of the course itself. Instilling a growth mindset in trainees–getting them to acknowledge that they will fail repeatedly on the way to succeeding–may be more important than any other component of science communication training. The biggest barrier to creating skilled science communicators may well be the willingness of trainees to continue using preparation techniques, and practicing, instead of just “winging it” on the mistaken belief that knowing about how to communicate is the same as being able to do so successfully.
Data Availability Statement
The anonymized data supporting the conclusions of this article will be made available by the authors; direct requests to bWFyZ2FyZXQucnViZWdhQHVjb25uLmVkdQ==. In accordance with the terms of our human-subjects research approvals, and in order to protect the privacy of the participants, the videos from which the raw data derive will not be made available.
Ethics Statement
Permission for human subjects research was granted by the University of Connecticut Institutional Review Board, Protocol #016-026. The patients/participants provided their written informed consent to participate in this study.
Author Contributions
RSC, AO-H, RW, and MAR designed the experiment from which the data are drawn; RSC, RW, and MAR designed and taught the classes on which the experiment was based. RSC and AO-H conducted the data analyses. KRB recruited and managed the controls, conducted the video recordings, maintained datasets, and contributed to analysis. All authors contributed to the writing of the paper.
Funding
This project was funded by National Science Foundation NRT-IGE award 1545458 to MAR, RW and RSC. The Dean of the College of Liberal Arts and Sciences and the Office of the Vice Provost for Research at the University of Connecticut contributed funding that made possible assistance to the authors with course and survey design, and with video production. Article processing fees are pending from the University of Connecticut Scholarship Facilitation Fund.
Conflict of Interest
The authors declare that the research was conducted in the absence of any commercial or financial relationships that could be construed as a potential conflict of interest.
Publisher’s Note
All claims expressed in this article are solely those of the authors and do not necessarily represent those of their affiliated organizations, or those of the publisher, the editors and the reviewers. Any product that may be evaluated in this article, or claim that may be made by its manufacturer, is not guaranteed or endorsed by the publisher.
Acknowledgments
We thank Jae Eun Joo for assistance with course and survey design; Paul Lyzun for his assistance with video recording of trainees and controls; Stephen Stifano for facilitating our use of the University of Connecticut communication research pool for this study; Scott Wallace for filling in during the last year of our course; Todd Newman for his work in program support in the early stages of the project; and the Departments of Ecology and Evolutionary Biology and Journalism at the University of Connecticut for teaching releases to MR and RW in support of this project. The University of Connecticut Institutional Review Board, Protocol #016-026, granted permission for human subjects research.
Supplementary Material
The Supplementary Material for this article can be found online at: https://www.frontiersin.org/articles/10.3389/fcomm.2021.805630/full#supplementary-material
References
Baram-Tsabari, A., and Lewenstein, B. V. (2013). An Instrument for Assessing Scientists' Written Skills in Public Communication of Science. Sci. Commun. 35 (1), 56–85. doi:10.1177/1075547012440634
Baram-Tsabari, A., and Lewenstein, B. V. (2017). Science Communication Training: What Are We Trying to Teach? Int. J. Sci. Educ. B 7, 285–300. doi:10.1080/21548455.2017.1303756
Barel-Ben David, Y., and Baram-Tsabari, A. (2019). “Evaluating Science Communication Training,” in Theory and Best Practices in Science Communication Training. Editor T. P. Newman (London and New York: Routledge), 122–138. doi:10.4324/978135106936610.4324/9781351069366-9
Baron, N. (2010). Escape from the Ivory tower, A Guide to Making Your Science Matter. Washington: Island Press.
Besley, J. C., and Tanner, A. H. (2011). What Science Communication Scholars Think about Training Scientists to Communicate. Sci. Commun. 33 (2), 239–263. doi:10.1177/1075547010386972
Brown, P., and Scholl, R. (2014). Expert Interviews with Science Communicators: How Perceptions of Audience Values Influence Science Communication Values and Practices. F1000Res 3, 128. doi:10.12688/f1000research.4415.1
Carroll, S., and Grenon, M. (2021). Practice Makes Progress: an Evaluation of an Online Scientist-Student Chat Activity in Improving Scientists' Perceived Communication Skills. Irish Educ. Stud. 40, 255–264. doi:10.1080/03323315.2021.1915840
COMPASS Science Communication Inc. (2017). The Message Box Workbook. Portland, OR. https://www.compassscicomm.org/.
Dahlstrom, M. F. (2014). Using Narratives and Storytelling to Communicate Science with Nonexpert Audiences. Proc. Natl. Acad. Sci. 111 (Suppl. 4), 13614–13620. doi:10.1073/pnas.1320645111
Davis, J. J. (1995). The Effects of Message Framing on Response to Environmental Communications. Journalism Mass Commun. Q. 72 (2), 285–299. doi:10.1177/107769909507200203
Dean, C. (2009). Am I Making Myself clear? A Scientist’s Guide to Talking to the Public. Cambridge: Harvard University Press.
Dudo, A., Besley, J. C., and Yuan, S. (2021). Science Communication Training in North America: Preparing Whom to Do what with what Effect? Sci. Commun. 43, 33–63. doi:10.1177/1075547020960138
Dunning, D., Heath, C., and Suls, J. M. (2004). Flawed self-assessment: Implications for health, education, and the workplace Psychol. Sci. Public Inter. 5 (3), 69–106. doi:10.1111/j.1529-1006.2004.00018.x
Fischhoff, B. (2019). Evaluating Science Communication. Proc. Natl. Acad. Sci. USA 116, 7670–7675. doi:10.1073/pnas.1805863115
Fischhoff, B. (2013). The Sciences of Science Communication. Proc. Natl. Acad. Sci. 110, 14033–14039. doi:10.1073/pnas.1213273110
Heath, K. D., Bagley, E., Berkey, A. J. M., Birlenbach, D. M., Carr-Markell, M. K., Crawford, J. W., et al. (2014). Amplify the Signal: Graduate Training in Broader Impacts of Scientific Research. BioScience 64 (6), 517–523. doi:10.1093/biosci/biu051
Lessner, A. I. (2009). Alan Leshner: Commentary on the Pew/AAAS Survey of Public Attitudes towards U.S. Scientific Achievements. Washington, D.C.: AAAS news release. Available at: http://www.aaas.org/news/release/2009/0709pew_leshner_response.shtml.
Lynch, M. P., Johnson, C. R., Sheff, N., and Gunn, H. (2016). Intellectual Humility in Public Discourse. IHPD Literature Review. Available at: https://humilityandconviction.uconn.edu/wp-content/uploads/sites/1877/2016/09/IHPD-Literature-Reviewrevised.pdf.
Lynch, M. P. (2017). Teaching Humility in an Age of Arrogance, 64. Washington, D.C.: Chronicle of Higher Education. Available at: https://www.chronicle.com/article/Teaching-Humility-in-an-Age-of/240266.
McCroskey, J. C., and McCroskey, L. L. (1988). Self-report as an approach to measuring communication competence Commun. Res. Rep. 5 (2), 108–113. doi:10.1080/08824098809359810
Meredith, D. (2010). Explaining Research: How to Reach Key Audiences to advance Your Work. New York: Oxford University Press.
Miller, S., and Fahy, D. (2009). Can Science Communication Workshops Train Scientists for Reflexive Public Engagement? Sci. Commun. 31 (1), 116–126. doi:10.1177/1075547009339048
Mort, J. R., and Hansen, D. J. (2010). First-year pharmacy students’ self-assessment of communication skills and the impact of video review Amer. J. Pharmaceut. Educ. 74 (5), 78. doi:10.5688/aj740578
Morton, T. A., Rabinovich, A., Marshall, D., and Bretschneider, P. (2011). The Future that May (Or May Not) Come: How Framing Changes Responses to Uncertainty in Climate Change Communications. Glob. Environ. Change 21 (1), 103–109. doi:10.1016/j.gloenvcha.2010.09.013
Nisbet, M. C., and Scheufele, D. A. (2009). What's Next for Science Communication? Promising Directions and Lingering Distractions. Am. J. Bot. 96 (10), 1767–1778. doi:10.3732/ajb.0900041
Norris, S. L., Murphrey, T. P., and Legette, H. R. (2019). Do They Believe They Can Communicate? Assessing College Students' Perceived Ability to Communicate about Agricultural Sciences. J. Agric. Edu. 60, 53–70. doi:10.5032/jae.2019.04053
Pennebaker, J. W., Booth, R. J., Boyd, R. L., and Francis, M. E. (2015). Linguistic Inquiry and Word Count: LIWC2015. Austin, TX: Pennebaker Conglomerates. www.LIWC.net.
Rakedzon, T., Segev, E., Chapnik, N., Yosef, R., and Baram-Tsabari, A. (2017). Automatic Jargon Identifier for Scientists Engaging with the Public and Science Communication Educators. PLoS One 12 (8), e0181742. doi:10.1371/journal.pone.0181742
Rodgers, S., Wang, Z., Maras, M. A., Burgoyne, S., Balakrishnan, B., Stemmle, J., et al. (2018). Decoding Science: Development and Evaluation of a Science Communication Training Program Using a Triangulated Framework. Sci. Commun. 40, 3–32. doi:10.1177/1075547017747285
Rodgers, S., Wang, Z., and Schultz, J. C. (2020). A Scale to Measure Science Communication Training Effectiveness. Sci. Commun. 42, 90–111. doi:10.1177/1075547020903057
Rubega, M. A., Burgio, K. R., MacDonald, A. A. M., Oeldorf-Hirsch, A., Capers, R. S., and Wyss, R. (2021). Assessment by Audiences Shows Little Effect of Science Communication Training. Sci. Commun. 43, 139–169. doi:10.1177/1075547020971639
Sharon, A. J., and Baram-Tsabari, A. (2014). Measuring Mumbo Jumbo: A Preliminary Quantification of the Use of Jargon in Science Communication. Public Underst Sci. 23, 528–546. doi:10.1177/0963662512469916
Silva, J., and Bultitude, K. (2009). Best Practices in Science Communication Training for Engaging with Science, Technology, Engineering and Mathematics. J. Sci. Commun. 8 (2). doi:10.22323/2.08020203
Stableford, S., and Mettger, W. (2007). Plain Language: A Strategic Response to the Health Literacy challenge. J. Public Health Pol. 28 (1), 71–93. doi:10.1057/palgrave.jphp.3200102
Suleski, J., and Ibaraki, M. (2009). Scientists Are Talking, but Mostly to Each Other: A Quantitative Analysis of Research Represented in Mass media. Public Underst Sci. 19 (1), 115–125. doi:10.1177/0963662508096776
Keywords: graduate training, education, evidence-based, audience, jargon, narrative, non-verbal, STEM
Citation: Capers RS, Oeldorf-Hirsch A, Wyss R, Burgio KR and Rubega MA (2022) What Did They Learn? Objective Assessment Tools Show Mixed Effects of Training on Science Communication Behaviors. Front. Commun. 6:805630. doi: 10.3389/fcomm.2021.805630
Received: 30 October 2021; Accepted: 28 December 2021;
Published: 01 February 2022.
Edited by:
Ingrid Lofgren, University of Rhode Island, United StatesReviewed by:
Yiqiong Zhang, Guangdong University of Foreign Studies, ChinaMari Carmen Campoy-Cubillo, University of Jaume I, Spain
Copyright © 2022 Capers, Oeldorf-Hirsch, Wyss, Burgio and Rubega. This is an open-access article distributed under the terms of the Creative Commons Attribution License (CC BY). The use, distribution or reproduction in other forums is permitted, provided the original author(s) and the copyright owner(s) are credited and that the original publication in this journal is cited, in accordance with accepted academic practice. No use, distribution or reproduction is permitted which does not comply with these terms.
*Correspondence: Margaret A. Rubega, bWFyZ2FyZXQucnViZWdhQHVjb25uLmVkdQ==
 Robert S. Capers
 Anne Oeldorf-Hirsch
 Robert Wyss
 Kevin R. Burgio
 Margaret A. Rubega