 Phil J. Howson1,2*
 Philip J. Monahan2,3,4
- 1Leibniz-Zentrum Allgemeine Sprachwissenschaft, Berlin, Germany
- 2Department of Linguistics, University of Toronto, Toronto, ON, Canada
- 3Department of Language Studies, University of Toronto Scarborough, Toronto, ON, Canada
- 4Department of Psychology, University of Toronto Scarborough, Toronto, ON, Canada
Czech has a sibilant inventory that contrasts at three places of articulation: Alveolar, a pre-post-alveolar, and palato-alveolar. The specific aim of this study is to examine the perception of the typologically rare Czech sibilant inventory and to determine whether acoustic-perceptual characteristics play a role in the maintenance of the Czech trill-fricative. These results are compared to a more common three-way sibilant inventory, Polish. Native Czech listeners performed an auditory AX discrimination task in two blocks: A Czech block and a Polish block. Stimuli were embedded in varying levels of noise to increase task difficulty. Signal-to-noise ratio differences affected the perception of the Czech sibilants more than Polish sibilants. Moreover, a multidimensional scaling analysis revealed less perceptual dispersion for the Czech inventory than the Polish inventory. These results suggest that there is greater difficulty maintaining the Czech inventory considering the signal-to-noise comparisons and that this a factor that contributes to its rarity; however, similarities in perceptual dispersion indicate that maintenance across several acoustic-perceptual cues is possible, and Czech shows few signs of losing this typologically rare contrast.
Introduction
The current goal is to understand how Czech listeners maintain the typologically rare trill-fricative in relation to other sibilants in their inventory. Specifically, we tested the perception of Czech and Polish sibilant inventories with native Czech speakers. Both languages contain coronal fricatives that contrast at three places of articulation (Czech: alveolar /s, z/, pre-post alveolar trill-fricative /r̝/, palato-alveolar /ʃ, ʒ/; Polish: dental /s̪ z̪/, retroflex /ʂ, ʐ/, alveolopalatal /ɕ, ʑ/). We used the voiced fricatives embedded in different noise levels to examine how the acoustic-perceptual qualities of Czech and Polish inventories play a role in maintaining the synchronic Czech inventory.
While three-way sibilant contrasts are relatively rare, the most typical systems are /s, ʂ, ʃ/ and /s, ʂ, ɕ/ (Maddieson, 1984). These inventories are thought to be common because of the acoustic-perceptual distinctions between the different sibilants (Żygis, 2003). Only two languages appear to contrast /ʃ/ and /ɕ/ (Żygis and Padgett, 2010), and this scarcity is potentially due to acoustic-perceptual motivations: /ʂ, ɕ/ and /ʂ, ʃ/ are more acoustically dispersed than /ʃ, ɕ/ (Żygis, 2006). Moreover, the findings of Żygis and Padgett (2010), who used an AX discrimination task to test the discriminability between /s, ʂ, ɕ, ʃj/, indicated that perceptual cues may have played a role in the Old Polish sound change from /s, ɕ, ʃj/ to /s, ʂ, ɕ/. They observed difficulty that would disfavour a language that utilized a /ɕ/ – /ʃ/ contrast. Finally, a multidimensional scaling (MDS) analysis indicated that the pair /ʂ, ɕ/ was the most distinct, while /ɕ, ʃj/ and /ʂ, ʃj/ were the most confusable, suggesting that the Old Polish historical change from /ʃj/ to /ʂ/ occurred due to perceptual pressures.
The perceptual resilience of the modern Polish sibilant inventory has also been investigated to understand how contrast is maintained. Nowak (2006) compared the perceptual cues of the three-way sibilant contrast in Polish, examining the importance of both vowel transitions and spectral information. Identification of alveolopalatals became poor when the vocalic transitions for a retroflex or dental were cross-spliced, suggesting that vocalic transitions for the vowel following the fricative are important in differentiating alveolopalatals from other fricatives (see also Li and Zhang, 2017 for Mandarin Chinese). Sibilant fricatives were also presented in isolation to listeners, who were able to distinguish sibilant fricatives based solely on spectral qualities.
In short, phonological systems appear to gravitate toward three-way sibilant contrasts of the type /s, ʂ, ɕ/ due to pressures to maintain perceptual contrasts between segments; however, other sibilant inventories exist, such as the type found in Czech. Therefore, the aim of the current research is to understand what acoustic-perceptual cues contribute to the maintenance of the Czech inventory. To our knowledge, Czech is the only language that contains the trill-fricative, /r̝/; however, a few languages reportedly have a “breathy” variant of the trill that resembles the trill-fricative (Henriksen and Willis, 2010; Kadenge and Mudzingwa, 2012). The typological rarity of the trill-fricative raises questions about its maintenance within Czech. Rare segments are often uncommon either because they are difficult to articulate (Kavitskaya et al., 2009) or because they lack robust acoustic cues (Blevins, 2018).
Sibilant fricatives are typically defined as a subgroup of fricatives that have high intensity noise due to the impact of the airstream against an obstacle, such as the incisors (Shadle, 1985; 1991). Unlike non-sibilant fricatives, there are strong perceptual correlates to the place of articulation in the spectral properties of sibilants. Furthermore, the spectral envelope for sibilants can be exceedingly wide compared to other segments—up to 15 kHz—and the back cavity behind the constriction location is inactive for generating the spectral qualities of these segments (Toda et al., 2010).
There is also acoustic variation in three-way sibilant contrasts across languages, even when they have the same phonemic inventory. Lee-Kim (2011) examined the spectral moments of the three-way sibilant contrast in both Mandarin and Polish. There was a notable difference in the center of gravity (COG) for Mandarin /ɕ/ (∼ 8 kHz) compared to Polish /ɕ/ (∼ 4 kHz). The acoustic differences between these sets of sounds leave open the possibility that languages can make use of the acoustic-perceptual space in a multitude of ways to maintain contrast between sibilants in complex systems. As such, sibilant fricative systems make robust use of multiple cues to maintain distinctions between contrasts, and the use of cues vary dependant on the language, even when similar sibilant contrasts are present. Therefore, it is of interest to better understand the characteristics of the trill-fricative and the acoustic-perceptual qualities that contribute to its maintenance within the Czech system.
There have been many phonological analyses of the trill-fricative, many of which focus on the fact that unlike other obstruents in Czech that only undergo regressive voicing assimilation, the trill-fricative assimilates to the voicing specification of any adjacent segment either progressively or regressively, and despite the fact that within a word it cannot trigger voicing assimilation, it can trigger voicing assimilation across word boundaries (Vachek, 1963; Skaličková, 1974). There have, however, been relatively few acoustic and articulatory studies.
Previous acoustic studies have described the trill-fricative as having 1-2 times more tongue-palate contacts than /r/, which vibrates 1-3 times (Dankovičová, 1997), although it has been noted that the Czech trill-fricative is not always trilled, and its realization is contextually dependant (Pavlík, 2013). The trill-fricative induces a much higher spectral tilt on adjacent vowels and a lower F1 compared to the trill, indicating a more open glottal state consistent with breathy voice during production the trill-fricative (Howson et al., 2014). Additionally, the trill-fricative is produced further forward in the mouth than the contrasting trill, /r/ (Ladefoged and Maddieson, 1996), and does not always have a complete closure (Hála, 1923). Short (1987) described the trill-fricative as a “rolled post-alveolar fricative” that does not exhibit “ʒ”-like frication; however, Howson et al. (2015) performed an electromagnetic articulography (EMA) study of the Czech trill-fricative and found that the degree of tongue grooving did not differ significantly from contrasting /ʃ, ʒ/ and suggested that it does indeed have “ʒ”-like frication. Howson et al. (2014) also observed significant variation in tongue posturing for the trill-fricative compared to the trill that varied as a function of both word-position and speaker, and there were often multiple tongue vibrations that did not necessarily correspond to a spectral occlusion in the acoustic signal. They also found significantly longer open periods during vocal cord vibration for the trill-fricative compared to the contrastive trill, indicating a more open glottis as the primary facilitator for frication.
To maintain a three-way sibilant contrast, or indeed any complex phonological system, robust cues to contrastive segments are required. Otherwise, regular sound changes can and do occur (Ohala, 1981; Ohala, 1993). The Dispersion Theory of Contrast (Flemming, 2002) integrates three requirements for phonological contrasts. Phonological inventories generally follow three principles: (1) maximize the number of contrasts; (2) maximize the distinctiveness of the contrasts; and (3) minimize articulatory effort. Principles (1) and (2) are relevant for our current examination of the acoustic-perceptual relationships between sibilant fricatives. We hypothesize that the integration of the trill-fricative into the Czech acoustic-perceptual space has a dispersion effect, causing a divergence of the three segments in the acoustic-perceptual space. We predict that divergence will result in spacing of each of the three segments, /z, r̝, ʒ/, into their own distinct area of the acoustic-perceptual space. To test our hypothesis, we utilized an AX discrimination task of Czech and Polish sibilants embedded in Gaussian noise. We predict that the Czech phonemic inventory will occupy a similar “triangle” between the three segments in the acoustic-perceptual space as Polish inventory. Moreover, we hypothesize that multiple acoustic cues are used to maintain the acoustic-perceptual distinction. A MDS model based on the d-prime data for the discrimination of each contrast is presented. The MDS solution creates a map of the perceptual space and correlates the d-prime data to differences in perceptual similarity within the inventory, which is tested as a whole (Johnson, 2008). This allows us to draw generalizations about the overall contrastiveness of the inventories in comparison with each other and how the segments relate to each other within the perceptual space.
Moreover, we predict that the Czech sibilant pair /ʒ/ – /r̝/ will be poorly discriminated. Howson et al. (2015) described /ʒ/ and /r̝/ as having similar tongue grooving, which they suggest results in similar COG frication values. Furthermore, using historical data, Stieber (1973) identifies transcription confusion between /ʒ/ and /r̝/, which was likely due to poor discrimination between the segments. Within the block that has pairwise Polish sibilant comparisons, /z̪/ and /ʑ/ will have the highest discrimination sensitivity due to the largest COG differences (Padgett and Żygis, 2007). We also anticipate that there will be an overall better preservation of the Polish contrasts—observed through better perceptual discrimination—because of the acoustically dispersed inventory currently found in Modern Polish (Padgett and Żygis, 2007). Czech will be more difficult to discriminate under higher noise levels because of the less acoustic distinctiveness between categories. We predict that this effect will be observed in an interaction between Language and Signal-to-Noise Ratio. This expectation is based on our hypothesis that a contributing factor for the overall rarity of the Czech sibilant inventory is that it has less robust acoustic-perceptual cues than the more common Polish system, although it is still stable. Additionally, we predict a general decline in discrimination sensitivity with the addition of noise across both languages. Table 1 summarizes our hypotheses.
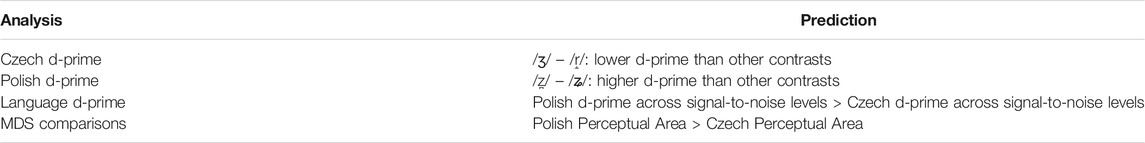
TABLE 1. Summary of experimental predictions.
Methods
Czech, /z, r̝, ʒ/, and Polish, /z̪, ʐ, ʑ/, sibilants were included in an AX discrimination task. Because Czech only contains the voiced trill-fricative, /r̝/, only voiced segments were tested. The voiceless variant only occurs word-finally and due to progressive and regressive voice assimilation (Šturm, 2018). Participants heard pairs of sounds and determined if they were the same or different. Our predictions are outlined in Section 1.3.
Participants
Twenty-two (11 female, 11 male; mean age = 25.8 years, SD = 2.95 years) native speakers of Czech took part in the experiment. Participants were students at Charles University in Prague and had lived in the Czech Republic their entire life. Information regarding their language history was collected after the experiment, and no participants reported learning or having any significant exposure to Polish. All participants self-reported no history of speech or hearing impairments. All participants were naïve to the purpose of the experiment and provided informed written consent. They were compensated 200 Kč (Czech Koruna) for their time.
Stimuli
Auditory stimuli were recorded at the University of Toronto in a sound attenuated booth. Two native speakers of Czech (1 female, 1 male) and two native speakers of Polish (1 female, 1 male) produced speech tokens for their respective language. We included a token from one male and one female speaker to introduce additional spectral variation in the fricatives. One token for each segment from each speaker was used in the experiment. This resulted in six tokens per language and 12 total tokens. None of the stimuli participants self-reported speech or hearing problems.
For the Czech stimuli, L1 speakers first repeated “The North Wind and the Sun” twice in Czech (Dankovičová, 1997) before recording the stimuli. This was done to help acclimate them to speaking in Czech. Participants were then presented with a single stimulus on a PowerPoint slide. The phonemes /z, r̝, ʒ/ were produced in a /Ca/ frame. Ten Distracter tokens, including rhotics, laterals, and nasals, and posterior fricatives, were also presented that included non-sibilant consonants, also in a /Ca/ frame. All /Ca/ tokens form nonce words in both Czech and Polish, except za which is a preposition in both languages. Each syllable was repeated three times before moving to the next slide. The same method was used for Polish, except “The North Wind and the Sun” was in Polish (Jassem, 2003) and the target phonemes were /z̪, ʐ, ʑ/.
During recording, stimuli were sampled at 44.1 kHz with 16-bit depth. Stimulus duration (220 ms) and intensity (70 dB SPL) were normalized in Praat (Boersma and Weenink, 2015). Pitch contour was matched across speakers to have a flat contour with a slight decrease (16 Hz) over time. This was accomplished by selecting tokens that had similar pitch contours. The 220 ms duration was chosen for two reasons: 1) the shortest fricative/vowel sequence was 220 ms for the Czech /za/ productions, and 2) because 220 ms included the entire duration of the fricative and the vocalic transitions up to and including the steady state portion of the vowel. Duration normalization was accomplished by splicing out different sized portions of the following vowel after its midpoint, so that the vocalic transitions from the fricative into the vowel and up to its steady state portion were left intact. Vocalic transitions are important for perceiving consonant place of articulation (Mann and Repp, 1980; Mann and Soli, 1991; Wagner et al., 2006). No vowels were reduced to less than 90% of their original duration. The goal of these stimuli modifications was to eliminate non-fricative based cues. Table 2 presents the average duration of the fricative and the vowel for the stimuli used. We also ensured that the trill-fricative contained a trill articulation. A spectral analysis of the segments used in this experiment was performed to ensure the presence of trilling, which was indicated by an observable spectral occlusion. Both stimuli contain only one clear spectral occlusion. Figure 1 presents an example spectrogram from the female Czech speaker. The arrow identifies the spectral occlusion.
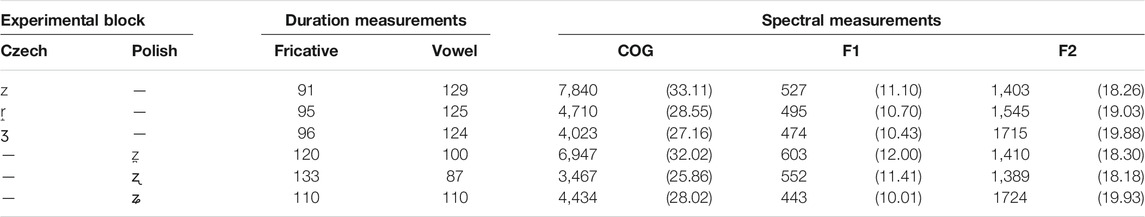
TABLE 2. Mean spectral and duration measurements for the Czech and Polish sibilants in their respective experimental blocks. Duration measurements are provided in milliseconds. Spectral measurements are provided in Hz (ERB in brackets).
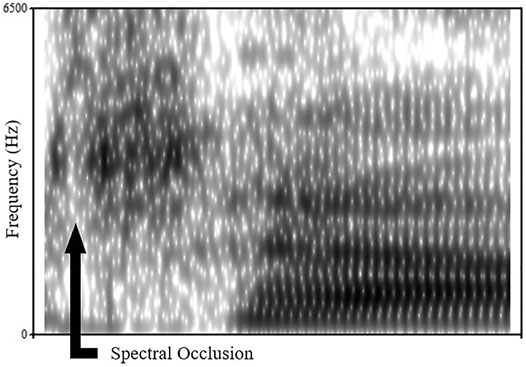
FIGURE 1. Spectrogram for the female participant’s articulation of /r̝/. The arrow indicates the presence of a spectral occlusion for a tongue-palate contact during trilling.
Each token was embedded in five noise conditions to generate different signal-to-noise ratios: +10 dB, +5 dB, 0 dB, −5 dB, −10 dB. To maintain a constant intensity for each token, the noise level for the −5 and −10 dB conditions were set to 70 dB and the speaker tokens were modified to 65 and 60 dB, respectively. Random Gaussian noise was subsequently overlaid atop the syllables. The motivation for including noise was to counteract potential ceiling effects for L1 Czech listeners discriminating native phonemic contrasts. Moreover, real communication often takes place in noisy environments and noise can be used to simulate imperfect conditions.
The mean COG for the fricatives and F1 and F2 of the following vowels were calculated for the tokens used in this experiment to correlate perceptual observations with the acoustic qualities of the stimuli. Fricative measurements were based on a 30 ms window at the midpoint of the fricative because a larger window yields better frequency resolution (Jongman et al., 2000). F1 and F2 transitions were calculated using a Burg analysis over a 30 ms window starting at the onset of the vowel. This was done to inform conclusions drawn from perceptual dissimilarities between pairs of sounds and phonetic inventories. Table 2 also presents the results from the COG and formant measurements.
Multidimensional Scaling (MDS; Torgerson, 1952; Gower, 1966) plots were generated for each acoustic measurement and are presented Section Multi-Dimensional Scaling Results. The input dissimilarity matrix was generated by subtracting the smaller value from the larger value in a pair of sounds to include only positive values (e.g., COG: Czech z - Czech r̝: 7,840 Hz - 4,710 Hz, Δ = 3,130 Hz). The resulting Hz values were then converted to Event Related Bandwidths (ERB) and used to generate an input matrix of the degree to which each segment differentiated with respect to either COG, F1, or F2. Because this was only done using the stimuli in the discrimination experiment, inferential statistics could not be performed due to the small sample.
Procedure
Participants were seated in front of a computer monitor in a quiet room. Instructions were both verbally provided in Czech and presented on the computer screen at the start of the experiment. Participants wore Sony MDR-7506 Headphones. Volume was adjusted to a comfortable listening level prior to the experiment and remained constant across all participants.
Trials contained two auditory stimuli in an AX discrimination paradigm (Creelman and Macmillan, 1979). Stimuli were delivered using DMDX (Forster and Forster, 2003). Each trial began with a fixation point “+”, followed by the presentation of the first auditory stimulus of the pair. The inter-stimulus interval was 500 ms, after which the second auditory stimulus of the pair was presented. Inter-stimulus intervals of this duration elicit behavioural responses that reflect acoustic-phonetic processing (Werker and Logan, 1985; Gerrits and Schouten, 2004). Participants were instructed to identify whether the consonants were the same or different, to respond as quickly, yet accurately as possible, and finally, to ignore differences in male and female pronunciations. Responses were made via a keyboard button response. Participants pressed “f” on the keyboard if they thought the two stimuli were different and “j” if they thought the two stimuli were the same. The inter-trial interval, during which the fixation point was presented, pseudo-randomly varied between 835 and 1,250 ms. Trials timed-out after 2,500 ms, at which point, the next trial began. Each experimental session was divided into two blocks. Block order was counterbalanced: Half of the participants completed the Czech block first, while the other half of participants completed the Polish block first. Each block included all possible phoneme combinations, see Table 3. The experiment took approximately 30 min. D-prime scores were calculated based on proportion correct responses (Macmillan and Creelman, 1991).
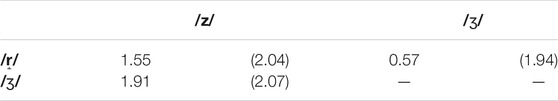
TABLE 3. Mean d-prime values for each comparison in the Czech experimental block (SD in brackets).
Participants heard five repetitions of each stimulus combination (e.g., /ʑ/ – /ʑ/) at each signal-to-noise ratio (i.e., +10, +5, 0, −5, −10). Thus, there were a total of 25 tokens for each comparison (e.g., 5 times of /ʑ/ – /ʑ/ at +10, +5, 0, −5, −10 dB = 25 tokens). Order of presentation was counterbalanced across trials (i.e., /ʑ/ – /ʐ/, /ʐ/ – /ʑ/). Additionally, there was 1 male and 1 female voice for each language. Participants heard the male voice followed by female voice twice and the female voice followed by the male voice twice for each level (e.g., /ʑ/ – /ʑ/ at +5 dB). The fifth trial for each level included within-gender pairs. Each block had 150 trials, resulting in 300 total trials per participant. There were equal numbers of “same” and “different” trials to balance the distribution of “same” and “different” responses. No comparisons were made where the comparisons had different signal-to-noise ratios in any block.
Analysis
Prior to statistical analysis, trials with response times shorter than 300 ms or longer than 2,400 ms were discarded (Ratcliff, 1993). This resulted in the removal of 3.4% of the total data. The d-prime score (Macmillan and Creelman, 1991) for each fricative contrast for each comparison was calculated on a by-participant basis. There were 1,534 total data points. All analyses were conducted using R (R Core Team, 2018). We submitted our results to a linear mixed-effects model using lmer() in the {lme4} package (Bates et al., 2015). The dependent variable was the d-prime score. The model included the fixed effects of Comparison (Czech block, [1] /r̝/ – /z/, [2] /r̝/ – /ʒ/, and [3] /z/ – /ʒ/; Polish block, [1] /z̪/ – /ʑ/, [2] /z̪/ – /ʐ/, and [3] /ʐ/ – /ʑ/) and Signal-to-Noise Ratio (continuous variable), as well as a random by-participant intercept. A random slope for Comparison was not included because it resulted in a singular fit. All categorical variables were dummy coded.
A linear mixed effects model was also fit for language effects and had fixed effects of Language (Czech, Polish), Signal-to-Noise Ratio (continuous), their interaction and a random slope and intercept for the interaction between Participant and Comparison [lmer(d-prime ∼ Language * Signal-to-Noise Ratio + (1 | Comparison: Participant))]. The motivation for including Comparison as a random effect was to eliminate individual participant-level differences caused by specific segment comparisons and instead to investigate the languages’ sibilant systems as a functional unit to make typological generalizations. Each model was tested for statistical significance using the Anova() function in the {car} package (Fox and Weisberg, 2019). Post-hoc tests were done using a Tukey correction for multiple comparisons using the {emmeans} package (Length et al., 2018). All data visualization was done with {ggplot2} (Wickham, 2016).
MDS was performed using cmdscale() in the base {stats} package. For the MDS analysis, the perceptual space was calculated for each individual listener using their d-prime scores. The input matrix for each participant was derived from the mean d-prime score for each comparison in each of the two conditions (Czech or Polish) across all signal-to-noise ratios. The result was a single input score for each comparison. Plots were made using the average coordinates for each segment. This allowed us to compare the perceptual areas using the area formed by the triangle for each three segments in each language (Howson and Monahan, 2019; Howson and Monahan, 2020). Areas were compared using a paired samples t-test, such that the perceptual space for Czech and Polish was directly compared for each participant. We also compared the COG, F1, and F2 for the stimuli used in this experiment using MDS. Our goal was to assess which acoustic factor played the largest role—if any—in the perceptual results observed in this study. To generate the input dissimilarity matrix, we subtracted the lowest value (for COG, F1, and F2) from the highest value for each pair of segments and then converted the result to ERB. The matrix was calculated from the average measures because there were only two tokens (1 male and 1 female) used in the experiment. We used ERB values instead of the Hz measurements because they more accurately reflect perceptible differences. The ERB scale is modelled after perceptible differences between different Hz frequencies. Therefore, 1 ERB in Hz ranges where humans are more sensitive to differences (i.e., lower Hz ranges) is not the same Hz value as 1 ERB in ranges where humans are less sensitive to differences (i.e., higher Hz ranges). For example, 37 ERB (∼20 kHz) is not 37 times the Hz value of 1 ERB (∼31 Hz). MDS generates coordinates on an arbitrary x- and y-axis. The axis values are numerically related to the input values, but they are not d-primes or ERB, per se. In other words, if larger numbers are used in the input matrix (e.g., COG, formants), it will generate coordinates on larger axes. If smaller numbers are used in the input matrix (e.g., d-prime), it will generate coordinates on smaller axes. For this reason, it is only possible to directly compare the areas of MDS solutions that have the same units (i.e., either d-prime, or COG) as the input matrix. In the Results and Discussion sections, we only present comparisons between the Czech and Polish areas when the input matrices were of the same units (i.e., d-primes, COG, F1, or F2).
Results
In Section Czech Results, the d-prime results for the Czech results are presented with a brief discussion in Section Discussion of Czech Results, followed by the Polish results in Section Polish Results and a discussion in Section Discussion of Polish Results. The results of the cross-language comparisons are presented in Section Language Results with a discussion in Section Discussion of Language Results. MDS results are presented in Section Multi-Dimensional Scaling Results and a brief discussion of the results is presented in Section Discussion of Multi-Dimensional Scaling Results.
Czech Results
The linear model revealed main effects of Comparison [χ2(2) = 74.61, p < 0.001] and Signal-to-Noise Ratio [χ2(1) = 376.36, p < 0.001], and a Comparison × Signal-to-Noise Ratio interaction [χ2(2) = 10.87, p = 0.004]. The R2 was 0.68. Figure 2 presents a violin plot of the main effect of Comparison (left) and a scatterplot of the d-prime results with the slope for the continuous variable Signal-to-Noise Ratio (right). The post-hoc analysis revealed that the /r̝/ – /ʒ/ pair (d-prime: 0.57) was significantly different from /r̝/ – /z/ (d-prime: 1.55, p < 0.001) and /z/ – /ʒ/ (d-prime: 1.91, p < 0.001), but the /r̝/ – /z/ (d-prime: 1.55) and /z/ – /ʒ/ (d-prime: 1.91) pairs were not different (p = 0.064). The interaction was such that in every signal-to-noise level the discrimination for each comparison decreased; however, the slope for /r̝/ – /ʒ/ was significantly different than the other two comparisons: /r̝/ – /ʒ/ had a slope of -0.137 compared to -0.202 for /r̝/ – /z/ (p = 0.012) and -0.201 for /z/ – /ʒ/ (p = 0.014). Table 3 presents means and standard deviations of the d-primes for the Comparison condition, and Table 4 presents the mean and standard deviation of the d-primes for the different signal-to-noise conditions. Post-hoc tests are reported in Supplementary Tables S1, S2 in the Supplementary Material.
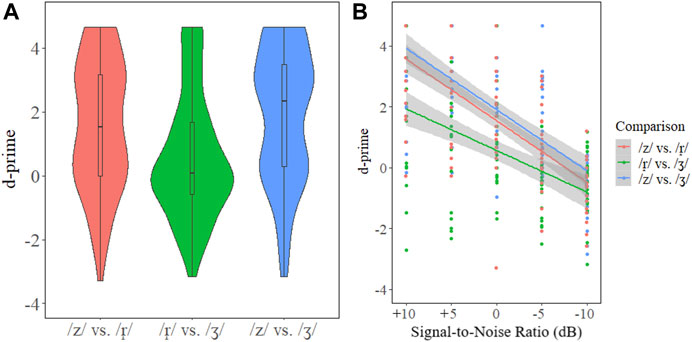
FIGURE 2. Violin plot for the Czech d-prime results (A). Scatterplot of the d-prime results with regression lines for the factor Signal-to-Noise Ratio (B).
TABLE 4. Mean d-prime values for each signal-to-noise level in each experimental block and the inter-language comparison (SD in brackets).
Discussion of Czech Results
Results indicated that /r̝/ and /ʒ/ are more confusable than the other segmental contrasts examined here. Overall, d-primes for the pair were highest in the +10 dB and +5 dB conditions, where the /z/ – /r̝/ and /z/ – /ʒ/ pairs were near ceiling; however, the mean d-prime for /r̝/ – /ʒ/ was lower compared with the other two comparisons even in the signal-to-noise ratio conditions with the lowest noise levels. This indicates poorer perceptual discriminability between /r̝/ and /ʒ/ overall, but that the comparison was less affected by noise. The data showed that the slope for the d-prime score was −0.137 but was −0.202 and −0.201 for the other comparisons. Moreover, while the d-prime for /r̝/ – /z/ was lower than /z/ – /ʒ/, the difference was not significantly different. Signal-to-noise ratio influenced participants’ discrimination sensitivity of sibilant contrasts. Global d-prime by signal-to-noise ratio was also much higher for the other comparisons when looking at /r̝/ – /ʒ/. This result is expected given that the trill-fricative and the palato-alveolar had a similar degree of tongue grooving (Howson et al., 2015). Based on the similarity, Howson et al. (2015) suggested that the degree of grooving generates acoustic-perceptual similarities in the frication produced by the two segments. One of the primary points of contrast between /r̝, ʒ/ is trilling, which is often lost during casual speech (Pavlík, 2013). While this may generally play a role in their perceptual confusability, we ensured that the tokens used in the current experiment contained trilling. Finally, the signal-to-noise results indicate that noise levels have a strong effect on the discrimination of the Czech fricative contrasts. As anticipated, higher noise levels reduced discrimination sensitivity.
Polish Results
The linear model revealed main effects of Comparison [χ2(2) = 250.91, p < 0.001] and Signal-to-Noise Ratio [χ2(1) = 39.12, p < 0.001], but no Comparison × Signal-to-Noise Ratio interaction [χ2(2) = 4.06, p = 0.131]. The R2 metric was 0.56. Figure 3 presents a violin plot for the main effect of Comparison (left) and a scatterplot of the d-prime results with the slope for the continuous variable Signal-to-Noise Ratio (right). Post-hoc tests revealed that the comparison of /z̪/ – /ʑ/ (d-prime: 3.04) with /z̪/ – /ʐ/ (d-prime: 0.74, p < 0.001), and with /ʐ/ – /ʑ/ (d-prime: 1.32, p < 0.001) were significant. The difference between /z̪/ – /ʐ/ (d-prime: 0.74) and /ʐ/ – /ʑ/ (d-prime: 1.33, p < 0.001) was also significant. Table 4 presents the mean and standard deviation of the d-primes for the Signal-to-Noise Ratio condition, and Table 5 presents the mean and standard deviation of the d-primes for each comparison. Post-hoc tests are reported in Supplementary Tables S3, S4 in the Supplementary Material.
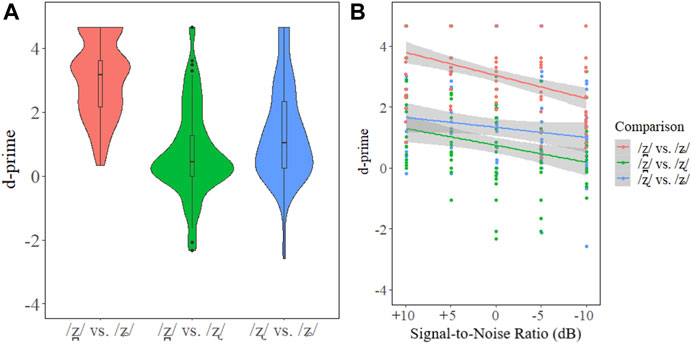
FIGURE 3. Violin plots for the Polish d-prime results (A). Scatterplot of the d-prime results with regression lines for the factor Signal-to-Noise (B).
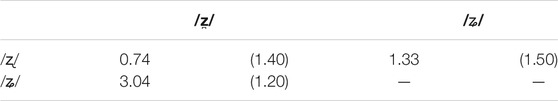
TABLE 5. Mean d-prime values for each comparison in the Polish experimental block (SD in brackets).
Discussion of Polish Results
In the Polish three-way contrast, /z̪/ and /ʑ/ were the easiest to discriminate with higher average d-primes scores compared to all other contrasts (Supplementary Material). This suggests that the greater acoustic distinction between /z̪/ and /ʑ/ than for /ʐ/ and /ʑ/ results in a better perceptual contrast. The large distance between the dental and alveolopalatal with respect to both COG and vocalic transitions yields a robust contrast. The high dispersion in COG and formant values between /ʐ/ – /ʑ/ and especially /z̪/ – /ʑ/ likely led to the high d-prime scores. The discrimination between /z̪/ – /ʐ/ and /ʐ/ – /ʑ/ had lower d-prime scores than /z̪/ – /ʑ/. The d-prime scores between /z̪/ – /ʐ/ were particularly low. This is possibly due to less obvious F1 and F2 transitional differences compared to the contrast between /ʐ/ – /ʑ/. See Table 2 in section Stimuli for a presentation of the average COG, F1, and F2 measures for each sibilant.
It is likely the case that the dental and alveolopalatal are mapped on to the alveolar and postalveolar categories, respectively; however, the additional confusion of the retroflex (i.e., the lower d-prime scores) when compared with both the dental and alveolopalatal suggests that there may be a mismatch in the mapping of the retroflex to any single segment in the Czech listeners’ perceptual space.
Language Results
There was no main effect of Language [χ2(1) = 2.57, p = 0.109], but there was a significant effect of Signal-to-Noise Ratio [χ2(1) = 336.05, p < 0.001] and a Language × Signal-to-Noise Ratio interaction [χ2(1) = 96.51, p < 0.001]. The R2 was 0.629. Figure 4 presents the interaction between Language × Signal-to-Noise Ratio. Post-hoc tests revealed that the interaction between Czech (−0.180) and Polish (−0.054) slopes for the factor Signal-to-Noise Ratio (p < 0.001) was significant. The Pearson’s r correlation coefficient between Signal-to-Noise Ratio and d-prime for Czech was −0.610 and for Polish −0.229, further indicating a larger impact of noise level on Czech than Polish. Table 4 also presents a summary of the d-prime and standard deviations (SD) results by signal-to-noise ratio. The post-hoc tests are reported in Supplementary Tables S5, S6 in the Supplementary Material.
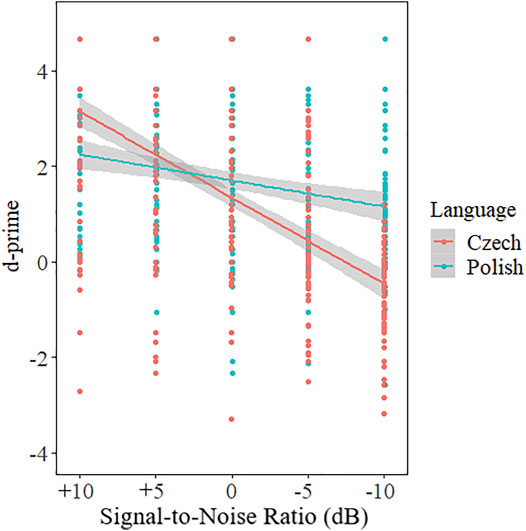
FIGURE 4. Scatterplot of the interaction of Language × Signal-to-Noise with regression lines.
Discussion of Language Results
The Polish sibilant contrasts remained more perceptually salient when embedded in noise than the Czech contrasts. The interaction between Signal-to-Noise Ratio and Language revealed that at the lowest levels of noise, participants better discriminated the Czech categories compared to the Polish categories. This is expected because Czech is the native language of our participants; however, as noise levels increased, the d-primes for Czech decreased, and for signal-to-noise ratios of −5 dB and −10 dB, the Czech d-primes are lower than those for Polish. This is particularly striking considering that the listeners were native speakers of Czech. Overall, these results suggest that the contrasts in the Czech inventory become less discriminable under degraded listening conditions, while the Polish contrasts have more robust cues that are easier to perceive even in higher noise levels.
Multi-Dimensional Scaling Results
The MDS results revealed that the relationship between the segments in the Czech and Polish inventories yielded triangles of different sizes in the perceptual space and the results of a two-sided paired t-test revealed a significant difference [t(21) = −2.99, p = 0.007]. The mean of the differences was −1.44: The mean area for Czech was 3.18 (SD: 2.13) and the mean area for Polish was 4.62 (SD: 3.07). Figure 5 presents the average perceptual space for Czech and Polish, which represents the average coordinates for each of the segments across all participants. In Figure 5, relatively small numbers can be observed largely because the input coordinates to measure the area generally fall between −1 and 1. As a result, the typical perceptual area of each participant is not that large except for a few participants, who had larger perceptual spaces within the context of the current experiment. Figure 6 presents the paired results with a boxplot.
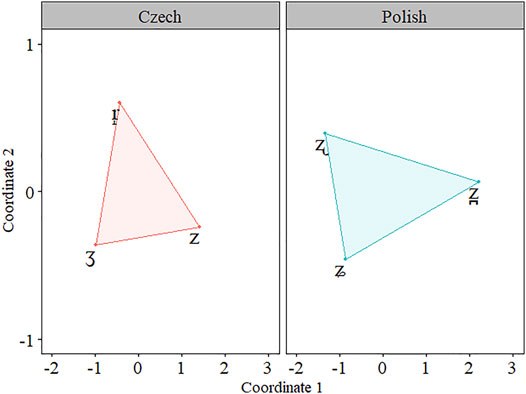
FIGURE 5. Multidimensional Scaling plot for the perceptual spaces in Czech (red) and Polish (blue).
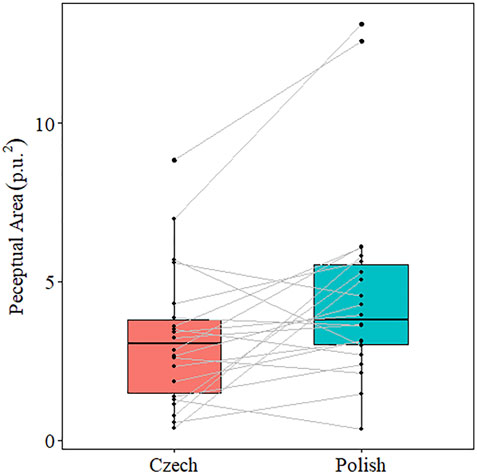
FIGURE 6. Boxplot that presents the paired results for the perceptual space. Each of the lines connect the each of the participant’s Czech and Polish d-prime scores used for comparison in the statistical analysis.
The results from the COG MDS for Czech and Polish revealed similar patterns in the perceptual space with respect to dispersion and location; however, the Polish sibilants occupied a larger space (647.96 units2) than Czech (600.97 units2). Figure 7 presents the COG MDS results.
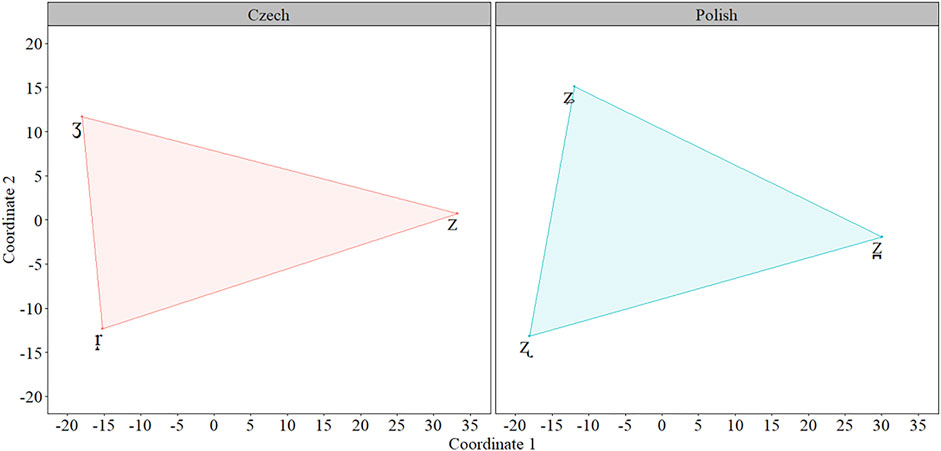
FIGURE 7. Multidimensional Scaling lot for the COG measures for Czech (red) and Polish (blue) sibilants.
The MDS results for F1 revealed that the Polish system occupied a larger space (12.81 units2) than the Czech system (2.34 units2); however, for F2, the Czech system occupied a larger space (48.84 units2) than the Polish system (14.24 units2). Figure 8 presents the F1 and F2 MDS results.
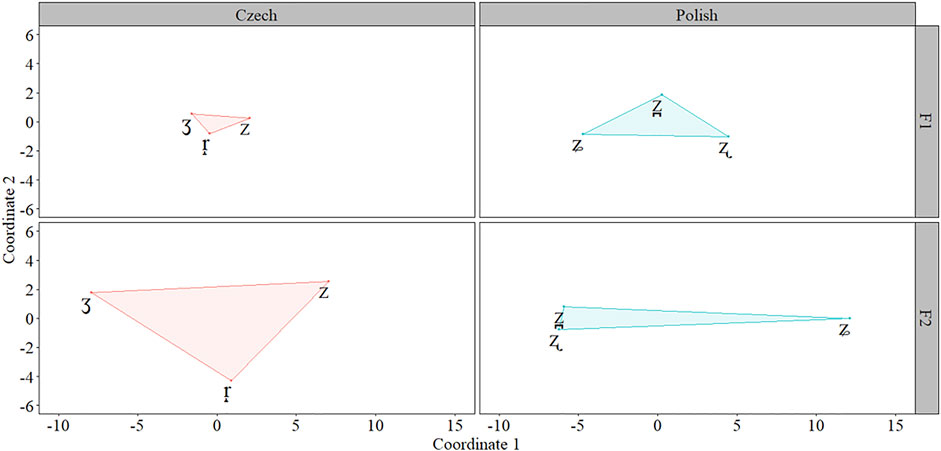
FIGURE 8. Multidimensional Scaling for the F1 and F2 measures for Czech (red) and Polish (blue) sibilants.
Discussion of Multi-Dimensional Scaling Results
The MDS plots revealed differences in the overall placement of the Czech and Polish segments within the perceptual space of Czech listeners. There were relative differences in the distances between individual segments and their relationship between each other. The overall perceptual spaces were also different. The evidence suggests that the Czech perceptual space is smaller overall, and the three-way contrast is relatively rare, at least in part, due to the reduced perceptual salience between the segments. Polish, on the other hand, is typologically more common because the acoustic cues work in conjunction to a create a more disperse acoustic-perceptual space.
Both the COG and F1 measurements indicated that these are larger for the Polish sibilant system than the Czech system; however, F2 primarily distinguishes /z̪/ and /ʐ/ from /ʑ/. Czech, on the other hand, makes robust use of F2. As a result, there are larger distances between segments, occupying more total area in the MDS space. COG still appears to be utilized in Czech, although its distribution is not as large as it is for Polish.
General Discussion
We performed an AX discrimination task of Czech and Polish sibilants. The data revealed that Czech listeners had a relatively poor ability to distinguish acoustic-perceptual differences between the trill-fricative and palato-alveolar segments in noise. Noise also had a strong negative effect on listeners’ ability to distinguish all contrasts in Czech. The Czech listeners’ ability to distinguish Polish segments was also low overall; however, the differences between the dental and alveolopalatal segments created a robust contrast across signal-to-noise ratios. The other two comparisons (i.e., dental versus retroflex and retroflex versus alveolopalatal) had lower d-prime scores, but participants were also largely unaffected by signal-to-noise ratios. There were no overall d-prime differences between the two languages, but an interaction with signal-to-noise ratio revealed that the Czech contrasts were more difficult to discriminate in higher noise levels. Finally, the MDS results revealed less dispersion among the Czech segments than the Polish segments within the perceptual space.
Returning to our predictions, we observed dispersion in the Czech sibilant inventory that roughly correlates to three separate quadrants for each segment. The dispersion approximately matched the Polish inventory; however, the spatial positioning and dispersion differed between segments. This is consistent with our hypothesis concerning an acoustic-perceptual displacement of segments for Czech. Flemming (2002) hypothesized that phonological inventories will maximize distinction between segments. What we observed for Czech listeners is that the rearrangement of segments through different acoustic-perceptual cues generates a robust contrast. The COG and F2 measures are most prominent in Czech while COG and F1 are more prominent in Polish. We also observed a larger perceptual space for Polish segments than Czech segments, despite all participants being L1 Czech speakers with little to no prior knowledge of Polish. The maximization of a few acoustic-perceptual cues (i.e., COG and F1 or COG and F2) is consistent with Flemming (2002), adhering to the second principle, that is, maximize the distinctiveness of contrasts. To maintain this principle, only a few of the possible acoustic-perceptual properties are modified instead of maximizing all possible contrastive properties. This observation also explains wider sibilant typologies: Cross-linguistically, certain contrasts are common (e.g., /s, ʃ/), but a myriad of other contrasts are possible and are observed.
Finally, we also observed less robust perception of the Czech contrasts in the higher signal-to-noise ratio conditions compared to the Polish contrasts. This is surprising given that, again, participants were L1 Czech speakers, who had little or no experience with Polish. This suggests that the cues involved in the Polish three-way contrast are likely resistant to increased noise and might explain why it is the most common three-way sibilant system in the world.
Conclusion
In short, considering the noise comparisons, there is greater difficulty maintaining the Czech inventory relative to the more common Polish inventory. Despite this, the Czech sibilant inventory appears to be stable. Acoustic-perceptual cues maximize contrast and minimize articulatory effort. Perceptual dispersion similarities across the two sibilant systems indicate that maintenance across several acoustic-perceptual cues is possible, and Czech shows few signs of losing this typologically rare inventory.
Data Availability Statement
The datasets presented in this study can be found in online repositories. The names of the repository/repositories and accession number(s) can be found below:https://osf.io/6j7nt/.
Ethics Statement
The studies involving human participants were reviewed and approved by the Research Ethics Board, University of Toronto. The patients/participants provided their written informed consent to participate in this study.
Author Contributions
PH and PM designed the experiment. PH analysed the data and wrote the manuscript. PH and PM edited the manuscript.
Funding
This work was supported in part by the Natural Sciences and Engineering Council (NSERC) of Canada (RGPIN-2017-06053) and by the Social Sciences and Humanities Research Council (SSHRC) of Canada (IDG 430-15-00647) to PM.
Conflict of Interest
The authors declare that the research was conducted in the absence of any commercial or financial relationships that could be construed as a potential conflict of interest.
Publisher’s Note
All claims expressed in this article are solely those of the authors and do not necessarily represent those of their affiliated organizations, or those of the publisher, the editors and the reviewers. Any product that may be evaluated in this article, or claim that may be made by its manufacturer, is not guaranteed or endorsed by the publisher.
Acknowledgments
We would like to thank Alexei Kochetov, Yoonjung Kang, and attendees at Laboratory Phonology 15 and the 22nd Annual Czech-German Workshop on Speech Communication for comments on a previous version of this project. All errors are our own.
Supplementary Material
The Supplementary Material for this article can be found online at: https://www.frontiersin.org/articles/10.3389/fcomm.2021.807995/full#supplementary-material
References
Bates, D., Mächler, M., Bolker, B., and Walker, S. (2015). Fitting Linear Mixed-Effects Models Using lme4. Journal of Statistical Software 67 (1), 1–48. doi:10.18637/jss.v067.i01
Blevins, J. (2018). “Evolutionary Phonology and the Life Cycle of Voiceless Sonorants,” in Typological Hierarchies in Synchrony and Diachrony (Typological Studies in Language). Editors S. Cristofaro, F. Zúñiga, and D. Kavitsaya (Amsterdam & Philadelphia: John Benjamins) 121, 29–58.
Boersma, P., and Weenink, D. (2015). Praat: Doing Phonetics by Computer. Computer Program. Available at: http://www.praat.org/ (Accessed October 5, 2018).
Creelman, C. D., and Macmillan, N. A. (1979). Auditory Phase and Frequency Discrimination: a Comparison of Nine Procedures. J. Exp. Psychol. Hum. Perception Perform. 5 (1), 146–156. doi:10.1037/0096-1523.5.1.146
Forster, K. I., and Forster, J. C. (2003). DMDX: A Windows Display Program with Millisecond Accuracy. Behav. Res. Methods Instr. Comput. 35 (1), 116–124. doi:10.3758/bf03195503
Fox, J., and Weisberg, S. (2019). An {R} Companion to Applied Regression. Third Edition. Thousand Oaks, CA: Sage.
Gerrits, E., and Schouten, M. E. H. (2004). Categorical Perception Depends on the Discrimination Task. Perception & Psychophysics 66 (3), 363–376. doi:10.3758/bf03194885
Gower, J. C. (1966). Some Distance Properties of Latent Root and Vector Methods Used in Multivariate Analysis. Biometrika 53, 325–328. doi:10.2307/2333639
Hála, B. (1923). K Popisu Pražské Výslovnosti: Studie Z Experimentální Fonetiky [Towards a Description of Prague Pronunciation: Studies from Experimental Phonetics]. Praha: Nákl. České akademie vědaumění.
Henriksen, N., and Willis, E. (2010). “Acoustic Characterization of Phonemic Trill Production in Jerezano Andalusian Spanish,” in 4th Conference on Laboratory Approaches to Spanish Phonology, University of Texas Austin, September 26–28, 2008. Editor M. Ortega-Llebaria (Somerville, MA: Cascadilla Proceedings Project), 115–127.
Howson, P. J., and Monahan, P. J. (2020). A Method for Comparing Perceptual Distances and Areas with Multidimensional Scaling. MethodsX 7, 100790. doi:10.1016/j.mex.2020.100790
Howson, P. J., and Monahan, P. J. (2019). Perceptual Motivation for Rhotics as a Class. Speech Commun. 115, 15–28. doi:10.1016/j.specom.2019.10.002
Howson, P., Kochetov, A., and van Lieshout, P. (2015). Examination of the Grooving Patterns of the Czech Trill-Fricative. J. Phonetics 49, 117–129. doi:10.1016/j.wocn.2015.01.002
Howson, P., Komova, E., and Gick, B. (2014). Czech Trills Revisited: An Ultrasound EGG and Acoustic Study. J. Int. Phonetic Assoc. 44, 115–132. doi:10.1017/s0025100313000339
Jongman, A., Wayland, R., and Wong, S. (2000). Acoustic Characteristics of English Fricatives. J. Acoust. Soc. Am. 108 (3), 1252–1263. doi:10.1121/1.1288413
Kadenge, M., and Mudzingwa, C. (2012). Comparing chiShona Loanwords of Monolingual and Bilingual Speakers: An Optimality Theory Analysis. South Afr. J. Afr. Languages 32 (2), 141–151. doi:10.2989/sajal.2012.32.2.5.1142
Kavitskaya, D., Iskarous, K., Noiray, A., and Proctor, M. (2009). “Trills and Palatalization: Consequences for Sound Change,” in Proceedings of Formal Approaches to Slavic Linguistics. Editors J. Reich, M. Babyonyshev, and D. Kavitsaya (Ann Arbor: Michigan Slavic Publications) 17, 97–110.
Lee-Kim, S. I. (2011). “Spectral Analysis of Mandarin Chinese Sibilant Fricatives,” in Proceedings of the XVIIth International Congress of Phonetic Sciences, Hong Kong, 17-21 August 2011, 1178–1181.
Length, R., Singmann, H., Love, J., Buerkner, P., and Herve, M. (2018). Package ‘emmeans’. Available at: https://cran.r-project.org/web/packages/emmeans/emmeans.pdf (Accessed October 5, 2018).
Li, M., and Zhang, J. (2017). Perceptual Distinctiveness between Dental and Palatal Sibilants in Different Vowel Contexts and its Implications for Phonological Contrasts. Lab. Phonology 8 (1), 18. doi:10.5334/labphon.27
Macmillan, N., and Creelman, C. (1991). Detection Theory: A User’s Guide. New York: Lawrence Erlbaum Associates.
Mann, V. A., and Repp, B. H. (1980). Influence of Vocalic Context on Perception of the [∫]-[s] Distinction. Perception & Psychophysics 28 (3), 213–228. doi:10.3758/bf03204377
Mann, V., and Soli, S. D. (1991). Perceptual Order and the Effect of Vocalic Context on Fricative Perception. Perception & Psychophysics 49 (5), 399–411. doi:10.3758/bf03212174
Nowak, P. M. (2006). The Role of Vowel Transitions and Frication Noise in the Perception of Polish Sibilants. J. Phonetics 34 (2), 139–152. doi:10.1016/j.wocn.2005.03.001
Ohala, J. J. (1993). Sound Change as Nature's Speech Perception experiment. Speech Commun. 13, 155–161. doi:10.1016/0167-6393(93)90067-u
Ohala, J. J. (1981). “The Listeners as a Source of Sound Change,” in Papers from the Parassesion on Language and Behavior. Editors C. S. Masek, R. A. Hendrick, and M. F. Miller (Chicago: Chicago Linguistics Society), 178–203.
Padgett, J., and Żygis, M. (2007). The Evolution of Sibilants in Polish and Russian. J. Slavic Linguistics 15, 291–324. doi:10.21248/zaspil.32.2003.190
Pavlík, R. (2013). On Some Quantitative Properties of Czech R̝ in Newsreading. Phonetica 71, 22–49. doi:10.1159/000359960
R Core Team (2018). R: A Language and Environment for Statistical Computing. Available at: http://www.R-project.org/ (Accessed October 5, 2018).
Ratcliff, R. (1993). Methods for Dealing with Reaction Time Outliers. Psychol. Bull. 114 (3), 510–532. doi:10.1037/0033-2909.114.3.510
Shadle, C. H. (1991). The Effect of Geometry on Source Mechanisms of Fricative Consonants. J. Phonetics 19, 409–424. doi:10.1016/s0095-4470(19)30332-8
Skaličková, A. (1974). Srovnávací Fonetika Angličtiny a Češtiny [Comparative Phonetics of English and Czech]. Praha: Academia.
Stieber, Z. (1973). A Historical Phonology of the Polish Language. Heidelberg: Carl Winter Universitätsverlag.
Šturm, P. (2018). Experimental Evidence on the Syllabification of Two-Consonant Clusters in Czech. J. Phonetics 71, 126–146. doi:10.1016/j.wocn.2018.08.002
Toda, M., Maeda, S., and Honda, K. (2010). “Formant-cavity Affiliation in Sibilant Fricatives,” in Turbulent Sounds: An Interdisciplinary Guide. Editors S. Fuchs, M. Toda, and M. Zygis (Berlin, Germany: De Gruyter Mouton), 343–374. doi:10.1515/9783110226584.343
Torgerson, W. S. (1952). Multidimensional Scaling: I. Theory and Method. Psychometrika 17 (4), 401–419. doi:10.1007/bf02288916
Vachek, J. (1963). The Place of the Sound [ř] in the Structures of Slavonic Languages, A11. Brno, Czech Republic: Sborník Prací Filosofické Fakulty Brněnské Univerzity, 81–91.
Wagner, A., Ernestus, M., and Cutler, A. (2006). Formant Transitions in Fricative Identification: the Role of Native Fricative Inventory. The J. Acoust. Soc. America 120, 2267–2277. doi:10.1121/1.2335422
Werker, J. F., and Logan, J. S. (1985). Cross-Language Evidence for Three Factors in Speech Perception. Perception & Psychophysics 37 (1), 35–44. doi:10.3758/bf03207136
Żygis, M. (2006). Contrast Optimisation in Slavic Sibilant Systems: Habilitation. Berlin: Humboldt University.
Żygis, M., and Padgett, J. (2010). A Perceptual Study of Polish Fricatives, and its Implications for Historical Sound Change. J. Phonetics 38, 207–226. doi:10.1016/j.wocn.2009.10.003
Keywords: speech perception, sibilant consonants, Czech, Polish, phonetics, phonology
Citation: Howson PJ and Monahan PJ (2022) Acoustic-Perceptual Factors Both Maintain and Account for the Rarity of the Czech Trill-Fricative. Front. Commun. 6:807995. doi: 10.3389/fcomm.2021.807995
Received: 02 November 2021; Accepted: 28 December 2021;
Published: 17 January 2022.
Edited by:
John Archibald, University of Victoria, CanadaReviewed by:
Richard Wright, University of Washington, United StatesStephen Winters, University of Calgary, Canada
Copyright © 2022 Howson and Monahan. This is an open-access article distributed under the terms of the Creative Commons Attribution License (CC BY). The use, distribution or reproduction in other forums is permitted, provided the original author(s) and the copyright owner(s) are credited and that the original publication in this journal is cited, in accordance with accepted academic practice. No use, distribution or reproduction is permitted which does not comply with these terms.
*Correspondence: Phil J. Howson, aG93c29uQGxlaWJuaXotemFzLmRl