Abstract
We attempted to evaluate the replicability and generalizability of ten influential research on sensory marketing by conducting a high-powered and pre-registered replication in online settings in non-WEIRD consumers. The results revealed that only 20% of findings could be successfully replicated, and their effect sizes are as half as the original ones. Two successful studies had relatively larger sample sizes, used sound symbolism, and employed within-participants manipulation of senses. No studies involving visual factors, between-participant manipulation of senses, or interactions between factors could be replicated. Our findings reveal an initial estimate of the replicability and generalizability of sensory marketing.
Introduction
Over the past decade, sensory marketing has become a growing field of research. Sensory marketing is “marketing that engages consumers' senses and affects their perception, judgment, and behavior” (Krishna, 2012, p. 332). An influential review, “An integrative review of sensory marketing: Engaging the senses to affect perception, judgment, and behavior” (Krishna, 2012) has been cited more than 1300 times (Google Scholar, 11/2021). Many studies have demonstrated that sensory factors affect consumers' perceptions, judgments, and behaviors (Krishna and Schwarz, 2014; Krishna et al., 2016; Wörfel et al., 2022). A growing body of research has demonstrated that vision (Biswas et al., 2017), audition (Motoki et al., 2022), olfaction (Madzharov et al., 2015; Iseki et al., 2021), touch (Zwebner et al., 2014), and tastes (Litt and Shiv, 2012) influence consumer behaviors. Several reviews on sensory marketing also have appeared including multisensory store atmospherics (Spence et al., 2014), grounded cognition (Krishna and Schwarz, 2014), package design (Krishna et al., 2017), advertising (Krishna et al., 2016), and new technologies (Petit et al., 2019). However, to our knowledge, the replicability of sensory marketing findings has not yet been addressed.
Psychology and behavioral sciences face a replication crisis. Replication can be regarded as the cornerstone for establishing scientific findings in psychology, marketing, and consumer research (Asendorpf et al., 2013; Lynch et al., 2015; Ding et al., 2020; Edlund et al., 2022). Most research on psychology and behavioral science (including consumer psychology) relies on testing statistical hypotheses using empirical observations and data (Shrout and Rodgers, 2018). Statistically significant findings can be replicated using an independent dataset (Shrout and Rodgers, 2018). However, since the 2010s, it has been found that many of the findings published in top-tier journals cannot be replicated (Open Science Collaboration, 2015; Camerer et al., 2018). For example, one of the first large replication attempts has found that only 36% of one hundred psychology findings can be replicated (Open Science Collaboration, 2015). Non-successful replications of classic and famous findings in the field of social psychology (morality salience and ego depletion) have also been reported (Vadillo et al., 2018; Klein et al., 2019), though consumer research has relied on classical findings (Ferraro et al., 2005; Baumeister et al., 2008; Fransen et al., 2008). The findings that fail replication include research in the fields of cognitive and social psychology (Open Science Collaboration, 2015; Klein et al., 2019). Further, given that consumer psychology has strived by applying the theory/findings of social and cognitive psychology (Hoyer et al., 2012; Malter et al., 2020), evaluation of the replicability of consumer research should be required.
Consumer psychology is no exception to replication crises. Data Colada (https://datacolada.org/) attempted to replicate ten studies published in the Journal of Marketing Research and the Journal of Consumer Research. The replication attempts by Data Colada revealed that most findings could not be replicated. Even when the results showed the same direction, the effect size1 was much smaller than that of the original authors (https://datacolada.org/92). This suggests that the effect size of the original findings would be inflated, and it is important to re-evaluate the effect size by a high-powered replication study. Moreover, other researchers have failed to replicate the findings of consumer psychology (Tunca and Yanar, 2020; Tunca et al., 2022), even though some can be replicated (Sarstedt et al., 2017). For example, neither two findings that appeared in the Journal of Consumer Research (Dubois et al., 2011; Wang and Griskevicius, 2013) were unsuccessfully replicated (Tunca and Yanar, 2020; Tunca et al., 2022). Moreover, it has been estimated that most of the process evidence in marketing obtained by mediation analyses is noisy and inadequately powered (Charlton et al., 2021). Conclusively, one researcher has estimated that the replication rate of marketing and consumer research is ~10% (https://www.openmktg.org/research/replications).
The present study used pre-registered replication to evaluate the replicability of ten influential research on sensory marketing. Replications of marketing research have been reported, especially in the Replication Corner of the International Journal of Research in Marketing (Lynch et al., 2015). Most replication research published in the Replication Corner is successful (i.e., original findings are successfully replicated) (Lynch et al., 2015). Additionally, only three studies can be regarded as unsuccessful (i.e., the replication score was below the midpoint) (Lynch et al., 2015). In other words, 90% (27/30) of replication studies can be regarded as successful (i.e., replication score was above midpoint) (Lynch et al., 2015). The ratio of successful replication appears to contradict that of pre-registered replication (https://www.openmktg.org/research/replications). It is possible that publication bias (i.e., only successful replications were submitted and then published) and/or selective reporting inflated the ratio of successful replications in the Replication Corner (Lynch et al., 2015). Further, it has been suggested that pre-registration2 helps create credible and robust science (van't Veer and Giner-Sorolla, 2016; Nosek et al., 2018). Actually, pre-registration has been also recently regarded as an essential research practice in consumer psychology (Simmons et al., 2021). Therefore, to obtain findings that are more reliable, we employed a pre-registered replication.
It should be noted that our replication attempts were conceptual replication with an extension of populations and settings (LeBel et al., 2018). Most of the facets in the experimental design (e.g., effect, hypotheses, IV/DV construct, IV/DV operationalization, and IV/DV stimuli) (LeBel et al., 2018) are the same as (or very close to) the original research. The populations, physical settings, and contextual variables were different from those in the original research. Most of the original research recruited WEIRD (Western, Educated, Industrialized, Rich, and Democratic) samples (Western university students in most cases) in a laboratory setting. By contrast, our replication research recruited non-WEIRD consumers on an online platform. It has been suggested that participants of most research are from WEIRD samples (96% of top-psychology journals), but WEIRD people constitute only 12% of the population (Henrich et al., 2010). Moreover, consumer research has moved traditional settings/participants (i.e., university students in a lab setting) to the general population from crowdsourcing platforms (Goodman and Paolacci, 2017). Together, our attempts at conceptual replication test whether previous findings in sensory marketing can be generalized to non-WEIRD consumers using an online platform.
The present study aimed to replicate ten influential pieces of research on sensory marketing, relying on the recent attempts of empirical audits and reviews (O'Donnell et al., 2021). The empirical audit and review can be referred to as an approach to assessing the evidentiary value of a research area (O'Donnell et al., 2021). Based on the concepts of empirical audit and review, we replicated ten influential studies on sensory marketing (see Table 1). These studies include sound symbolism in brand names (Klink, 2000; Yorkston and Menon, 2004; Lowrey and Shrum, 2007), product color (Hagtvedt and Brasel, 2017), logo design (Cian et al., 2014; Jiang et al., 2015), and visual product depictions (Madzharov and Block, 2010; Elder and Krishna, 2011; Chae and Hoegg, 2013; Romero and Biswas, 2016).
Table 1
| Author(s), Year, Journal | The study number, sample size, samples, settings | Primary findings | Dependent variable and original effect size (r) |
|---|---|---|---|
| Klink (2000) Marketing Letters 491 citations | Study 1 (H1a-m) n = 265 Undergraduate students from a Mid-Atlantic college | - Hypothetical brand names including front (vs. back) vowels are associated with smallness, fastness, softness, bitterness, friendliness, and prettiness - Hypothetical brand names including back (vs. front) vowels are associated with dark color, mildness, richness, warmness, masculine, strong, and heaviness. | H1a: small (r = 0.623) H1b: dark color (r = 0.639) H1c: mild (r = 0.283) H1d: rich (r = 0.819) H1e: soft (r = 0.215) H1f: fast (r = 0.411) H1g: warm (r = 0.615) H1h: bitter (r = 0.230) H1i: masculine (r = 0.570) H1j: friendly (r = 0.245) H1k: strong (r = 0.230) H1l: heavy (r = 0.796) H1m: pretty (r = 0.336) |
| Shrum et al. (2012) International Journal of Research in Marketing 133 citations | Experiment 1a n = 88 Experiment 1b n=88 Experiment 1c = 181 -Undergraduates at a French university Undergraduates at a university in the US with a substantial proportion of Hispanic students -Chinese participants who were recruited by students in a graduate research course at a university in Taipei | - Front (back) vowel words are preferred for convertible/knife (4 × 4 vehicles/hammer) | Choice of preferred names; F(1, 367) = 63.87, r = 0.385 |
| Hagtvedt and Brasel (2017) Journal of Consumer Research 105 citations | Study 3 n = 77 Undergraduates | - High (vs. low) saturation increases product size estimates, attention, and arousal | Size perception: F(1, 75) = 7.13, r = 0.295 Attention: F(1, 75) = 4.95, r = 0.249 Arousal: F(1, 75) = 7.35, r = 0.299 |
| Romero and Biswas (2016) Journal of Consumer Research 117 citations | Study 1B n = 93 Students from a major US university | - Participants tend to prefer the healthy item (broccoli salad) when it is on the left (vs. right) of the images | Choice of food; x2 = 5.42, df = 1, r = 0.241 |
| Yorkston and Menon (2004) Journal of Consumer Research 528 citations | Study 1 n = 126 -US University students in a lab setting -Undergraduate students in a large northeastern university | - Brand names including back (vs. front) vowels are rated as higher in the attribute perception index (richness, smoothness, and creaminess) - The diagnostic information (true name, test name) and the timing of the information provided (simultaneously, afterward) modulate the effects of brand names on the attribute perception index | H1: Main effect of the brand name; (F1, 118) = 9.39, r = 0.271 H2: Name x diagnosticity; (F1, 121) = 7.77, r = 0.246 H3: Name x diagnosticity x timing (F1, 118) = 4.78, r = 0.197 |
| Elder and Krishna (2011) Journal of Consumer Research 341 citations | Study 4 n = 78 An online panel | - Visual product depictions within advertisements, such as the manipulation of orienting a product toward a participant's dominant hand, facilitate purchase intention. | Purchase intention; F(1, 76) = 14.47, r = 0.400 |
| Jiang et al. (2015) Journal of Consumer Research 221 citations | Experiment 1 n = 109 Undergraduates | - Circular and angular-logo shapes influence consumers' judgment of softness-related and hardness-related product attributes | Comfortableness and durability judgments: F(2, 106) = 7.63, r = 0.251 |
| Chae and Hoegg (2013) Journal of Consumer Research 200 citations | Study 2 n = 194 English-speaking participants from a national subject pool completed an online study | -When participants are primed to desire a modern product, they were more favorable when it appeared on the right side of the advertisement - In contrast, when participants are primed to desire an antique, they are more favorable when the product appeared on the left | Product attitude; F(2, 173) = 6.62, r = 0.189 |
| Cian et al. (2014) Journal of Marketing Research 229 citations | Study 1 n = 74 Undergraduate students from a large university in the western US | - A logo that evokes greater perceived movement (logo dynamism) generates more favorable attitudes toward the brand | Attitudes toward the brand; F(1, 72) = 5.26, r = 0.261 |
| Madzharov and Block (2010) Journal of Consumer Psychology 161 citations | Study 1A n = 37 Undergraduate business students from a large Northeastern university | - Packages with more product units displayed on the package are perceived to contain more product quantity than packages with fewer product units displayed on the package | Product quantity; F(1, 35) = 6.93, r = 0.407 Serving size; F(1, 35) = 4.83, r = 0.348 |
Summary of previous findings that the current research attempts to replicate.
Methods
Ten studies were selected for the replication project. Our replication attempts were based on an empirical audit and review (O'Donnell et al., 2021), which is an approach to assessing the evidentiary value of a research area (O'Donnell et al., 2021). According to O'Donnell et al. (2021), the following steps involve empirical audits and reviews: (1) identifying the bounds of a topic area; (2) selecting studies that belong to a topic area; and (3) replicating the studies. Based on the concepts of empirical audit and review, we replicated ten influential studies on sensory marketing (see Table 1).
Our selection criteria include (1) sensory marketing research, (2) having more than 100 citations, (3) sufficient materials, and/or procedures publicly available, and (4) could be replicated with an online platform. Criterion (1) indicates that studies need to manipulate sensory stimuli in consumer contexts. We did not set any operational definition of sensory stimuli similar to a previous empirical audit and review (O'Donnell et al., 2021), and accepted all manipulations of sensory stimuli written by the original authors. Criterion (2) was added to refer to “influential” research. One factor related to influential research is the number of citations. We set more than 100 citations as our operational requirements. Criterion (3) is needed because we attempted to replicate the research as directly as possible. Criterion (4) was included since we could not recruit a large number of participants during the COVID-19 pandemic and decided to use an online platform for the current project. Two authors evaluated each of the criteria.
We selected one study investigating simple effects (i.e., simple effects of sensory stimuli without mediation and/or moderation) in consumer contexts when the research contained multiple qualifying studies. It should be noted that we did not attempt to replicate all influential research on sensory marketing. It has been suggested that empirical audits and reviews do not always include all relevant research (O'Donnell et al., 2021) possibly because of the limitations of time, money, and human resources.
We opened up the data collection to recruit 1000 Japanese participants. The sample size was determined to be at least 2.5 times the sample size of any original paper (Simonsohn, 2015; O'Donnell et al., 2021). The high-power, large sample size allowed us to detect small effects and reduce type 1 errors. Following the pre-registered exclusion criteria, we excluded 247 participants who failed an instructional manipulation check (IMC; Oppenheimer et al., 2009; Miura and Kobayashi, 2016) and an attention check question (ACQ; e.g., Oppenheimer et al., 2009; Aust et al., 2013). Detailed information about the data exclusion criteria can be found in the Appendix. Finally, the data of 823 participants (mean age = 40.77, SD of age = 10.48, 428 males, 391 females, 4 did not prefer to say) were analyzed. The participants were recruited from Crowdworks and completed an online survey created on Qualtrics. The study was pre-registered (https://aspredicted.org/ZW2_C76). All participants gave their informed consent before the survey, and the study was conducted following the ethical guidelines of the Declaration of Helsinki.
The participants performed all the studies in randomized order. Within each study, participants were randomly allocated to one condition (e.g., one of the two conditions for Romero and Biswas, 2016). Participants completed all the studies within about 10 minutes (M = 609 s). This procedure was similar with previous replication attempts involving many studies (e.g., participants completing 13 or 15 studies; see Forsell et al., 2019). Methods, analyses, and sample sizes were performed before data collection. The details of the methods, procedures, and analyses of each study are presented in the Supplementary material (Methodological Detail Appendix). All surveys were conducted in Japanese. The materials were translated by two authors (K.M. and S.I.).
Results
Klink (2000), marketing letters
We conducted binominal tests as described by Klink (2000). The data were also analyzed using chi-squared tests, although not pre-registered. The analyses were reported based on chi-squared tests because the statistical value (χ2) can be converted into an effect size (r), commonly used in our replication research. A summary of these findings is presented in Table 2. We successfully replicated previous findings except for H1i and H1k (i.e., more masculine and stronger).
Table 2
| Hypothesis | Attributes | Product category | Frequencies of choosing front vowel sounds | Frequencies of choosing back vowel sounds | Statistics | Hypothesis testing |
|---|---|---|---|---|---|---|
| H1a | Smaller | Laptop computer | 512 | 311 | χ2 = 49.09, p < 0.001 | Supported |
| H1b | Darker | Beer | 289 | 534 | χ2 = 72.934, p < 0.001 | Supported |
| H1c | Milder | Soap | 331 | 492 | χ2 = 31.496, p < 0.001 | Supported |
| H1d | Thicker | Ketchup | 320 | 503 | χ2 = 40.691, p < 0.001 | Supported |
| H1e | Softer | Tissues | 536 | 287 | χ2 = 75.335, p < 0.001 | Supported |
| H1f | Faster | Internet service | 539 | 284 | χ2= 79.01, p < 0.001 | Supported |
| H1g | Warmer | Gloves | 343 | 480 | χ2 = 22.806, p < 0.001 | Supported |
| H1h | More bitter | Lemonade | 456 | 367 | χ2 = 9.6245, p = 0.002 | Supported |
| H1i | More masculine | Deodorant | 452 | 371 | χ2 = 7.9721, p = 0.005 | Not supported (opposite direction) |
| H1j | Friendlier | Airline service | 515 | 308 | χ2 = 52.064, p < 0.001 | Supported |
| H1k | Stronger | Pain relievers | 546 | 277 | χ2 = 87.923, p < 0.001 | Not supported (opposite direction) |
| H1l | Heavier | Vacuum cleaner | 233 | 590 | χ2 = 154.86, p < 0.001 | Supported |
| H1m | Prettier | Dresses | 461 | 362 | χ2= 11.909, p < 0.001 | Supported |
Summary of findings that the current research replicated Klink (2000).
Shrum et al. (2012), IJMR
We conducted a 2 (vowel: front, back) × 2 (product category: convertible/knife, 4 × 4 SUV/hammer) mixed model analysis of variance (ANOVA), with a vowel as a within-participants factor and product category as between-participant factors. The results of the analysis revealed a main effect of vowel (F1,821 = 252.615, p < 0.001, η2p = 0.235) and product category (F1,821 = 18.478, p < 0.001, η2p = 0.022). As predicted, a significant interaction was found (F1,821 = 55.002, p < 0.001, η2p = 0.063). Front vowel sounds were preferred over back vowel sounds for convertible and knife (52.56–47.45%; F1,821 = 4.717, p = 0.030, η2p = 0.011). In contrast, back vowel sounds were preferred over front vowel sounds for 4 × 4 vehicle and hammer (59.59–40.41%; F1,821 = 70.981, p < 0.001, η2p = 0.149). Thus, we successfully replicated the previous findings (Table 3).
Table 3
| Product category | % Front vowel words preferred | % Back vowel words preferred |
|---|---|---|
| Convertible/Knife | 52.56 | 47.45 |
| 4 × 4 SUV/Hammer | 40.41 | 59.59 |
| Convertible | 47.84 | 52.16 |
| Knife | 57.22 | 42.78 |
| 4 × 4 SUV | 39.59 | 60.41 |
| Hammer | 41.13 | 58.87 |
Summary of findings that the current research replicated Shrum et al. (2012).
Convertible (n = 208), knife (n = 210), 4 × 4 SUV (n = 189), hammer (n =216).
Hagtvedt and Brasel (2017), journal of consumer research
ANOVA was conducted to investigate the effects of saturation (high and low) on the size estimate of the product. The results of the analysis did not reveal any effects of saturation (high saturation: M = 15.46, SD = 1.94, vs. low saturation: M = 15.42, SD = 1.84; F1,821 = 0.095, p = 0.758, η2p = 0.000). ANOVAs were conducted to investigate the effects of saturation (high and low) on attention and arousal. The results of the analysis revealed that high (vs. low) saturation increased attention (high saturation: M = 5.30, SD = 1.07; vs. low saturation: M = 4.75, SD = 1.14; F1,821 = 49.238, p < 001, η2p = 0.057) and arousal (high saturation: M = 5.83, SD = 1.10; vs. low saturation: M = 5.41, SD = 1.20; F1,821 = 27.539, p < 0.001, η2p = 0.033). Given that our main result (i.e., saturation and size estimates) was not significant, we did not perform pre-registered mediation analyses.
Romero and Biswas (2016), journal of consumer research
A chi-squared test was performed to investigate whether the frequencies of choosing healthy food differ in the positions where the foods are located on the left vs. the right side of unhealthy foods. The results of the analysis showed that the frequency of choosing healthy food did not differ regardless of whether it was on the left (24.44%) or the right (25.59%) of the unhealthy food (χ2 = 0.091, p = 0.763).
Yorkston and Menon (2004), journal of consumer research
An ANOVA was performed to test the effects of sound symbolism of brand name (Frish, Frosh), diagnosticity of brand name (test, true), and timing (simultaneous, after) on the attribute perception index. The results of the analysis revealed the main effect of sound symbolism of brand name (F1,821 = 7.492, p = 0.006, η2p = 0.009) such that frosh (vs. frish) had higher ratings in the attribute perception index. However, the results of the analysis did not show a three-way interaction (F1,821 = 1.053, p = 0.305, η2p = 0.001) or an interaction between sound symbolism and diagnosticity (F1,821 = 0.118, p = 0.731, η2p = 0.000).
An ANOVA was also conducted to investigate the effects of sound symbolism of brand name (Frish, Frosh), diagnosticity of brand name (test, true), and timing (simultaneous, after) on the brand attribute index. The results of the analysis did not reveal the main effect of sound symbolism of brand name (F1,821 = 0.114, p = 0.736, η2p = 0.000), the three-way interaction (F1,821 = 1.400, p = 0.237, η2p = 0.002), or the interaction between sound symbolism and diagnosticity (F1,821 = 1.174, p = 0.279, η2p = 0.001).
Elder and Krishna (2011), journal of consumer research
ANOVA was conducted to investigate the effects of product orientation on a participant's dominant hand (match or mismatch) on purchase intentions. The results of the analysis did not reveal any effects on purchase intentions (match: M = 3.39, SD = 1.75; mismatch: M = 3.36, SD = 1.82; F1,821 = 0.068, p = 0.794, η2p = 0.0001). ANOVA was also conducted to investigate the effects of orientation (match and mismatch) on mental simulations. The results of the analysis did not reveal any effects on mental simulations (match: M = 4.87, SD = 2.00 vs. mismatch: M = 4.86, SD = 2.03; F1,821 = 0.006, p = 0.941, η2p = 0.0000). Given that our main result was not significant, we did not perform pre-registered mediation analyses.
Jiang et al. (2015), journal of consumer research
An ANOVA was conducted to investigate the log-shape-by-product attribute interactions. The results of the analysis did not reveal logo shape-by-cut attribute interactions (F2,820 = 0.141, p = 0.868, η2p = 0.000). For completeness, we analyzed the effects of circular vs. angular-logo on comfort (circular-logo: M = 5.33, SD = 1.35, vs. angular-logo: M = 5.34, SD = 1.30; F1,550 = 0.004, p = 0.949, η2p = 0.000) and durability judgment (angular-logo: M = 5.37, SD = 1.31 vs. circular-logo: M = 5.37, SD = 1.32; F1,550 = 0.0001, p = 0.994, η2p = 0.000). The analyses did not reveal the effects of logo shape on comfort and durability judgments.
Additionally, Jiang et al. (2015) confirmed that logo shape does not affect attitudes. Therefore, an ANOVA was conducted to investigate the effect of angular and circular-logo shapes on attitude. The results showed that there were no differences in attitudes between logo shapes (circular-logo: M = 5.08, SD = 1.23, vs. angular-logo: M = 5.13, SD = 1.20, vs. control: M = 5.18, SD = 1.21; F2,820 = 0.478, p = 0.620, η2p = 0.001).
Chae and Hoegg (2013), journal of consumer research
In this replication, 85 participants were unable to identify the shopping goal in the manipulation check and were excluded, leaving 738 participants in the analysis. An ANOVA was conducted to investigate the effects of desirable attributes (antique, modern, and control) and position (left and right) on product attitudes. The results of the analysis revealed the main effect of the desirable attribute (F2,732 = 7.952, p < 0.001, η2p = 0.021) but not the main effect of position (F1,732 = 1.093, p = 0.296, η2p = 0.002). A significant interaction was found (F2,732 = 2.758, p = 0.064, η2p = 0.008). However, post hoc analyses did not reveal any hypothetical findings. Antique priming did not influence product attitudes depending on position (left: M = 5.95, SD = 1.47 vs. right: M = 5.98, SD = 1.53; F1,732 = 0.032, p = 0.859, η2p = 0.000). Modern priming did not influence product attitudes depending on position (right: M = 5.47, SD = 1.41 vs. left: M = 5.63, SD = 1.68; F1,732 = 0.695, p = 0.405, η2p = 0.001). Given that our main result was not significant, we did not perform pre-registered mediation analyses.
Cian et al. (2014), journal of marketing research
An ANOVA was conducted to investigate the effect of logo dynamism (high and low) on brand attitudes. The results of the analysis did not reveal an effect on brand attitudes (high dynamism: M = 5.64, SD = 1.05; vs. low dynamism: M = 5.59, SD = 1.15; F1,821 = 0.393, p = 0.531, η2p = 0.001). An ANOVA was also conducted to investigate the effect of logo dynamism (high and low) on perceived movement as a manipulation check. The results of the analysis revealed an effect on perceived movement (high dynamism: M = 5.85, SD = 1.27, vs. low dynamism: M = 5.00, SD = 1.50; F1,821 = 77.863, p < 0.001, η2p = 0.087).
Madzharov and Block (2010), journal of consumer psychology
ANOVA was conducted to investigate the effect of product units displayed on the package (f our and seven) on perceived product quantity. The results of the analysis did not reveal any effect on perceived product quantity (f our: M = 21.40, SD = 100.28; seven: M = 17. 71, SD = 9.14; F1,821 = 0.565, p = 0.452, η2p = 0.001). Since there was an outlier in the response for perceived product quantity (i.e., a response = 2020), the Mann-Whitney U test (nonparametric test) was not pre-registered. The results of the analysis did not reveal any effect on the perceived product quantity (U = 78,727, Z = 1.743, p = 0.081, r = 0.061).
ANOVA was also conducted to investigate the effect of product units displayed on the package (f our, seven) on the serving size. The results of the analysis did not reveal an effect on serving size (f our: M = 4.45, SD = 3.00, vs. seven: M = 4.80, SD = 3.52; F1,821 = 2.380, p = 0.123, η2p = 0.003).
Summary of findings
A summary of our replication findings is shown in Tables 4, 5. The results reveal that only 20% (2/10) of the findings could be successfully replicated in terms of statistical significance (p < 0.05; 95% CI not including zero in the hypothesized direction). In other words, replication of eight studies (80%, 8/10) did not reach statistical significance. Moreover, the replication effect sizes were smaller than the original effect sizes in all ten studies. The replication effect sizes of the two successfully replicated findings were half of the original ones. We also provided estimated power and the upper bounds of 95% for the estimated power of the original studies. Most of the original studies (i.e., their main DVs of 8/10 unsuccessful replications) included <20% power in their 95% CIs. This suggests that most of the original findings that we attempted to replicate appear to have much smaller effects that thousands of sample sizes are needed for detection.
Table 4
| Selected 10 studies | Hypotheses/DV | Effect sizes |
|---|---|---|
| Klink (2000), Study 1 | Average of H1a-m | 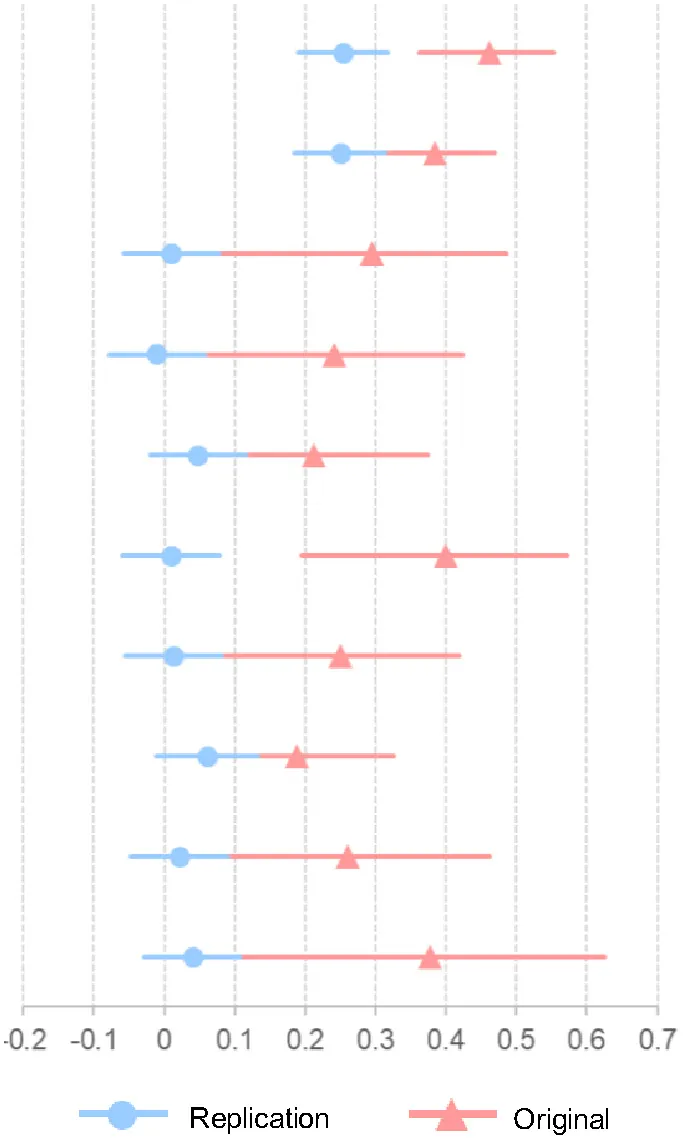 |
| Shrum et al. (2012), Experiment 1a, 1b, 1c | Vowel sound-product category interaction | |
| Hagtvedt and Brasel (2017), Study 3 | Size estimate | |
| Romero and Biswas (2016), Study 1B | Choice | |
| Yorkston and Menon (2004), Study 1 | Average of main, two-way, three-way attribution perception index | |
| Elder and Krishna (2011), Study 4 | Purchase intention | |
| Jiang et al. (2015), Experiment 1 | Logo shape-by-product-attribute interaction | |
| Chae and Hoegg (2013), Study 2 | interaction between position and desirable attribute on product attitude | |
| Cian et al. (2014), Study 1 | Brand attitude | |
| Madzharov and Block (2010), Study 1A | Average of product quantity and surving size |
Main findings of selected 10 studies.
The Rightmost column depicts effect size (correlation coefficients) for the original and replication studies. Effect sizes are bounded by 95% CIs.
Table 5
| Hypotheses/DV | Original effect | Replication effect | Estimated Power of the original | Upper Bound of 95% Cl for Estimated Power | Estimated Sample Size required for 80% power | ||||
|---|---|---|---|---|---|---|---|---|---|
| Effect size | 95% CI lower | 95% CI upper | Effect size | 95% CI lower | 95% CI upper | ||||
| Klink (2000), Study 1 | |||||||||
| Small | 0.623 | 0.543 | 0.691 | 0.244 | 0.179 | 0.307 | 0.981 | 0.999 | 128.452 |
| Dark color | 0.638 | 0.560 | 0.704 | 0.298 | 0.234 | 0.359 | 0.999 | 1.000 | 85.432 |
| Mild | 0.283 | 0.168 | 0.390 | 0.196 | 0.129 | 0.260 | 0.895 | 0.991 | 201.958 |
| Rich | 0.819 | 0.775 | 0.855 | 0.222 | 0.156 | 0.286 | 0.956 | 0.998 | 155.613 |
| Soft | 0.215 | 0.097 | 0.327 | 0.303 | 0.239 | 0.363 | 0.999 | 1.000 | 82.609 |
| Fast | 0.411 | 0.306 | 0.507 | 0.310 | 0.247 | 0.370 | 0.999 | 1.000 | 78.621 |
| Warm | 0.615 | 0.534 | 0.685 | 0.166 | 0.099 | 0.232 | 0.778 | 0.970 | 280.107 |
| Bitter | 0.230 | 0.113 | 0.341 | 0.108 | 0.040 | 0.175 | 0.421 | 0.819 | 668.029 |
| Masculine | 0.570 | 0.482 | 0.646 | −0.327 | −0.265 | −0.387 | <5% | – | – |
| Friendly | 0.245 | 0.129 | 0.355 | 0.252 | 0.186 | 0.314 | 0.986 | 1.000 | 120.935 |
| Strong | 0.230 | 0.113 | 0.341 | −0.327 | −0.264 | −0.387 | <5% | – | – |
| Heavy | 0.796 | 0.747 | 0.836 | 0.434 | 0.377 | 0.488 | 1.000 | 1.000 | 38.571 |
| Pretty | 0.336 | 0.224 | 0.439 | 0.120 | 0.052 | 0.187 | 0.500 | 0.866 | 539.280 |
| Shrum et al. (2012), Experiment 1a, 1b, 1c | |||||||||
| Vowel sound-product category interaction | 0.385 | 0.295 | 0.468 | 0.251 | 0.185 | 0.314 | 0.999 | 1.000 | 121.873 |
| Front vowel sounds for convertible and knife | 0.362 | 0.232 | 0.480 | 0.106 | 0.010 | 0.200 | 0.536 | 0.921 | 698.523 |
| Back vowel sounds for 4 × 4 SUV/Hammer | 0.367 | 0.236 | 0.485 | 0.387 | 0.300 | 0.466 | 1.000 | 1.000 | 49.384 |
| Hagtvedt and Brasel (2017), Study 3 | |||||||||
| Size estimate | 0.295 | 0.076 | 0.487 | 0.011 | −0.058 | 0.079 | 0.051 | 0.105 | 68,050.270 |
| Attention | 0.249 | 0.026 | 0.448 | 0.238 | 0.172 | 0.301 | 0.555 | 0.767 | 135.587 |
| Arousal | 0.299 | 0.080 | 0.490 | 0.180 | 0.113 | 0.245 | 0.350 | 0.582 | 238.707 |
| Romero and Biswas (2016), Study 1B | |||||||||
| Choice | 0.241 | 0.040 | 0.424 | −0.011 | −0.079 | 0.058 | <5% | – | – |
| Yorkston and Menon (2004), Study 1 | |||||||||
| Attribute Perception Index (Main effect of brand name) | 0.274 | 0.104 | 0.429 | 0.095 | 0.027 | 0.163 | 0.187 | 0.447 | 858.592 |
| Attribute Perception Index (2-way interaction) | 0.186 | 0.012 | 0.350 | 0.012 | −0.056 | 0.080 | 0.052 | 0.146 | 54,169.160 |
| Attribute Perception Index (3-way interaction) | 0.178 | 0.003 | 0.342 | 0.036 | −0.033 | 0.104 | 0.068 | 0.213 | 6,081.877 |
| Brand Evaluation Index (Main effect of brand name) | 0.271 | 0.101 | 0.426 | 0.012 | −0.057 | 0.080 | 0.052 | 0.145 | 56,068.000 |
| Brand Evaluation Index (2-way interaction) | 0.246 | 0.074 | 0.403 | 0.038 | −0.030 | 0.106 | 0.071 | 0.220 | 5,453.455 |
| Brand Evaluation Index (3-way interaction) | 0.197 | 0.023 | 0.360 | 0.041 | −0.027 | 0.109 | 0.075 | 0.231 | 4,574.852 |
| Elder and Krishna (2011), Study 4 | |||||||||
| Purchase intention | 0.400 | 0.195 | 0.572 | 0.009 | −0.059 | 0.077 | 0.051 | 0.103 | 95,047.700 |
| Mental simulation | 0.245 | 0.024 | 0.444 | 0.003 | −0.066 | 0.071 | 0.050 | 0.095 | 1,171,626.000 |
| Jiang et al. (2015), Experiment 1 | |||||||||
| Logo shape-by-product-attribute interaction | 0.251 | 0.066 | 0.419 | 0.013 | −0.055 | 0.081 | 0.052 | 0.134 | 45,561.510 |
| Comfortable: circular-logo (vs. angular-logo) | 0.258 | 0.074 | 0.426 | −0.003 | −0.086 | 0.081 | <5% | – | – |
| Durable: angular-logo (vs. circular-logo) | 0.195 | 0.007 | 0.370 | 0.000 | −0.084 | 0.083 | <5% | – | – |
| Chae and Hoegg (2013), Study 2 | |||||||||
| interaction between position and desirable attribute on product attitude | 0.189 | 0.043 | 0.326 | 0.061 | −0.011 | 0.133 | 0.129 | 0.427 | 2,096.105 |
| Antique conditions increase favorable responses to product image on the left than on the right | 0.171 | 0.025 | 0.310 | −0.007 | −0.079 | 0.066 | <5% | – | – |
| Modern conditions increase favorable responses to product image on the right than on the left | 0.208 | 0.063 | 0.344 | −0.031 | −0.103 | 0.042 | <5% | – | – |
| Cian et al. (2014), Study 1 | |||||||||
| Brand attitude | 0.261 | 0.034 | 0.462 | 0.022 | −0.047 | 0.090 | 0.054 | 0.119 | 16,422.330 |
| Perceived movement | 0.386 | 0.173 | 0.565 | 0.294 | 0.231 | 0.356 | 0.729 | 0.883 | 87.473 |
| Madzharov and Block (2010), Study 1A | |||||||||
| Product quantity | 0.407 | 0.095 | 0.646 | 0.026 | −0.042 | 0.094 | 0.052 | 0.086 | 11,405.840 |
| Serving size | 0.348 | 0.027 | 0.604 | 0.054 | −0.015 | 0.122 | 0.061 | 0.111 | 2,712.469 |
Detailed findings of selected 10 studies.
The Leftmost columns and the Middle columns depict effect size (correlation coefficients) and 95% CIs for the original and replication studies. The Right columns indicate the estimated power in the original studies (third column from Right), the upper bound of the 95% CI for estimated power in the original (second column from Right), and well as an estimated sample size required for 80% power, based on the replication effect (Rightmost column). Hypotheses/DVs in bold indicate that effect sizes of upper and lower 95% CIs are >0.
We employ empirical audits and reviews (O'Donnell et al., 2021), which can be used to reach aggregate conclusions to evaluate research designs (e.g., manipulations and measures) that empirically strengthen (or weaken) evidence. Two successful studies had relatively larger sample sizes, used sound symbolism, and employed within-participants manipulation of senses. No studies involving visual factors, between-participant manipulation of senses, or interactions between factors could be replicated. This suggests that specific research designs (e.g., the type of senses, manipulation of senses, and number of sample sizes) influence the credibility of the findings.
Discussion
Our research examined the replicability of ten influential studies on sensory marketing. Sensory marketing has attracted the attention of researchers and practitioners over the last decade (Krishna, 2011, 2012). An influential article on sensory marketing (Krishna, 2011) was cited more than 1400 times in Google Scholar (February 2022). However, to our knowledge, no research has attempted to replicate these findings from the perspective of empirical audit and review (O'Donnell et al., 2021). In general, our findings demonstrated that 20% (2/10) of the influential research on sensory marketing was successfully replicated. Our findings suggest that not all influential research can be replicated, and indicate the importance of replication research to examine the reliability of prior findings in consumer psychology and marketing.
Contribution to replication attempts in consumer psychology
Our findings contribute to replication attempts in consumer psychology. The sciences are facing a replication crisis. Since it has been revealed that famous psychological findings are less replicable (Open Science Collaboration, 2015), several attempts have been made in psychology (Klein et al., 2018), economics (Camerer et al., 2016), and behavioral sciences (Camerer et al., 2018). However, replication attempts in consumer psychology have been relatively rare [see O'Donnell et al., 2021 and Data Colada (http://datacolada.org/) for a few exemptions]. Our study is one of the first attempts to replicate research on consumer psychology, especially from the standpoint of empirical audits and reviews (O'Donnell et al., 2021). The replication findings revealed that 20% could be replicated in terms of pre-registered analyses (p < 0.05). Together, our results demonstrate the replicability of the scientific findings in consumer psychology.
Which findings can or cannot be replicated?
Our results reveal the sensory marketing findings that can or cannot be replicated. First, sensory marketing research that capitalizes on sound symbolism is replicable. Our replication attempts successfully replicated two findings (Klink, 2000; Shrum et al., 2012) and partially replicated one of them (Yorkston and Menon, 2004). This is consistent with the argument that sound symbolism is robust and found in diverse cultures (Cwiek et al., 2022). Among sensory marketing research, the reliability of the findings might differ depending on the type of sensory stimuli. Findings based on sounds, especially sound symbolism, appear to be more reliable than those based on other sensory stimuli.
Second, replicable findings tend to manipulate sensory stimuli within-participants. Two of the replicable findings adopt the within-participants manipulation of sensory stimuli (Klink, 2000; Shrum et al., 2012); though not all research on within-participants manipulation can be replicated (Romero and Biswas, 2016). Two sensory stimuli (e.g., hypothetical brand names, including front vowels and back vowels) are evaluated side by side simultaneously (i.e., joint rather than separate evaluation) (Hsee, 1996). Recent research has suggested that the effects of sensory stimuli (i.e., verticality and horizontality of photos) on judgment appear to be more reliably obtained in within-participants than between-participant designs (Zhang et al., 2022). Some findings that were not successfully replicated in our research employed between-participant manipulations of sensory stimuli (Elder and Krishna, 2011; Hagtvedt and Brasel, 2017). Together, our replication attempts suggest that within-participants manipulation creates more reliable and replicable findings.
Third, previous findings obtained from larger samples and effect sizes are more replicable. We successfully replicated two findings that had relatively larger samples and effect sizes (Klink, 2000; Shrum et al., 2012). Their sample sizes (Klink, 2000; Shrum et al., 2012) are the top two largest among the ten research targets. The effect size of Klink (2000) is the largest, and that of Shrum et al. (2012) is the third largest among the ten sensory marketing studies. Klink (2000) had n = 265 and r = 0.46 (mean r of Study 1 H1a-m). Shrum et al. (2012) had n = 357 (combined analysis of Experiment 1a-c) and r = 0.39. This appears to be consistent with the evidence that the sample size and effect size in the original study were associated with the success of the replications (Soto, 2019); however, see Altmejd et al. (2019).
Our findings contribute to the research on sensory marketing in digital environments. Consumers tend to spend a lot of time shopping in digital environments (e.g., e-commerce). This tendency is present in WEIRD and non-WEIRD consumers. Although some studies have attempted to investigate the role of sensory stimuli in consumer behavior in an online setting (e.g., Rodríguez et al., 2021), less is known about how previous influential findings on sensory marketing, mostly obtained from WEIRD consumers in an offline setting, can be generalized to non-WEIRD consumers in an online setting. To fill this gap, we attempted to replicate ten influential studies on sensory marketing in digital environments by recruiting non-WEIRD consumers. The results revealed that only 20% of the findings of the influential studies can be replicated by non-WEIRD consumers in an online setting. Given that our replication research does not cover all aspects of sensory marketing in digital and/or virtual environments, more such research is needed. For example, it would be intriguing to test in future research the replicability and generalizability of findings involving new sensory-enabling technologies (Petit et al., 2019).
Limitation of the current study
Our study had the following limitations. First, the differences in participants' nationality/cultures between the present and the original research might influence our findings. Our participants were non-WEIRD consumers (i.e., Japanese consumers), while the participants in the original research were WEIRD consumers. It should be noted that we did not aim for the exact or direct replications (LeBel et al., 2018). Rather, we conducted conceptual replications by recruiting non-WEIRD consumers to test the generalizability of previous findings on sensory marketing. Our results cast doubt on the generalizability of previous findings on sensory marketing. Further research should conduct the direct replications to recruit the same characteristic of the participant with the original studies. Second, our study did not attempt to replicate influential research on sensory marketing that addressed olfaction, taste, and haptics. Namely, the senses manipulated as independent variables were limited to auditory and visual senses, although replication of Klink (2000) addressed all senses except the independent variable. It is important to conduct additional studies that consider various sense factors. Moreover, participants went through ten studies sequentially at the same time. The fatigues, the order effects, and/or attentiveness possibly influence our findings. However, it should be noted that the required time (and the number of studies) was shorted than that of previous attempts of replications projects. Our participants completed the ten studies within about 10 minutes (M = 609 s), while participants in a previous replication project completed 13 or 15 studies for about 30 min (see Klein et al., 2018). Our attention check was also conducted after performing all the studies, which possibly suggesting that participants could attend to the tasks. Given this, our procedures apparently not induced excessive fatigues and not lead to the problem of attentiveness. The order of ten studies were also randomized and could cancel out any order effects. Nevertheless, further research should treat with issues. Finally, our results might be influenced by differences in the materials and instructions. We used the same visual stimuli as the original ones. In the case of auditory stimuli (i.e., sounds in brand names), the manipulation of the auditory stimuli was the same as that of the original ones. However, the presentation of the stimuli differed between the original study and our study. Klink (2000) presented brand-name stimuli in a 2-page booklet. Yorkston and Menon (2004) had participants read a press release containing brand-name stimuli. We cannot confirm whether our replication study exactly followed the instructions and materials in the original research because detailed instructions and materials were missing in many cases. Further research is required to clarify this issue.
Conclusion
We evaluated the replicability of ten influential research on sensory marketing by conducting a high-powered and pre-registered replication. The results demonstrated that only 20% (2/10) of study findings could be successfully replicated, and their effect sizes are half of the original ones. Successfully replicated findings are characterized by relatively larger sample sizes, use of sound symbolism, and within-participants manipulation of the senses. Our findings reveal an initial estimate of the replicability of sensory marketing and provide implications for how to build a cumulative science in consumer psychology.
Publisher's note
All claims expressed in this article are solely those of the authors and do not necessarily represent those of their affiliated organizations, or those of the publisher, the editors and the reviewers. Any product that may be evaluated in this article, or claim that may be made by its manufacturer, is not guaranteed or endorsed by the publisher.
Statements
Data availability statement
The original contributions presented in the study are included in the article/Supplementary material, further inquiries can be directed to the corresponding author/s. Data, materials, and analysis code are available at https://osf.io/tnmvq/.
Ethics statement
Ethical approval was not provided for this study on human participants because online experiments and participants' responses are anonymous. The patients/participants provided their written informed consent to participate in this study.
Author contributions
Conceptualization, data curation, formal analysis, investigation, methodology, project administration, resources, software, validation, visualization, and writing—review and editing: KM and SI. Roles/writing—original draft: KM. Both authors contributed to the article and approved the submitted version.
Conflict of interest
The authors declare that the research was conducted in the absence of any commercial or financial relationships that could be construed as a potential conflict of interest.
Supplementary material
The Supplementary Material for this article can be found online at: https://www.frontiersin.org/articles/10.3389/fcomm.2022.1048896/full#supplementary-material
Footnotes
1.^The effect size is the magnitude of the relationship between the independent and dependent variables.
2.^Pre-registration refers to the process of registering the contents of a study to be conducted with a third-party organization (e.g., https://osf.io/, https://aspredicted.org/). The contents to be pre-registered include hypotheses, sample size, independent variables, dependent variables, analysis methods, and data exclusion criteria. Researchers must conduct the study based on these pre-registered contents. In principle, deviations from the pre-registered content are not permitted. Hence, pre-registration can prevent questionable research practices (QRPs) such as p-hacking, HARKing, and cherry picking.
References
1
AltmejdA.DreberA.ForsellE.HuberJ.ImaiT.JohannessonM.et al. (2019). Predicting the replicability of social science lab experiments. PloS ONE.14, e0225826. 10.1371/journal.pone.0225826
2
AsendorpfJ. B.ConnerM.De FruytF.De HouwerJ.DenissenJ. J. A.FiedlerK.et al. (2013). Recommendations for increasing replicability in psychology. Eur. J. Pers.27, 108–119. 10.1002/per.1919
3
AustF.DiedenhofenB.UllrichS.MuschJ. (2013). Seriousness checks are useful to. improve data validity in online research. Behav. Res. Methods.45, 527–535. 10.3758/s13428-012-0265-2
4
BaumeisterR. F.SparksE. A.StillmanT. F.VohsK. D. (2008). Free will in. consumer behavior: Self-control, ego depletion, and choice. J. Consum. Psychol.18, 4–13. 10.1016/j.jcps.2007.10.002
5
BiswasD.SzocsC.ChackoR.WansinkB. (2017). Shining light on atmospherics: how ambient light influences food choices. J. Market. Res.54, 111–123. 10.1509/jmr.14.0115
6
CamererC. F.DreberA.ForsellE.HoT.-. HHuberJ.et al. (2016). Evaluating replicability of laboratory experiments in economics. Science351, 1433–1436. 10.1126/science.aaf0918
7
CamererC. F.DreberA.HolzmeisterF.HoT.-. HHuberJ.et al. (2018). Evaluating the replicability of social science experiments in Nature and Science between 2010 and 2015. Nat. Human Behav.2, 637–644. 10.1038/s41562-018-0399-z
8
ChaeB.HoeggJ. (2013). The future looks “right”: effects of the horizontal location. of advertising images on product attitude. J. Consum. Res.40, 223–238. 10.1086/669476
9
CharltonA.MontoyaA.PriceJ.HilgardJ. (2021). Noise in the process: an assessment of the evidential value of mediation effects in marketing journals. PsyArXiv [Preprints]. 10.31234/osf.io/ck2r5
10
CianL.KrishnaA.ElderR. S. (2014). This logo moves me: dynamic imagery from static images. J. Market. Res.51, 184–197. 10.1509/jmr.13.0023
11
CwiekA.FuchsS.DraxlerC.AsuE. L.DediuD.HiovainK.et al. (2022). The bouba/kiki effect is robust across cultures and writing systems. Philos. Transac. Royal Soc. London. Ser. B Biol. Sci.377, 20200390. 10.1098/rstb.2020.0390
12
DingY.DeSarboW. S.HanssensD. M.JedidiK.LynchJ. G.LehmannD. R. (2020). The past, present, and future of measurement and methods in marketing analysis. Market. Lett.31, 175–186. 10.1007/s11002-020-09527-7
13
DuboisD.RuckerD. D.Galinskya D. (2011). Super size me: product size as a Signal of Status. J. Consum. Res.38, 1047–1062. 10.1086/661890
14
EdlundJ. E.CuccoloK.IrgensM. S.WaggeJ. R.ZlokovichM. S. (2022). Saving science through replication studies. Perspect. Psychol. Sci. J. Assoc. Psychol. Sci.17, 216–225. 10.1177/1745691620984385
15
ElderR. S.KrishnaA. (2011). The “visual depiction effect” in advertising: facilitating. embodied mental simulation through product orientation. J. Consum. Res.38, 988–1003. 10.1086/661531
16
FerraroR.ShivB.BettmanJ. R. (2005). Let us eat and drink, for tomorrow we shall. die: effects of mortality salience and self-esteem on self-regulation in consumer choice. J. Consum. Res.32, 65–75. 10.1086/429601
17
ForsellE.ViganolaD.PfeifferT.AlmenbergJ.WilsonB.ChenY.et al. (2019). Predicting replication outcomes in the many labs 2 study. J. Econ. Psychol.75, 102117. 10.1016/j.joep.2018.10.009
18
FransenM. L.FennisB. M.Pruyna T. H.DasE. (2008). Rest in peace? Brand-induced mortality salience and consumer behavior. J. Bus. Res.61, 1053–1061. 10.1016/j.jbusres.2007.09.020
19
GoodmanJ. K.PaolacciG. (2017). Crowdsourcing consumer research. J. Consum. Res.44, 196–210. 10.1093/jcr/ucx047
20
HagtvedtH.BraselS. A. (2017). Color Saturation Increases Perceived Product Size. J. Consum. Res.44, 396–413. 10.1093/jcr/ucx039
21
HenrichJ.HeineS. J.NorenzayanA. (2010). Most people are not WEIRD. Nature466, 29–29. 10.1038/466029a
22
HoyerW. D.MacInnisD. J.PietersR. (2012). Consumer Behavior. Boston, MA: Cengage Learning.
23
HseeC. K. (1996). The evaluability hypothesis: an explanation for preference reversals. between joint and separate evaluations of alternatives. Organ. Behav. Human Dec. Process.67, 247–257. 10.1006/obhd.1996.0077
24
IsekiS.MotokiK.SakataR.KitagamiS. (2021). How semantically labeled scent-gender associations influence the evaluations of scent and texture. Front. Psychol.12, 713329. 10.3389/fpsyg.2021.713329
25
JiangY.GornG. J.GalliM.ChattopadhyayA. (2015). Does your company have the right logo? How and why circular- and angular-logo shapes influence brand attribute judgments. J. Consum. Res.42, 709–726. 10.1093/jcr/ucv049
26
KleinR. A.CookC. L.EbersoleC. R.VitielloC. A.NosekB. A.ChartierC. R.et al. (2019). Many labs 4: failure to replicate mortality salience effect with and without original author involvement. Collab. Pshycol. 8, 3527 10.31234/osf.io/vef2c
27
KleinR. A.VianelloM.HasselmanF.AdamsB. G.AdamsR. B.AlperS.et al. (2018). Many labs 2: investigating variation in replicability across samples and settings. Adv. Methods Pract. Psychol. Sci.1, 443–490. 10.1177/2515245918810225
28
KlinkR. R. (2000). Creating brand names with meaning: the use of sound symbolism. Market. Lett.11, 5–20. 10.1023/A:1008184423824
29
KrishnaA. (2011). Sensory Marketing: Research on the Sensuality of Products. London, UK: Routledge.
30
KrishnaA. (2012). An integrative review of sensory marketing: Engaging the senses to. affect perception, judgment and behavior. J. Consum. Psychol.22, 332–351. 10.1016/j.jcps.2011.08.003
31
KrishnaA.CianL.AydinogluN. Z. (2017). Sensory aspects of package design. J. Retail.93, 43–54. 10.1016/j.jretai.2016.12.002
32
KrishnaA.CianL.SokolovaT. (2016). The power of sensory marketing in advertising. Curr. Opin. Psychol.10, 142–147. 10.1016/j.copsyc.2016.01.007
33
KrishnaA.SchwarzN. (2014). Sensory marketing, embodiment, and grounded. cognition: a review and introduction. J. Consum. Psychol.24, 159–168. 10.1016/j.jcps.2013.12.006
34
LeBelE. P.McCarthyR. J.EarpB. D.ElsonM.VanpaemelW. (2018). A Unified framework to quantify the credibility of scientific findings. Adv. Methods Pract. Psychol. Sci.1, 389–402. 10.1177/2515245918787489
35
LittA.ShivB. (2012). Manipulating basic taste perception to explore how product. information affects experience. J. Consum. Psychol.22, 55–66. 10.1016/j.jcps.2011.11.007
36
LowreyT. M.ShrumL. J. (2007). Phonetic symbolism and brand name preference. The. J. Consum. Res.34, 406–414. 10.1086/518530
37
LynchJ. G.BradlowE. T.HuberJ. C.LehmannD. R. (2015). Reflections on the. replication corner: In praise of conceptual replications. Int. J. Res. in Market.32, 333–342. 10.1016/j.ijresmar.2015.09.006
38
Madzharova V.BlockL. G. (2010). Effects of product unit image on consumption of snack foods. J. Consum. Psychol.20, 398–409. 10.1016/j.jcps.2010.06.007
39
Madzharova V.BlockL. G.MorrinM. (2015). The cool scent of power: effects of ambient scent on consumer preferences and choice behavior. J. Market.79, 83–96. 10.1509/jm.13.0263
40
MalterM. S.HolbrookM. B.KahnB. E.ParkerJ. R.LehmannD. R. (2020). The past, present, and future of consumer research. Market. Lett. 1–13. 10.1007/s11002-020-09526-8
41
MiuraA.KobayashiT. (2016). Survey satisficing inflates stereotypical responses in. online experiment: the case of immigration study. Front. Psychol.7, 1563. 10.3389/fpsyg.2016.01563
42
MotokiK.TakahashiN.VelascoC.SpenceC. (2022). Is classical music sweeter than. jazz? Crossmodal influences of background music and taste/flavour on healthy and indulgent food preferences. Food Qual. Pref.96, 104380. 10.1016/j.foodqual.2021.104380
43
NosekB. A.EbersoleC. R.DeHavena C.MellorD. T. (2018). The preregistration revolution. Proc. Natl. Acad. Sci. U. S. A.115, 2600–2606. 10.1073/pnas.1708274114
44
O'DonnellM.Deva S.AntonoplisS.BaumS. M.Benedettia H.BrownN. D.et al. (2021). Empirical audit and review and an assessment of evidentiary value in research on the psychological consequences of scarcity. Proc. Natl. Acad. Sci. U. S. A.118, 2103313118. 10.1073/pnas.2103313118
45
Open Science Collaboration (2015). Estimating the reproducibility of psychological science. Science 349, aac4716. 10.1126/science.aac4716
46
OppenheimerD. M.MeyvisT.DavidenkoN. (2009). Instructional manipulation. checks: Detecting satisficing to increase statistical power. J. Exp. Soc. Psychol.45, 867–872. 10.1016/j.jesp.2009.03.009
47
PetitO.VelascoC.SpenceC. (2019). Digital sensory marketing: integrating new technologies into multisensory online experience. J. Interact. Market.45, 42–61. 10.1016/j.intmar.2018.07.004
48
RodríguezB.ArroyoC.ReyesL. H.Reinoso-CarvalhoF. (2021). Promoting healthier drinking habits: using sound to encourage the choice for non-alcoholic beers in E-commerce. Foods10, 2063. 10.3390/foods10092063
49
RomeroM.BiswasD. (2016). Healthy-left, unhealthy-right: can displaying healthy. items to the left (vs. right) of unhealthy items nudge healthier choices?J. Consum. Res.43, 103–112. 10.1093/jcr/ucw008
50
SarstedtM.NeubertD.BarthK. (2017). The IKEA effect. A conceptual replication. J. Market. Behav.2, 307–312. 10.1561/107.00000039
51
ShroutP. E.RodgersJ. L. (2018). Psychology, science, and knowledge construction: broadening perspectives from the replication crisis. Ann. Rev. Psychol.69, 487–510. 10.1146/annurev-psych-122216-011845
52
ShrumL. J.LowreyT. M.LunaD.LermanD. B.LiuM. (2012). Sound symbolism effects across languages: implications for global brand names. Int. J. Res. Market.29, 275–279. 10.1016/j.ijresmar.2012.03.002
53
SimmonsJ.NelsonL.SimonsohnU. (2021). Pre-registration: why and how. J. Consum. Psychol.31, 151–162. 10.1002/jcpy.1208
54
SimonsohnU. (2015). Small telescopes: detectability and the evaluation of replication results. Psychol. Sci.26, 559–569. 10.1177/0956797614567341
55
SotoC. J. (2019). How replicable are links between personality traits and consequential life outcomes? The life outcomes of personality replication project. Psychol. Sci.30, 711–727. 10.1177/0956797619831612
56
SpenceC.PuccinelliN. M.GrewalD.RoggeveenA. L. (2014). Store atmospherics: a multisensory perspective. Psychol. Market.31, 472–488. 10.1002/mar.20709
57
TuncaB.YanarE. (2020). Women's luxury products as signals to other women. J. Market. Behav.4, 227–238. 10.1561/107.00000066
58
TuncaB.ZianoI.WentingX. (2022). Super-size me: an unsuccessful preregistered replication of the effect of product size on status signaling. Mol. Pathol. 6. 10.15626/MP.2020.2538
59
VadilloM. A.GoldN.OsmanM. (2018). Searching for the bottom of the ego well: failure to uncover ego depletion in Many Labs 3. Royal Soc. Open Sci.5, 180390. 10.1098/rsos.180390
60
van't VeerA. E.Giner-SorollaR. (2016). Pre-registration in social psychology—A discussion and suggested template. J. Exp. Soc. Psychol.67, 2–12. 10.1016/j.jesp.2016.03.004
61
WangY.GriskeviciusV. (2013). Conspicuous consumption, relationships, and rivals: women's luxury products as signals to other women. J. Consum. Res.40, 834–854. 10.1086/673256
62
WörfelP.FrentzF.TautuC. (2022). Marketing comes to its senses: a bibliometric, review and integrated framework of sensory experience in marketing. Eur. J. Market.10.1108/EJM-07-2020-0510. [Epub ahead of print].
63
YorkstonE.MenonG. (2004). A sound idea: phonetic effects of brand names on consumer judgments. J. Consum. Res.31, 43–51. 10.1086/383422
64
ZhangL.AtariM.SchwarzN.NewmanE. J.AfhamiR. (2022). Conceptual. metaphors, processing fluency, and aesthetic preference. J. Exp, Soc. Psychol.98, 104247. 10.1016/j.jesp.2021.104247
65
ZwebnerY.LeeL.GoldenbergJ. (2014). The temperature premium: warm temperatures increase product valuation. J. Consum. Psychol.24, 251–259. 10.1016/j.jcps.2013.11.003
Summary
Keywords
sensory marketing, consumer psychology, replication, pre-registration, consumer behavior
Citation
Motoki K and Iseki S (2022) Evaluating replicability of ten influential research on sensory marketing. Front. Commun. 7:1048896. doi: 10.3389/fcomm.2022.1048896
Received
20 September 2022
Accepted
30 September 2022
Published
28 October 2022
Volume
7 - 2022
Edited by
Felipe Reinoso-Carvalho, University of Los Andes, Colombia
Reviewed by
Catalina Estrada-Mejia, Universidad de Los Andes, Colombia; Enrique Ter Horst, University of Los Andes, Colombia
Updates
Copyright
© 2022 Motoki and Iseki.
This is an open-access article distributed under the terms of the Creative Commons Attribution License (CC BY). The use, distribution or reproduction in other forums is permitted, provided the original author(s) and the copyright owner(s) are credited and that the original publication in this journal is cited, in accordance with accepted academic practice. No use, distribution or reproduction is permitted which does not comply with these terms.
*Correspondence: Kosuke Motoki motoki@e.u-tokyo.ac.jp
This article was submitted to Advertising and Marketing Communication, a section of the journal Frontiers in Communication
Disclaimer
All claims expressed in this article are solely those of the authors and do not necessarily represent those of their affiliated organizations, or those of the publisher, the editors and the reviewers. Any product that may be evaluated in this article or claim that may be made by its manufacturer is not guaranteed or endorsed by the publisher.