 Lucia Savadori
 Piero Ronzani1
 Daniela Di Bucci
- 1Cognitive and Experimental Economic Laboratory, Department of Economics and Management, University of Trento, Trento, Italy
- 2Department of Political Science, Luiss University, Rome, Italy
- 3National Civil Protection Department, Rome, Italy
Communicating seismic risk to individuals can be difficult for an institution because it involves providing technical and scientific information, including the low probability of an adverse event, that is not always easy to understand. One way to facilitate understanding of low probabilities is to provide comparisons with the probability of occurrence of other more familiar events. In a randomized trials experiment, we investigated the effect of providing individuals with a set of risk comparisons on their sensitivity to different levels of seismic risk (1 in 100, 1 in 1,000, and 1 in 10,000). The findings show that providing risk comparisons increased individual risk sensitivity to information about the likelihood of experiencing a seismic event. Our findings are explained by the evaluability hypothesis, which states that a single probability value is better understood if the recipient is given some reference data to evaluate it. Our results have implications for disaster risk communication, providing ways to increase risk awareness and, consequently, disaster prevention.
Introduction
The communication of scientific information about the risks associated with natural hazards is important for society (Abadie et al., 2013; Reyna, 2021). Effective communication of scientific information about risks can improve the perception and awareness of risks and, consequently, increase the likelihood that individuals will implement appropriate protection and prevention measures (Brewer et al., 2007). However, communicating scientific information about the risks associated with natural hazards might be difficult due to several cognitive barriers (Fiske and Dupree, 2014; Maier et al., 2016; van der Bles et al., 2020).
Risk messages that incorporate numbers, probabilities, or percentages are often used to communicate risk to the public (Lipkus and Hollands, 1999; Spiegelhalter et al., 2011; van der Bles et al., 2020). Despite being presented simply and clearly, many of these scientific messages fail to have the desired effect because numbers do not translate easily into adequate risk perceptions, i.e., a meaningful estimate of the degree of risk (Slovic et al., 2004; Peters et al., 2009). Risk perceptions are important because people use them to decide what actions to take, such as whether or not to engage in protective and preventive measures (Brewer et al., 2007; Burns and Slovic, 2012; Fischhoff, 2013; Dryhurst et al., 2020). Numbers, probabilities, and percentages are not automatically transformed into meaningful representations by most of us because the perceived risk is prevalently based on intuition and feelings rather than careful analysis of quantitative information (e.g., Slovic et al., 2004). This intuitive system, termed “risk as feelings,” has difficulties extracting meaning from statistical information, even when this represents the number of human beings at risk (Schwartz et al., 1997; Peters et al., 2011). Numbers themselves do not convey feelings, a phenomenon termed psychic numbing (Peters et al., 2009; Slovic, 2010). As the number departs from 1, our ability to attach emotional meaning to it diminishes. If we can feel pity for one person who suffers, we cannot multiply this pity for a 100 or a 1,000 people. Therefore, it is difficult for numbers alone to automatically translate into a risk perception judgment. Many studies have shown that some people who are better than others at handling numbers (i.e., possess a higher numerical ability) derive more precise affective meaning from numbers (Peters, 2020). Individuals will then use this affective meaning to form their perceptions of risk and make choices in the face of threats.
On the contrary, those with less numerical ability use mental heuristics and rely on emotional reactions instead of numbers' affective meaning (Peters et al., 2009). Moreover, less numerate individuals are more sensitive to narratives than information on the objective likelihood (Dieckmann et al., 2009), and they are more prone to motivated reasoning (Van Boven et al., 2019). Consequently, risk messages that incorporate numbers should be constructed in a way that helps individuals, especially those with low numerical ability, to extract a meaningful representation (Peters et al., 2009).
Conveying scientific information about risk through numbers is made even more complicated because the numerical values to be communicated are often very small (<1%). For example, risk information about natural hazards often deals with low probabilities since severe events related to natural hazards occur rarely. In laboratory experiments, it was observed that, in contrast to a high-probability condition, in which participants exhibited unimodal distributions of bids for insurance, the distribution of bids for insurance against low-probability risk was strongly bimodal. Individuals appeared to either ignore low-probability risks by offering zero or near-zero bids or worry about the risk to such an extent that they bid significantly above the expected value (Mcclelland et al., 2018). In the real world, individuals show a low demand for insurance against natural hazards, even in the presence of discounted premiums or incentives (Browne and Hoyt, 2000; Michel-Kerjan et al., 2012). This lack of risk awareness prompts one to wonder whether people are insensitive to the communication of the risk posed by rare events, such as severe events related to natural hazards, or they lack adequate risk perception for such events (Meyer et al., 2014).
Some studies have suggested that the weight granted to a given feature of the stimulus depends on how easily the value of that feature can be mapped onto an evaluative scale of good vs. bad (Hsee et al., 1999). The concept of evaluability proposed by Hsee et al. (1999) states that it is difficult for people to value an attribute in isolation without having terms of comparison with which to compare it meaningfully. Coherently, it has been shown that information within a single option can be made easier to evaluate through a number comparison process (Bateman et al., 2007; Peters et al., 2009).
Risk Comparisons
In line with the concept of evaluability, risk comparisons have been suggested to improve risk communication by putting risks in perspective (Covello et al., 1988). Providing comparative information on the probability of familiar events is generally a recommended practice to help people evaluate a single risk value (Edwards et al., 2000). For example, risk ladders are routinely used to communicate the chance of various health risks, such as cancer deaths from radon exposure (Lipkus, 2007; Keller et al., 2009). A risk ladder is a graphical risk representation showing a minimum and a maximum value for a given target risk and providing information about the corresponding risk posed by one or more familiar hazards (e.g., cigarette smoking). Risk comparisons have also been employed to communicate the risk posed by natural hazards, such as the risk of being caught in a fire (Holmes et al., 2013) and volcanic risk exposure (SAC 14 Report-available on the MVO website).
However, little evidence exists on whether risk comparisons are helpful to improve communication of risk values, and none of this has explored the context of natural hazards. For example, in a study related to the risk of a toxic spill from a chemical plant, researchers found that giving individuals not merely one comparison scenario but two scenarios scaled apart had a significant effect in improving respondent's ability to distinguish among different low-probability values (1 in 100,000, 1 in 1 million, or 1 in 10 million, per year) (Kunreuther et al., 2001). In addition, participants could readily compare probabilities when given two scenarios: a car accident in Colorado and a car accident in Arizona, with a few sentences describing each event. Similarly, comparison scenarios about car accidents and infectious diseases produced an increase in women's ability to distinguish between different prenatal risk levels (1 in 5390, 1 in 770, 1 in 110) of chromosomal anomalies of the fetus (Pighin et al., 2013). However, comparison scenarios significantly helped the highly numerate participants, whereas they did not affect the less numerate participants as much (Pighin et al., 2013). Another study on radon concentration employed a risk ladder, with or without a smoking risk comparison, and showed that the risk comparison helped individuals differentiate between risk levels (19 Bq/m3, 220 Bq/m3, and 1,200 Bq/m3 of radon concentration in an area) and that the improvement was more pronounced for less numerate individuals (Keller et al., 2009).
This evidence shows that risk comparisons might help improve individual risk sensitivity (i.e., whether different levels of risk evoke different levels of perceived risk), but none of these have addressed seismic risk perception. Being informed and aware of the possibility of an earthquake event is a fundamental step to be able to plan adequate prevention and protection actions, both at the level of the individual citizen (e.g., reinforcing the building against the earthquake) and at the level of the local governmental institution (e.g., defining a detailed emergency plan). Thus, it is crucial to test whether comparison terms are viable for improving seismic risk sensitivity.
However, using comparison risks to help communicate a specific risk could also have potentially detrimental effects. Researchers have claimed that risk comparisons might become counterproductive if the public suspects that they are used to minimize or magnify a problem (Covello et al., 1988; Roth et al., 1990; Johnson, 2004). More importantly, providing comparison risks inevitably involves providing individuals with additional probability information. For example, to communicate earthquake risk, one might compare it to the possibility of having a car accident. One might ask whether providing additional pieces of probability information does not make it even more difficult for people to appreciate the target risk.
Furthermore, providing individuals with more information with a negative valence, such as a car accident, might also increase people's perception of risk, thereby biasing judgment in a predictable direction. This might be even more true if people are provided with multiple pieces of information, such as when they are provided multiple risk comparisons instead of only one. According to risk theories, the degree of perceived risk is derived from the affective meaning one holds in mind (Finucane et al., 2000), and this affective meaning is constructed through direct and indirect experiences with the hazard (Slovic et al., 2004). It is, therefore, possible that providing additional negative pieces of information inflates individual perceived risk increasing individual worry about seismic risk without increasing risk sensitivity. Thus, biasing risk perception in a predictable direction is a potential counterproductive consequence of employing multiple risk comparisons in risk communication that deserves attention.
On the contrary, according to a different line of research, providing comparison risks that are negative in valence could even improve statistical information processing. Negative comparison scenarios could stimulate an emotional response in individuals. Emotional stimuli attract more attention and are processed more rapidly and automatically than less emotional stimuli (Pratto and John, 1991; Bargh et al., 1992; Anderson and Phelps, 2001). Also, strong affective reactions may increase analytic processing and reduce bias in judgment (Lench and Bench, 2015). Furthermore, there is also evidence that valence similarity can trigger a more efficient affective evaluation of stimuli, a process known as affective priming. For example, people evaluate target words as good or bad more quickly when preceded by words of similar valence than when primed by words of opposite valence (Fazio et al., 1986).
To conclude, providing multiple risk comparisons to improve seismic risk communication might have both counterproductive and beneficial effects on risk communication, but both deserve attention and should be empirically tested before using this intervention in public communication of science.
Overview
In the present study, we tested whether providing respondents with multiple negative risk comparisons affected their earthquake perceived risk sensitivity (i.e., whether different levels of seismic risk evoke different levels of perceived seismic risk) compared to not providing any risk comparisons. It has been pointed out (Keller et al., 2009) that while it is not possible to determine whether certain risk information evokes the “true” level of concern, it is nevertheless possible to test whether different levels of risk evoke different levels of perceived risk, i.e., risk sensitivity. Consistent with previous studies (Kunreuther et al., 2001; Pighin et al., 2013), we predicted that comparison with other risks would improve risk sensitivity for different levels of risk (i.e., the perceived difference between a low, medium, and high magnitude of a risk). This prediction is consistent with findings showing that negative emotions are often associated with increased attention and processing capacities (Pratto and John, 1991; Bargh et al., 1992; Anderson and Phelps, 2001). Therefore, providing multiple risk comparisons negative in valence is predicted to increase statistical information processing, promoting better risk information assessment, thus higher risk sensitivity. Additionally, with our paradigm, we also explored whether providing multiple negative risk comparisons, albeit improving risk sensitivity, might also have counterproductive effects such as systematically increasing perceived risk (Finucane et al., 2000; Slovic et al., 2007).
To conduct our study, we provided individuals with realistic information about the probability of earthquake occurrence. In particular, we explored risk perception sensitivity referred to a short-term seismic hazard in time frames of days and weeks, known in the literature as Operational Earthquake Forecasting (Marzocchi et al., 2014; Field et al., 2016). This kind of seismic hazard varies in time according to earthquake occurrence and is typically characterized by very low values, for instance, in the order of 1 × 10⁻³ - 1 × 10⁻⁴. Communicating such low-probability forecasts to the public would be helpful to increase risk awareness and promote the adoption of self-protective measures; hence it could be of potential interest for civil protection authorities (Jordan et al., 2011). However, before implementing such communication channels, a precautionary exploration is needed to investigate how the public perceives these low probability values and how their communication could be enhanced.
We varied the message so that half of the participants received only the risk information and the other half received the same risk information plus additional negative risk comparisons. The magnitude of the probability also varied between low, medium, and high. Thus, each participant received information about only one level of probability. Finally, we tested if participants perceived the three probability levels as significantly different from each other (i.e., risk sensitivity) both in the baseline condition (no risk comparisons) and the experimental condition (with negative risk comparisons).
As a further aim, we also measured the number of protective behaviors an individual intended to take and the perceived communicative intention. Finally, we measured individual subjective numeracy skills and self-reported knowledge about seismic risk to test whether the intervention was beneficial for highly and less numerate individuals and for highly and less knowledgeable individuals. Previous studies showed that risk comparisons might be more helpful for highly numerate individuals than for less numerate ones (Pighin et al., 2013), whereas others found that they were beneficial for less numerate individuals (Keller et al., 2009).
Methods
Participants
A total of 562 native English speakers (65% females) living in the U.K. participated in the study. The participants' age ranged between 18 and 74 years, with an average of 37 years (SD = 13.0). The majority of the sample (80%) were non-students. All were residing in the U.K. Household size was as follows: 12% one-member, 31% two-members, 22% three-members, 22% four-members, the remaining 12% were composed of five or more members. The distribution of education was as follows: 1% had no formal education, 13% had a secondary school degree, 33% had a college degree, 36% had an undergraduate degree, 14% had a graduate degree, 2% had a master or Ph.D., and 2% did not report their level of education. Forty-eight percent of the participants had children. On a range from 1 (very low) to 10 (very high), self-reported socioeconomic status was on average 5.22 (SD = 1.57). Forty-four percent of the sample had an income ranging from £20,000 to £49,999 a year. Ninety-one percent of the sample had never experienced an earthquake in their life, 7% of the sample experienced it once, and 2% of the sample experienced it more than once.
Design
A 3 (probability level: 1 in 10,000, 1 in 1,000, 1 in 100) x 2 (Risk comparisons: no comparisons, negative comparisons) between-subjects design was adopted by manipulating the type of information provided to participants. Participants were randomly assigned to each experimental condition.
Materials and Procedure
The data was collected on December 22, 2018. Ethical approval was not requested, given the non-interventional nature of the study. Participants were informed about the study in advance and gave their consent to take part in the study by agreeing to participate in the online web survey. Participation was anonymous and rewarded through the Prolific (https://www.prolific.co/) recruitment platform. All participants were given the following introductory information:
“The following information is useful to understand what will be communicated to you on the next page: The Mercalli intensity scale1 measures the intensity of earthquakes. It identifies 12 degrees of intensity, ranging from “imperceptible” to “devastating.” The 7th degree is defined as a “very strong” earthquake causing the following:
- damage negligible in buildings of good design and construction;
- slight to moderate damage in well-built ordinary structures;
- considerable damage in poorly built or badly designed structures;
- some chimneys broken.
Imagine that one day you receive information on your seismic risk. The information comes from a scientific government agency that you trust a lot. The agency has prepared an assessment of the seismic risk based on probabilistic models, considering your personal risk and the place where you live. The conclusion of this assessment is that:”
Participants then read one of three scenarios as shown by the probability specified in brackets []:
“Your chance of experiencing an earthquake of the 7th degree of the Mercalli intensity scale, or higher, in the next seven days is [1 in 100, 1 in 1000, 1 in 10.000].”
According to the experimental condition, participants were either given no risk comparisons or presented with negative risk comparisons purposely created for the study. The negative risk comparisons are presented in Table 1. The risk comparisons were chosen to represent true values as much as possible. Also, the probability values of the comparison scenarios were purposely chosen to be symmetrically spaced around the three experimental probability values provided to participants (i.e., 1 in 10,000, 1 in 1,000, and 1 in 100). Risk comparisons, indeed, ranged from 1 in 50 (lower bound) to 1 in 50,000 (upper bound). The intent was to build a ladder onto which people could map the given level of probability.
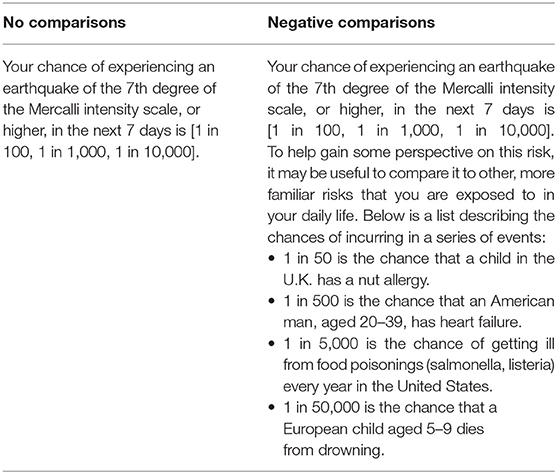
Table 1. Information provided to participants in the two experimental conditions.
After reading the scenario, each subject answered a series of questions on risk perception, communicative intentions, behavioral intentions, subjective numeracy, self-reported knowledge, and demographic information.
Measures
Risk Perception
We used multiple items to assess risk perception (see Table 2). Four items covered the affective component of risk perception (Peters and Slovic, 2007; Ferrer et al., 2016) by asking about worry and risk perception in general. Items were readapted from previous sources (see Table 2). Scale reliability for the four items was satisfactory (Cronbach alpha = 0.893), and the composite mean score of perceived risk had higher values reflecting a higher perceived risk.
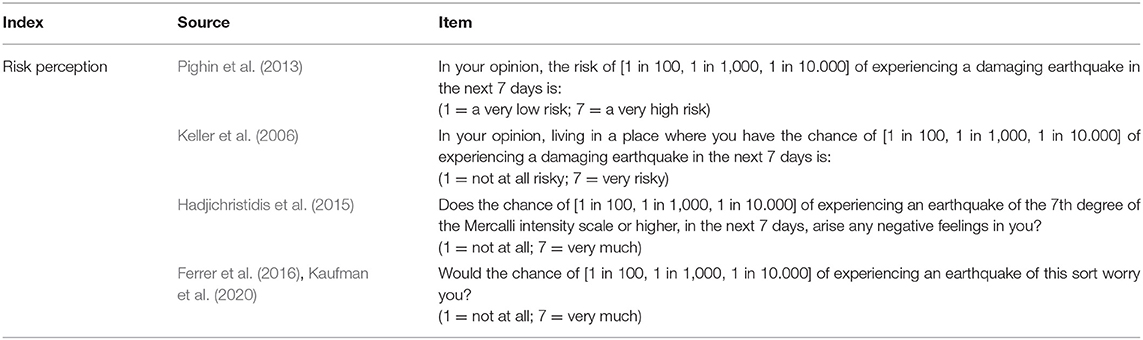
Table 2. Items used in the questionnaire to measure earthquake risk perception.
Communicative Intention
To measure perceived communicative intentions, we used a question asking for one of three possible intentions by the government agency. The possible responses were: (a) minimize the risk, trying to convince me that the risk is smaller than I think; (b) neither minimize nor maximize the risk, just trying to inform me; (c) maximize the risk, trying to convince me that the risk is greater than I think.
Behavioral Intentions
To measure individual behavioral intentions associated with the threat, we asked: “If you were told that you have the chance of [1 in 100, 1 in 1000, 1 in 10.000] of experiencing an earthquake of this sort in the next 7 days, what would you do?” Then respondents were asked to tick all that applied from a list of 10 possible answers (see Table 3).
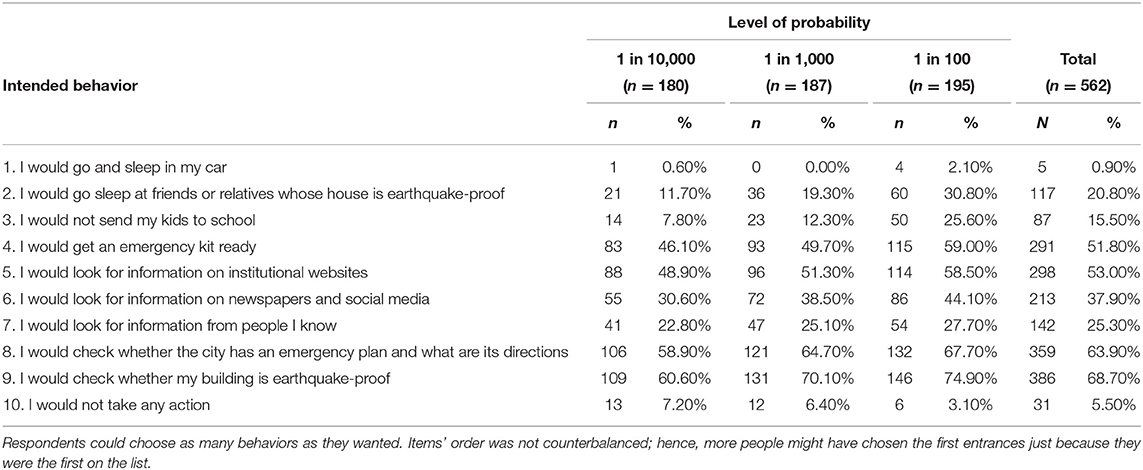
Table 3. Frequency of times that each action was chosen by respondents for each level of probability.
Subjective Numeracy
Individual self-reported ability to deal with probability information was assessed through the three-items subjective numeracy scale (McNaughton et al., 2011). Answers were provided on a 7-points rating scale, and a composite mean score was computed (Cronbach alpha = 0.802) with higher values reflecting higher numeracy.
Self-Reported Knowledge
Individual self-reported knowledge of seismic risk was measured through a set of seven questions (see Table 4 for full wording of the questions). The questions were built in order to capture self-reported individual interest and knowledge of the seismic phenomena. Many of the questions had a yes and no answer. To compute a composite measure, we summed the answers so that higher scores on the scale reflected a higher subjective knowledge of seismic risk. Scores on this variable could range from 0 to 10.
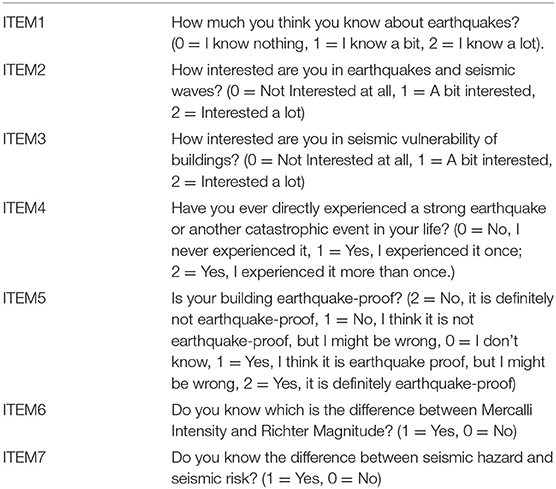
Table 4. Questions used to measure self-reported knowledge.
Demographic Information
A set of demographic characteristics was taken from the Prolific panel (https://www.prolific.co/): age, student status, country of birth, subjective socioeconomic status, income, household size, sex, nationality, current country of residence, first language, and having children or not. Subjective socioeconomic status (SES) was measured with the MacArthur Scale of Subjective Social Status (Adler et al., 2008), which asks respondents to choose a number from 1 to 10 representing where they stand in society, with 1 representing the bottom (those who are worst off) and 10 representing the top (those who are best off).
Results
Seismic Risk Perception
We investigated perceptions of seismic risk by asking participants about their worry and perceived risk of experiencing a damaging earthquake as a result of being informed about the seismic risk they were exposed to. As shown in Figure 1, participants assessed, on average, seismic risk to be relatively moderate (M = 3.73; SD = 1.48; min = 1; max = 7). A higher perceived seismic risk was significantly correlated with being younger (r = −0.121; p = 0.004). Higher perceived seismic risk was also significantly correlated with possessing more knowledge on seismic risk (r = 0.157; p < 0.001), but it was not correlated with having more or less numerical skills (r = 0.01; p = 0.808). Higher perceived seismic risk was also significantly correlated with interpreting the scientific information as having the communicative intention to maximize the risk (r = 0.125; p = 0.003). Finally, higher perceived seismic risk was significantly correlated with intending to engage more in all types of protective behaviors (r = 0.441; p < 0.001), especially getting an emergency kit ready (r =0.327; p < 0.001), sleeping over at friends or relatives whose house is earthquake-proof (r = 0.322; p < 0.001), but also checking whether the building where they lived was earthquake-proof (r = 0.294; p < 0.001), and checking whether the city had an emergency plan and what were its directions (r = 0.286; p < 0.001). Coherently, a higher perceived seismic risk was negatively correlated with avoiding taking any action (r = −0.237; p < 0.001). Moreover, we observed limited effects of demographic variables on risk perception. Perceived risk was not affected by gender, education, and socioeconomic status.
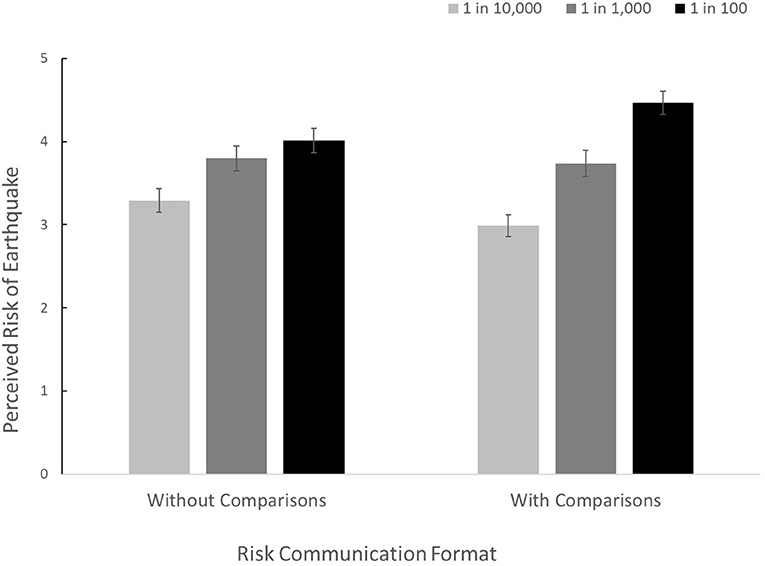
Figure 1. Mean perceived risk of earthquake as a function of the level of probability and the risk communication format.
We next assessed the extent to which providing risk comparisons influenced participants' seismic risk sensitivity (i.e., whether different levels of risk evoke different levels of perceived risk). Data on perceived risk were submitted to a 3 (probability level: 1 in 10,000, 1 in 1,000, 1 in 100) × 2 (type of risk comparisons: no comparisons, negative comparisons) analysis of variance (ANOVA). Analyses were performed using IBM SPSS Statistics for Windows, Version 26.0.
The analysis showed a significant interaction effect between the probability level and risk comparisons, F(2,556) = 3.510, p = 0.031, = 0.012. As shown in Figure 1, providing individuals with risk comparisons significantly improved their seismic risk sensitivity (i.e., whether different levels of risk evoke different levels of perceived risk). This was confirmed by first-order simple effects showing that changing the level of probability in the message had a significant effect on perceived seismic risk when no comparison risks were provided, F(2,556) = 6.62, p < 0.001, = 0.023, but even a greater effect when negative risk comparisons were provided, F(2,556) = 24.48, p < 0.001, = 0.081. As revealed by pairwise comparisons (with Bonferroni correction) of the different levels of probability, when no risk comparisons were provided, respondents did not perceive a 1 in 100 probability of experiencing an earthquake as significantly riskier than a 1 in 1,000 probability (p = 0.839), but they perceived a 1 in 1,000 as significantly riskier than a 1 in 10,000 probability (p = 0.042). In contrast, when negative risk comparisons were provided, respondents perceived both a 1 in 100 probability as significantly riskier than a 1 in 1,000 (p = 0.002) and this probability as riskier than a 1 in 10,000 chance of experiencing an earthquake (p = 0.001).
The 3 × 2 ANOVA also yielded a significant main effect of the probability level manipulation, F(2,556) = 28.41, p < 0.001, = 0.093, indicating that perceived risk changed depending on the level of probability that participants read in their risk communication. As shown in Figure 1 and coherently with our expectations, communicating a higher probability (i.e., 1 in 100) increased perceived seismic risk, whereas communicating a lower probability (i.e., 1 in 10,000) decreased perceived seismic risk. Participants' risk perceptions, in general, increased coherently with the level of probability. Post hoc Tukey HSD tests on the level of probability factor showed that each level of the factor was significantly different from each other (p < 0.001): the 1 in 100 probability yielded higher perceived risk (M = 4.22) than the 1 in 1,000 probability (M = 3.77) and, in turn, this level yielded a higher perceived risk than the 1 in 10,000 (M = 3.14).
Interestingly, the risk comparison manipulation had no main effect on perceived risk, F(1,556) = 0.059, p = 0.808, < 0.001, indicating that providing negative risk comparisons did not systematically bias overall judgment by increasing perceived seismic risk compared to not providing any risk comparison.
Because perceived seismic risk was found to be significantly negatively correlated with age in our sample, we checked the potential confounding effect of age by adding it as a covariate in the 3 × 2 ANOVA. The analysis confirmed a significant main effect of age on perceived risk, F(1,553) = 8.58, p = 0.004, = 0.015, showing that younger individuals perceived higher seismic risk than older ones. Controlling for age, however, did not influence our main results. Indeed, the probability level still yielded a significant main effect on perceived risk, F(2,553) = 28.31, p < 0.001, = 0.093 and the probability level still significantly interacted with risk comparisons, F(2,553) = 3.58, p = 0.028, = 0.013, even to a greater extent. These results show that providing respondents with risk comparisons helped them distinguish between different probability levels (1 in 100, 1 in 10,000, and 1 in 10,000), more than not providing them with any risk comparison information. Moreover, despite improving their risk sensitivity, we found no evidence that negative risk comparisons could systematically bias respondents' perceived risk.
In contrast to earlier studies' findings, the participants' numerical ability had no significant impact on moderating the influence of comparative scenarios on risk sensitivity (see Supplementary Material 1). Furthermore, the same null result was obtained for seismic knowledge (see Supplementary Material 2). Therefore, the comparison scenarios helped improve participants' risk sensitivity, regardless of their numerical skills and knowledge of seismic risk. Finally, most respondents provided with comparison scenarios reported that the communicative intention of the institution was neither to minimize nor to maximize the risk but just to try to inform (see Supplementary Material 3). This result seems to disconfirm the belief that the comparison scenarios can be experienced as an attempt by the institution to persuade that the risk is high or low.
Protective Behavioral Intentions
Each respondent could pick from a list of protective actions all those behaviors that they thought they would engage in, given the level of earthquake risk provided to them. We recoded eight participants' responses because they ticked the last option, which said: “I would not take any action,” and they also ticked one or more of the other options, which described some actions. This misunderstanding probably occurred because some respondents thought that actions, such as searching for information, did not count as behaviors. We, therefore, recoded them as not ticking the last option.
The behaviors that respondents indicated they would engage in are shown in Table 3. Most of the respondents choose “I would check if my building is earthquake-proof” (69%), followed by “I would check whether the city has an emergency plan and what are its directions” (64%), “I would look for information on institutional websites” (53%), and “I would get an emergency kit ready” (52%). Whereas, only a few reported “I would go and sleep in my car” (1%), “I would not send my kids to school” (16%), or “I would go sleep at friends or relatives' house” (21%), perhaps because very few have had direct experience of a strong earthquake.
We next computed a composite measure for each individual by summing all behaviors. The new variable, the number of preventive or protective intended behaviors, could range from 0 (= would take no action) to 9 (= would engage in nine behaviors out of 9). The mean number of behaviors was 3.46 (SD = 2.11).
Higher intention to protect against a possible earthquake was significantly correlated with being younger (r = −0.140; p = 0.001) but not with any other demographic variable. As reported before, it was correlated with a higher perceived risk and a higher knowledge of seismic risk.
We next assessed the extent to which providing risk comparisons induced participants to behave differently, either by protecting themselves more or less, for the three levels of risk. We submitted the number of behaviors to a 3 (probability level: 1 in 10,000, 1 in 1,000, 1 in 100) × 2 (type of risk comparisons: no comparisons, negative comparisons) ANOVA. The two-way interaction term between risk levels and type of risk comparisons, however, was not significant, F(2,556) = 0.86, p = 0.422, = 0.003, showing that providing negative comparisons neither improved nor decreased the intention to engage in protective behaviors differently for different risk levels. The analysis of the dependent variable, however, yielded a significant main effect for the probability level, F(1,556) = 11.62, p < 0.001, = 0.040, indicating that different probability levels evoked a different number of preventive intended behaviors. The main effect for the type of comparison manipulation was not significant, F(1,556) = 0.74, p = 0.389, = 0.001, indicating that providing negative risk comparison did not systematically increase nor decrease the number of intended behaviors.
Discussion
The dissemination of civil protection knowledge and culture in order to increase community resilience and adoption by citizens of conscious behavior and self-protection measures is among the institutional activities of civil protection. Institutional activities also include the dissemination to the population of information on the risk scenarios and related rules of conduct, as well as on civil protection planning (Legislative Decree 1/2018, 2018).
Effective risk communication should stimulate an appropriate behavioral response (Maier et al., 2016; van der Bles et al., 2020; Reyna, 2021). However, to induce behavior, risk communication must first be understood. Understanding risk information is difficult, especially when it conveys very low probabilities (Lipkus et al., 2001). While it is not possible to directly measure risk “understanding,” i.e., determine whether certain risk information evokes the “true” level of concern, it is nevertheless possible to test whether different probability levels of risk evoke different levels of perceived risk (i.e., risk sensitivity). In line with previous evidence (Kunreuther et al., 2001; Keller et al., 2009; Keller, 2011; Pighin et al., 2013), we predicted that providing risk comparisons was a means of increasing sensitivity to perceived seismic risk.
In the present study, we tested whether providing risk comparisons could help people distinguish between different levels of earthquake risk. Confirming previous studies in other domains (Kunreuther et al., 2001; Keller et al., 2009; Keller, 2011; Pighin et al., 2013), our results indicate that presenting individuals with risk comparisons significantly improved their perceived risk sensitivity in the seismic risk domain.
More interestingly, risk comparisons did not increase the overall perceived risk, even if they provided additional negative information. This result means that risk comparisons improved risk sensitivity without biasing it in a particular direction. Therefore, respondents were not more alarmed when given negative risk comparisons than when they were not given any risk comparison, but they understood better the information in the former case. The discovery that providing negative risk comparisons improves risk sensitivity without producing an alarming reaction in individuals is an important finding that further endorses using this type of intervention to improve risk sensitivity.
In our study, providing risk comparisons improved perceived risk sensitivity. This occurred, presumably, because comparisons helped individuals map the original probability value onto an evaluative scale of good vs. bad, as suggested by the evaluability process (Hsee, 1996). Some literature (Fazio et al., 1986) also suggests that the mapping of a number onto a scale is easier if the target risk (e.g., the probability of experiencing an earthquake) shares the same emotional valence (i.e., negative valence) with the risk comparisons. In our experiment, indeed, the target risk was negative in valence (risk of an earthquake), and the comparison risks were seemingly negative in valence. This matching might have contributed to our results, but our study was not designed to test for valence effects. Another explanation that we cannot reject is that negative risk comparisons were effective because they heightened thoughtful information processing of probability information (Pratto and John, 1991; Bargh et al., 1992; Anderson and Phelps, 2001; Pighin et al., 2011). However, it was not within the scope of our study to address the explanatory process for this effect, and future studies should try to test these different alternative explanations.
Our study has a number of limitations. The first one is related to the sample, which is a convenience sample and thus not representative of the population. Although convenience samples are typically used in randomized control trials such as ours, our final sample is likely younger, more educated, and less at-risk than the average population. This may be a limitation of the study that needs to be considered. It is possible, for example, that the ameliorative effect observed with the comparison scenarios may depend on the demographic characteristics of the sample. Younger and more educated people might benefit more from interventions such as the one we tested in this study than older and less educated people. Although we controlled for this with covariate analyses, this might still be the case. Therefore, it would be desirable to replicate the study on a representative population sample or a sample of older, less educated people. The low level of seismic hazard in the participants' areas of residence could also affect the external validity of the results. Few people in our sample had had actual earthquake experience. It is possible to hypothesize that an intervention such as the one tested in this study might have a more negligible effect if conducted on a population at higher risk of earthquakes and, therefore, more risk-aware.
Another limitation is related to the procedure used in the study. We cannot exclude that the ameliorative effect of comparison scenarios on risk communication is limited to situations where individuals are explicitly asked to focus their attention on seismic risk, as in our study. It could be that when individuals are not alarmed or made explicitly aware of the risk, comparison scenarios do not make any difference. Even if we showed that providing extra information (negative risk comparisons) did not systematically increase concern for seismic risk, it is crucial to find ways to increase people's risk awareness when there is low attention and concern for such a natural hazard.
In addition, we did not test whether the effect is replicated even with positive scenarios. The negative valence of the comparison scenarios could be another reason why they succeeded. However, while convincing, this explanation is just theoretical. In order to be more confident about this effect, more research should be done that takes into account the valence of the information (positive vs. negative).
A final observation concerns the familiarity with the risks used in the comparison scenarios. It is common practice to attribute the effectiveness of comparison scenarios at least in part to the fact that they involve hazards people are most familiar with. It is safe to assume that, in this study, the effect may have been facilitated by the high familiarity with the comparison risks. The hazards used in the comparison scenarios (i.e., nut allergy, heart failure, food poisoning, and drowning) are situations with which people have had at least indirect experience through the media, whereas the risk of an earthquake in the short term is less familiar because it is not usually communicated to the public. However, it would be helpful to measure the degree of familiarity with the hazard in future studies to generate statistical evidence that the effect is also mediated by familiarity. The implications of the findings from this study suggest that providing individuals with risk comparisons is a good way of improving the communication of risk and (hopefully) the adoption of protective behaviors, confirming previous empirical evidence and theoretical suggestions (Covello et al., 1988; Edwards et al., 2000; Kunreuther et al., 2001; Keller et al., 2009; Pighin et al., 2013). Thus, in general, the results of our study should be taken into account when considering how to communicate scientific risk information. In particular, providing negative risk comparisons seems a good recommendation for institutions dealing with risk communication.
Concluding, this study provides evidence of the impact of giving individuals a series of risk comparisons to evaluate a target risk to improve individuals' risk sensitivity to low probabilities. Improving such sensitivity is important to allow individuals to make meaningful evaluations of risk information and more informed decisions regarding preparedness and preventive actions toward natural hazards.
Data Availability Statement
The raw data supporting the conclusions of this article will be made available by the authors, without undue reservation.
Ethics Statement
Ethical review and approval was not required for the study on human participants in accordance with the local legislation and institutional requirements. Written informed consent for participation was not required for this study in accordance with the national legislation and the institutional requirements.
Author Contributions
LS and PR collected and analyzed the data. All authors designed the study, interpreted the results, and contributed to the writing of the manuscript.
Funding
Funding for publication of the present manuscript was received from the LS institution (Department of Economics and Management, University of Trento). Data collection was partly funded by INGV (Instituto Nazionale di Geofisica e Vulcanologia).
Conflict of Interest
The authors declare that the research was conducted in the absence of any commercial or financial relationships that could be construed as a potential conflict of interest.
Publisher's Note
All claims expressed in this article are solely those of the authors and do not necessarily represent those of their affiliated organizations, or those of the publisher, the editors and the reviewers. Any product that may be evaluated in this article, or claim that may be made by its manufacturer, is not guaranteed or endorsed by the publisher.
Supplementary Material
The Supplementary Material for this article can be found online at: https://www.frontiersin.org/articles/10.3389/fcomm.2022.743172/full#supplementary-material
Footnotes
1. ^It must be noted that the intensity scales commonly used to measure seismic risk are diverse. The Mercalli-Cancani-Sieberg MCS scale (Sieberg, 1923) and the Mercalli Modified MM scale (Wood and Neumann, 1931), which both consist of 12 degrees, are an evolution of the original Mercalli scale (Mercalli, 1902). The information provided in the questionnaire comes from the Mercalli-Cancani-Sieberg intensity scale, but to simplify the narrative, we preferred to refer to the intensity scale simply as Mercalli scale.
References
Abadie, M., Waroquier, L., and Terrier, P. (2013). Gist memory in the unconscious-thought effect. Psychol. Sci. 24, 1253–1259. doi: 10.1177/0956797612470958
Adler, N., Singh-Manoux, A., Schwartz, J., Stewart, J., Matthews, K., and Marmot, M. G. (2008). Social status and health: A comparison of British civil servants in Whitehall-II with European- and African-Americans in CARDIA. Soc. Sci. Med. 66, 1034–1045. doi: 10.1016/j.socscimed.2007.11.031
Anderson, A. K., and Phelps, E. A. (2001). Lesions of the human amygdala impair enhanced perception of emotionally salient events. Nature 411, 305–309. doi: 10.1038/35077083
Bargh, J. A., Chaiken, S., Govender, R., and Pratto, F. (1992). The generality of the automatic attitude activation effect. J. Pers. Soc. Psychol. 62, 893–912. doi: 10.1037/0022-3514.62.6.893
Bateman, I., Dent, S., Peters, E., Slovic, P., and Starmer, C. (2007). The affect heuristic and the attractiveness of simple gambles. J. Behav. Decis. Mak. 20, 365–380. doi: 10.1002/bdm.558
Brewer, N. T., Chapman, G. B., Gibbons, F. X., Gerrard, M., McCaul, K. D., and Weinstein, N. D. (2007). Meta-analysis of the relationship between risk perception and health behavior: The example of vaccination. Health Psychol. 26, 136–145. doi: 10.1037/0278-6133.26.2.136
Browne, M. J., and Hoyt, R. E. (2000). The demand for flood insurance: empirical evidence. J. Risk Uncertain. 20, 3–291. doi: 10.1023/A:1007823631497
Burns, W. J., and Slovic, P. (2012). Risk perception and behaviors: anticipating and responding to crises. Risk Analysis 32, 579–582. doi: 10.1111/j.1539-6924.2012.01791.x
Covello, V. T., Sandman, P. M., and Slovic, P. (1988). Risk Communication, Risk Statistics, and Risk Comparisons: A Manual for Plant Managers. Washington, DC: Chemical Manufacturers Association.
Dieckmann, N. F., Slovic, P., and Peters, E. M. (2009). The use of narrative evidence and explicit likelihood by decision makers varying in numeracy. Risk Analysis 29, 1473–1488. doi: 10.1111/j.1539-6924.2009.01279.x
Dryhurst, S., Schneider, C. R., Kerr, J., Freeman, A. L. J., Recchia, G., van der Bles, A. M., et al. (2020). Risk perceptions of COVID-19 around the world. J. Risk Res. 2020, 1–13. doi: 10.1080/13669877.2020.1758193
Edwards, A., Hood, K., Matthews, E., Russell, D., Russell, I., Barker, J., et al. (2000). The effectiveness of one-to-one risk-communication interventions in health care. Med. Decision Making 20, 290–297. doi: 10.1177/0272989X0002000305
Fazio, R. H., Sanbonmatsu, D. M., Powell, M. C., and Kardes, F. R. (1986). On the automatic activation of attitudes. J. Pers. Soc. Psychol. 50, 229–238. doi: 10.1037/0022-3514.50.2.229
Ferrer, R. A., Klein, W. M. P., Persoskie, A., Avishai-Yitshak, A., and Sheeran, P. (2016). The tripartite model of risk perception (TRIRISK): distinguishing deliberative, affective, and experiential components of perceived risk. Ann. Behav. Med. 50, 653–663. doi: 10.1007/s12160-016-9790-z
Field, E. H., Jordan, T. H., Jones, L. M., Michael, A. J., Blanpied, M. L., Abrahamson, N., et al. (2016). The potential uses of operational earthquake forecasting. Seismol. Res. Lett. 87, 313–322. doi: 10.1785/0220150174
Finucane, M. L., Alhakami, A. S., Slovic, P., and Johnson, S. M. (2000). The affect heuristic in judgments of risks and benefits. J. Behav. Decis. Mak. 13, 1–17. doi: 10.1002/(SICI)1099-0771(200001/03)13:1<1::AID-BDM333>3.0.CO;2-S
Fischhoff, B.. (2013). Risk Analysis and Human behavior. Risk Analysis and Human Behavior. Oxford: Oxford University Press. doi: 10.4324/9780203140710
Fiske, S. T., and Dupree, C. (2014). Gaining trust as well as respect in communicating to motivated audiences about science topics. Proc. Natl. Acad. Sci. U.S.A. 111, 13593–13597. doi: 10.1073/pnas.1317505111
Hadjichristidis, C., Geipel, J., and Savadori, L. (2015). The effect of foreign language in judgments of risk and benefit: The role of affect. J. Experi. Psychol. Appl. 21, 117–129. doi: 10.1037/xap0000044
Holmes, T. P., González-Cabán, A., Loomis, J., and Sánchez, J. (2013). The effects of personal experience on choice-based preferences for wildfire protection programs. Int. J. Wildland Fire 22, 234. doi: 10.1071/WF11182
Hsee, C. K.. (1996). The evaluability hypothesis: An explanation for preference reversals between joint and separate evaluations of alternatives. Organ. Behav. Hum. Decis. Process. 67, 247–257. doi: 10.1006/obhd.1996.0077
Hsee, C. K., Blount, S., Loewenstein, G. F., and Bazerman, M. H. (1999). Preference reversals between joint and separate evaluations of options: A review and theoretical analysis. Psychol. Bull. 125, 576–590. doi: 10.1037/0033-2909.125.5.576
Johnson, B. B.. (2004). Risk comparisons, conflict, and risk acceptability claims. Risk Analysis 24, 131–145. doi: 10.1111/j.0272-4332.2004.00417.x
Jordan, T. H., Chen, Y. T., Gasparini, P., Madariaga, R., Main, I., Marzocchi, W., et al. (2011). Operational earthquake forecasting: State of knowledge and guidelines for utilization. Ann. Geophys. 54, 319–391. doi: 10.4401/ag-5350
Kaufman, A. R., Twesten, J. E., Suls, J., McCaul, K. D., Ostroff, J. S., Ferrer, R. A., et al. (2020). Measuring cigarette smoking risk perceptions. Nicotine Tobacco Res. 22, 1937–1945. doi: 10.1093/ntr/ntz213
Keller, C.. (2011). Using a familiar risk comparison within a risk ladder to improve risk understanding by low numerates: a study of visual attention. Risk Analysis 31, 1043–1054. doi: 10.1111/j.1539-6924.2010.01577.x
Keller, C., Siegrist, M., and Gutscher, H. (2006). The role of the affect and availability heuristics in risk communication. Risk Analysis 26, 631–639. doi: 10.1111/j.1539-6924.2006.00773.x
Keller, C., Siegrist, M., and Visschers, V. (2009). Effect of risk ladder format on risk perception in high- and low-numerate individuals. Risk Analysis 29, 1255–1264. doi: 10.1111/j.1539-6924.2009.01261.x
Kunreuther, H., Novemsky, N., and Kahneman, D. (2001). Making low probabilities useful. J. Risk Uncertain. 23, 103–120. doi: 10.1023/A:1011111601406
Legislative Decree 1/2018 (2018). Codice della Protezione Civile. Available online at: https://www.protezionecivile.gov.it/en/normativa/decreto-legislativo-n-1-del-2-gennaio-2018--codice-della-protezione-civile (accessed July 16, 2021).
Lench, H. C., and Bench, S. W. (2015). Strength of affective reaction as a signal to think carefully. Cogn. Emot. 29, 220–235. doi: 10.1080/02699931.2014.904223
Lipkus, I. M. (2007). Numeric, verbal, and visual formats of conveying health risks: suggested best practices and future recommendations. Med. Decision Making 27, 696–713. doi: 10.1177/0272989X07307271
Lipkus, I. M., and Hollands, J. G. (1999). The visual communication of risk. J. Natl. Cancer Inst. Monographs 1999, 149–163. doi: 10.1093/oxfordjournals.jncimonographs.a024191
Lipkus, I. M., Samsa, G., and Rimer, B. K. (2001). General performance on a numeracy scale among highly educated samples. Med. Decision Making 21, 37–44. doi: 10.1177/0272989X0102100105
Maier, M., Milde, J., Post, S., Günther, L., Ruhrmann, G., and Barkela, B. (2016). Communicating scientific evidence: Scientists', journalists' and audiences' expectations and evaluations regarding the representation of scientific uncertainty. Communications 41, 239–264. doi: 10.1515/commun-2016-0010
Marzocchi, W., Lombardi, A. M., and Casarotti, E. (2014). The establishment of an operational earthquake forecasting system in Italy. Seismol. Res. Lett. 85, 961–969. doi: 10.1785/0220130219
Mcclelland, G. H., Schulze, W. D., and Coursey, D. L. (2018). Insurance for low-probability hazards: A bimodal response to Unlikely Events. Experi. Environ. Econ. 1, 257–278. doi: 10.1007/978-94-011-2192-7_7
McNaughton, C., Wallston, K. A., Rothman, R. L., Marcovitz, D. E., and Storrow, A. B. (2011). Short, subjective measures of numeracy and general health literacy in an adult emergency department. Acad. Emerg. Med. 18, 1148–1155. doi: 10.1111/j.1553-2712.2011.01210.x
Mercalli, G.. (1902). Sulle modificazioni proposte alla scala sismica De Rossi-Forel. Bollettino Della Società Sismologica Italiana 8, 184–191.
Meyer, R. J., Baker, J., Broad, K., Czajkowski, J., Orlove, B., Meyer, R. J., et al. (2014). The dynamics of hurricane risk perception: Real-time evidence from the 2012 Atlantic hurricane season. Bull. Am. Meteorol. Soc. 95, 1389–1404. doi: 10.1175/BAMS-D-12-00218.1
Michel-Kerjan, E., Lemoyne de Forges, S., and Kunreuther, H. (2012). Policy tenure under the U.S. National Flood Insurance Program (NFIP). Risk Analysis 32, 644–658. doi: 10.1111/j.1539-6924.2011.01671.x
Peters, E.. (2020). Innumeracy in the Wild. Innumeracy in the Wild. Oxford: Oxford University Press. doi: 10.1093/oso/9780190861094.001.0001
Peters, E., Dieckmann, N. F., Västfjäll, D., Mertz, C. K., Slovic, P., and Hibbard, J. H. (2009). Bringing meaning to numbers: The impact of evaluative categories on decisions. J. Experi. Psychol. Appl. 15, 213–227. doi: 10.1037/a0016978
Peters, E., Hart, P. S., and Fraenkel, L. (2011). Informing patients: The influence of numeracy, framing, and format of side effect information on risk perceptions. Med. Decision Making 31, 432–436. doi: 10.1177/0272989X10391672
Peters, E., and Slovic, P. (2007). Affective asynchrony and the measurement of the affective attitude component. Cogn. Emot. 21, 300–329. doi: 10.1080/02699930600911440
Pighin, S., Bonnefon, J. F., and Savadori, L. (2011). Overcoming number numbness in prenatal risk communication. Prenat. Diagn. 31, 809–813. doi: 10.1002/pd.2771
Pighin, S., Savadori, L., Barilli, E., Rumiati, R., Bonalumi, S., Ferrari, M., et al. (2013). Using comparison scenarios to improve prenatal risk communication. Med. Decision Making 33, 48–58. doi: 10.1177/0272989X12464433
Pratto, F., and John, O. P. (1991). Automatic vigilance: the attention-grabbing power of negative social information. J. Pers. Soc. Psychol. 61, 380–391. doi: 10.1037/0022-3514.61.3.380
Reyna, V. F.. (2021). A scientific theory of gist communication and misinformation resistance, with implications for health, education, and policy. Proc. Natl. Acad. Sci. U.S.A. 118, e1912441117. doi: 10.1073/PNAS.1912441117
Roth, E., Morgan, M. G., Fischhoff, B., Lave, L., and Bostrom, A. (1990). What do we know about making risk comparisons? Risk Analysis 10, 375–387. doi: 10.1111/j.1539-6924.1990.tb00520.x
Schwartz, L. M., Woloshin, S., Black, W. C., and Welch, H. G. (1997). The role of numeracy in understanding the benefit of screening mammography. Ann. Intern. Med. 127, 966–972. doi: 10.7326/0003-4819-127-11-199712010-00003
Slovic, P.. (2010). If i look at the mass i will never act: psychic numbingpsychic numbing and genocidegenocide. Int. Library Ethics Law Technol. 5, 37–59. doi: 10.1007/978-90-481-8647-1_3
Slovic, P., Finucane, M. L., Peters, E., and MacGregor, D. G. (2004). Risk as analysis and risk as feelings: some thoughts about affect, reason, risk, and rationality. Risk Analysis 24, 311–322. doi: 10.1111/j.0272-4332.2004.00433.x
Slovic, P., Finucane, M. L., Peters, E., and MacGregor, D. G. (2007). The affect heuristic. Eur. J. Oper. Res. 177, 1333–1352. doi: 10.1016/j.ejor.2005.04.006
Spiegelhalter, D., Pearson, M., and Short, I. (2011). Visualizing uncertainty about the future. Science 333, 1393–1400. doi: 10.1126/science.1191181
Van Boven, L., Ramos, J., Montal-Rosenberg, R., Kogut, T., Sherman, D. K., and Slovic, P. (2019). It depends: Partisan evaluation of conditional probability importance. Cognition 188, 51–63. doi: 10.1016/j.cognition.2019.01.020
van der Bles, A. M., van der Linden, S., Freeman, A. L. J., and Spiegelhalter, D. J. (2020). The effects of communicating uncertainty on public trust in facts and numbers. Proc. Natl. Acad. Sci. U.S.A. 117, 7672–7683. doi: 10.1073/pnas.1913678117
Keywords: risk communication, risk perception, seismic risk, earthquake (EQ), disaster mitigation, natural hazard, disaster preparedness, natural disaster
Citation: Savadori L, Ronzani P, Sillari G, Di Bucci D and Dolce M (2022) Communicating Seismic Risk Information: The Effect of Risk Comparisons on Risk Perception Sensitivity. Front. Commun. 7:743172. doi: 10.3389/fcomm.2022.743172
Received: 17 July 2021; Accepted: 23 February 2022;
Published: 23 March 2022.
Edited by:
Melissa Jane Nursey-Bray, University of Adelaide, AustraliaReviewed by:
Lucia Velotti, John Jay College of Criminal Justice, United StatesTomoyuki Kobayashi, Fukushima Medical University, Japan
Copyright © 2022 Savadori, Ronzani, Sillari, Di Bucci and Dolce. This is an open-access article distributed under the terms of the Creative Commons Attribution License (CC BY). The use, distribution or reproduction in other forums is permitted, provided the original author(s) and the copyright owner(s) are credited and that the original publication in this journal is cited, in accordance with accepted academic practice. No use, distribution or reproduction is permitted which does not comply with these terms.
*Correspondence: Lucia Savadori, bHVjaWEuc2F2YWRvcmlAdW5pdG4uaXQ=