 Sandra Madureira
 Mario A. S. Fontes
- Philosophy and Language Sciences Department, Pontifical Catholic University of São Paulo, São Paulo, Brazil
This study considers instances of voice quality settings under a sound-symbolic and synesthetic perspective, focusing on the auditory impressions these settings might have on listeners' attributions of meaning effects and associations between vocal and visual features related to emotional expression. Three perceptual experiments are carried out. The first experiment examined the impressionistic effects of eight voice quality settings characterized by differences in pitch. The second experiment examined the impressionistic effects of seven voice quality settings characterized by productions with the presence or absence of turbulent airflow, irregularity, and tenseness. The third experiment investigated associations between facial expressions of basic emotions and voice quality characteristics. Data are considered in terms of acoustic (fundamental frequency values), articulatory (reduced or expanded length of the vocal tract), perceptual impressions of size (big/small), strength (strong/weak), brightness (dark, clear), and distinctiveness (muffled/distinct), and visual features (facial expressions of the basic emotions sadness, happiness, anger, disgust, fear, and neutrality). The results provide corroborating evidence of existing links between sound and meaning and are discussed in relation to the frequency, production, sirenic biological codes, phonetic metaphors, and the vocal and facial gestures involved in emotional expression.
1. Introduction
Speech is a powerful means of communication due to its expressive phonetic quality. Issues related to the expressive nature of phonetic quality are addressed by Laver (1976), who argues that phonetic quality can be considered from a semiotic point of view as part of a more comprehensive human communicative system. Phonetic quality, considered in this way, transcends the strict linguistic functions of information meaning and includes the paralinguistic and indexical information that Laver refers to as the whole physical, psychological, and social profile of the speakers, as revealed by the quasi-permanent auditory coloring of their voice quality.
Laver emphasizes that the concurrent features of voice quality, those that are under the speaker's volitional control, together with those due to physiologically intrinsic, non-controlled voice characteristics can be abstracted from the speech flow.
The semiotic perspective on phonetics that Laver advances not only sheds light on speaker identity construction in human communication but also raises issues related to the paralinguistic sound symbolic uses of the long-term phonetic characteristics of voice quality settings.
Sound symbolism reflects direct links between sound and meaning. It is referred to as a pre-semantic phenomenon that evolved from distant preverbal stages in language evolution (Fónagy, 2001; Westbury, 2005; Sučević et al., 2013). It also reflects sound synesthetic interactions between the human senses. Research works on crossmodal associations between acoustic and color features (Johansson et al., 2020), faces and voices (Nagrani et al., 2018), taste and touch (Christensen, 1980), taste and smell (Stevenson and Boakes, 2004), emotion and color, colors and taste, and colors and smell (Gilbert et al., 2016) have demonstrated crossmodal interactions.
Interactions between vocal and visual features in speech perception are demonstrated by the McGurk effect (McGurk and MacDonald, 1976; Green and Norrix, 1997; Abelin, 2007, 2008; Jiang and Bernstein, 2011). Furthermore, gesture congruence is found in speech segments, setting productions, and communicative gestures. For instance, the/i/vowel sound, the lip spreading voice quality setting, and the smiling gesture indicative of positive emotional valence share the same facial movement.
In considering sound symbolism, reference to the dialogue “Cratylus” by Plato is inevitable (Vieira, 2014) for discussions of the natural and arbitrary links between sound and meaning. The two protagonists in the dialogue Cratylus defend different points of view on the nature of the expression and content of verbal signs. The protagonist Cratylus argues that the links between form and meaning are natural (the physei theoretical view of language). The other protagonist Hermogenes, however, advocates that these links are arbitrary (the thesei theoretical view of language).
Over the centuries the debate continued, and in the 20th century, it reappeared in a new guise through Jakobson (1977). Jakobson considers the linguistic sign as motivated in opposition to the arbitrary linguistic sign defended by Saussure [1916] (2012). The physei-thesei controversy raised such an interest that it became the subject of a great number of reviews and theoretical propositions in the literature. The discussion evolved in the direction of discussing the specific role of the two types of sound-meaning associations co-existing in language expression (Ahlner and Zlatev, 2010; Monaghan et al., 2014; Dingemanse et al., 2015) and, more recently, to hybridization between arbitrariness and motivation (Nobile, 2019).
Seemingly, the physei-thesei is an endless topic of discussion because it can be discussed from a myriad of dynamic factors such as pre-verbal and verbal communication, ritualization, gesturality, systematicity, multimodality, digital orality, expressivity, cognitive functioning, neurophysiological correlations, magical power, and esthetic values.
Fónagy (2001) raises some relevant issues concerning the arbitrary and motivated views of language expressions. He defends that signs are conventional, whether they are motivated (iconic) or not. Furthermore, he states that conventional is not to be confused with arbitrary and that different degrees of motivation (iconicity) must be considered. Arbitrariness and motivation (iconicity) seem to be placed on extremes of a gradient scale.
According to Fónagy's view, iconicity is defined as a natural tie between verbal representation and the reality represented, sound symbolism as the iconicity of sound shape, and synesthesia as the transfer mode of perception to others. These are the definitions we adopt in this study.
Sound-symbolic uses of speech segments and voice dynamic features have been explored theoretically in numerous works in linguistic literature. The following research works are highlighted here for their pioneering contributions (Köhler, 1929; Sapir, 1929; Léon, 1933), their proposals on the relevance of the communicative basis of sound (Jakobson and Waugh, 1979; Fónagy, 1983, 2001; Tsur, 1992; Poyatos, 1993; Hinton et al., 1994), or the contemporaneity of their interpretation of the sound-meaning interactions (Nobile, 2019; Körner and Rummer, 2022).
Experimental research (Köhler, 1929; Newman, 1933; Peterfalvi, 1965; Woodworth, 1991; Abelin, 1999; Blasi et al., 2016; Anikin et al., 2021; just to mention a few) on sound symbolism has yielded surprising results on how sound and sense are interrelated. However, the sound-symbolic impressions caused by the coloring of voice quality settings have not been considered in such experiments.
The relevance of the role of voice quality in signaling affect has been demonstrated in an experiment with synthesized stimuli (Yanushevskaya et al., 2013) that compared voice quality and fundamental frequency effects in expressing affective stages and concluded that F0 alone had a weaker effect than voice quality alone.
In fact, as voice quality is a long-term articulatory or phonatory configuration that “colors” all speech segments (Laver, 1980). The “coloring” effect is more perceptually evident on the key speech segments (Mackenzie Beck, 2005) that is, the segments which are more susceptible to the influence of determined voice quality settings. In this way, for instance, oral speech sounds are more susceptible to nasal vocal quality settings than nasal speech sounds, front unrounded vowels to lip rounding voice quality settings and back rounded vowels to lip spreading voice quality settings (Mackenzie Beck, 2005, 2007).
Voice quality settings are defined in this study according to the phonetic model of voice quality description (Laver, 1980), and their description follows the Voice Profile Analysis System (VPA) developed by Laver and Mackenzie-Beck (2007). Facial movements are described with the Facial Action System (FACS) developed by Ekman et al. (2002).
Similarities between the two systems, VPA and FACS, are described by Madureira and Fontes (2019). Both systems were created in the late 1970s and revised in the early 2000s. They are both perceptually oriented, theoretically based, and componential, and their components can be combined into profiles. The analytical unit in FACS is the Action Unity (AU) and that in VPA is the setting. Both systems posit a neutral element as a reference—the neutral face in FACS and the neutral voice quality setting in VPA. The intensity of the facial movement is analyzed in terms of five varying intensity levels (from A to E in FACS), and the settings of voice quality in terms of six discrete degrees (from the weakest 1 to the strongest six in VPA).
Interactions between sound and meaning and among vocal, visual, and meaning features are examined under a theoretical view of language iconicity. Some founding tenets of sound symbolism and synesthesia perception, the role of vocal and visual features in meaning expression, and three perceptual experiments on voice quality expressiveness are considered in this study.
2. The paralinguistic voice and face of speech
Facial and vocal gestures are highly communicative (Xu et al., 2013), and they are fully integrated with vocal gestures in the expression of emotions of attitudes and modality. The 7th cranial nerve, which innervates the facial muscles, is also connected to the brain motor areas responsible for speech production (Walker, 1990).
On the speech acoustic signal produced by vocal gestures, the richness and variability of the physical properties of the acoustic features afford listeners means for attributing paralinguistic meanings. Acoustic cues impress listeners with their inherent physical features and are interpreted as indices of psychological, sociological, and biological factors and/or as representations of mental objects.
For the investigation of acoustic parameters in analyzing paralinguistic meanings, the ExpressionEvaluator script (Barbosa, 2009) and the Prosody Descriptor Extractor for PRAAT (Barbosa, 2021) allow the measurement of numerous acoustic parameters shedding light on how listeners perceive such meaning effects.
A key point regarding the attribution of paralinguistic meanings by listeners is that acoustic factors map articulatory factors, and both are considered indispensable (Kawahara, 2021) in explaining sound-meaning correspondences and their patterning in languages.
On the actions concerning facial gesturality, the muscular movements of the superior and inferior parts of the face and their combinations play an important role in listener attribution of paralinguistic meanings (Swerts and Krahmer, 2006; Scherer et al., 2021). Some of the movements of the upper face are involuntary and last from 40 to 200 ms. They are called microexpressions (Ekman and Friesen, 1976).
The prevalence of vocal or facial expression in emotion perception has been debated and research findings indicate that such perception depends on the kind of stimuli used, the kind of emotion analyzed, the level of emotional intensity considered, and the interference of cultural aspects focused in the experiments.
On issues related to emotion research, a comprehensive theoretical and empirical review is found in Scherer et al. (2011) and a proposal for future research agenda on emotion studies in Scherer (2022). For accomplishing the proposed goal in the emotion research agenda, Scherer argues that central concepts, components, mechanisms, and operationalization procedures of the emotional phenomena must be identified and clarified.
In Scherer et al. (2011), emotional expression and impression are viewed as determined by psychobiological and sociocultural factors. Emotional expression is considered from a multimodal perspective which comprises vocal, facial, and gestural patterns of expression. Emotional expression is considered from a multimodal perspective, which comprises vocal, facial, and gestural patterns of expression. The authors propose that emotions are encoded as signals in the face, the voice, and the body and decoded by the perceivers who rely on the multimodal expressed cues.
Scherer (2022) analyzes the tenets of the basic, appraisal, and constructivist theories and focus on their complementary and shared features. Based on these commonalities, the author suggests steps to be taken toward the proposal of a convergent theoretical framework of emotional expression. The author considers the emotional process, regardless of their theoretical orientation, to arise in response to a perceived event, which is evaluated and creates a physiological reaction. Physiological reactions are then expressed in vocal, facial, and bodily actions and can be categorized and labeled.
Abelin (2007, 2008) investigated the perception of emotional expressions in unimodal and bimodal conditions using audio only, visual only, audiovisual, and conflicting audio and visual stimuli (McGurgh stimuli). Results indicated that emotional expressions were better perceived in bimodal conditions. In unimodal conditions, the auditive expression performed better, and under the McGurk condition, it was the visual expression. Depending also on the kind of emotion expressed, the vocal or the visual channel was found to perform better. The latter is consistent with Fontes (2014) findings.
In an empirical study using neuroimaging and an affective priming task to study facial and vocal expressions of anger, happiness, and neutrality, Zhang et al. (2018) found that facial expressions played a more important role than vocal prosody in eliciting emotion perception. These findings can be interpreted as related to the kinds of emotions analyzed, as highlighted by Abelin (2007, 2008).
Based on some research implications of the above-reported studies, multimodality and mappings among acoustic, articulatory, and perceptual data are key factors to be considered in experiments on speech expression paralinguistic meanings.
3. Experiments
We designed and performed three experiments to examine the impressionistic effects of voice quality settings. These experiments focused on the associations among vocal, facial, and meaning expressions. These associations are interpreted in relation to the frequency, effort, and sirenic biological codes and phonetic metaphors.
The speech samples used in the three experiments reported in this study were extracted from the audio files accompanying the book “The Phonetic Model of Voice Quality” by Laver (1980), and all the voice quality settings were produced by John Laver himself. The utterance is “Learning to speak well is an important and fruitful task.” The description of the voice quality settings follows Mackenzie Beck (2007).
The choice of the speech samples was motivated by the fact that the speaker is the same, so physiological features are controlled by the speaker's phonetic expertise and ability to produce several voice quality settings. All the settings were produced with a moderate degree.
The choice of the settings in each experiment was guided by the perceptual effects related to the Frequency Code (Ohala, 1984), the Effort Code (Gussenhoven, 2002, 2004), the Sirenic Code (Gussenhoven, 2016), and the phonetic metaphor (Fónagy, 1983, 2001).
The Frequency Code was proposed on ethological grounds, following Morton (1977) observations on vocal communication signals of birds and mammals. It relates animal size to F0 acoustic characteristics. From a sound-symbolic perspective, a small vocal tract and thin vocal folds produce a high F0 and a small size signal, non-threatening attitudes, fragility, submissiveness, and related meanings, whereas a low F0 conveys large size, threatening attitudes, power, assertiveness, and related meanings.
The Effort Code pertains to the articulatory effort and precision displayed in the pitch range and articulatory movements. The greater the articulatory effort, the greater the tendency toward articulatory precision and wider pitch ranges. The paralinguistic meanings conveyed by speech productions characterized by higher effort are emphasis, greater significance, insistence, and surprise (Chen et al., 2002). The opposite might be expected from the reduced effort.
The Sirenic Code (Gussenhoven, 2016) refers to the use of breathy, whispery phonation to signal femininity, attractiveness, charm, and related paralinguistic meanings. In female participants, this kind of phonation, which is produced with airflow escaping through the glottis, produces lower harmonics-to-noise ratios. In an analysis of dubbing voices, Crochiquia et al. (2020) found that one of the male characters whose voice was characterized by a whispery voice quality setting was judged pleasant and his personality was considered charming.
Phonetic metaphors (Fónagy, 1983, 2001) are defined as verbal mirror images of the mental movement inherent in the phonetic gesture. Phonetic gestures are metaphorical because articulatory actions can be interpreted as expressions of meaning.
The perception test in each experiment was administered to a different group of subjects, that is, each subject judged the stimuli of just one of the perceptual tests. In all three tests, the number of female judges was greater than the number of male subjects. As such, the results may be more representative of women's perceptions.
3.1. Experiment 1
3.1.1. Aim
This experiment aims to examine the impressionistic effect of eight voice quality settings. Paralinguistically, meaning associations related to the Frequency Code and phonetic metaphors are expected.
3.1.2. Participants
The test was performed by 44 participants, 8 men and 36 women, aged from 18 to 75 years, with a mean age of 38 years. They were undergraduates and graduates from several fields (Linguistic, Languages, Speech Therapy, Psychology, and Communication). None of them had hearing problems.
3.1.3. Stimuli
The stimuli were eight speech samples characterized by the following voice quality settings as referred to VPA (Laver and Mackenzie-Beck, 2007): Raised Larynx, Lowered Larynx, Lip Rounding, Backed Tongue Body, Lip Spreading, Nasal, Denasal, and Falsetto.
Perceptually, Backed Tongue Body, Lip Rounding, Denasal, Nasal, and Lowered Larynx are characterized by lower pitch mean and range than Falsetto, Raised Larynx, and Lip Spreading.
The perceptual effects of these voice quality settings are related to the acoustic resonance characteristics determined by the size and shape of the resonating cavity: diminished in the cases of Raised Larynx and Lip Spreading, enlarged in the cases of Lowered Larynx and Backed Tongue Body, and involving coupled resonating cavities for Denasal and Nasal (Vanger et al., 1998). In the case of Falsetto, which is produced with stretched vocal folds, the resultant phonation is high-pitched.
In the selected stimuli, the F0 maximum value and difference between F0 maximum and F0 minimum values were for the Backed Tongue Body (103 Hz; 36 Hz), for Lip Rounding (115 Hz; 47 Hz), for Denasal (152 Hz; 70 Hz), for Nasal (166 Hz; 84 Hz), for Lowered Larynx (138 Hz; 58 Hz), for Falsetto (328 Hz; 124 Hz), for Raised Larynx (230 Hz; 143 Hz), and for Lip Spreading (180 Hz, 114 Hz).
3.1.4. Perceptual test design and application procedures
The perceptual test was designed with the SurveyMonkey online survey software and a link to be sent to participants was generated. The speech samples were followed by a sliding bar, containing four pairs of polar semantic descriptors (opposing darkness/clarity, muffledness/distinctiveness, smallness/bigness, and strength/weakness) displayed on a semantic differential scale.
The participants were asked to listen to the stimuli and register their auditory impression by placing the mouse pointer on some part of the continuous scale coded between 0 and 100. Scores lower than 50 show a tendency toward the polar descriptor on the left and scores higher than 50 to the polar descriptor on the right. A score of 50 corresponds to the middle (neutral) point.
The participants' answers were collected and transferred to an Excel sheet. Mean values of the perceptual scores for the voice quality settings were calculated. To evaluate inter-rater reliability, Cronbach's Alpha test was applied. The Pareto Chart histogram was used to identify the probability distribution function of the data.
3.1.5. Results
An acceptable value of Cronbach's Alpha was obtained (0.78). In Table 1, vocal quality settings and paralinguistic features are related; higher scores indicate the choice of the rightmost descriptor in the pair and lower scores indicate those placed on the left. In the description of the vocal quality main characteristics, descriptors whose scores fell within the range between 49 and 51 were considered neutral. Thus, the lower, or the higher the score is, the more representative it is of the characteristic with which it is related.
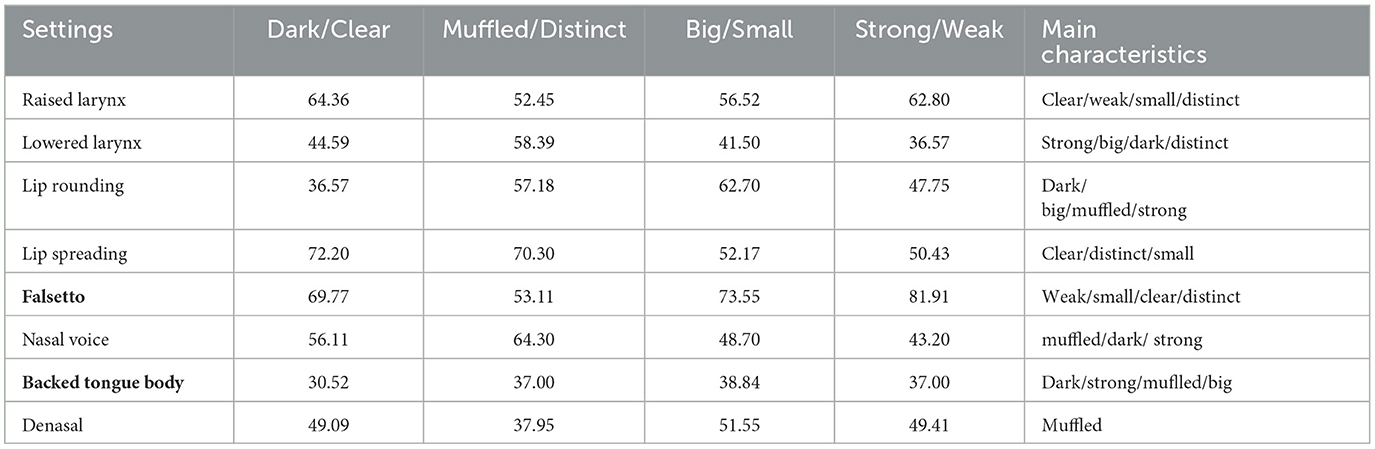
Table 1. Perceptual scores of associations between voice quality settings and paralinguistic meanings.
The probability distribution function of the data was determined with a Pareto Chart histogram to check the tendency of the distribution of 80% of the answers toward the descriptor on the left or to the one on the right of the continuous scale. In this way, it was possible to identify the voice quality settings whose judgment scores in relation to the semantic descriptors were 80% placed in the range between 0 and 40 (left side of the scale) and in the range between 60 and 100 (right side of the scale). They were as follows: for the descriptor “dark”, Backed Tongue Body, Lowered Larynx, and Nasal; for “clear”, Falsetto, Lip Spreading and Raised Larynx; for “muffled”, Backed Tongue Body and Denasal; for “distinct”, Falsetto; for “big”, Backed Tongue Body and Lowered Larynx; for “small”, Falsetto; for “strong”, Backed Tongue Body and Lowered Larynx; and for “weak”, Falsetto and Raised Larynx.
3.1.6. Discussion
The results of the perceptual judgments on the voice quality settings presented in Experiment I show two opposing groups in terms of strength (weak/strong), size (small/big), and brightness (clear/dark). Images extracted from Vanger et al. (1998) and analyzed with FaceReader8. One of the groups is composed of Falsetto, Raised Larynx, and Lip Spreading voice quality settings, which were judged as clear and small. Falsetto and Raised Larynx are also considered weak. The other group is composed of Lowered Larynx and Backed Tongue Body voice quality settings, which were judged as strong, big, and dark.
Raised Larynx and Lip Spreading voice quality settings are produced with a shortened vocal tract, and shorter vocal tracts tend to increase f0 and formant frequencies. Falsetto voice quality settings are characterized by even higher F0 values than Raised Larynx and Lip spreading vocal quality settings because they are produced with stretched vocal folds, which makes the vocal folds thinner, and when they vibrate, they barely touch each other (Mackenzie Beck, 2007).
Lip Rounding and Backed Tongue Body vocal quality settings, on the other hand, are produced with an increased size of the vocal tract, the former by adding an extra cavity formed by the protrusion and rounding of the lips, and the latter by enlarging the oral cavity. Both have the acoustic consequence of lowering frequencies (Fant, 1960; Stevens, 1998).
Together with the Denasal voice quality setting, the Backed Tongue Body vocal quality setting was also judged as “muffled”. The Backed Tongue Body tends to centralize front vowels and make velarization, uvularization, and pharyngealization features more marked. Tongue backing has a great effect on front vowels, which are realized as central vowels (Mackenzie Beck, 2007). A front vowel such as/i/when realized as a close central unrounded vowel sounds less distinct. Laver (1980) refers to this centralizing effect as the centering setting found in voices is perceived as muffled.
According to Kawahara (2021), the fact that Nasal voice quality was perceptually associated with strong and dark. Kawara reports that the reason why nasals may be associated with large images and paralinguistic meaning expressions of roundness, heaviness, and softness may be linked to the length of nasal cavities. Acoustically, nasal sounds are characterized by low-frequency energy and a damped auditory quality caused by resonances produced by the long resonating cavity ending in small apertures.
The perceptual judgment results in this experiment corroborate sound-symbolic relations based on the Frequency Code (Ohala, 1984, 1994) and on the phonetic metaphors (Fónagy, 1983). Ohala (1994) argues that high F0 signals smallness, a non-threatening attitude, and other related semantic meanings, whereas a low F0 conveys opposite meanings.
In our experiment, judgments of the Falsetto voice quality setting clearly demonstrate that the higher the F0, the weaker, the smaller, and the clearer the voice quality setting. This result corroborates the Frequency Code predictions on the meanings associated with high frequency. Metaphorically, on the one hand, links can be established between the diminished length of the vocal tract in Raised Larynx vocal quality setting productions and smallness and weakness, and on the other hand, between the expanded length of the vocal tract in Lowered Larynx vocal quality productions or yet of the expanded oral cavity in Backed Tongue Body vocal quality productions and bigness and strength.
3.2. Experiment 2
3.2.1. Aim
This experiment aimed to examine the impressionistic effect of seven voice quality settings. The perceptual effects of these voice quality effects are related to the presence or absence of turbulent airflow and irregularity and the presence or absence of tenseness. Paralinguistically, meaning associations related to the Effort and Sirenic Codes are expected.
3.2.3. Participants
The test was performed by 50 participants, 17 men and 33 women, aged from 21 to 70 years, and with a mean age of 38 years. They were undergraduates and graduates from several fields (Linguistic, Languages, Speech Therapy, Psychology, and Communication). None of them had hearing problems.
3.2.4. Stimuli
The seven voice quality settings selected comprise phonatory settings (Modal Voice, Whispery Voice, Creaky Voice, Breathy Voice, and Harsh Voice) and Vocal Tract settings (Tense Voice and Lax voice) as referred to by VPA (Laver and Mackenzie-Beck, 2007).
3.2.5. Perceptual test design and application procedures
The perceptual test was designed in the SurveyMonkey online survey software and a link to be sent to participants was generated. The speech samples were followed by a sliding bar, containing three pairs of semantic descriptors (softness/roughness; regularity/irregularity; and pleasantness/unpleasantness) displayed in a differential scale.
The participants were asked to listen to the stimuli and register their auditory impression by placing the mouse pointer at the perceived value in the continuous scale. Their answers were collected and transferred to an Excel sheet. The mean values of the perceptual scores for the voice quality settings were calculated. To evaluate inter-rater reliability, Cronbach's Alpha test was performed.
3.2.6. Results
The value of Cronbach's Alpha was acceptable (0.72). Modal, Breathy, and Lax voice quality settings, which are not produced with larynx muscle tension or pharyngeal constriction, were considered soft, regular, and pleasant. Although the tense voice quality setting is produced with constricted glottis, the F0 is not irregular (Keating et al., 2015). This might explain the affiliation of this voice quality setting with this group. The mean perceptual scores are given in Table 2.
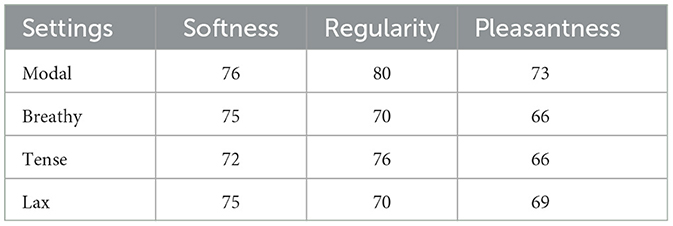
Table 2. Perceptual scores related to associations between voice quality settings and paralinguistic features.
Whispery, Creaky, and Harsh voice quality settings were considered harsh, irregular, and unpleasant, respectively. The mean perceptual scores obtained are given in Table 3.
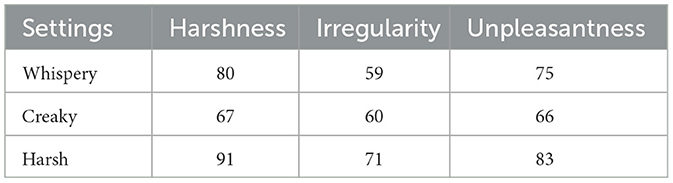
Table 3. Perceptual scores related to associations between voice quality settings and paralinguistic features.
3.2.7. Discussion
Modal and Harsh voice qualities were placed on opposite extremes of the continuum between positive (pleasant) and negative (unpleasant). Our interpretation is that this discrepancy reflects the periodicity resulting from glottal efficiency in the Modal voice quality setting production and the aperiodicity of the Harsh voice quality setting (Mackenzie Beck, 2007), due to irregular vocal fold vibration.
Whispery voice combines fricative glottal airflow with vocal fold vibration, Creaky voice combines low-frequency pulsed phonation with vocal fold vibration, and Harsh voice quality setting combines noise with irregular vocal fold vibration. Although Breathy and Whispery voice quality settings share high levels of fricative airflow through the glottis, Breathy voice is produced with a lower amplitude of vocal fold vibration and less fricative energy (Hewlett and Beck, 2013) than Whispery voice quality and with lax phonation as opposed to tense phonation in Whispery voice quality (Schaeffler et al., 2019). Breathy voice quality is considered a signal of intimacy, whereas Whispery voice quality is interpreted as a signal of confidentiality (Laver, 1980).
The results can be interpreted in reference to remarks on the opposing flowing characteristics of periodicity and disturbing characteristics of aperiodicity (Tsur, 1992; Fónagy, 2001). Opposite sound-meaning relationships can be derived from chaotic associations among the noise, irregular patterns of vibration of the vocal folds, tense phonation, laryngeal and pharyngeal constrictions, and smooth associations between sonority, a regular pattern of vibration of the vocal folds, and lax phonation.
The impressionistic meaning effects of fricative glottal airflow can be interpreted in terms of the Sirenic Code and the presence or absence of articulatory effort and the amount of energy expenditure can be interpreted in terms of the Effort Code. Under low-intensity levels, as in breathy voice quality, the airflow is smooth and pleasant, but as fricative energy, tenseness, and articulatory effort increase as in Harsh or Whispery voice qualities, it becomes unpleasant.
3.3. Experiment 3
3.3.1. Aim
This experiment aimed to investigate potential associations between facial and vocal expressions of basic emotions. Our interest is in the synesthetic interactions among Action Unities, vocal quality settings, and emotional meaning expression. Action Unities describe the movements of the facial muscles, and vocal quality settings describe the movements of the articulators and the vocal folds. The impressionistic effects of both facial and vocal expressions on emotion detection can vary depending on production features such as the upward or downward direction of the movement and the presence or absence of tenseness and constriction.
3.3.2. Participants
The test was performed by 50 participants, 13 men and 37 women, aged between 18 and 73 years, with an average age of 35 years. They were undergraduates and graduates from several fields (Linguistics, Languages, Speech Therapy, Psychology, and Communication). None of them had hearing problems.
3.3.3. Stimuli
There were two kinds of stimuli: visual and vocal. The visual stimuli were pictures of a man portraying the six basic emotions that were selected for analysis: Happiness, Sadness, Anger, Disgust, Fear, and Neutrality. Such pictures were drawn by Vanger et al. (1998). Apart from the neutral expression, which was not investigated in Ekman (2016), his findings show that there was high agreement judgment on the other five emotions considered in this experiment: Anger (91%), Fear (90%), Disgust (86%), Sadness (80%), and Happiness (76%). Neutrality was included as a facial stimulus to investigate the potential relationship of this kind of facial expression with the neutral setting of voice quality.
The vocal stimuli comprised six voice quality settings in VPA (Laver and Mackenzie-Beck, 2007), four of them phonatory configurational settings (Modal Voice, Whisper, Creak, and Harsh Voice) and two of them vocal tract configurational settings (Lowered Larynx and Lip Spreading).
The choice of voice quality settings to be tested was motivated by the potential matchings between visual and vocal characteristics, such as that between neutral face, which is not characterized by muscle contractions and neutral voice quality, described as the voice quality setting produced with regular and efficient glottal fold vibration; between coincidental lip corner movements in the face expression of Happiness and Lip Spreading, which is a voice quality setting produced with stretched lips; between the downward lip corner movements in the facial expression of Sadness and low pitch perception of the Lowered Larynx Voice quality, produced with downward movement of the larynx; between the contracted muscles in the expression of Anger and the perceptual roughness and the irregularity of voice fold vibration characterizing Harsh; between the repulsive feeling expressed by the Disgust facial expression and the unpleasant feeling caused by irregular discrete audible pulses characterizing Creak; and between the conflicting fight-or-flight response to Fear (Cannon, 2016) and the conflicting presence of audible fricative airflow of air stemming from the glottis and the absence of voice characterizing Whisper.
A point must be made in relation to Whisper and Creak. According to Kreiman and Sidtis (2011), Modal voice and Whisper are placed on opposite extremes of the voicing continuum. In Whisper, the vocal folds vibrate only slightly or not at all, and noise is generated through a partially closed glottis. In VPA (Laver and Mackenzie-Beck, 2007), the voice quality setting “Whisper” is distinct from Whispery Voice and Creak from Creaky Voice. The distinctions are based on the predominance of either voicing or noise features characterizing speech production. Wideband spectrograms of speech samples produced with these four kinds of voice quality settings are presented in Figures 1, 2. They were generated in PRAAT (Boersma and Weenik, 2022), version 6.2.18.
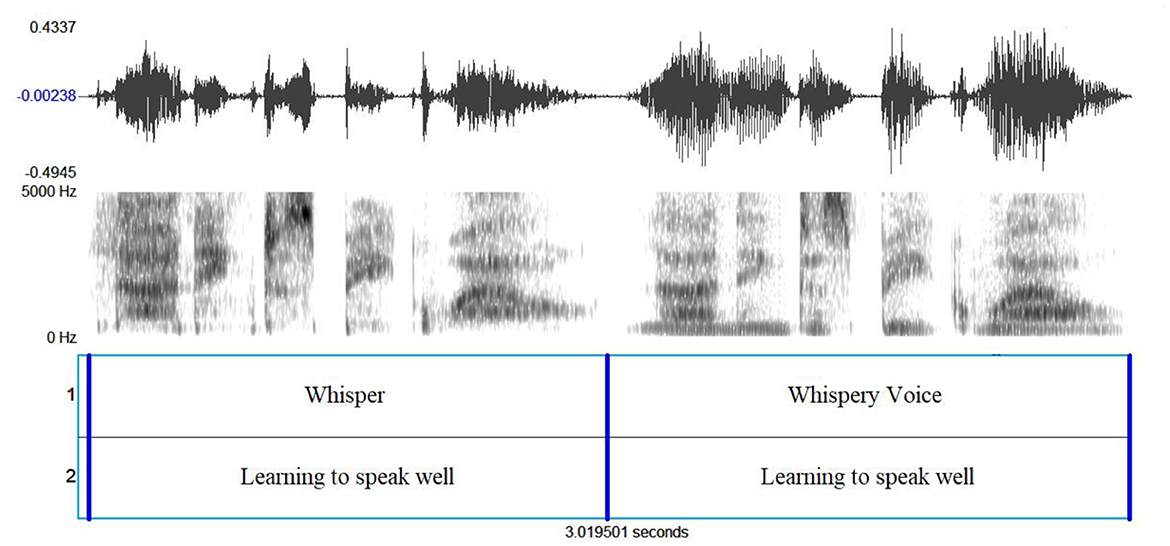
Figure 1. From top to bottom: the waveforms, the wideband spectrograms, and two annotation tiers with information on voice quality settings and textual transcription.
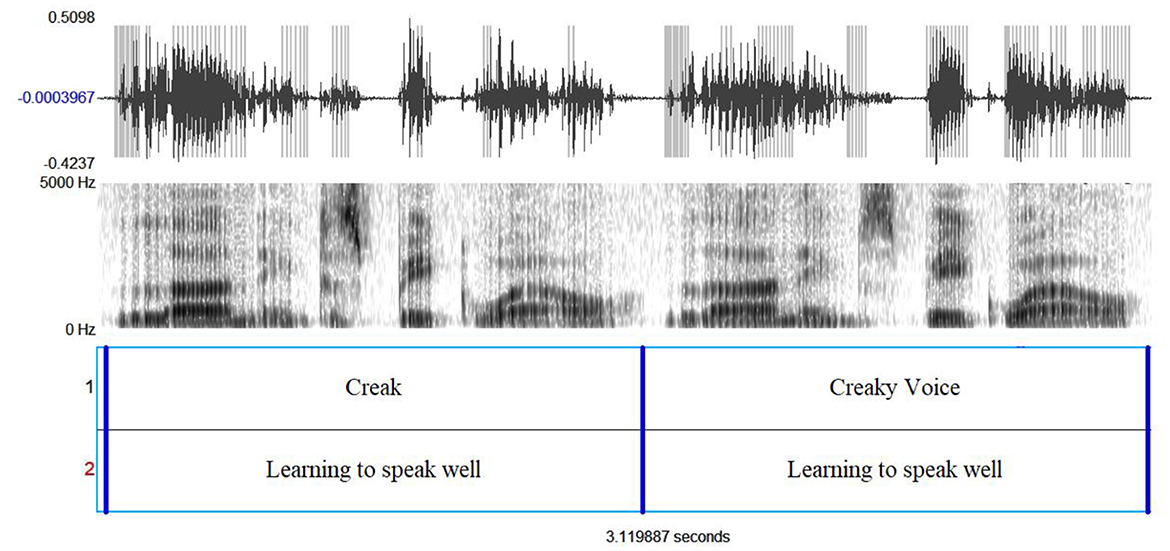
Figure 2. From top to bottom: the waveforms, wideband spectrograms, and two annotation tiers with information on voice quality settings and textual transcription.
In Figure 1, the waveforms and the wideband spectrograms of the first clause of the sentence “Learning to speak well is an important and fruitful task” produced in Whisper and Whispery voice qualities are displayed. The absence of the voicing bar in the Whisper production contrasts with the presence of the voicing bar in the Whispery production.
In Figure 2, the waveforms and the wideband spectrograms of the first clause of the sentence “Learning to speak well is an important and fruitful task” produced in Creak and Creaky voice qualities are displayed. The prevalence of creak over voicing characterizes the Creak voice quality setting.
The pictures depicting the six basic emotions were also analyzed automatically by the software FaceReader, version 8.1, from Noldus. (2022) Technology to determine the AUs involved in the picture facial expressions, their intensities, and their association with affective states. The coding of the AUs is performed in relation to the neutral face of the person under analysis.
3.3.4. Perceptual test design and application procedures
The perceptual test was designed in the SurveyMonkey online survey software and a link to be sent to participants was generated. Photos and speech samples were followed by multiple-choice questions.
The participants were asked to look at face portrait images and choose one out of six alternatives that best described the emotion expressed by the face. Each image was followed by six speech samples of the same sentence produced with six voice quality settings (Neutral, Modal, Creak, Whisper, Harsh, and Breathy). Participants were then asked to choose the speech sample which best matched the facial emotion expression.
The participants' answers were collected and transferred to an Excel sheet. The mean values of the perceptual scores for the face emotion descriptors and voice quality settings were calculated. To evaluate inter-rater reliability, Cronbach's alpha test was applied.
The Principal Component Analysis (PCA) method (Husson et al., 2009) was used to analyze the set of variables. The PCA is a multivariate and multidimensional statistical method. It is applied in three steps: identifying a common structure among the group variables; describing the specificity of each group of variables using correlation analysis; and comparing the resulting values using the individual analyses of the variables.
3.3.5. Results
The facial automatic analysis provided for each facial expression comprised the following features: the AUs, their intensity level, the emotion detected, and their percentage of detection. Intensity levels vary from the weakest (A) to the strongest (E). “A” stands for Trace, “B” for Slight, “C” for Pronounced, “D” for Severe, and “E” for Maximum. Figure 3 presents the AUs identified with the FaceReader and Table 4 specifies all the data obtained using the automatic analysis.
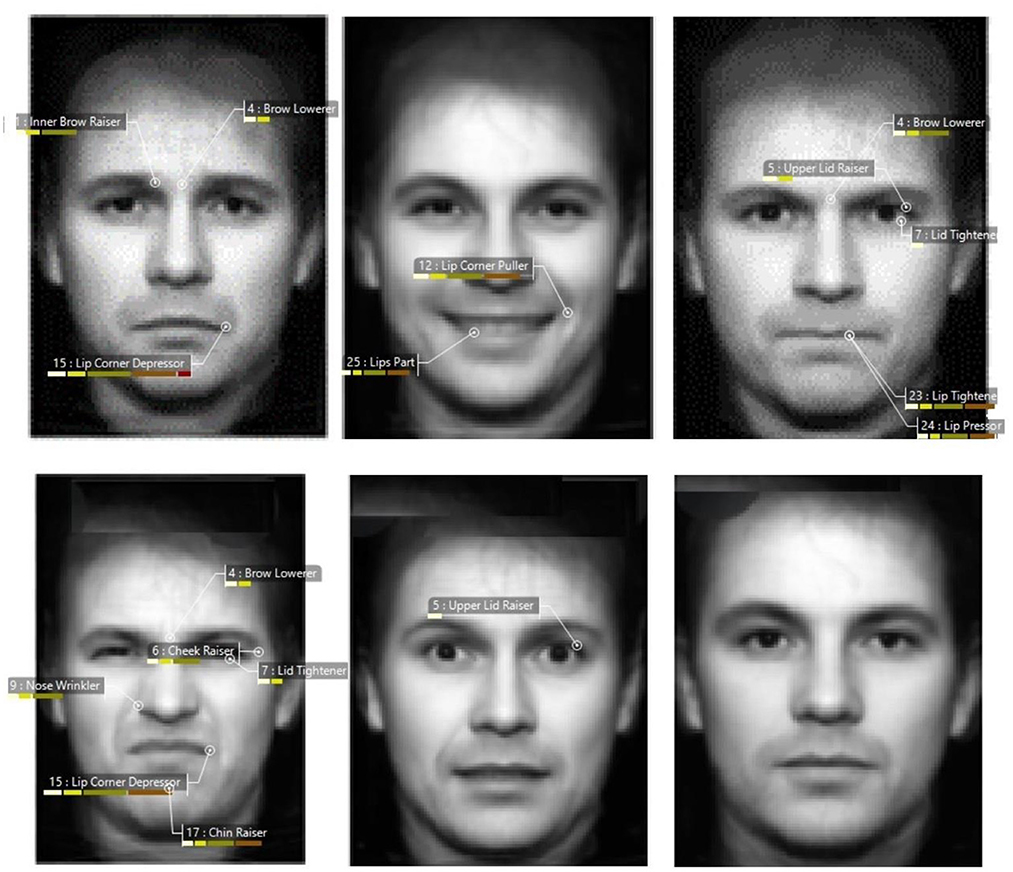
Figure 3. From top left to right: facial expressions of Sadness, Happiness, and Anger. From bottom left to right: facial expressions of Disgust, Fear, and Neutrality.
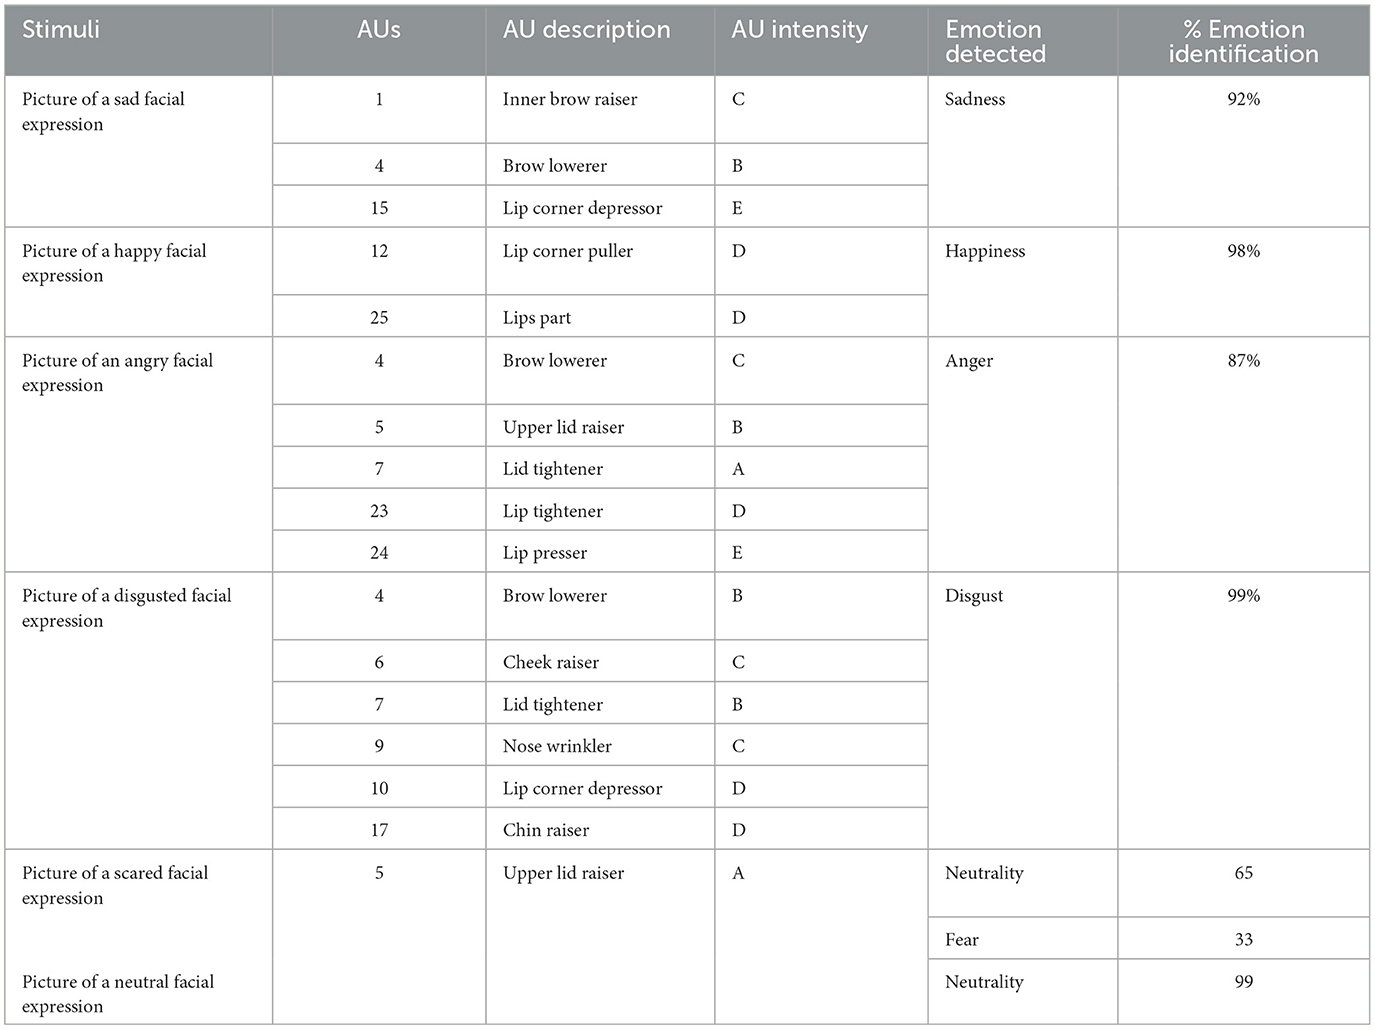
Table 4. Stimuli, action unities (AUs) and their intensities, emotions, and percentages of identification.
The indices of facial recognition of the emotions depicted in the pictures, except for Fear, were high. The lower percentage for the recognition of Fear may be related to the low intensity (A) of the AU detected.
Table 5 presents the results of the Perceptual test applied to the judges. The features in the table describe the stimuli, the kinds and intensity levels of the emotions detected, and the kinds and percentages of identification of the voice quality settings.
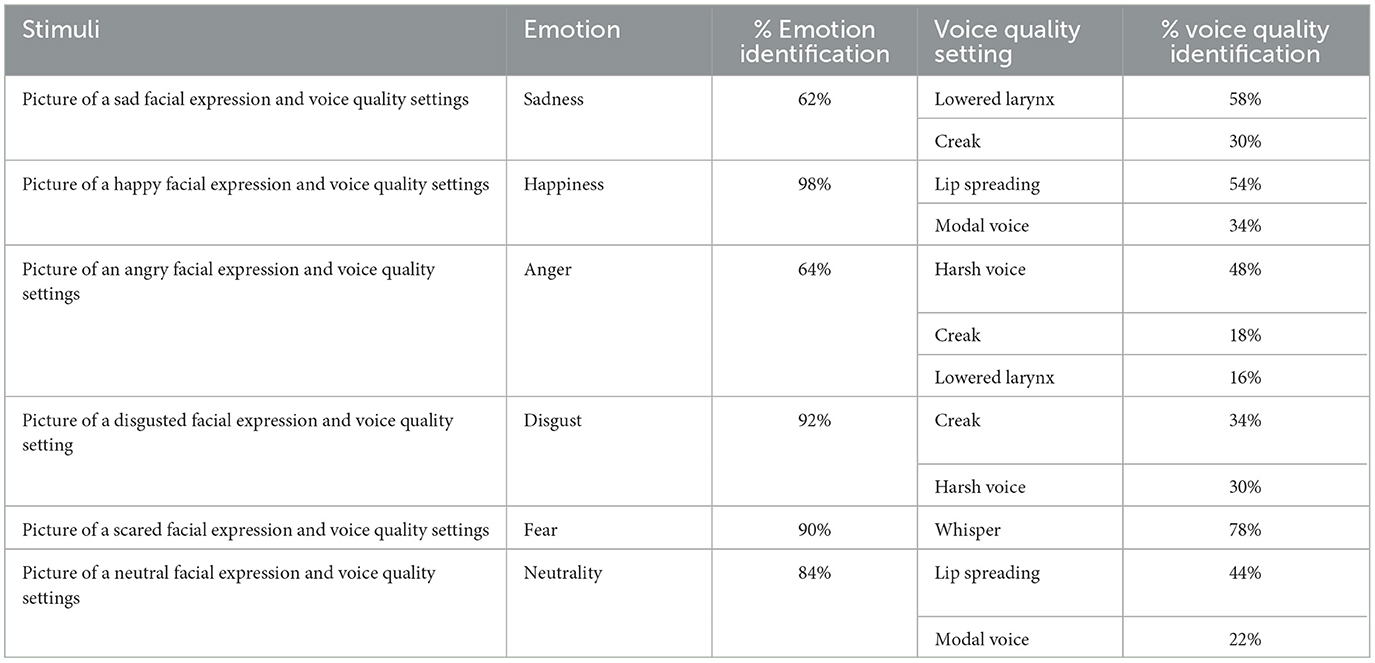
Table 5. Stimuli, emotions, and their percentage of identification, associated voice quality settings, and their percentage of identification.
The statistical method PCA was applied to analyze the emotion and the voice quality setting variables. Mean scores for both groups of variables were considered. All measures were normalized.
The PCA generated five clusters. One of the clusters grouped Whisper and Creak vocal quality settings which are characterized by voicelessness. Lip Spreading was correlated with Modal Voice, and Fear with Whisper. Creak was inversely correlated with Lip Spreading and Modal Voice.
The inertia gains in the clusters indicated that Dimensions 1 and 2 (Dim and Dim 2) could better explain the data. In Figure 4, the distribution of the variables is shown in four quadrants. On the upper left quadrant are Modal Voice, Lip Spreading, Happiness, and Neutrality; on the upper right quadrant are Lowered Larynx, Creak, and Sadness; on the left lower quadrant are Fear and Whisper; and on the right lower quadrant are Harsh, Anger, and Disgust. Significant correlations are presented in Table 6.
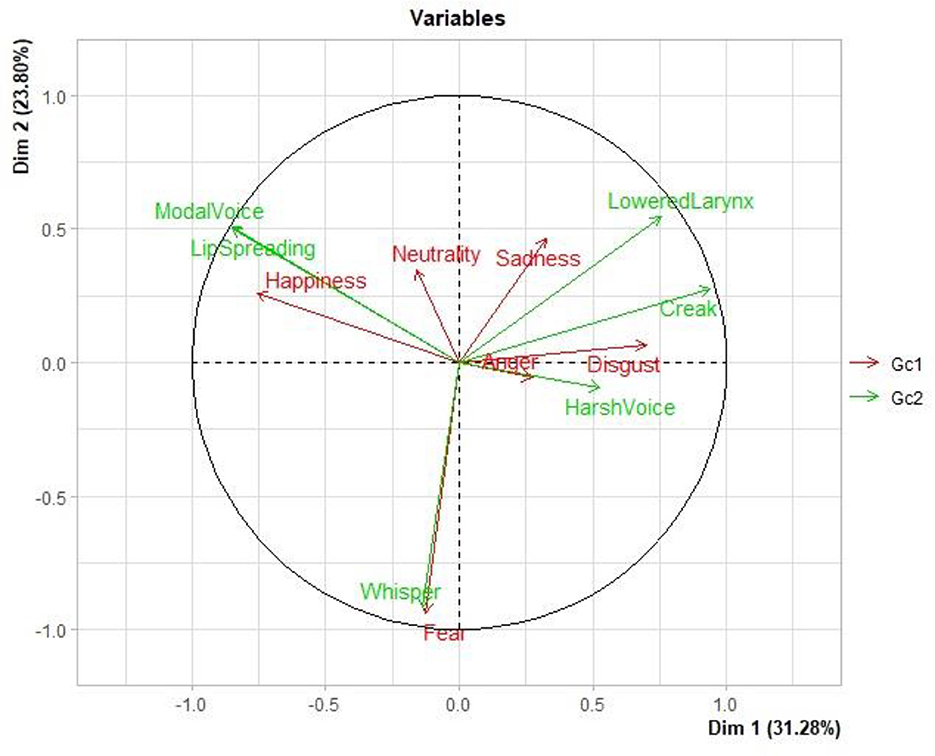
Figure 4. Distribution of the variables in dimensions 1 and 2 (Dim 1 and Dim 2).
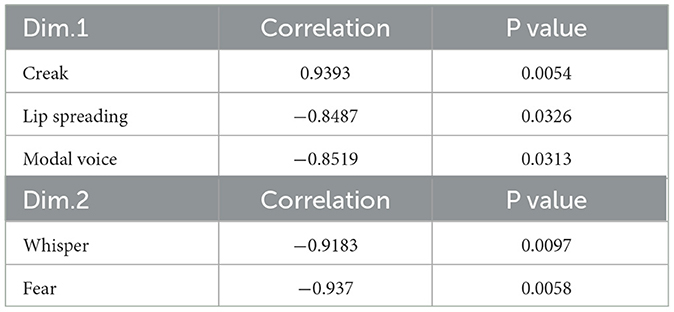
Table 6. Voice quality settings, emotions, correlation, and probability values.
3.3.6. Discussion
The judges were able to identify most facial emotion expressions with high accuracy. Except for the Fear and Whisper pairing, weaker associations of voice quality settings with facial expressions of emotions were established.
Despite the lower percentage of matchings between voice quality settings and facial emotion expressions, emotions with negative valence were associated with voice quality settings characterized by irregularity and fricative noise (Harsh and Whisper) or low pitch (Lowered Larynx), while emotions with neutral or positive valence with Lip Spreading.
Analysis of the associations between voice quality settings and facial expressions of emotions showed certain matchings and mismatchings between those two aspects. Lip Spreading and Modal Voice settings were chosen for the facial expression of Happiness; Harsh and Whisper were not chosen for the facial expression of Sadness; Whisper, Lowered Larynx, Creak, and Harsh were not chosen for Happiness; Whisper, Lip Spreading, and Modal Voice were not chosen for Anger; Lip Spreading and Modal were not chosen for Disgust; and Whisper and Harsh Voice were not chosen for Neutrality.
The matches and mismatches among face, emotion, and voice quality settings, as interpreted in accordance with the Emotion Wheel (Scherer, 2005), show primitive emotion-related valence and control features. Happiness is described as exhibiting positive Valence and high Control; Anger and Disgust, negative Valence and high Control; and Sadness and Fear, negative Valence and low Control. Taking these emotional primitives into account, associations between Happiness and Lip Spreading; among Anger, Disgust, and Harsh Voice; between Sadness and Lower Larynx Voice; and between Fear and Whisper are highlighted.
The associations of voicing and higher pitch (Lip Spreading) with Happy facial emotion expressions, of voice irregularity (Harsh Voice) with Anger and Disgust facial emotion expressions, and of voicing and lower pitch with Sadness emotion expressions, and the absence of voicing in Whisper can be considered in terms of the Frequency, Production, and Sirenic codes.
In the recognition of face and vocal expressions of emotions, the direction of the gestures, the regularity and irregularity of patterns, and the presence or absence of constriction were found to be influential factors in these associations.
Concerning vocal expression, the acoustic cues related to the presence of voice source only, voice and noise sources, and noise source only in speech production and their corresponding acoustic outputs and perceptual features related to the mean pitch influenced the listener's judgments.
Concerning facial expression, the presence or absence of muscle contraction and tenseness and the direction of the muscle movement were the influential factors in the attribution of emotions.
Synesthetically, the smiling gesture was heard (Lip Spreading) and seen (Happy face). Iconically, the downward gestures presented in Sad facial expressions and low-pitched voice qualities (Lowered Larynx and Creak) were associated with Sadness. Metaphorically, the perceptually loud rough voice produced by the Harsh voice quality setting and the sour aggressive face displaying contracted and pressed muscles represent the facial-vocal expression of Anger. Also, from a metaphorical point of view, the conflicting absence of voice and the presence of fricative airflow in the Whisper production were associated with the facial expression of fear, echoing the saying “voiceless out of fear.”
4. Conclusion
The experiments in this study considered the expressive role of voice quality settings under a sound-symbolic, synesthetic, and metaphorical perspective, focusing on the auditory impressions these settings might have on listeners' attributions of meaning effects and associations between vocal and visual features related to emotional expression.
The first experiment examined the impressionistic effects of eight voice quality settings characterized by pitch differences. The opposing auditory impressions of higher vs. lower pitched voice quality settings echoed the premises of the Frequency Code whereas the opposing auditory impressions of small vs. big size reflected metaphorical judgments of acoustic outputs of the articulatory gestures configuring the length of the resonating cavities in voice quality setting productions.
The second experiment examined the impressionistic effect of seven voice quality settings characterized by productions with the presence or absence of turbulent airflow, irregularity, and tenseness, and the results showed a strong iconic effect between sound and meaning. Voice quality settings characterized by highly turbulent airflow, irregularity, and constricted muscles were judged negatively whereas voice quality settings characterized by slightly turbulent flow, regularity, and relaxed muscles were judged positively.
The third experiment investigated associations between facial expressions of basic emotions and voice quality characteristics. Visual cues were more reliable in identifying emotions than auditory cues. Modal and Lip Spreading voice qualities were associated with high control positive valence emotions. Lowered Larynx was associated with low control and negative valence emotions, Creak and Harsh with high control negative valence emotions, and Whisper with low control negative valence.
The results of the present study encourage further research on the expressive uses of vocal quality settings and the interactions between voice and face expressions through the integration of more refined procedures, a larger, and more gender-balanced number of speakers and judges, and a wider variety of semantic descriptors to investigate the physical, psychological, sociological, and cultural aspects of the inherent multimodality scope of the use of gesture for communication.
Our investigation of the impressionistic effects of voice qualities, and associations between vocal and visual characteristics shifts the focus of sound-symbolic correspondences from speech segments to settings and gestures. In this way, it explores the four dimensions of expressivity implicit in the three Frequency, Sirenic, and Effort biological codes and in a metaphorical framework.
Data availability statement
The original contributions presented in the study are included in the article/Supplementary material, further inquiries can be directed to the corresponding author.
Ethics statement
Ethical review and approval was not required for the study on human participants in accordance with the local legislation and institutional requirements. The patients/participants provided their written informed consent to participate in this study. Written informed consent was obtained from the individual(s) for the publication of any identifiable images or data included in this article.
Author contributions
This paper contributes to the discussion of sound and meaning links by considering paralinguistic meanings associated with phonetic characteristics of voice quality settings. It also considers synesthetic associations between vocal and facial gestuality in expressing emotions. Three experiments are conducted and their results corroborate the communicative relevance of impressionistic and expressive uses of voice and face to express meanings. All authors contributed to the article and approved the submitted version.
Funding
This study was supported by the Pontifical Catholic University of São Paulo PIPEq funding Award No.: 21672.
Acknowledgments
The authors thank Dr. Plinio Barbosa and the reviewers for their valuable suggestions. SM also acknowledges a grant from PIPEQ-PUCSP No. 21672.
Conflict of interest
The authors declare that the research was conducted in the absence of any commercial or financial relationships that could be construed as a potential conflict of interest.
Publisher's note
All claims expressed in this article are solely those of the authors and do not necessarily represent those of their affiliated organizations, or those of the publisher, the editors and the reviewers. Any product that may be evaluated in this article, or claim that may be made by its manufacturer, is not guaranteed or endorsed by the publisher.
Supplementary material
The Supplementary Material for this article can be found online at: https://www.frontiersin.org/articles/10.3389/fcomm.2023.1114447/full#supplementary-material
References
Abelin, Å. (2007). “Emotional McGurk effect in Swedish,” in Proceedings of Fonetik TMH-QPSR (Stockholm) 73–76.
Abelin, Å. (2008). “Seeing glee but hearing fear? Emotional Mc Gurk effect in Swedish,” in Proceedings of Speech prosody 2008 (Campinas) 713–716.
Abelin, A. (1999). Studies in Sound Symbolism. Doctoral dissertation. Gothenburg: Göteborg University.
Ahlner, F., and Zlatev, J. (2010). Cross-modal iconicity: a cognitive semiotic approach to sound symbolism. Sign. Syst. Stud. 38. 298–348. doi: 10.12697/SSS.2010.38.1-4.11
Anikin, A., Pisanski, K., Massenet, M., and Reby, D. (2021). Harsh is large: nonlinear vocal phenomena lower voice pitch and exaggerate body size. Proc. Biol. Sci. 288, 20210872. doi: 10.1098/rspb.2021.0872
Barbosa, P. (2021). “Prosody Descriptor Extractor” [Praat script]. Available online at: https://github.com/pabarbosa/prosodyscripts/tree/master/ProsodyDescriptorExtractor (accessed June 18, 2023).
Barbosa, P. A. (2009). “Detecting changes in speech expressiveness in participants of a radio program,” in Tenth Annual Conference of the International Speech Communication Association (Brighton) 2155–2158. doi: 10.21437/Interspeech.2009-615
Blasi, D. E., Wichmann, S., Hammarström, H., Stadler, P. F., and Christiansen, M. H. (2016). Sound-meaning association biases evidenced across thousands of languages. Proc. Nat. Acad. Sci. USA. 113, 10818–10823. doi: 10.1073/pnas.1605782113
Boersma, P., and Weenik, D. (2022). “Praat: doing phonetics by computer” (Version 6.2.18), Available online at: https://www.fon.hum.uva.nl/praat/ [Computer program], online: http://www.praat.org (accessed June 18, 2023).
Cannon, W. B. (2016). Bodily Changes in Pain, Hunger, Fear and Rage: An Account of Recent Researches into the Function of Emotional Excitement. Martino Fine Books. New York, London: D. Appleton and Company.
Chen, A. J., Gussenhoven, C., and Rietveld, T. (2002). “Language-specific uses of the Effort Code,” in Proceedings of the Speech Prosody, eds. B. Bel, and I. Marlien (Aix-en-Provence: Université de Provence) 215–218.
Christensen, C. M. (1980). Effects of taste quality and intensity on oral perception of viscosity. Percept. Psychophys. 28, 315–320. doi: 10.3758/BF03204390
Crochiquia, A., Eriksson, A., Fontes, M. A., and Madureira, S. (2020). Um estudo fonético das vozes de personagens do filme Zootopia na dublagem em português brasileiro: o papel dos estereótipos. DELTA. 36, 311. doi: 10.1590/1678-460x2020360311
Dingemanse, M., Blasi, D., Lupyan, G., Christiansen, M., and Monaghan, P. (2015). Arbitrariness, iconicity, and systematicity in language. Trends Cogn. Sci. 19. 603–615. doi: 10.1016/j.tics.2015.07.013
Ekman, P. (2016). What Scientists Who Study Emotion Agree About. Perspect. Psychol. Sci. 11, 31–34. doi: 10.1177/1745691615596992
Ekman, P., and Friesen, W. V. (1976). Measuring facial movement. Environ. Psychol. Nonverbal Behav. 1, 56–75. doi: 10.1007/BF01115465
Ekman, P., Friesen, W. V., and Hager, J. C. (2002). Facial Action Coding System (2nd ed.). Salt Lake City, UT: Research Nexus eBook.
Fónagy, I. (2001). Languages within Language: An Evolutive Approach. Amsterdam: John Benjamins. doi: 10.1075/fos.13
Fontes, M. A. S. (2014). Gestualidade vocal e visual, expressão de emoções e comunicação falada. Tese de Doutorado. Pontifícia Universidade Católica de São Paulo.
Gilbert, A. N., Fridlund, A. J., and Lucchina, L. A. (2016). The color of emotion: A metric for implicit color associations. Food Quality Prefer. 52, 203–210. doi: 10.1016/j.foodqual.2016.04.007
Green, K. P., and Norrix, L. W. (1997). Acoustic cues to place of articulation and the McGurk effect: the role of release bursts, aspiration, and formant transitions. J. Speech, Lang. Hear. Res. 40, 646–655. doi: 10.1044/jslhr.4003.646
Gussenhoven, C. (2002). “Intonation and interpretation: Phonetics and phonology,” in Proceedings of the 1st International Conference on Speech Prosody (Aix-en-Provence), 47–57.
Gussenhoven, C. (2004). The Phonology of Tone and Intonation. Cambridge: Cambridge University Press. doi: 10.1017/CBO9780511616983
Gussenhoven, C. (2016). Foundations of intonation meaning anatomical and physiological factors. Topics Cogn. Sci. 8, 425–434. doi: 10.1111/tops.12197
Hewlett, N., and Beck, J. M. (2013). An Introduction to the Science of Phonetics. New York, NY: Routledge. doi: 10.4324/9780203053867
Hinton, L., Nichols, J., and Ohala, J. J. (1994). Sound Symbolism. Cambridge: Cambridge University Press.
Husson, F., Lê, S., and Pagès, J. (2009). Exploratory Multivariate Analysis by Example Using R. London: Chapman and Hall/CRC The R Series.
Jakobson, R., and Waugh, L. R. (1979). The Sound Shape of Language. Bloomington, IN: Indiana University Press and Harvester Press.
Jiang, J., and Bernstein, L. E. (2011). Psychophysics of the McGurk and other audiovisual speech integration effects. J. Exp. Psychol. Hum. Percept. Perform. 37, 1193–1209. doi: 10.1037/a0023100
Johansson, N., Anikin, A., and Aseyev, N. (2020). Color sound symbolism in natural languages. Lang. Cogn. 12, 56–83.
Kawahara, S. (2021). Phonetic bases of sound symbolism: A review. PsyArXiv [Preprint]. doi: 10.31234/osf.io/fzvsu
Keating, P., Garellek, M., and Kreiman, J. (2015). “Acoustic properties of different kinds of creaky voice. In the Scottish Consortium for ICPhs 2015,” in Proceedings of the 18th International Congress of Phonetic Sciences (Glasgow: University of Glasgow). Available online at: http://www.internationalphoneticassociation.org/icphs536proceedings/ICPhS2015/Papers/ICPHS1041.pdf
Körner, A., and Rummer, R. (2022). Articulation contributes to valence sound symbolism. J. Exp. Psychol.: Gen. 151, 1107–1114. doi: 10.1037/xge0001124
Kreiman, J., and Sidtis, D. (2011). Foundations of Voice Studies: Interdisciplinary Approaches to Voice Production and Perception. Boston, MA: Wiley-Blackwell.
Laver, J. (1976). “Language and nonverbedsal communication,” in Handbook of Perception, Vol. VII, Language and Speech, eds E. C. Carterette and M. P. Friedman (New York, NY: Academic Press), 345–362.
Laver, J. (1980). The Phonetic Description of Voice Quality. Cambridge, MA: Cambridge University Press.
Laver, J., and Mackenzie-Beck, J. (2007). Vocal Profile Analysis Scheme -VPAS [handout]. Edinburgh: Queen Margareth University College, Research Centre.
Léon, P. R. (1933). Précis de phonostylistique. Parole et expressivité, in the series Nathan Université. Paris: Nathan. Canad. J. Lisguistique/ Revue Canadienne Dee linguistique. 39, 369–371. doi: 10.107/S0008413100015590
Mackenzie Beck, J. (2005). “Perceptual analysis of voice quality: the place of vocal profile analysis,” in A Figure of Speech. A Festschrift for John Laver, eds. W. Hardcastle and J. Mackenzie-Beck (London/Mahwah, NJ: Laurence Erlbaum Associates), 285–322.
Mackenzie Beck, J. (2007). Vocal Profile Analysis Scheme: A User's Manual. Queen Margaret University College-QMUC, Speech Science Research Centre, Edinburgh, United Kingdom.
Madureira, S., and Fontes, M. A. S. (2019). “The analysis of facial and speech expressivity: tools and methods,” in Subsidia: Tools and Resources for Speech Sciences, eds. J. M. Lahoz-Bengoechea, and R. P. Ramón (Málaga: Universidade de Málaga) 1–150.
McGurk, H., and MacDonald, J. (1976). Hearing lips and seeing voices. Nature 264, 746–748. doi: 10.1038/264746a0
Monaghan, P., Shillcock, R. C., Christiansen, M. H., and Kirby, S. (2014). How arbitrary is language. Philos. Trans. R. Soc. B. Biol. Sci. 369, 20130299. doi: 10.1098/rstb.2013.0299
Morton, E. S. (1977). On the occurrence and significance of motivation-structural rules in some bird and mammal sounds. Am. Natur. 111, 855–869. doi: 10.1086/283219
Nagrani, A., Albanie, S., and Zisserman, A. (2018). “Seeing voices and hearing faces: Cross-modal biometric matching,” in Proceedings of the IEEE Conference on Computer Vision and Pattern Recognition 8427–8436. doi: 10.1109/CVPR.2018.00879
Newman, S. S. (1933). Further experiments in phonetic symbolism. Am. J. Psychol. 45, 53–75. doi: 10.2307/1414186
Nobile, L. (2019). Introduction: Sound symbolism in the age of digital orality. A perspective on language beyond nature and culture. Signifiances (Signifying). 3, XXXVI–LXVIII. doi: 10.18145/signifiances.v3i1.248
Noldus. (2022). FaceReader™ 8.1: Tool for Automatic Analysis of Facial Expressions. Wageningen, The Netherlands: Noldus Information Technology.
Ohala, J. J. (1984). An ethological perspective on common cross-language utilization of F0 of voice. Phonetica 41, 1–16. doi: 10.1159/000261706
Ohala, J. J. (1994). “The frequency codes underlies the sound symbolic use of voice pitch,” in Sound symbolism, eds. L. Hinton, J. Nichols, and J. J. Ohala (Cambridge: Cambridge University Press) 325–347. doi: 10.1017/CBO9780511751806.022
Peterfalvi, J.-M. (1965). Les recherches expérimentales sur le symbolisme phonétique. L'année Psychol. 65, 439–474. doi: 10.3406/psy.1965.27443
Poyatos, F. (1993). Paralanguage: A Linguistic and Interdisciplinary Approach to Interactive Speech and Sound. Amsterdam: Journal of Benjamins Publisher. doi: 10.1075/cilt.92
Sapir, E. (1929). A study in phonetic symbolism. J. Exper. Psychol. 12, 225–239. doi: 10.1037/h0070931
Schaeffler F. and E. Matthias Beck, J. (2019). “Towards ordinal classification of voice quality features with acoustic parameters,” in Proceedings of The Conference on Electronic Speech Signal Processing (TU Dresden) 288–295.
Scherer, K. R. (2005). What are emotions? And how can they be measured? Soc. Sci. Inf. 44, 695–729. doi: 10.1177/0539018405058216
Scherer, K. R. (2022). Theory convergence in emotion science is timely and realistic. Cogn. Emot. 36, 154–170. doi: 10.1080/02699931.2021.1973378
Scherer, K. R., Clark-Polner, E., and Mortillaro, M. (2011).” in the eye of the beholder? Universality and cultural specificity in the expression and perception of emotion. Int. J. Psychol. 46, 401–435. doi: 10.1080/00207594.2011.626049
Scherer, K. R., Dieckmann, A., Unfried, M., Ellgring, H., and Mortillaro, M. (2021). Investigating appraisal-driven facial expression and inference in emotion communication. Emotion. 21, 73–95. doi: 10.1037/emo0000693
Stevenson, R. J., and Boakes, R. A. (2004). “Sweet and sour smells: learned synesthesia between the senses of taste and smell,” in The Handbook of Multisensory Processes, eds. G. A. Calvert, C. Spence, and B. E. Stein (Boston: MIT Press) 69–83. doi: 10.7551/mitpress/3422.003.0008
Sučević, J., Janković, D., and Ković, V. (2013). The sound-symbolism effect disappears: the differential role of order and timing in presenting visual and auditory stimuli. Psychology. 4, 11. doi: 10.4236/psych.2013.47A002
Swerts, M. G. J., and Krahmer, E. J. (2006). “The importance of different facial areas for signalling visual prominence,” in Proceedings of the International. Conference on Spoken Language Processing (Conference on Spoken Language Processing (Interspeech 2006). doi: 10.21437/Interspeech.2006-377
Tsur, R. (1992). What Makes Sound Patterns Expressive? The Poetic Mode of Speech Perception. Durham, NC: Duke University Press. doi: 10.2307/j.ctv1131366
Vanger, P., Hoenlinger, R., and Haken, H. (1998). Computer aided generation of prototypical facial expressions of emotion. Methods Psychol. Res. Online 3, 25–38.
Walker, H. K. (1990). “Cranial nerve VII: the facial nerve and taste,” in Clinical Methods: The History, Physical, and Laboratory Examinations, 3rd edition. eds. H. K. Walker, W. D. Hall, and J. W. Hurst (Boston: Butterworths).
Westbury, C. (2005). Implicit sound symbolism in lexical access: Evidence from an interference task. Brain Lang. 93, 10–19. doi: 10.1016/j.bandl.2004.07.006
Woodworth, N. L. (1991). Sound symbolism in proximal and distal forms. Linguistics 29, 273–299. doi: 10.1515/ling.1991.29.2.273
Xu, Y., Kelly, A., and Smillie, C. (2013). “Emotional expressions as communicative signals,” in Prosody and Iconicity, eds. S. Hancil and D. Hirst (Amsterdam: John Benjamins) 33–60. doi: 10.1075/ill.13.02xu
Yanushevskaya, I., Gobl, C., and Chasaide, A. (2013). Voice quality in affect cueing: Does loudness matter? Front. Psychol. 4, 335. doi: 10.3389/fpsyg.2013.00335
Keywords: speech expressivity, vocal and visual prosodies, multimodal analysis, voice quality, perceptual analysis speech expressivity, perceptual analysis
Citation: Madureira S and Fontes MAS (2023) Multimodal impressions of voice quality settings: the role of vocal and visual symbolism. Front. Commun. 8:1114447. doi: 10.3389/fcomm.2023.1114447
Received: 02 December 2022; Accepted: 22 June 2023;
Published: 27 July 2023.
Edited by:
Oliver Niebuhr, University of Southern Denmark, DenmarkCopyright © 2023 Madureira and Fontes. This is an open-access article distributed under the terms of the Creative Commons Attribution License (CC BY). The use, distribution or reproduction in other forums is permitted, provided the original author(s) and the copyright owner(s) are credited and that the original publication in this journal is cited, in accordance with accepted academic practice. No use, distribution or reproduction is permitted which does not comply with these terms.
*Correspondence: Sandra Madureira, c2FuZHJhLm1hZHVyZWlyYS5saWFhY0BnbWFpbC5jb20=