 Cheng-Xian Yang
 Lauri M. Baker
 Ashley McLeod-Morin
- 1Department in Agricultural Education and Communication, University of Florida, Gainesville, FL, United States
- 2UF/IFAS Center for Public Issues Education, University of Florida, Gainesville, FL, United States
Introduction: This study determined what information presented on Twitter (X) on tickborne diseases and their prevention and investigated the relationships between content information and engagement rate. The escalating incidence of vectorborne diseases, particularly those transmitted by ticks, has emerged as a significant public health concern. Communicating tick risks effectively to the public has become an urgent issue.
Methods: A quantitative content analysis was used to examine tick-related contents to understand how this infectious disease was framed on social media, with 340 tweets comprising the final sample for this study.
Results: In Twitter communication about tick risks, over half (55.3%) of the tweets lacked any visual content. Among the tweets with visuals, static photographs and illustrations/rendered images were the most commonly employed forms. Individual persons, news, and health/governmental organizations are the main tweeters. Additionally, most tweets use situational awareness, tool acquisition, and research frames and are in loss-frame. Approximately half (48.8%) of the tweets highlight adverse consequences or frame risk preparedness in negative terms. Tweets with visual aids have higher engagement rates, while those with URLs do not. Finally, tweets use different preparedness response frames and tend to use different gain-/ loss-frames. Specifically, tweets emphasizing situational awareness to alert the public about ticks and tickborne diseases predominantly utilize loss-frames, emphasizing higher risks than tool acquisition or research frames.
Discussion: The study’s findings underscore the importance of strategic communication in public health messaging on social media. By understanding the types of content that generate higher engagement and the framing that resonates with audiences, health organizations and other stakeholders can tailor their communications better to inform the public about tick risks and prevention strategies. This could lead to more effective disease prevention efforts and a better-informed public ready to take appropriate actions to protect themselves from tickborne diseases.
Introduction
The majority of the pathogen species (61%) that cause human diseases are zoonotic, which means that the infection is transmissible between animals and people (Taylor et al., 2001). Vector-borne diseases fall into this category. These human illnesses are caused by the bites of arthropods, such as mosquitoes, ticks, and black flies, that carry parasites, viruses, and bacteria (World Health Organization, 2020). Cases of vector-borne diseases in the United States have doubled in recent years, from 22,527 in 2004 to 48,610 in 2016, suggesting that it is a growing public health problem (Rosenberg et al., 2018). Human activities such as travel, trade, and certain climate and environmental shifts have facilitated the swift spread of vector-borne diseases (Petersen et al., 2019; Rocklöv and Dubrow, 2020), exacerbating vector-borne disease situations. Besides mosquitoes, which may transmit viruses causing Zika, dengue fever, and West Nile virus disease, ticks are also considered culprits behind the high number of cases of infectious disease (Rosenberg et al., 2018; Petersen et al., 2019).
Ticks and the infectious pathogens they carry threaten human and animal health worldwide (Jongejan and Uilenberg, 2004). According to the Centers for Disease Control and Prevention (CDC), ticks are organisms that can carry pathogens and cause human diseases, potentially creating serious health issues for people (CDC, 2022a,b). The most common vector-borne disease in the United States is Lyme disease, which is caused by a bacterium transmitted through the bite of infected blacklegged ticks (Ixodes scapularis) to humans (CDC, 2022a,c). Ticks also transmit the Powassan virus. Powassan virus disease has a 10% fatality rate and may cause long-term harm in patients, such as encephalitis, meningitis, and memory loss (CDC, 2021). In addition, tick feeding results in reduced productivity and lameness in economic animals (e.g., cattle and horses), as well as loss of appetite, lethargy, and fever in companion animals (Jongejan and Uilenberg, 2004; Bolin, 2020). Therefore, reducing the risks of tickborne disease is a necessary task.
Good communication strategies in media about diseases can improve people’s understanding and their decision-making and behaviors, impacting disease prevention (Cairns et al., 2013; Ophir and Jamieson, 2021). It is important to educate the public about tick prevention. Since adult ticks are only approximately 3–5 mm in length and nymphs biting people are even smaller, it is difficult for people to recognize these living creatures. Providing enlarged photos of a tick is a common way to let the public recognize its appearance and can make people more aware of the appearance of ticks and process the information, as a previous study indicates that visual elements work better to communicate health and risk messages to the public health (Sleigh et al., 2021). In addition, Levings (2012) emphasized that well-prepared responses can effectively reduce the spread of zoonotic diseases, while Baker et al. (2020) recommended that media include these responses to zoonotic diseases to motivate the public to avoid risks.
Although tickborne diseases pose health hazards, content analysis studies related to these hazards were less prominent in the literature than the topic of mosquito-borne diseases in the United States, and the tick studies mostly focused on misinformation on websites or news (Cooper and Feder, 2004; Shapiro et al., 2017). There were still gaps in research on how social media frame tickborne diseases. In the context of risk, communicating with the public through social media can provide opportunities for real-time updates and increase public engagement and two-way communication (Fearn-Banks, 2016). Among social platforms, Twitter (now renamed as X) is one of the most used and well-established social media platforms, and it is widely used to communicate public emergencies, natural disasters, and epidemics (Kostkova et al., 2014; Sleigh et al., 2021).
Therefore, this study analyzed the framing of posts related to tickborne diseases to understand the current discussions on ticks, tickborne diseases, and prevention on Twitter. This study also examined the visual and textual information that Twitter users are more likely to interact with to ascertain how communication efforts and frames changed over time in a year. This study contributes to risk communication and public health research in a timely manner and has important implications for practice.
Literature review
Risk communication on social media
Social media play an important role in healthcare, social welfare, and public education; therefore, it should reach target audiences at all stages of the disease to improve their preparedness and effectiveness in responding to and maintaining public safety (Fearn-Banks, 2016). In recent years, social media have been widely used to spread information about the risk of disease due to its two qualities: communication with the public in real-time and enhancing public engagement with its two-way communication nature.
First, social media have high immediacy of risk communication with the public. More specifically, it can quickly respond to the emergence of social conditions. In the communication of infectious diseases, social media have also become the main channel for public understanding and response (Malecki et al., 2021). When a major risk or crisis occurs, relevant social media posts tend to increase in number (Kostkova et al., 2014; Shan et al., 2014).
In addition, interactions in risk communication with the public can be categorized into three types: one-way, two-way, or multidimensional (Avidar et al., 2015). Government agencies typically employ one-way communication (Boholm, 2019), where the public is seen as having limited knowledge and relies on experts for information. However, this approach may give the impression that scientific information is inaccessible, which hinders effective scientific communication (Reiher, 2017; Walravens, 2020). Social media make communication two-way. It enables the general population to participate in discussions and promote public engagement (Taylor and Kent, 2014; Avidar et al., 2015). Two-way communication not only empowers the public, instilling a sense of agency and responsibility in their quest for health knowledge, but also enables scientists to gain deeper insights into the public’s level of understanding, allowing them to offer tailored information or address specific informational needs (Yuan et al., 2017). Thus, by calculating the engagement rate on Twitter, it is possible to assess the quality of tweets and the extent to which people engage with issues through social media.
Visual information about science issues on social media
Information communicated through social media can be roughly divided into two categories: visual and textual information. The former contains various non-textual contents, such as photos, illustrations, graphs, videos, GIFs, or a mix of these (Adami and Jewitt, 2016). Communicating risks with visual aids brings several advantages. First, with the aid of visuals, communication barriers due to language can be reduced when educating people from diverse backgrounds and reading levels (Madera et al., 2013). In disease communication research, visual information is also believed to affect readers’ emotions and thinking styles and increase persuasiveness, further improving their learning process (Joffe, 2008; Avgerinou and Pettersson, 2011). Finally, when an infectious disease outbreak occurs, visual information on social media quickly catches readers’ eyes, making risk-reducing messages stand out among many (Sleigh et al., 2021). Adding visual aids can increase the effectiveness of health risk communication without high additional costs (Garcia-Retamero and Cokely, 2011). To sum up, appropriate visual information in the posts helps facilitate risk communication. When social media disseminate disease information with the aid of visuals, it may be easier to interact with online people, thereby increasing public engagement in issues.
Framing science issues on social media
Framing is a common approach to analyzing how risks are communicated using social media. Frames are used in mass media research to explain how media present the content (Tankard, 2001). By emphasizing and excluding information, a communicator can select textual information to communicate public issues (Entman, 1993). The popularity of social media provides a platform for the public to exchange risk information, which is a way of rapid mass self-communication. Social media can use multiple kinds of textual information to frame diseases and their prevention, such as response behaviors to the disease and increase or decrease in risks (Ophir and Jamieson, 2021; Sleigh et al., 2021).
Information about society’s responses and behaviors to risk is integral to disease communication. To mitigate losses from zoonotic diseases, Levings (2012) outlined essential steps: (1) situational awareness (understanding threats to prepare appropriate countermeasures), (2) tool acquisition (selecting, ordering, and receiving tools to deal with the spread of disease), (3) research (conducting comprehensive research, such as identification of pathogens, antigens, and immune responses, and application and commercialization of technologies), (4) modeling (systematically describing objects or phenomena that share important characteristics with the objects or phenomena. The results of the modeling can help to plan future decisions and interventions), (5) training and exercises (training personnel for specific roles to manage the disease and develop skills that can better respond to risks), (6) animal movement traceability (being able to trace an item or group of items from a point in the supply chain to another), and (7) policy development (providing guidelines and positions relevant to decision-making) (Levings, 2012). The general population without a professional background may only be able to share the first two basic preparations through social media. However, when experts and the government release more advanced disease information, the general population can still interact with them to gain a deeper understanding of risk preparation information. Through social media, experts or the government can quickly convey key information to the public and patients to assist them in taking risk-reducing responses to the disease (Malecki et al., 2021).
Additionally, how social media frame risks should also be considered when communicating public health issues. Tversky and Kahneman (1992) developed prospect theory, which examines the persuasiveness of information about the positive results of performing a health-promoting behavior and the negative consequences of not performing the behavior. According to prospect theory, gain-framed information is considered more convincing with clear event outcomes and low risks. The content of these frameworks tends to include the fact that the diseases are controllable and risks can be effectively reduced by taking some actions. Conversely, loss-framed information is better at communicating riskier and more uncertain issues (Tversky and Kahneman, 1992). Some tweets can highlight the risk as severe or deadly to make the public issue a high-risk (Carslaw, 2008; Boyd et al., 2009). Gain- and loss-frames were widely applied to risk communication to understand whether public health issues are high or low risk (Lu, 2016; Sleigh et al., 2021). Although communication about public health risks should use the loss-framed message to ensure public compliance with prevention methods (Sleigh et al., 2021), some studies argued that it may lead to the opposite effect of what was expected (Bester, 2015), such as causing public unrest. More research is needed to determine whether the gain- or loss-frame is better when communicating ticks and tickborne disease information on social media.
Credibility of sources
Sources are commonly used in analyzing textual information on risk communication. Analyzing risk communication about health issues reveals widespread misinformation, such as incomplete Lyme disease information on Twitter and non-governmental websites (Cooper and Feder, 2004). Trustworthy sources, such as health and government organizations, are crucial for enhancing public confidence in social media information, highlighting the need for accurate, reliable health communication (Sleigh et al., 2021; Baydilli and Selvi, 2022). Therefore, tweets from the government and mainstream news media on vector-borne disease communication are more likely to be retweeted frequently (Yoon et al., 2019). Providing credible sources when communicating on social media can make disease information more transparent and prevent the spread of misinformation. Therefore, this study examined from which communicators these tweets came from and whether the tweets contained external links to support their claims.
Objective
This study aimed to analyze how tickborne diseases and their prevention were depicted through images and narratives on Twitter. It also explored how the nature of the content influenced user engagement rates. Based on the purpose of the research, a quantitative content analysis was used to identify what information about ticks and their disease appeared on Twitter. Then, the relationships between these content elements and engagement rate were explored. We also discussed how the risk information on Twitter is presented and inferred based on the results of data analysis. This study proposed four research questions:
RQ1: How do tweets frame risk from ticks with content information, including visual elements, preparedness strategies, health outcome frames, primary sources of the tweets, and the use of URLs?
RQ2: What is the engagement rate of tweets?
RQ3: How do tweet frames and engagement rates change over time within a year?
RQ4: What is the relationship between the content elements and the engagement rate of tweets?
1. Do tweets with specific content elements (visual information, URLs, and different frames) have a higher engagement rate?
2. Do tweets with different preparedness response frames tend to be presented in different health gain-/loss-frame?
Methods
Data collection and extraction
This study determined social media discussions about tickborne illness to understand how this infectious disease was framed. Researchers in this study selected Twitter as a representative social media platform because it is a widely used channel for people to acquire information and is commonly used for risk communication when data are collected. Since this study was conducted, Twitter has been renamed to X, but the authors will refer to Twitter by its original name since that was the platform’s name during the data collection period. Approximately 70% of adult Twitter users in the United States receive news from this platform (Odabas, 2022). In addition, public health information can easily be disseminated on Twitter during outbreaks and pandemics (Yoon et al., 2019; Sleigh et al., 2021).
To better understand the cycle of communicating ticks and tickborne diseases through social media, this study analyzed related posts between November 2021 and October 2022 to observe trends over time. This period allows for observing peak tick seasons, the effectiveness of prevention measures over time, and public awareness or concern levels at various points within a year. To maximize the collection of tweets intended for this study, nine keywords were used to scrape the tweet data with Boolean logic. Specifically, tweets must have contained “ticks” and at least one of the following keywords, including some related to preventing ticks and diseases, such as “prevent” and “protect” (CDC, 2022b); some about removing ticks, such as “attach,” “bite,” and “remove” (CDC, 2022d); and disease-related keywords such as “Lyme,” “disease,” and “tickborne” (CDC, 2022c). Since the public engagement of Twitter users was our focus, we kept the tweets with at least one reply, one like, and one retweet as the minimum limit. Tweets needed to be in English (both image and tweet text). Through these filters, we perused each tweet and retained tweets that included the preparedness for ticks and tickborne diseases. This study included 340 tweets as the final sample.
In addition, Twitter engagement can be calculated as (replies + likes + retweets)/total number of followers (Lauron, 2022; Mention, n.d.). A higher number means higher engagement with the tweet.
Codebook
This study coded visual and textual data to analyze the content of the tweets systematically. First, according to Adami and Jewitt (2016), the visual criteria were used. This study trimmed the criteria into the following categories to make it a better fit to this study: (1) graphs, (2) illustrations or rendered pictures, (3) still photographs, (4) moving photographs, and (5) composite graphics.
The preparedness response frames were based on Levings (2012) but were modified to include six frames to understand the application of the preparedness response frames on Twitter, including (1) situational awareness, which can be further divided into three subgroups, including general tick knowledge about ticks, syndrome and reaction after a tick bite, and the risk/disease spread, (2) specific prevention, (3) research, (4) modeling, (5) training and exercises, and (6) policy development. Through this framing criteria, this study can better understand what types of prevention of tickborne illness were mostly suggested on social media.
In addition, according to prospect theory (Tversky and Kahneman, 1992), we built the gain-/loss-frame to understand the incline of discussion on Twitter as a risk communication strategy and to see if the trend changes in different periods. The frame of this part is divided into (1) health gain-frame/low-risk, (2) health loss-frame/high-risk, and (3) no-tendency. Note that when a tweet has both gain- and loss-frames, it is classified as a no-tendency frame.
Finally, this study sought to determine more about the “tweeters” who post tweets and the sources when discussing tick issues. We examined the tweet producers of these posts and identified them as the source inductively. Sources were divided into seven categories: (1) health or governmental organization, (2) private sector, (3) news media or publications, (4) individual persons, (5) academic institutions, (6) online blogs with information about ticks and diseases, and (7) others. We also analyzed whether the tweets contained links from external sources (URLs). Table 1 shows all the detailed applications of the frames in the codebook.
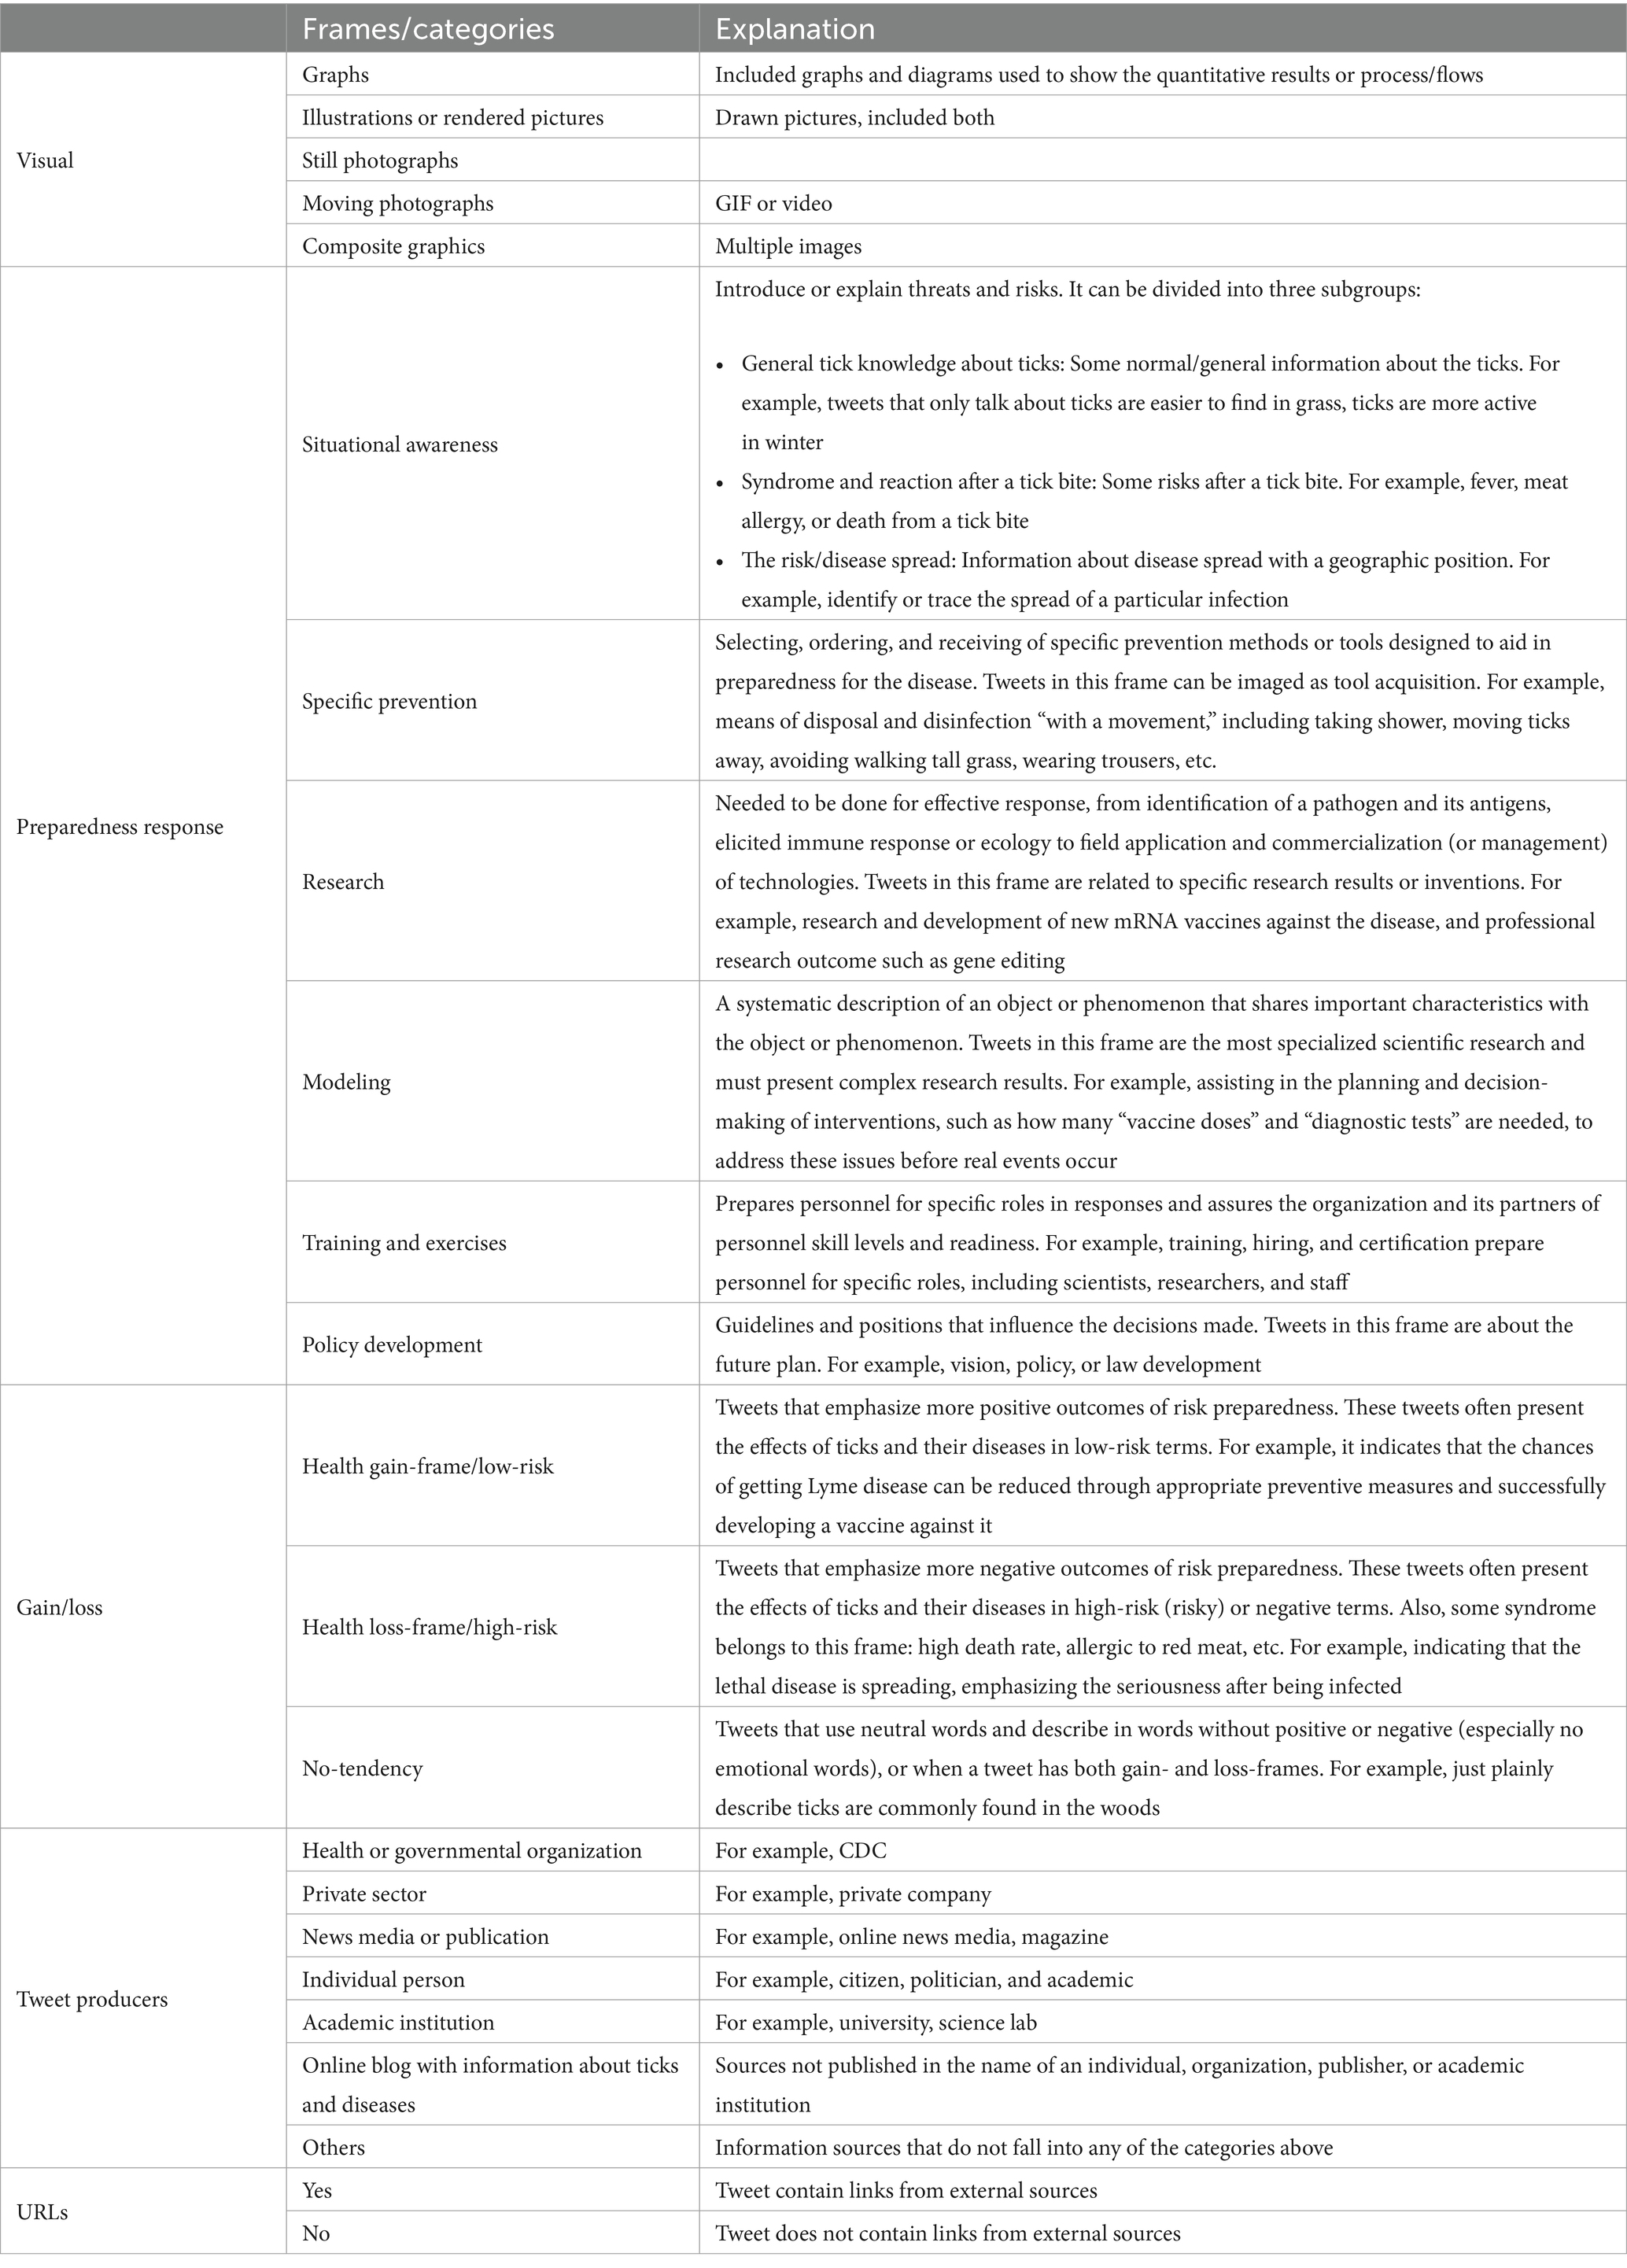
Table 1. Codebook—applications of the frames.
Data analysis
This study first coded extracted data based on the codebook to analyze the content. We selected two coders trained to assist with the coding test to ensure the codebook was credible. Inter-coder reliability agreement was measured by Cohen’s Kappa to establish coding validity (Cohen, 1960), which is a suitable measure of agreement for nominal data. A sample size comprising 10% of the tweet dataset was selected. Cohen suggested the Kappa result be interpreted as follows: values ≤0 as indicating no agreement and 0.01–0.20 as none to slight, 0.21–0.40 as fair, 0.41–0.60 as moderate, 0.61–0.80 as substantial, and 0.81–1.00 as almost perfect agreement. Reliability scores for the preparedness response and health gain-/loss-frames are 0.70 and 0.64, respectively, which are both acceptable (Cohen, 1960; McHugh, 2012).
After establishing intercoder reliability, the remaining tweets were coded using the same codebook and procedures to maintain consistency. All data were recorded in an Excel spreadsheet to ensure a thorough organization and facilitate detailed analysis. This structured approach allowed for efficient sorting, filtering, and statistical analysis of the coded tweets, enhancing the reliability of the findings. Furthermore, the spreadsheet format enabled a systematic review of data trends and patterns.
Next, we manually entered and calculated the percentage of tweets that use visual information to aid in communicating tickborne diseases. Descriptive statistics were used to calculate the total number of interactions across the retained tweets, including replies, likes, and retweets, to see how people on Twitter tend to interact with tickborne disease and prevention. We also aggregated these interactions for each tweet and divided them by the number of followers on the account to obtain a public engagement rate. According to the definition of Mention (n.d.), the engagement rates were divided into four categories, namely need improvement (engagement rate lower than 0.005%) = 1, not bad (engagement rate = 0.005–0.037%) = 2, good (engagement rate = 0.037–0.098%) = 3, and awesome (engagement rate higher than 0.098%) = 4. The average engagement rate on Twitter is 0.037; thus, a rate above 0.037% is considered a good result (Lauron, 2022; Mention, n.d.). The study categorized tweets based on their portrayal of risk using a gain/loss frame, rating them from 1 to 3 to reflect low- to high-risk levels. Additionally, tweets are re-coded as containing informational content (either visual aids or URLs) with a value of 1 or lacking such content with a value of 0. Finally, we applied t-tests and analysis of variance (ANOVA) using SPSS 29.0 to examine if the engagement rates of tweets varied with visual elements and different framing techniques.
The study utilized quantitative results to perform qualitative content analysis, interpreting the context and significance of the data. It effectively uncovered how visual and textual content on Twitter influence public engagement levels.
Results
Visual information properties
This study investigated the five sub-items of RQ1 to examine how they are represented in tweets. We first focused on the amount and percentage of tweets about ticks and tickborne diseases that communicate with visual information. More than half of the tweets did not include images (n = 188, 55.3%), and tweets with visual aids were mainly still photographs (n = 86, 25.3%) and illustrations or rendered pictures (n = 40, 11.8%). Photographs and illustrations are the main approaches when conveying this kind of information through Twitter.
Textual information and frames
This study categorized preparedness responses to tick and tickborne disease risks into six types, finding nearly half fit to the situational awareness category. The remaining tweets lacked a consistent theme. Tweets utilizing situational awareness in discussing ticks and tickborne diseases are diverse, allowing classification into three specific subgroups. These include general knowledge about ticks (n = 55, 16.2%), syndrome and reactions to tick bites (n = 74, 21.8%), and information on the risk and spread of diseases transmitted by ticks (n = 31, 9.1%), reflecting the wide-ranging nature of public discourse on this health issue. Specific prevention (n = 92, 27.1%) and research frames (n = 77, 22.6%) are the second and third most frequently used tweet topics on Twitter. Tweets about specific prevention included methods of using appropriate tools or strategies to combat ticks and tickborne diseases, such as using tick repellents, wearing long pants and socks, and removing ticks with tweezers correctly. Research on response topics indicated that these topics focused on the research and new technologies to be applied against ticks, such as anti-tick mRNA vaccines and gene editing technology CRISPR. Research on the pathogens that ticks carry also belonged to this category; for example, “Scientists uncover Borrelia bacteria’s method of avoiding human immune defenses.” The other three response categories are uncommon (n = 5), with only three tweets about training and exercises for professionals and two related to the future direction of policy development. This study did not discover tweets belonging to the “modeling” topic.
Approximately half of the tweets presented information in loss-frames (n = 166, 48.8%), which means that most tweets tend to describe ticks and tickborne disease as high-risk, for example, indicating infected ticks are more likely to survive the cold or emphasizing tickborne diseases can be lethal. On the contrary, 28.8% of tweets presented information in gain-frames. Most of these tweets emphasized that the current technologies can effectively control the risks caused by ticks or that future development can predict promising results. For instance, “Tick mRNA vaccine may help avoid Lyme disease.” This result highlighted that content about risk and uncertainty is more likely to be presented on Twitter. The remaining tweets (22.4%) belong to the no-tendency frame.
“Tweeters” and sources
Individual people were the most likely source of tweets on ticks and tickborne disease (n = 136, 40.0%), followed by news media/publication (n = 73, 21.5%) and health/governmental organization (n = 68, 20.0%). The private sector was least likely to tweet about ticks and tickborne diseases (n = 9, 2.6%). This result is similar to the COVID-19 tweets research of Sleigh et al. (2021). Approximately 80% of tweets contained URLs (n = 270), allowing users to read more information. Among the tweets without URLs attached, only 12 of them did not include visual information in the posts, which means that more than 96% of the tweets had at least one traceable external link or visual aid. Figure 1 shows the analysis results about ticks and tickborne disease.
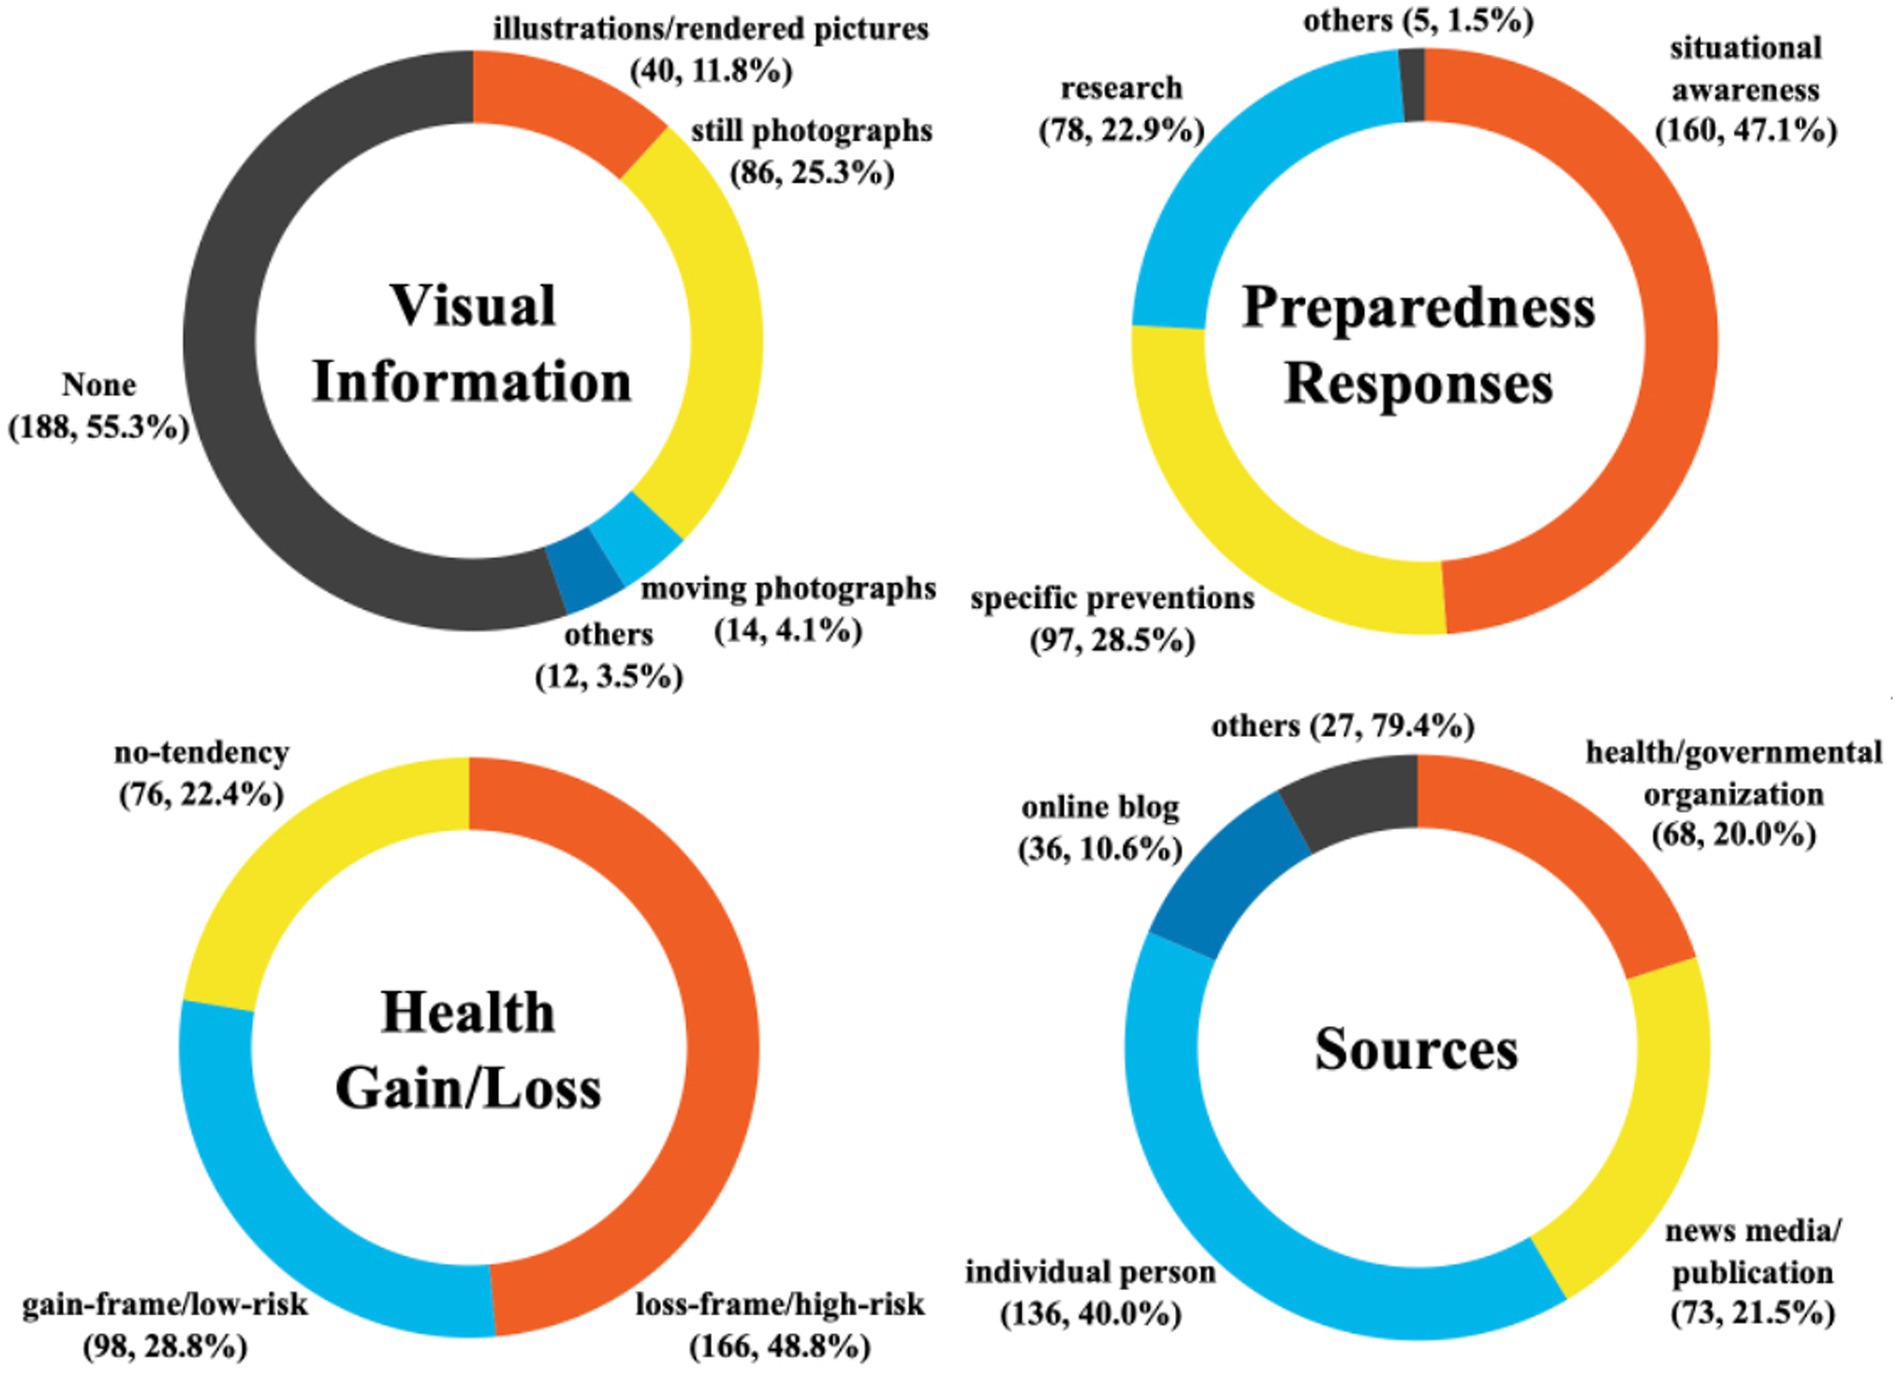
Figure 1. Descriptive statistics of tweets about ticks and tickborne disease (n, %).
Public engagement on Twitter
To answer our RQ2, the sample of this study showed that 219 (64.4%) tweets had public engagement rates higher than the median and 175 (51.5%) arrived at the “awesome engagement rate” threshold, which is much better than the median (Mention, n.d.). More than half of the tweet accounts with an engagement rate above the median had less than 10,000 followers; however, tweets with engagement rates below the median (n = 121, 35.6%) had 24,000–28,484,000 followers.
Time changes in frames and engagement rate within a year
The RQ3 aimed to explore how frames and engagement rates change at different times. When listing tweets from November 2021 to October 2022, it can be seen that May has the most tweets being posted (n = 69). Months with fewer tweets are January, September, and October, with only 16, 14, and 12 tweets, respectively. This study explored how the three elements, preparedness response frames, gain-/loss-frames, and engagement rate, changed over time. We first analyzed preparedness responses of tweets, finding that a higher proportion of tweets belonged to the situational awareness frame in January (68.8%) and June (59.4%); in November (80.6%) and December (64.7%), a high proportion of tweets are related to research; while March (42.9%) and May (40.6%) are the time when the tool acquisition frame appears most frequently.
The results showed that a higher proportion of tweets in January (75.0%), June (73.0%), and September (71.4%) used a loss-frame, which tended to emphasize higher risks of ticks and tickborne diseases. Conversely, a higher proportion of tweets presented this scientific topic with gain-frames in November (77.8%) and December (58.8%). In addition, approximately 60% of the tweets in each month had a public engagement rate higher than 0.037%, especially in January. More than 90% of tweets with an engagement rate above the median were posted in January. The trend changes within a year are shown in Figure 2.
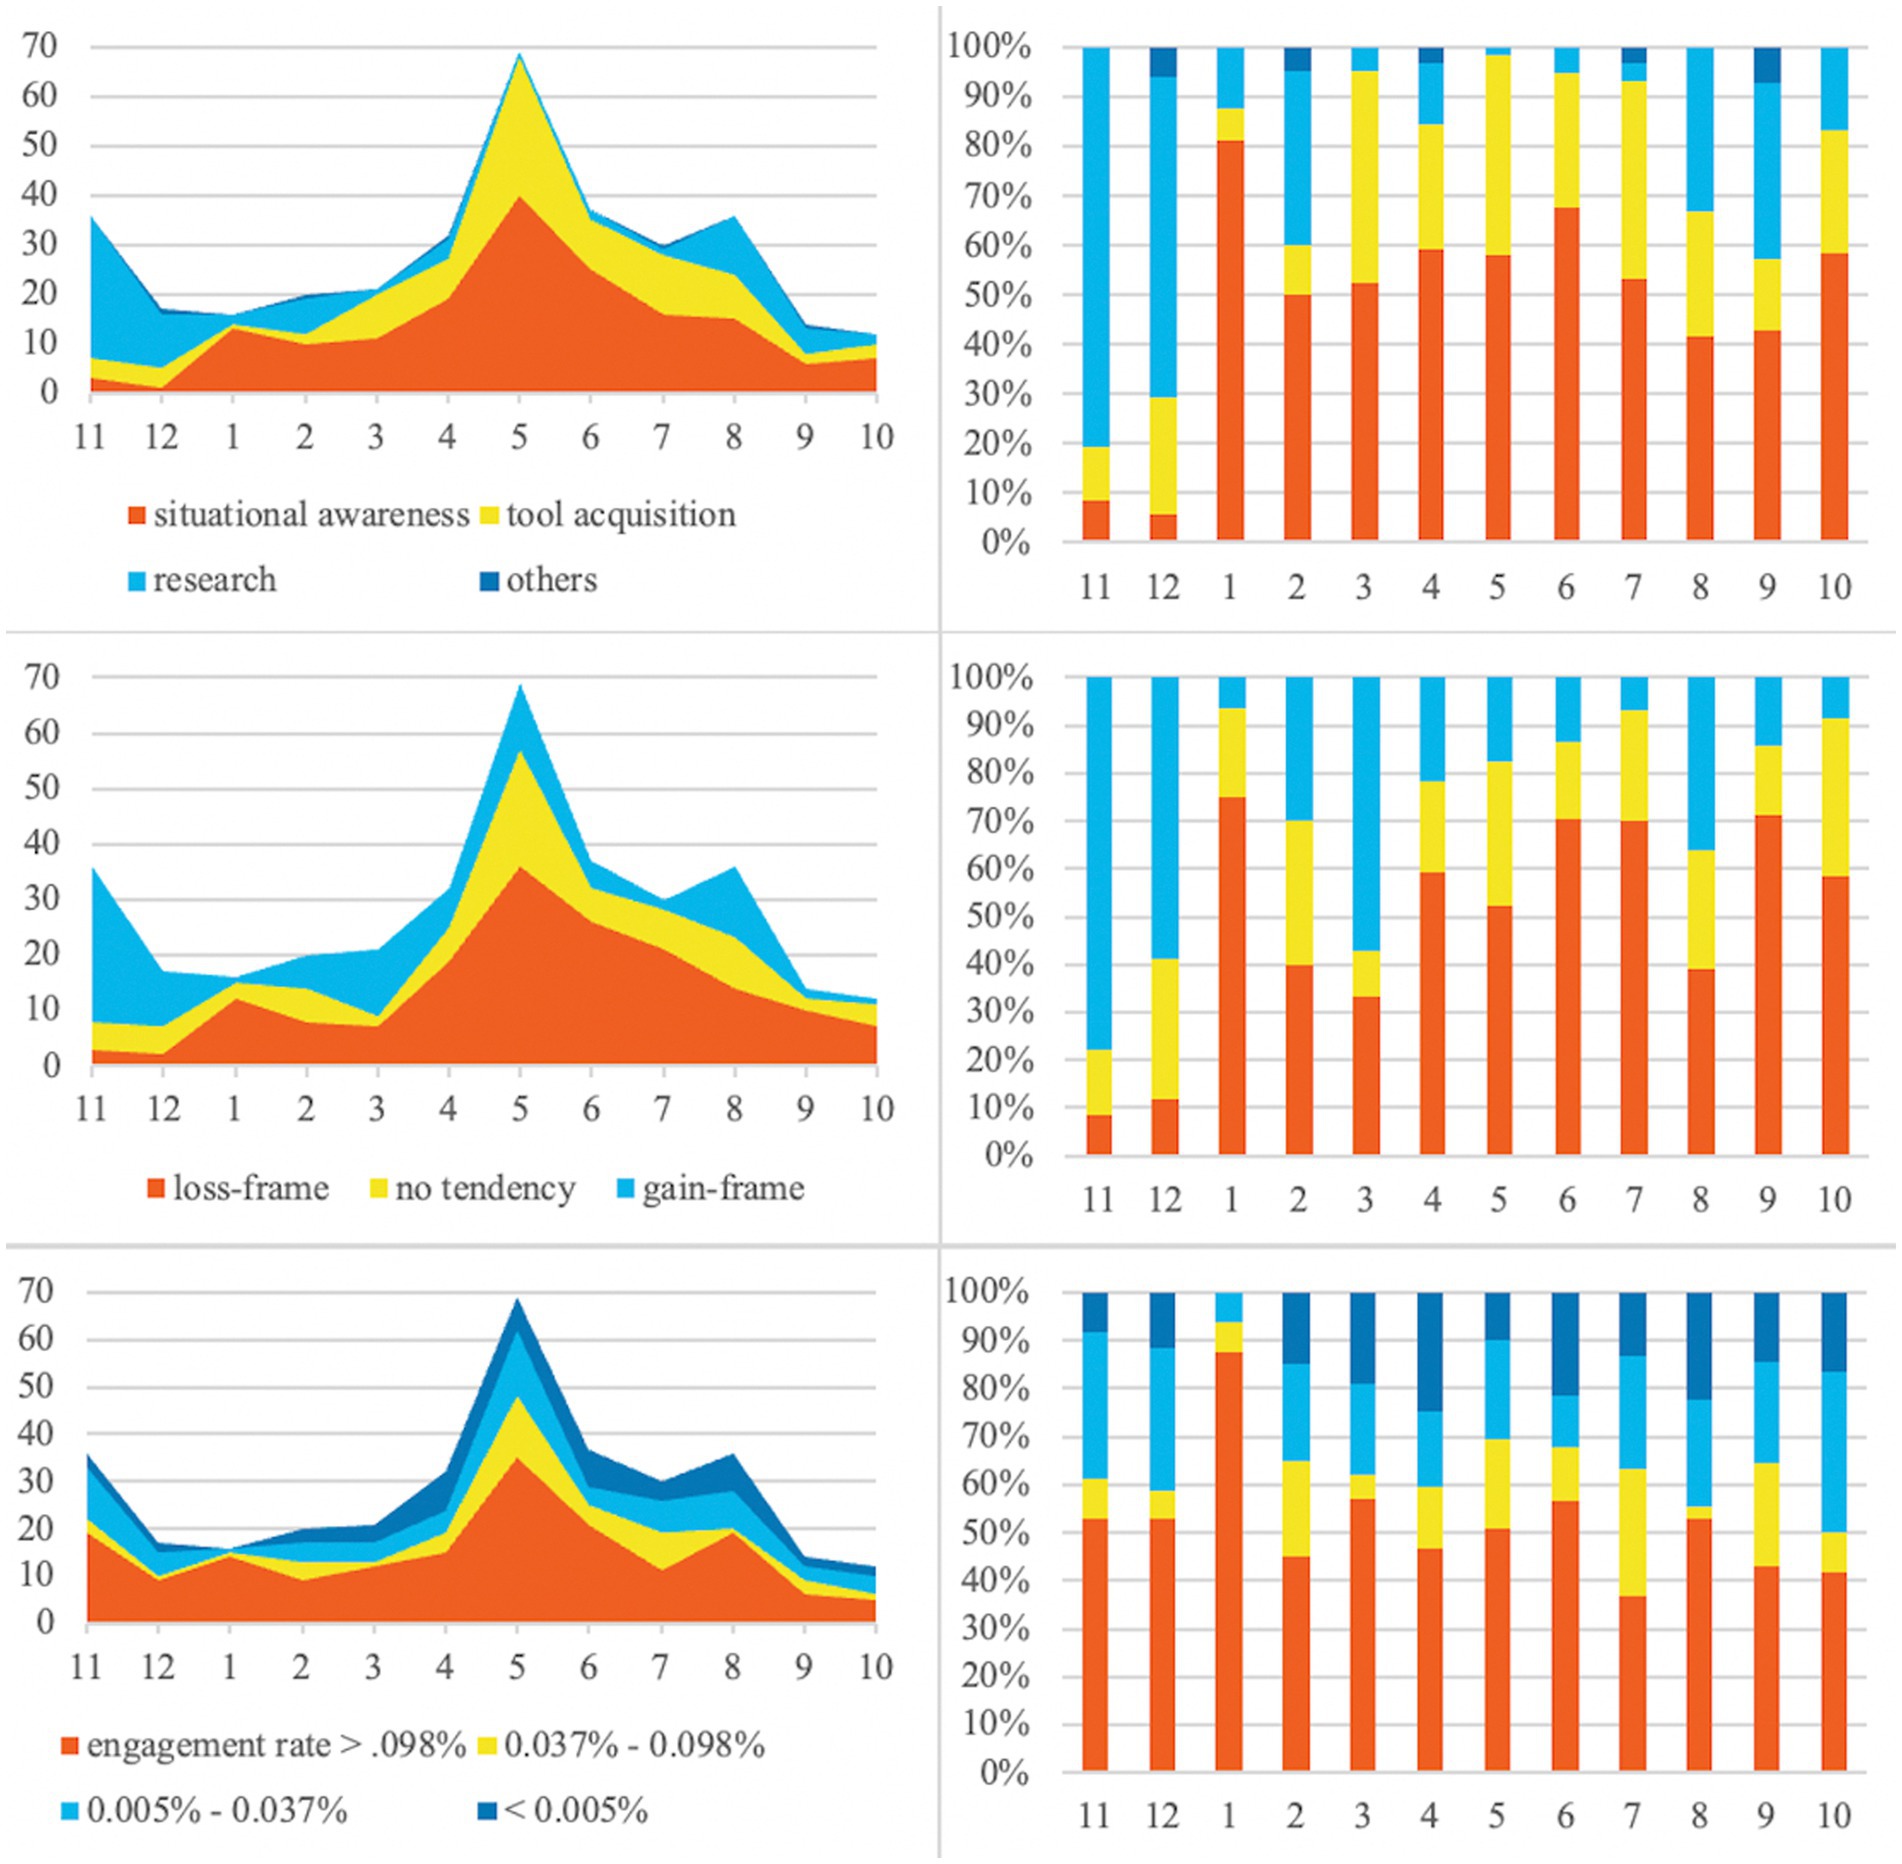
Figure 2. Frames and engagement rates trends that change by month within a year (x-axis = month, y-axis = the number of tweets/percentage of tweets).
Engagement rate, visual information, and frames
We analyzed tweets with what content information has a higher engagement rate to answer our first sub-item of RQ4. A two-tailed independent sample t-test including visual information or not as the independent variable and engagement rate as the dependent variable was significant, t(338) = −2.74, p = 0.006, such that the engagement rate was higher in the tweets with visual information (M = 3.20, SD = 1.07) than without (M = 2.86, SD = 1.19). On the contrary, tweets with URLs or not had different results, t(150.73) = 6.61, p < 0.001, such that the engagement rate was lower in the tweets with URL (M = 2.84, SD = 1.17) than without (M = 3.64, SD = 0.82). Additionally, the results did not show a significant difference in engagement rates between tweets using different preparedness response frames and with gain- or loss-frames.
Additionally, a one-way ANOVA was used to explore whether tweets with different preparedness response frames were presented in different gain-/loss-frames. The results revealed that the one-way ANOVA was statistically significant, F(5, 334) = 77.14, p < 0.001, partial eta squared = 0.54. Post-hoc comparisons using the Scheffe correction revealed that tweets belonging to the three subgroups under situational awareness frames, general tick knowledge, syndrome and reaction, and risk/disease spread, were more inclined to present information with higher risks, while tweets with research frames presented lower risks. The results are shown in Table 2.
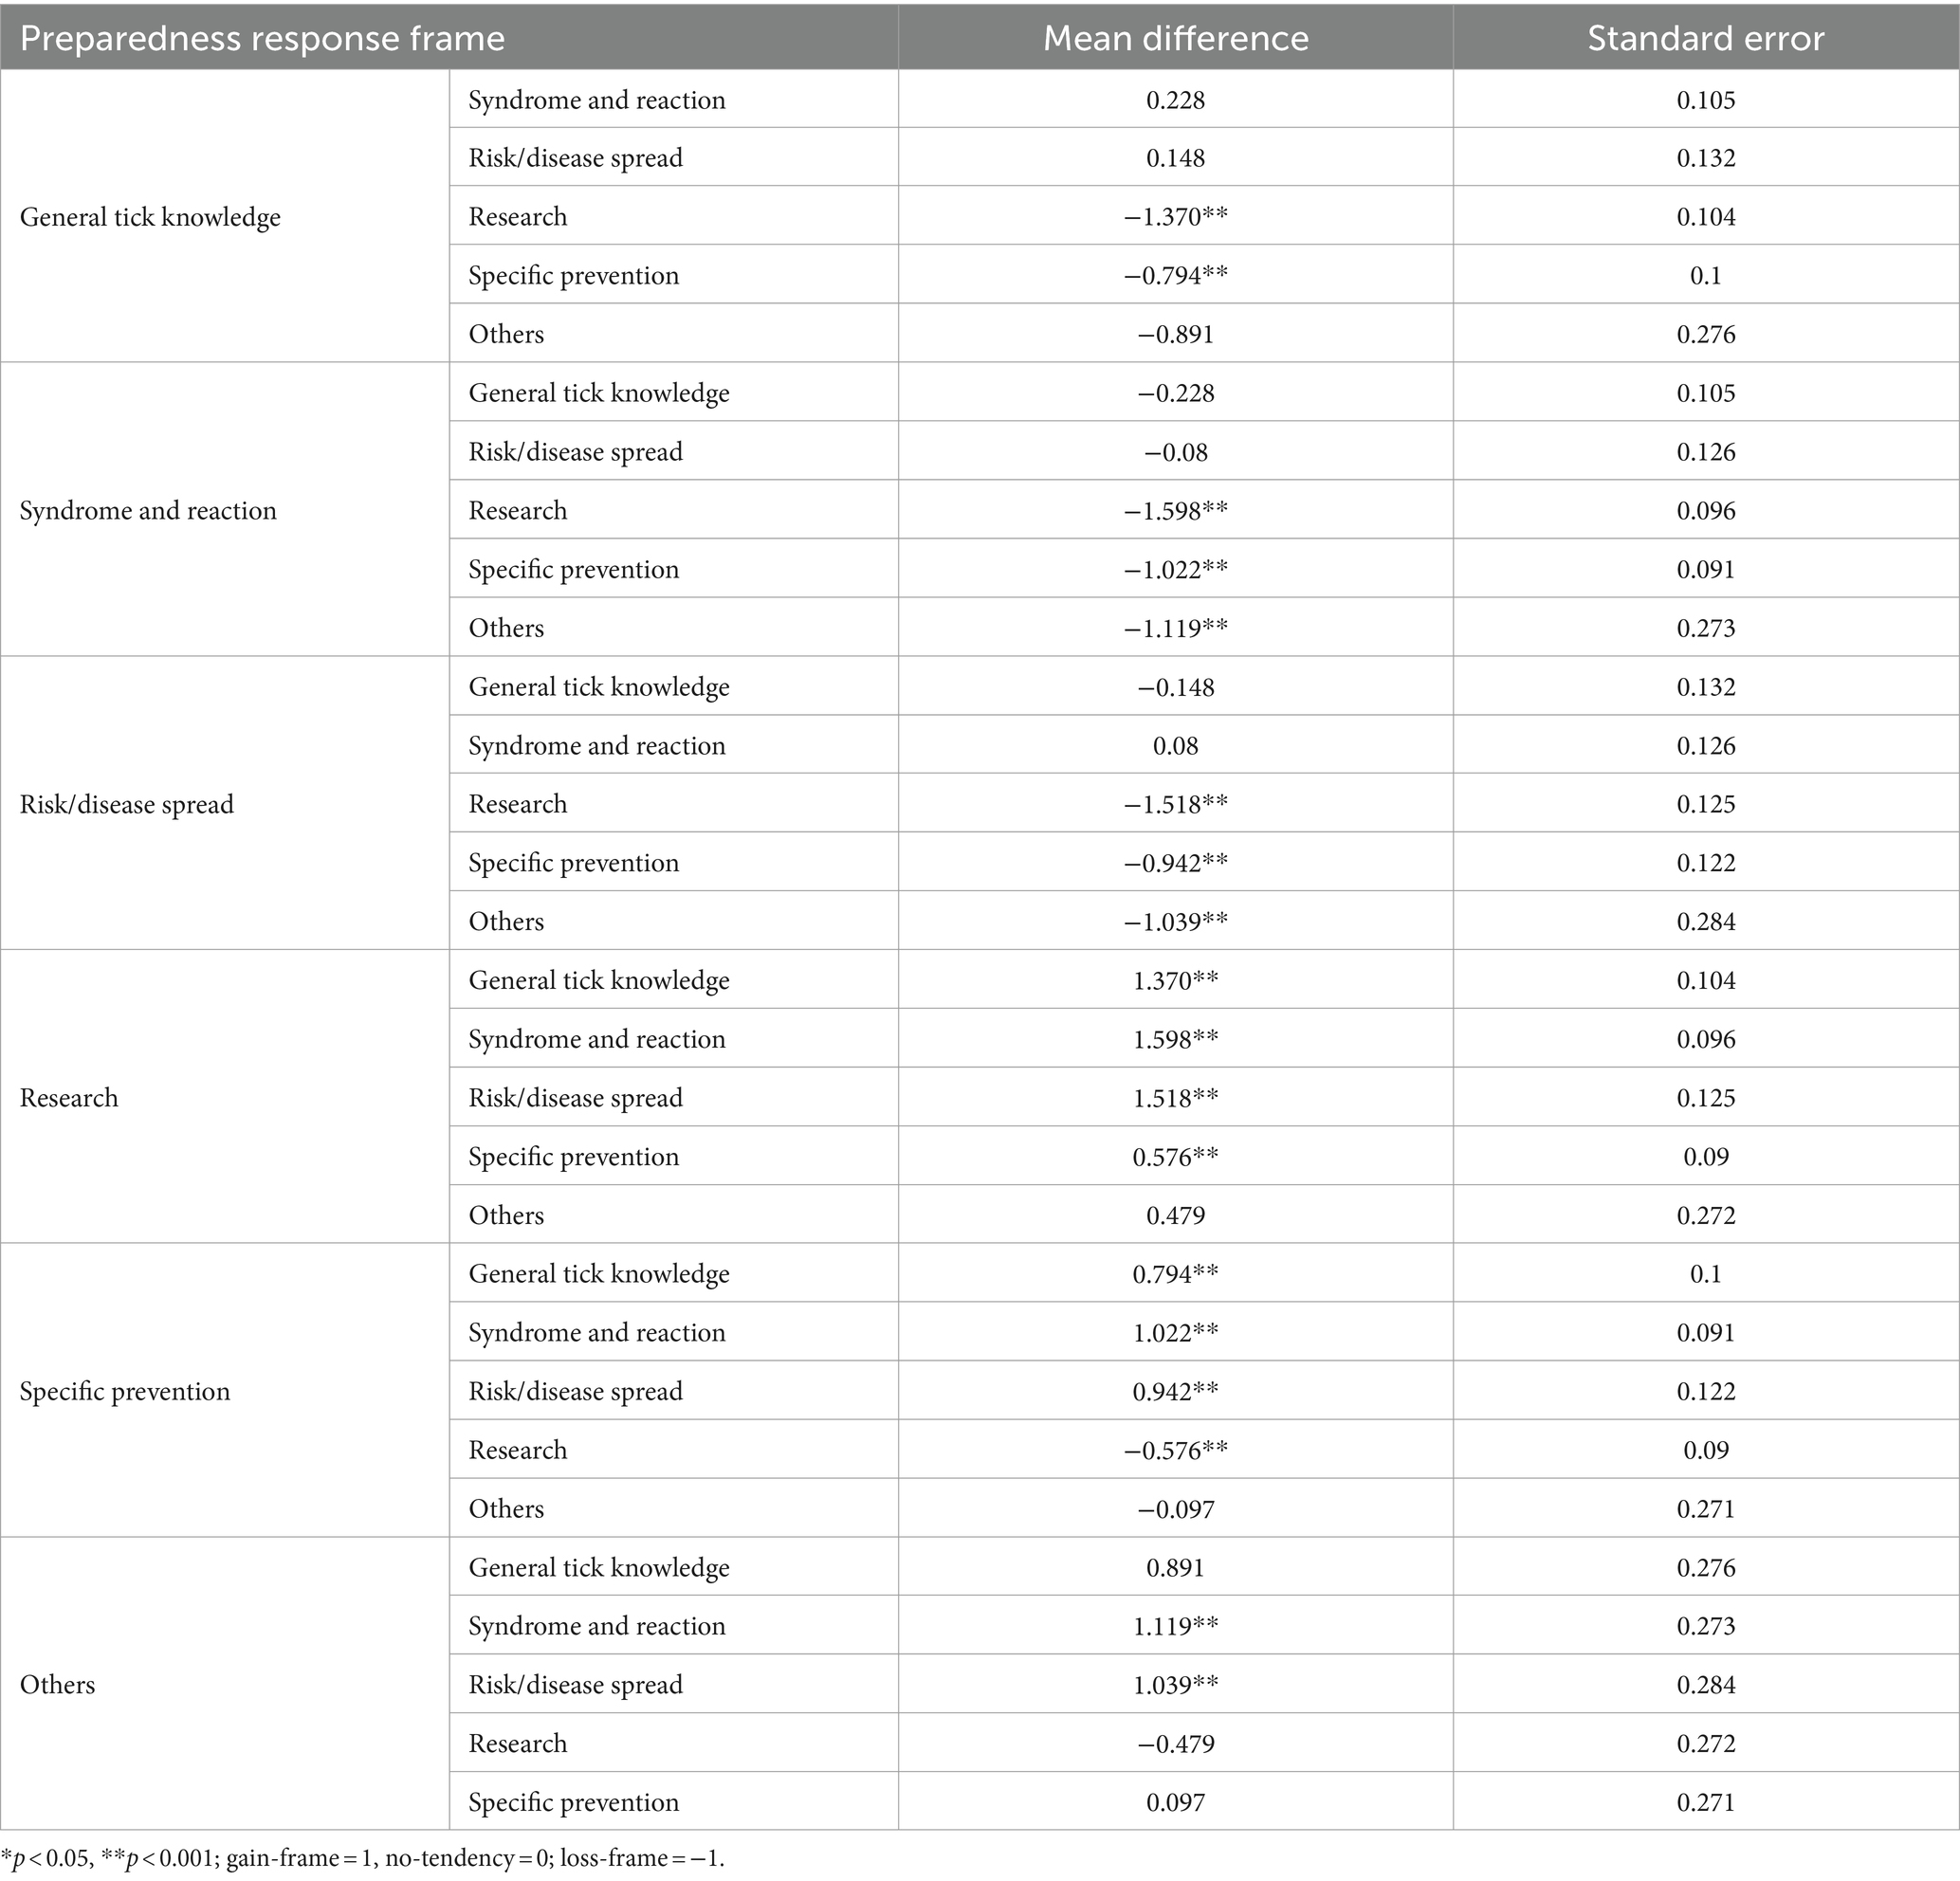
Table 2. Difference of risk presentation between preparedness response frames.
Discussion and conclusion
This study aimed to better understand how social media present information about ticks, tickborne diseases, and preventive measures. As one of the most widely used social media, Twitter has approximately 450 million monthly active users, and approximately 500 million tweets were posted on this platform every day until 2022 (Ruby, 2022). By analyzing tweets, this study discovered the risk information content and engagement rate on Twitter. The relationships between content information, engagement rate, and different frames were also explored.
Tweets focus on similar preparedness response frames
The preparedness response frame of this study was established by Baker et al. (2020) and is derived from strategic plans and concepts of operations for zoonotic disease proposed by Levings (2012). A comparison of the results of Baker et al. (2020) and this study revealed that nearly half of the information in both studies presents zoonotic disease in a situational awareness frame. However, by analyzing the information on the official website (the CDC and United States Department of Agriculture websites), the former found that the other preparedness response frames in the codebook exist. In contrast, most tweets in our analysis on ticks and tickborne diseases focus on situational awareness, specific prevention, or research frames.
Two possible reasons lead to the difference between the preparedness response frames used by official websites and social media. Twitter has a word limit of tweets that are of no more than 280 characters, and even only 5% of the tweets exceed 190 characters (Ruby, 2022). It is hard for communicators to describe complicated scientific information succinctly on this platform, causing these frames (situational awareness, specific prevention, and research frames) to be frequently used because the general population may more easily understand them. In addition, relaxing entertainment, expressive information sharing, and social interaction are the most common motivations for people to use social media (Smock et al., 2011). Some preparedness information, such as some professional modeling experiments, requires more explanation to communicate with the general population or policy development. The complexity and need for detailed explanations often result in such critical information being underrepresented or simplified on platforms like Twitter. Therefore, content that can be communicated succinctly and aligns with social media’s social and interactive nature tends to dominate, impacting the variety and depth of preparedness responses shared.
Tweets with visual information have higher engagement rates, while URLs have the opposite
Visual information can improve the effectiveness of health risk communication. Photographs and illustrations are the most commonly used visual aids in this study, which echoes previous findings that these two images are the most used aids when communicating public health information on social media (Sleigh et al., 2021). This study also indicated that tweets that include visual aids can increase the public engagement rate. It can not only lower the barriers for the public to understand scientific information but also encourage people to participate in the dialogue through interaction to respond to risks on social media (Garcia-Retamero and Cokely, 2011; Madera et al., 2013).
On the contrary, tweets with URLs have lower engagement rates than tweets without URLs when talking about tick issues. Communicators attach the URLs to provide credible sources or further extended knowledge beyond the content of tweets. When people click on the URL, it increases the public’s engagement rate of the post (Zamani et al., 2020); nevertheless, previous studies indicated that tweets containing URLs do not always mean that tweets have higher engagement rates when in different topics (Han et al., 2019). In addition, the clickthrough rate in tweets is less than 2% and decreases as the number of followers of the account increases (Patal, 2017). This finding implied that people may not frequently click on links for additional information, indicating a potential limitation in relying solely on URLs to disseminate information.
However, it does not mean that tweets should not have URLs. When communicating tick risks and preparedness, communicators can still provide external links to increase the credibility of the information and have additional information beyond the word limit of the tweet. What communicators should do is provide enough information instead of relying entirely on URLs, lest users ignore the message due to the other contents of the tweet being too brief or incomprehensible. Communicators cannot assume that all readers will click on the hyperlink for further details.
The number and frames of ticks and tickborne diseases tweets changed due to the external environments
The study first examined the overall trend in the number of tweets within a year. By examining the distribution of tweets within a year, it showed that the peak of the number of tweets is in summer, especially in May. This finding overlaps with the seasons when ticks are more active (CDC, 2020). Almost all the preparedness responses focused on warnings about the risks of ticks and tickborne diseases and the tools and methods to deal with them during May and hardly any tweets about the research topic (lower than 2%). During the tick-prone season, communicators tend to tweet more frequently to reflect the current spatio-temporal context (Kostkova et al., 2014; Shan et al., 2014) and choose topics that fit into the situation to communicate risk information.
In addition to seasons, other external factors contribute to the fluctuations in the number of tweets or the percentage of preparedness response frames (Sleigh et al., 2021), such as the revelation of new knowledge and research results. For example, tweets increased in November when research showed that an mRNA vaccine could protect against Lyme disease, even during the off-season for ticks. Additionally, findings shared in January about ticks’ survival in cold temperatures and the link between tick bites and meat allergies led to more situational awareness-focused tweets. Some examples are “A study has shown ticks infected with #LymeDisease are more adept at surviving colder temps than ticks not infected.” and “Random science fact: you can develop a meat allergy from a lone star tick bite.” This demonstrates how social media can quickly adapt to share important health information and respond to new risks (Merchant and Lurie, 2020), emphasizing its value for timely public health communication.
Tweets with different preparedness response frames presented in different gain-/loss-frames
The results of ANOVA showed a relationship between the two frames in this study. Tweets with different preparedness response frames present different levels of risk. When tweets explain situational awareness to warn the public about ticks and tickborne diseases, they are more likely to use loss-frames, which are significantly higher risks than tool acquisition or research frames.
The situation can also be found in the percentage of preparedness response frames in each month. For instance, tweets are more likely to use high-risk words during tick-infested summer. We observed that the proportion of tweets posted in the gain-frame between April and July is lower than that in other months. Additionally, a high percentage of high-risk scientific knowledge tweets are posted in January, making this period within a year with the highest percentage of loss-frames tweets. Large amounts of tweets related to forward-looking vaccine development against Lyme disease belong to the research frame they showed in November and December, and they are inclined to use gain-frames to present lower risk in these tweets.
The threshold for the general population to join the conversation remains high
Even though the two-way communication nature of social media lowered the barriers for the general population to engage in scientific discussions, a high entry condition still exists before understanding professional information and joining in the communication of ticks and tickborne diseases.
Planning and responding to public needs is the way to develop an effective communication strategy through social media (Malecki et al., 2021), and communicating public issues with images is one of the best ways (Madera et al., 2013; Sleigh et al., 2021). However, less than half (44.7%) of the tweets in this study contain visual information, and some tweets use difficult words or long sentences, such as “@Yale researchers have developed an mRNA #LymeDisease vaccine that targets antigens found in tick saliva to alert individuals to tick bites as well as prevent the tick from feeding Correctly, reducing its ability to transmit pathogens.” Based on the literacy statistics, 54% of American adults have literacy below the 6th-grade level (Think Impact, n.d.); using too much jargon related to technology or science on social media and without visual aids is like erecting a high wall to block the public without background knowledge, hindering them from fully understanding the content of tweets.
Limitations
This study has some limitations. First, we used keywords to collect and extract data and restricted samples to at least one reply, one like, and one retweet as the minimum limit for better analyzing the public engagement rate of tweets, which meant excluding some potentially relevant tweets. This study acknowledged that, while manual content extraction from Twitter allows for targeted and specific data collection, it may introduce a selection bias and overlook some tweets. Several steps were taken to minimize its impact, including coder training and reliability checks. Another limitation is that this study only included tweets in English, so the results may not reflect global trends. This study applied the preparedness response frame from Baker et al. (2020) and Levings (2012), which may limit the categories of tweet topics. However, this study stated that it is a reasonable and effective frame because it can be well-applied when communicating zoonotic disease preventive actions.
Conclusion and recommendations
Despite the limitations, this study still has some contributions. To the best of our knowledge, this study is the first to analyze visual information and frames of tick risk communication on Twitter. We also examined current communication situations and the relationships between content and public engagement rates. These findings can improve the understanding of zoonotic diseases presented on social media.
Twitter can be a tool for people to exchange information about how to prevent the spread of vector-borne diseases. Future research should apply different frames of this scientific issue or choose specific communicators for in-depth analysis on social media. In addition, some animals that cause vector-borne diseases, such as fleas or black flies, have not received much attention. Future research can also investigate this topic. It is important to understand how social media present zoonotic disease, which can help communicators modify existing strategies and communicate the disease and risk prevention effectively.
Data availability statement
The original contributions presented in the study are included in the article/Supplementary material, further inquiries can be directed to the corresponding author.
Author contributions
C-XY: Conceptualization, Data curation, Formal analysis, Methodology, Project administration, Visualization, Writing – original draft. LB: Conceptualization, Data curation, Funding acquisition, Resources, Supervision, Writing – review & editing. AM-M: Data curation, Resources, Writing – review & editing.
Funding
The author(s) declare financial support was received for the research, authorship, and/or publication of this article. This publication was supported by Cooperative Agreement Number U01CK000662 from the Centers for Disease Control and Prevention. Its contents are solely the responsibility of the authors and do not necessarily represent the official views of the Centers for Disease Control and Prevention or the Department of Health and Human Services.
Conflict of interest
The authors declare that the research was conducted in the absence of any commercial or financial relationships that could be construed as a potential conflict of interest.
Publisher’s note
All claims expressed in this article are solely those of the authors and do not necessarily represent those of their affiliated organizations, or those of the publisher, the editors and the reviewers. Any product that may be evaluated in this article, or claim that may be made by its manufacturer, is not guaranteed or endorsed by the publisher.
Supplementary material
The Supplementary material for this article can be found online at: https://www.frontiersin.org/articles/10.3389/fcomm.2024.1339356/full#supplementary-material
References
Adami, E., and Jewitt, C. (2016). Social media and the visual. Vis. Commun. 15, 263–270. doi: 10.1177/1470357216644153
Avgerinou, M. D., and Pettersson, R. (2011). Toward a cohesive theory of visual literacy. J. Vis. Lit. 30, 1–19. doi: 10.1080/23796529.2011.11674687
Avidar, R., Ariel, Y., Malka, V., and Levy, E. C. (2015). Smartphones, publics, and OPR: do publics want to engage? Public Relat. Rev. 41, 214–221. doi: 10.1016/j.pubrev.2014
Baker, L. M., McLeod-Morin, A. N., Kent, K. W., and Lindsey, A. B. (2020). No online information outbreak: a quantitative content analysis of the CDC and USDA websites for available information on zoonotic disease. Adv. Agric. Dev. 1, 25–37. doi: 10.37433/aad.v1i1.19
Baydilli, N., and Selvi, I. (2022). Is social media reliable as a source of information on Peyronie’s disease treatment? Int. J. Impot. Res. 34, 295–301. doi: 10.1038/s41443-021-00454-3
Bester, J. C. (2015). Vaccine refusal and trust: the trouble with coercion and education and suggestions for a cure. J. Bioethic. Inq. 12, 555–559. doi: 10.1007/s11673-015-9673-1
Boholm, Å. (2019). Risk communication as government agency organizational practice. Risk Anal. 39, 1695–1707. doi: 10.1111/risa.13302
Bolin, S.. (2020). Tiny arachnids with a big bite—let’s talk ticks. Available at: https://cvm.msu.edu/vdl/client-education/newsletter/summer-2020/tiny-arachnids-with-a-big-bite-lets-talk-ticks. (Accessed October 8, 2022)
Boyd, A. D., Jardine, C. G., and Driedger, S. M. (2009). Canadian media representations of mad cow disease. J. Toxic. Environ. Health A 72, 1096–1105. doi: 10.1080/15287390903084629
Cairns, G., De Andrade, M., and MacDonald, L. (2013). Reputation, relationships, risk communication, and the role of trust in the prevention and control of communicable disease: a review. J. Health Commun. 18, 1550–1565. doi: 10.1080/10810730.2013.840696
Carslaw, N. (2008). Communicating risks linked to food–the media’s role. Trends Food Sci. Technol. 19, S14–S17. doi: 10.1016/j.tifs.2008.06.007
CDC. (2020). Preventing tick bites Available at: https://www.cdc.gov/ticks/avoid/on_people.html. (Accessed November 30, 2022).
CDC. (2021). Symptoms, diagnosis, and treatment. Available at: https://www.cdc.gov/powassan/symptoms.html#:~:text=Symptoms%20of%20severe%20disease%20include,people%20with%20severe%20disease%20die. (Accessed October 8, 2022)
CDC. (2022a). Diseases transmitted by ticks. Available at: https://www.cdc.gov/ticks/diseases/index.html. (Accessed October 8, 2022)
CDC (2022b). Tickborne diseases of the United States: a reference manual for healthcare provides. 6th Edn Available at: https://www.cdc.gov/ticks/tickbornediseases/TickborneDiseases-P.pdf.
CDC. (2022c). Available at: Lyme disease. https://www.cdc.gov/lyme/index.html#:~:text=Lyme%20disease%20is%20the%20most,bite%20of%20infected%20blacklegged%20ticks. (Accessed October 8, 2022)
CDC. (2022d). Tick removal. Available at: https://www.cdc.gov/ticks/removing_a_tick.html. (Accessed November 27, 2022)
Cohen, J. (1960). A coefficient of agreement for nominal scales. Educ. Psychol. Meas. 20, 37–46. doi: 10.1177/001316446002000104
Cooper, J. D., and Feder, H. M. Jr. (2004). Inaccurate information about Lyme disease on the internet. Pediatr. Infect. Dis. J. 23, 1105–1108. doi: 10.1097/01.inf.0000145411.57449.f3
Entman, R. M. (1993). Framing: toward clarification of a fractured paradigm. J. Commun. 43, 51–58. doi: 10.1111/j.1460-2466.1993.tb01304.x
Garcia-Retamero, R., and Cokely, E. T. (2011). Effective communication of risks to young adults: using message framing and visual aids to increase condom use and STD screening. J. Exp. Psychol. Appl. 17, 270–287. doi: 10.1037/a0023677
Han, X., Gu, X., and Peng, S. (2019). Analysis of tweet Form’s effect on users’ engagement on Twitter. Cogent Bus. Manag. 6:1564168. doi: 10.1080/23311975.2018.1564168
Joffe, H. (2008). The power of visual material: persuasion, emotion and identification. Diogenes 55, 84–93. doi: 10.1177/0392192107087919
Jongejan, F., and Uilenberg, G. (2004). The global importance of ticks. Parasitology 129, S3–S14. doi: 10.1017/S0031182004005967
Kostkova, P., Szomszor, M., and St. Louis, C. (2014). # swineflu: the use of Twitter as an early warning and risk communication tool in the 2009 swine flu pandemic. ACM Trans. Manag. Inf. Syst. 5, 1–25. doi: 10.1145/2597892
Lauron, S. (2022). What is a good engagement rate on Twitter?. Available at: https://www.rivaliq.com/blog/good-engagement-rate-twitter/#:~:text=According%20to%20our%202022%20Social,industries%2C%20from%20fashion%20to%20nonprofits. (Accessed November 27, 2022)
Levings, R. L. (2012). Emerging and exotic zoonotic disease preparedness and response in the United States–coordination of the animal health component. Zoonoses Public Health 59, 80–94. doi: 10.1111/j.1863-2378.2012.01495.x
Lu, H. (2016). The effects of emotional appeals and gain versus loss framing in communicating sea star wasting disease. Sci. Commun. 38, 143–169. doi: 10.1177/1075547015619173
Madera, J. M., Dawson, M., Neal, J. A., and Busch, K. (2013). Breaking a communication barrier: the effect of visual aids in food preparation on job attitudes and performance. J. Hosp. Tour. Res. 37, 262–280. doi: 10.1177/1096348012436376
Malecki, K. M., Keating, J. A., and Safdar, N. (2021). Crisis communication and public perception of COVID-19 risk in the era of social media. Clin. Infect. Dis. 72, 697–702. doi: 10.1093/cid/ciaa758
McHugh, M. L. (2012). Interrater reliability: the kappa statistic. Biochem. Med. 22, 276–282. doi: 10.11613/BM.2012.031
Mention. (n.d.) Twitter engagement calculator. Available at: https://mention.com/en/twitter-engagement-calculator/
Merchant, R. M., and Lurie, N. (2020). Social media and emergency preparedness in response to novel coronavirus. JAMA 323, 2011–2012. doi: 10.1001/jama.2020.4469
Odabas, M. (2022). 10 facts about Americans and Twitter. Pew Research Center. Available at: https://www.pewresearch.org/fact-tank/2022/05/05/10-facts-about-americans-and-twitter/. (Accessed October 8, 2022)
Ophir, Y., and Jamieson, K. H. (2021). The effects of media narratives about failures and discoveries in science on beliefs about and support for science. Public Underst. Sci. 30, 1008–1023. doi: 10.1080/10410236.2018.1536958
Patal, N.. (2017). 14 ways to increase your clickthrough rate on Twitter. Available at: https://blog.hubspot.com/marketing/twitter-increase-clickthrough-rate. (Accessed December 2, 2022)
Petersen, L. R., Beard, C. B., and Visser, S. N. (2019). Combatting the increasing threat of vector-borne disease in the United States with a national vector-borne disease prevention and control system. Am. J. Trop. Med. Hyg. 100, 242–245. doi: 10.4269/ajtmh.18-0841
Reiher, C. (2017). Food safety and consumer trust in post-Fukushima Japan. Jpn. Forum 29, 53–76. doi: 10.1080/09555803.2016.1227351
Rocklöv, J., and Dubrow, R. (2020). Climate change: an enduring challenge for vector-borne disease prevention and control. Nat. Immunol. 21, 479–483. doi: 10.1038/s41590-020-0648-y
Rosenberg, R., Lindsey, N. P., Fischer, M., Gregory, C. J., Hinckley, A. F., Mead, P. S., et al. (2018). Vital signs: trends in reported vectorborne disease cases—United States and territories, 2004–2016. Morb. Mortal. Wkly Rep. 67, 496–501. doi: 10.15585/mmwr.mm6717e1
Ruby, D.. (2022). Twitter statistics: facts and figures after Elon Musk takeover. Available at: https://www.demandsage.com/twitter-statistics/
Shan, L., Regan, Á., De Brún, A., Barnett, J., Van der Sanden, M. C., Wall, P., et al. (2014). Food crisis coverage by social and traditional media: a case study of the 2008 Irish dioxin crisis. Public Underst. Sci. 23, 911–928. doi: 10.1177/0963662512472315
Shapiro, E. D., Baker, P. J., and Wormser, G. P. (2017). False and misleading information about Lyme disease. Am. J. Med. 130, 771–772. doi: 10.1016/j.amjmed.2017.01.0
Sleigh, J., Amann, J., Schneider, M., and Vayena, E. (2021). Qualitative analysis of visual risk communication on Twitter during the COVID-19 pandemic. BMC Public Health 21, 1–12. doi: 10.1186/s12889-021-10851-4
Smock, A. D., Ellison, N. B., Lampe, C., and Wohn, D. Y. (2011). Facebook as a toolkit: a uses and gratification approach to unbundling feature use. Comput. Hum. Behav. 27, 2322–2329. doi: 10.1016/j.chb.2011.07.011
Tankard, J. W. Jr. (2001). “The empirical approach to the study of media framing” in Framing public life (New York: Routledge), 111–121.
Taylor, M., and Kent, M. L. (2014). Dialogic engagement: clarifying foundational concepts. J. Public Relat. Res. 26, 384–398. doi: 10.1080/1062726X.2014.956106
Taylor, L. H., Latham, S. M., and Woolhouse, M. E. J. (2001). Risk factors for human disease emergence. Philos. Trans. R. Soc. B 356, 983–989. doi: 10.1098/rstb.2001.0888
Think Impact (n.d.). Literacy statistics. Available at: https://www.thinkimpact.com/literacy-statistics/#:~:text=Nationwide%2C%20on%20average%2C%2079%25,literacy%20below%206th%20grade%20level. (Accessed September 26, 2023)
Tversky, A., and Kahneman, D. (1992). Advances in prospect theory: cumulative representation of uncertainty. J. Risk Uncertain. 5, 297–323. doi: 10.1007/BF00122574
Walravens, T. (2020). Radiated food and risk communication in post-Fukushima Japan. Dublin Gastronomy Symposium
World Health Organization. (2020). Vector-borne diseases. Available at: https://www.who.int/news-room/fact-sheets/detail/vector-borne-diseases. (Accessed October 8, 2022)
Yoon, J., Hagen, L., Andrews, J., Scharf, R., Keller, T., and Chung, E. (2019). On the use of multimedia in Twitter health communication: analysis of tweets regarding the Zika virus. Inf. Res. 24:823.
Yuan, S., Oshita, T., AbiGhannam, N., Dudo, A., Besley, J. C., and Koh, H. E. (2017). Two-way communication between scientists and the public: a view from science communication trainers in North America. Int. J. Sci. Educ., Part B 7, 341–355. doi: 10.1080/21548455.2017.1350789
Keywords: agricultural science, content analysis, health communication, public engagement, risk communication, social media
Citation: Yang C-X, Baker LM and McLeod-Morin A (2024) Tweet tweet tick: a quantitative content analysis of risk communication about ticks on Twitter. Front. Commun. 9:1339356. doi: 10.3389/fcomm.2024.1339356
Edited by:
Seow Ting Lee, University of Colorado Boulder, United StatesReviewed by:
Douglas Ashwell, Massey University Business School, New ZealandCourtney Meyers, Texas Tech University, United States
Copyright © 2024 Yang, Baker and McLeod-Morin. This is an open-access article distributed under the terms of the Creative Commons Attribution License (CC BY). The use, distribution or reproduction in other forums is permitted, provided the original author(s) and the copyright owner(s) are credited and that the original publication in this journal is cited, in accordance with accepted academic practice. No use, distribution or reproduction is permitted which does not comply with these terms.
*Correspondence: Cheng-Xian Yang, eWFuZy5jMUB1ZmwuZWR1