 Rebecca A. Lundwall
 Cooper B. Hodges
- Brigham Young University, Provo, UT, United States
One principle of cognitive development is that earlier intervention for educational difficulties tends to improve outcomes such as future educational and career success. One possible way to help students who struggle is to determine if they process information differently. Such determination might lead to clues for interventions. For example, early information processing requires attention before the information can be identified, encoded, and stored. The aim of the present study was to investigate whether parent ratings of inattention, inhibition, and impulsivity, and whether error rate on a reflexive attention task could be used to predict child scores on state standardized tests. Finding such an association could provide assistance to educators in identifying academically struggling children who might require targeted educational interventions. Children (N = 203) were invited to complete a peripheral cueing task (which measures the automatic reorienting of the brain’s attentional resources from one location to another). While the children completed the task, their parents completed a questionnaire. The questionnaire gathered information on broad indicators of child functioning, including observable behaviors of impulsivity, inattention, and inhibition, as well as state academic scores (which the parent retrieved online from their school). We used sequential regression to analyze contributions of error rate and parent-rated behaviors in predicting six academic scores. In one of the six analyses (for science), we found that the improvement was significant from the simplified model (with only family income, child age, and sex as predictors) to the full model (adding error rate and three parent-rated behaviors). Two additional analyses (reading and social studies) showed near significant improvement from simplified to full models. Parent-rated behaviors were significant predictors in all three of these analyses. In the reading score analysis, error rate showed a trend for significance as a predictor. In the analyses for math, language arts, and the overall academic score (created using principal component analysis), the simplified model best predicted academic outcomes.
Introduction
National programs such as the No Child Left Behind (No Child Left Behind (NCLB) Act of 2001 and 20 U. S. C. A. § 6301 et seq., 2003) and Common Core (National Governors Association Center for Best Practices and Council of Chief State School Officers, 2010) have been instituted to help students reach higher goals. These programs focus on standards and content (Mathis, 2010; Beach, 2011; Porter et al., 2011; Tienken, 2011). Teacher attitudes toward the standards appear to be mostly favorable, especially among elementary school teachers (Roy-Campbell, 2012; Troia and Graham, 2016). However, many educators feel that, although these national standards are more rigorous than prior curricula, professional development efforts have not been sufficient to ensure that teachers have the appropriate training to help struggling students (Roy-Campbell, 2012; Troia and Graham, 2016). In short, teachers often feel left without appropriate knowledge to help students with poor academic performance.
Standardized testing is one way to measure academic performance (Roche and Ghazarian, 2012; Kwong and Davis, 2015). Success on standardized tests requires efficient performance in a variety of different content areas and using a variety of skills. For instance, although reading is generally a skill included in many academic standardized tests, it is important to differentiate between it and other academic skills because the required skillset to succeed in reading probably differs from that of other academic subjects. Researchers have determined that reading includes skill in decoding, word recognition, and the construction of meaning (Foorman and Torgesen, 2001) Success in science and math, however, has been defined as consisting of other cognitive skills, such as relational reasoning, creativity, and problem solving (Krumm et al., 2012; Roķe and Kālis, 2015).
When students do not perform well on standardized tests, the difficulty may originate from underlying cognitive processes these students rely on (McLean and Hitch, 1999). For example, two aspects of attention, spatial working memory and executive functioning, have been implicated in children with poor arithmetic performance (McLean and Hitch, 1999; Bull and Scerif, 2001; Bull et al., 2008). Likewise, attentional deficits have more detrimental effects on academic outcomes than do poor general cognitive abilities, social disadvantage, or ineffective parenting (Jaekel et al., 2013). Studies that capture how these cognitive processes play a role in the academic success of a general population of children are beneficial in understanding how basic cognitive processes might influence academic performance in children who struggle. It makes sense to determine if academic performance can be partly predicted by attention ask performance because we know that parietal regions of the brain, in particular the temporoparietal junction, are involved in automatic reorienting of attentional resources (Lynch, 2014; Posner, 2016) and additional activation occurs in the superior colliculus and pulvinar during peripheral cueing tasks (Posner and Rao, 2012; Miller and Buschman, 2013), which measure automatic reorienting.
The type of attention usually associated with academic success is sustained attention (Beane and Marrocco, 2004). However, reflexive attention, also known as selective attention, exogenous attention, or orienting, may be an equally important way to examine potential relationships between task errors and academics. Reflexive attention is induced exogenously when an object moves or suddenly appears. Reflexive attention is less effortful or voluntary, but errors tend to be more common in those with attentional disorders (Beane and Marrocco, 2004). In a reflexive attention task such as (Posner’s 1980), a cue flashes very briefly, disappears, and then, typically less than 100 ms later, a target appears. Participants are instructed to respond to the target and ignore the cue. However, the cues are very difficult to ignore because they are processed automatically by the brain (Lellis et al., 2013). Thus, reflexive attention can be distinguished from sustained attention by the presence of peripheral cues, a brief time course, less effort, and the engagement of different brain regions, even though there is some overlap in the cortical and subcortical regions used (Beane and Marrocco, 2004; Natale et al., 2006; Jones et al., 2015; Visintin et al., 2015).
As Beane and Marrocco (2004) note, few researchers have considered the role reflexive attention might play in the academic success of children. However, several studies using reflexive attention tasks show abnormal responses in individuals with attention-deficit/hyperactivity disorder (ADHD) (Nigg et al., 1997; McDonald et al., 1999; Chen et al., 2002). Because the symptoms of ADHD exist on a continuum in the general population (Chen et al., 2008; Lubke et al., 2009; Larsson et al., 2012), reflexive attention tasks are likely to show a normal distribution of participants in terms of errors made on the task, and these errors may associate with errors on academic tests.
In addition to cognitive skills, emotional and behavioral regulation have been associated with academic success. For example, conscientiousness, a personality trait from the NEO Five Factor Inventory (Costa and McCrae, 1992), is correlated between moderately and highly with grades (Trapmann et al., 2007). Indeed, some researchers have found that conscientiousness explains five times as much variance in GPA as does intelligence (Kappe and Van der Flier, 2012). Likewise, Diamond and Lee (2011) review several interventions aimed at social, emotional, and/or physical development that aid the development of executive function.
Because emotional and behavioral regulation also influence academic scores, we gather data on day-to-day behaviors such as inattention, impulsiveness, and inhibition. Logically, some problems that parents might notice at home result from difficulty attending to details in instructions. a parent might also notice that their child is impulsive and begins a task before they have processed all the instructions or that the child is slow to begin tasks (inhibited). Inhibition might tax working memory and lead to forgetting instructions before they can be completed. In summary, it is possible that both the proportion of errors made on a reflexive attention task and a parent report of day-to-day behaviors will explain some variability in academic performance.
Materials and Methods
Participants
Participants were recruited after Institutional Review Board (IRB) approval from Rice University and the University of Wisconsin-Madison. As part of a longitudinal follow-up study (Lundwall et al., 2017), children (N = 203) who lived in the Madison, WI, USA area visited the Waisman Center to complete attentional tasks while their parents provided academic and behavioral information. In accordance with the Declaration of Helsinki, we obtained written informed consent from all parents and all children gave written assent. Of the 203 children from whom we collected data, two had their data excluded for having a serious neurological diagnosis and two were excluded for having an uncorrected vision diagnosis. Of the 199 children in the analyzed data set, 49% were female. The mean age was 12.93 years (SD = 1.73; range 10.58–16.55 years).
Procedure
We used children’s state academic scores on the Wisconsin Knowledge and Concepts Examinations (WKCE). Parents were asked to bring their child’s printed WKCE report to their visit to the Waisman Center. If the parent did not bring the report, they were asked during the visit to look up the scores on the parent portal of the school district website. Most parents (N = 153) provided state academic scores. However, not all subjects were tested each year. Therefore, 23% of the reading scores were missing, 67% of the language arts scores were missing, 31% of the math scores were missing, 71% of the science scores were missing, and 71% of the social studies scores were missing. While this amount of missing data is high, we used multiple imputation to replace missing values, which is capable of handling large amounts of missing data (Rubin, 1987), especially when the reason for missingness is known.
Multiple imputation is often used in cases of missing data, because simulations indicate that this approach produces little bias in their estimates (Allison, 2000; Collins et al., 2001; Royston, 2004). This approach is appropriate if the data are missing at random (i.e., missing completely at random, or MCAR) or if the reason for missingness is known and included in the analysis (i.e., missing at random, or MAR) (Scheffer, 2002; Dong and Peng, 2013). Multiple imputation is often considered inappropriate if the data are missing not at random (i.e., for no known reason, or MNAR), but is still less biased than mean imputation or listwise deletion (Dong and Peng, 2013). Simulations have shown that, when using multiple imputation with MAR data, the mean changes only 6% when 50% of the data are missing for a known reason (Scheffer, 2002).
Distinguishing between MNAR (for which multiple imputation is theoretically not appropriate) and MCAR or MAR (for which it is) is only possible if the researcher follows up with participants and can determine the reason for missingness. When we followed up with participants who did not provide any academic scores, they reported that they simply forgot. It is also important to consult the literature to determine if other studies indicate reasons why parents do not report academic scores. Adults are sometimes reluctant to report their income if it is high (Swan and Epley, 1981; Ross and Reynolds, 1996; Roemer, 2000). We suspected that parents might be reluctant to report academic scores if they were low, but found no literature confirming this. Another approach is to compare (via a t-test) those who are missing a variable to those who are not in order to try to determine why the variable might be missing (Tabachnick and Fidell, 2012). When we compared groups with missing academic scores to those with reported academic scores, we found a trend for parents of older children to be slightly more likely to forget than parents of younger children [t (201) = −1.65, p = 0.10]. Sex, child age, economic status, impulsivity, inhibition, family size, birth order, and error rate were not significantly different between those who were missing data and those who were not (Ps from 0.13 to 0.70). Because it shows a trend for significance, we have included child age in the main analysis.
Because we know the reason for missingness for most of the variables, we used multiple imputation based on 51 variables in the dataset that were associated with the variables we planned to use in our main analysis. Variables chosen to contribute to the imputations are generally of three types (Van Buuren et al., 1999; Schafer and Graham, 2002). First, we include variables that are of theoretical interest, including those that will be in the main analysis. Second, we include variables that may be associated with the reason for missingness (e.g., if the reason for missingness were embarrassment, then we would include the education of parents since this might be associated with academic testing scores in children). Third, we include variables that are correlated with the missing data (e.g., education of parents if income is missing; reading academic scores if science academic scores are missing).
Measures
Wisconsin Knowledge and Concepts Examination
Consistency and reliability information for the WKCE, which is publicly available from McGraw-Hill (CTB/McGraw-Hill, 2012), reports that depending on grade level, Cronbach’s alpha for the 2012 WKCE ranged from 0.89 to 0.93 (reading), 0.90 to 0.94 (mathematics), 0.82 to 0.85 (language arts), 0.87 to 0.90 (social studies), and 0.86 to 0.88 (science). This indicates internal consistency and scale reliability. Construct validity was assessed by comparing content standards within a subject test with each other. Correlations ranged from 0.50 to 0.84 (reading), from 0.47 to 0.75 (mathematics), from 0.38 to 0.69 (language arts), from 0.47 to 0.69 (social studies), and from 0.32 to 0.67 (science). Factor analysis revealed eigenvalues of 5.31–7.74 (reading), 4.90–7.44 (mathematics), 4.05–4.97 (language arts), 4.38–5.26 (social studies), and 4.23–5.70 (science). In short, the correlations between content standards within a subject area are relatively high, as can be expected to indicate they measure similar concepts. The correlations between content standards from different subject tests are low, as expected to indicate that they measure relatively distinct concepts (CTB/McGraw-Hill, 2012).
Reflexive Attention Task
The reflexive attention task is a peripheral cueing task based on a prevalent paradigm (Posner, 1980), and was similar to a task used in our previous study conducted with adults (Lundwall et al., 2012). We modified the child version of the task to engage the interest of children while still maintaining the ability to measure visual reflexive attention to suddenly appearing stimuli (Figure 1). The modification primarily involved using the back story of the earth being “under attack” from alien spaceships, with “friendly earth rockets” assisting the child to “shoot” the alien spaceships.
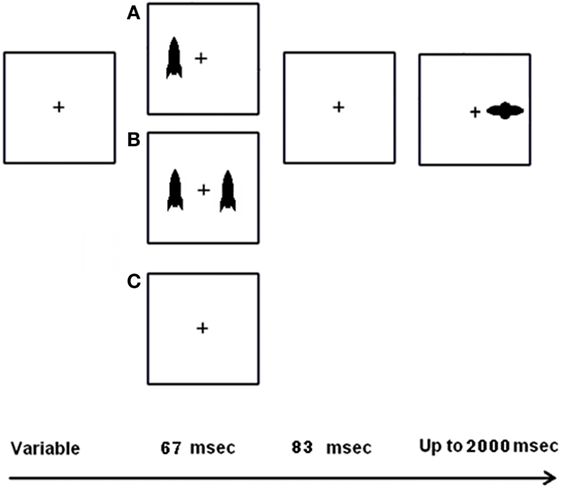
Figure 1. Schematic of the child spatial cueing (SC) task. A fixation cross appeared for a variable period (600–3,000 ms). Afterward, one, two, or no cues appeared for 67 ms followed by a gap of 83 ms. Once the target appeared, it remained on display until a left or right key press was made or until 2,000 ms had elapsed
We tested participants in a darkened room on a 381 mm × 305 mm monitor with a 60 Hz refresh rate. We maintained viewing distance at 57 cm by using a chin rest. E-Prime software (Sharpsburg, PA, USA) presented our stimuli. Cues had an inner edge 7.0° from central fixation. Targets had an inner edge 5.7° from fixation. Earth rockets flashed briefly (67 ms) and acted as cues. After a brief gap (83 ms) an alien spaceship could appear. The spaceships were targets to which children were instructed to make a right or left key press, depending on the location of the target. The cues could be valid (i.e., appear near where the target would appear) or invalid (appear contralateral to the target). Fifty-percent of the cues were valid. Since this is chance, we told children that paying attention to the earth rockets would not help them. Nevertheless, this is difficult to do and participants are typically faster at responding to a target that is preceded by a valid pre-cue, even though the stimuli presentation is too brief to depend on eye movement. Invalid pre-cues in this scenario act as distractors as they are more likely to lead to errors. There were also neutral cues, with one cue on each side of the display. In all, there were 180 trials.
Questionnaire
While the child completed the computer task, we collected data from parents on broad indicators of child functioning, such as how they were doing physically, socially, academically, and emotionally. The questionnaire included basic demographic information and a modified version of the MacArthur Health Behavior Questionnaire-Parent Version (HBQ-P). The modified HBQ-P was edited to be age appropriate and has been successfully used in a variety of studies (Valiente et al., 2008; Silver et al., 2010; Essex et al., 2011; Wiik et al., 2011; Weikum et al., 2013). Parents used a three-point Likert scale (0–2) to indicate agreement with statements such as about the distractibility, concentration, and organization of their children.
Statistical Analyses
Data Preparation
We used HBQ-P summary scores for inattention (which included six items), impulsivity (which included nine items), and inhibition (which included three items). We coded a maximum of one error per trial, which included pressing the key indicating that the target was on the wrong side or making either too fast (<200 ms) or slow (> 1,000 ms) responses. We considered RTs less than 200 ms as errors because it is not usually possible to respond to targets faster than 200 ms. These are typically called anticipation errors because, if the key press is to the correct side, this is considered chance. RTs over 1,000 ms are considered errors because they are quite slow for a task like this and represent lapses in attention. We calculated the proportion of errors for each child.
Main Analyses
To predict academic scores, we used sequential (hierarchical) regression analyses. A different analysis was performed for each academic score (reading, language arts, math, science, and social studies). In addition to predicting each academic score, we also used principal component analysis (PCA) to create a factor score that represents each child’s relative academic standing across content areas. PCA is a statistical procedure that groups observations into components, often as a data reduction technique when the research wants fewer variables to represent much of the data in the original set of variables. It uses the correlation between original variables to create new factors, or components. Factor analysis is appropriate because our original academic scores are highly correlated (Rs range from 0.63 to 0.97; Ps are all below 0.001). We used the SPSS (version 25) principal components method of factor analysis without rotation, and saved factor scores for each individual. The PCA revealed one factor for all academic scores with loadings (similar to correlation coefficients) ranging from 0.71 for reading to 0.97 for social studies. Communalities (which show how much of the variance in a variable is accounted for by the extracted factor) ranged from 0.51 for reading to 0.94 for social studies (see Table 1). The factor score explains 78% of the variance in the academic scores data. Predictors included error rate and parent-rated impulsivity, inhibition, and inattention. All initial models included sex, age, and family income as control covariates; subsequent regression models added academic score, parent rating, and error rate variables to determine predictive changes. It should be noted that we did not include both age and grade as covariates in the same because they are highly correlated (r = 0.94, p < 0.001); excluding them from being present in the same model helped us avoid issues with multicollinearity. Multicollinearity should be avoided unless there is a theoretical reason to keep correlated predictor variables in the analysis (Schroeder et al., 1990), as was the case with our three parent-rated behaviors.
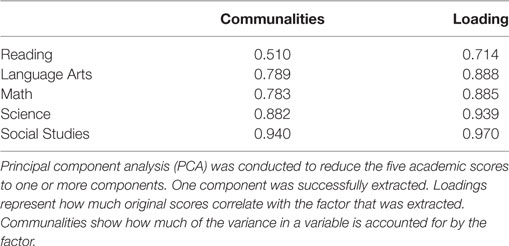
Table 1. PCA summary.
Results
Descriptive Statistics
Wisconsin Knowledge and Concepts Examination scores are reported both as percentile scores and as standardized scores. We used standard scores in the analysis because percentile ranks theoretically have a uniform rather than a normal distribution of errors. The WKCE standard scores had minimal skew (<0.70). Although some of the predictors were skewed (>1.50), this is less important in regression analyses. Neither dependent variables nor predictors were transformed. Academic scores ranged from 452 to 668 (although we scaled them to be on the same order of magnitude as the predictors when performing the analysis). Reading scores had a mean of 554.87 (SD = 40.01). Language arts scores had a mean of 389.54 (SD = 64.75). Math scores had a mean of 566.33 (SD = 43.84). Science scores had a mean of 384.93 (SD = 73.09). Social studies scores had a mean of 381.75 (SD = 64.71). The overall factor score is set to have a mean of zero and a SD of one. Based on percentile scores, the children in this study typically performed better academically than about 77% of their grade matched peers. While performing above average on their academic tests, the students still made an average of 15% errors on the computer task (range 7–62%).
In addition to error rate, we used three of the HBQ-P summary scores that we thought might be related to error rates, including lapses in attention (inattention), delaying responding (inhibition) or responding too quickly (impulsivity). Each summary score is composed of several items, each of which can be scored 0 (never or not true), 1 (somewhat true), or 2 (often or very true) by the parent. Summary scores for inattention (which has six items) ranged from 0 to 9 (M = 1.71; SD = 2.10). Impulsivity (nine items) ranged from zero to 13 (M = 2.38; SD = 2.57) and inhibition (three items) ranged from 0–6 (M = 1.19; SD = 1.19). For intercorrelations between all variables in the models, see Table 2.
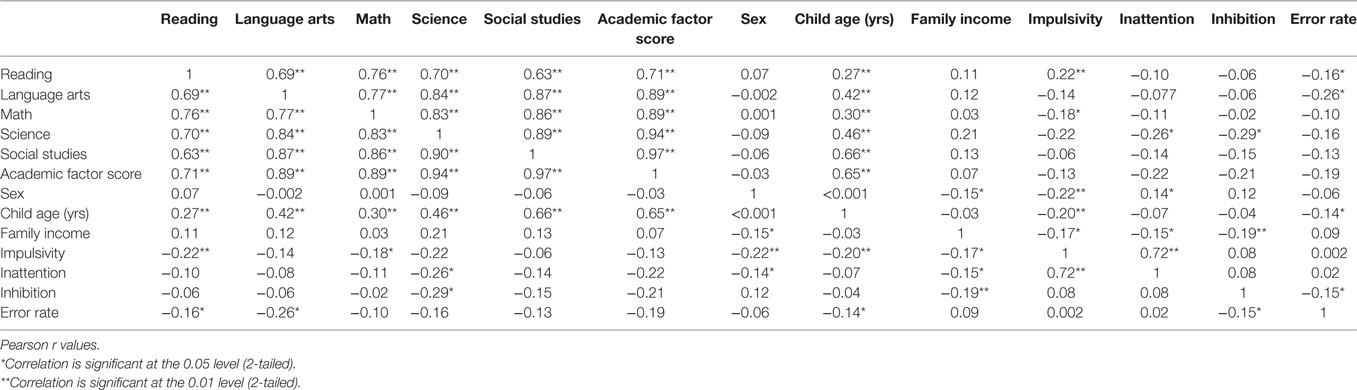
Table 2. Correlation matrix of all regression variables.
Main Analyses
We used manual entry of blocks of variables to obtain sequential multiple regression in SPSS (version 25). After controlling for age, sex, and family income in the first block of the regression, we analyzed contributions of error rate and parent-rated behaviors (inattention, inhibition, and impulsivity) in the second block. Outcomes were the five academic scores and the overall academic factor score. Because these are imputed data, we averaged the model values (ΔR2, F, and p) from all imputations (model summaries are not pooled by the statistical software). From the pooled coefficients provided, we used unstandardized “b” coefficients (betas are not produced).
For reading scores, the change from model 1 (the simplified model) to model 2 (the full model) showed a trend for significance, ΔR2 = 0.04, F(4, 189) = 2.26, p = 0.08. Significant coefficients in model 2 were impulsivity [b = −7.98, t(191) = −2.30, p = 0.02] and age [b = −9.50, t(191) = 2.64, p = 0.01], with error rate showing a trend for significance [b = −115.94, t(191) = −1.62, p = 0.10]. For every unit increase on the impulsivity subscale, reading scores are predicted to decrease by 7.98 points. For every unit increase on age, reading scores are predicted to drop 9.50 points. For every unit increase in error rate, reading scores show a trend to drop 115.97 points (see Table 3).
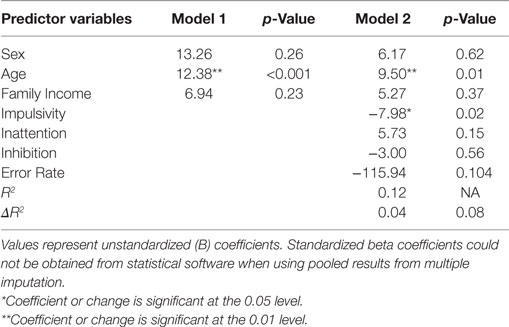
Table 3. Sequential regression analysis of predictors of reading scores.
For science, the change from model 1 to model 2 was significant, ΔR2 = 0.06, F(4, 189) = 3.04, p = 0.03. Significant coefficients in model 2 were impulsivity [b = 103.62, t(191) = 2.09, p = 0.04] and inhibition [b = −160.27, t(191) = −2.17, p = 0.03], but not age (p = 0.32) or error rate (p = 0.57). For every unit increase on the impulsivity subscale, science scores are predicted to increase by 103.62 points. For every unit increase on inhibition, science scores are predicted to drop 160.27 points (see Table 4).
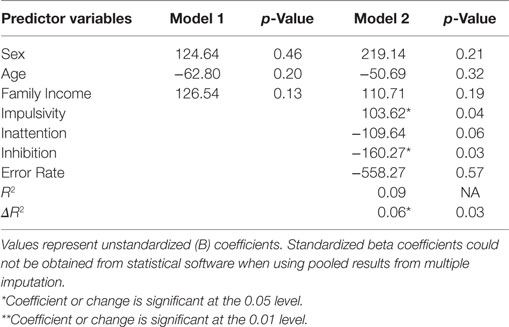
Table 4. Sequential regression analysis of predictors of science scores.
Social studies, such as reading, had a change from model 1 to model 2 that showed a trend for significance, ΔR2 = 0.05, F(4, 189) = 2.37, p = 0.054. There were no significant coefficients in model 2. However, impulsivity [b = −6.37, t(191) = −1.77, p = 0.08], inattention [b = 68.83, t(191) = 1.66, p = 0.10], and inhibition (b = 105.38, t = 1.94, p = 0.05) show a trend for significance. Neither age (p = 0.36) nor error rate (p = 0.14) show any significance (p = 0.36) (See Table 5).
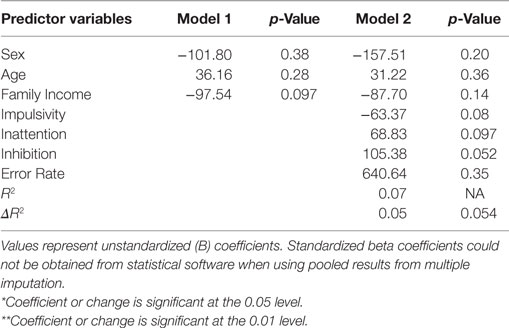
Table 5. Sequential regression analysis of predictors of social studies scores.
All other academic scores (including the factor score) were better predicted by the model using only age, sex, and family income as predictors (full models varied from p = 0.20 to p = 0.61, although models with age, sex, and family income as the only predictors were all significant at p > 0.001). In particular, the second language arts model (Table 6) did not change significantly from the first model, but there is a very slight trend for significance, ΔR2 = 0.05, F(4, 189) = 2.59, p = 0.11. For math (Table 7), the improvement from model 1 to model 2 was not near significance, ΔR2 = 0.03, F(4, 189) = 1.58, p = 0.20. Also, the factor score analysis (Table 8) did not show significance or near significance, ΔR2 = 0.02, F(4, 189) = 0.94, p = 0.61. Since these latter models are not significant, we will only discuss them briefly in contrast to the model that was significant and those that were near significance.
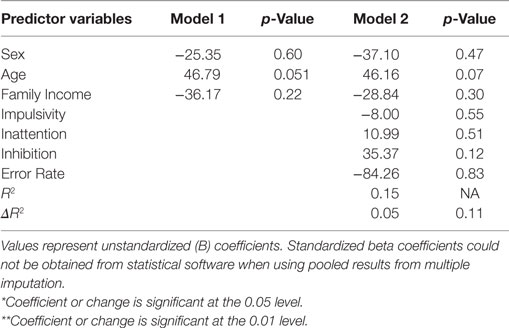
Table 6. Sequential regression analysis of predictors of language arts scores.
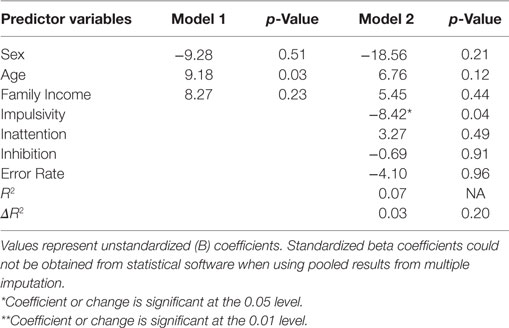
Table 7. Sequential regression analysis of predictors of mathematics scores.
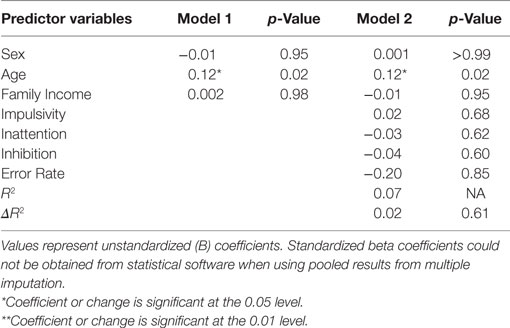
Table 8. Sequential regression analysis of predictors of factor scores.
Because we had expected error rate to be a significant predictor in more analyses, we examined the intercorrelations between error rate and parent-rated behaviors. We noted that inhibition is correlated with error rate, r = −0.15, p = 0.04. To determine if parent-rated behaviors were “soaking up variance” that more properly belonged to error rate, we performed a follow-up analysis for reading scores with three sequential steps: (1) covariates (age, sex, family income); (2) error rate; and (3) parent-rated behaviors (impulsivity, inattention, and inhibition). The model with age, sex, family income, and error rate was not a significant improvement over the model with only age, sex, and family income. ΔR2 = 0.01, F(1, 192) = 2.36, p = 0.15.
Discussion
Summary and Implications
We found that the model predicting science from parent ratings of impulsivity and inhibition was significant even when controlling for error rate, inattention scores, age, sex, and family income. This indicates that the best predictors were parent-rated impulsivity (which increased science scores) and inhibition (which decreased science scores). Of the variables included in the model (including error from the reflexive attention task), parent ratings of child emotional-cognitive qualities best predicted science scores. It is noteworthy that parents’ perceptions of the behaviors that their children exhibit are related to how their children do on an academic test. However, our finding regarding inhibition seem to counter results previously reported in the literature that emphasize inhibitory control as an advantage for success in math (Oberle and Schonert-Reichl, 2013) and academic success generally (Kennett and Reed, 2009; Murrell et al., 2015; Wu et al., 2017). The difference might be explained by the value to science of curiosity, openness to experience, and creativity (which is correlated with impulsivity) (Trapmann et al., 2007; Von Stumm et al., 2011; Bender et al., 2013). This suggests that, since we are seeking for more students to go into STEM careers (Andersen, 2014; Dejarnette, 2016), children who are behaviorally inhibited may need educational intervention to encourage traits that the sciences value such as curiosity.
We found a similar trend in the regression model predicting reading scores—impulsivity and, to a lesser extent, error rate on the computer task, were the most significant predictors in the second model. This is conceptually important, especially to developmental literature. Impulsivity is a hallmark of attention-deficit hyperactivity disorder (DeVito et al., 2009). Given the high comorbidity between attentional disorders and reading disability, it is reasonable to conclude that impulsivity likely negatively impacts reading ability, perhaps also increasing error rate. In addition, successful reading involves significant working memory (Nevo and Bar-Kochva, 2015) skill in decoding (Foorman and Torgesen, 2001), and error detection (Horowitz-Kraus and Holland, 2015). Children who tend to make more errors on a reflexive attention task might tend to obtain lower scores on reading tests because they have difficulty managing all the tasks of reading at once. Although parent ratings of inattention were not significant in this model, the results suggest a very slight trend toward the significance of inattention in predicting reading scores. Given the importance of attention in reading proficiency (Arrington et al., 2014), parent ratings of attention would likely help researchers identify struggling children sooner. Future research should further investigate the role of parent ratings of child behavior and how these ratings are linked to specific academic skills such as decoding.
In the sequential regression analysis of social studies scores, we found some evidence that the model including parent ratings was better than the model with covariates alone. However, no predictors were significant. Instead, inhibition, impulsivity, and inattention showed a trend toward significance. Inhibiting distracting thoughts might be particularly important to social studies. This content area tends to have instructional materials that have “complex syntax, technical vocabulary, and a lack of helpful context” (Brown, 2007). One suggestion is for teachers to use guided questions that help train students’ attention toward relevant passages, as this would help them filter out distracting material and focus on the most important information (Armstrong et al., 1988; Brown, 2007; Ortlieb, 2013). Although our analysis predicting social studies scores did not fully support the predictive utility of parent ratings of attention, it is likely that, when targeting interventions to children based on parent reports, all academic areas would show some slight improvement. Future studies should specifically target social studies performance and determine whether parent reports can reliably predict performance in this academic area.
Overall, two things are striking about our findings. First, it is interesting that, in all the models that showed significance or a trend for significance, it was parent-rated behaviors that were significant rather than a more obvious cognitive endophenotype (Gottesman and Gould, 2003), such as error rate. In follow-up analyses, we checked the model improvement between the covariates and adding error rate (without parent-rated behaviors). In no case was the model with error rate a significant improvement over the model with covariates only. Instead, it appears that we should look to research indicating the importance of socioemotional skills (Trapmann et al., 2007; Kappe and Van der Flier, 2012). Our finding suggests that the parent-rated behaviors are, indeed, better predictors of science scores (and perhaps of the other academic scores near significance) than error rate and other variables in the model.
Second, rather than the overall academic factor score being better predicted by all variables of interest than single subject scores, it was less well predicted. None of the parent-rated behaviors or the error rate from the attention task were significant. Science and, to some extent, reading were better predicted by adding parent-rated behaviors and error rate. Impulsivity negatively predicted reading scores, but positively predicted science scores. Taken together, this implies that different content areas have different foundational skills that can be cultivated by instructors of different subjects.
One variable that was not in the analyses was child ratings of their own behavior. Some previous literature has suggested that children are the best informants of their own behavior (Tein et al., 1994; Caster et al., 1999; Bögels and Melick, 2004). Other researchers have suggested that parents are the best informants, even into adolescence (Cantwell et al., 1997; Lauth et al., 2010). While these studies are discrepant, several researchers have found that parent ratings for observable behaviors tend to show higher agreement than those for internal experiences (Edelbrock et al., 1986; De Los Reyes et al., 2015). While agreement is a measure of reliability and we are primarily concerned with validity, it is reasonable to assume that the parents in our study would notice and report the outward signs of behavioral inattention we ask about in the HBQ-P.
Limitations
Probably the most significant limitation of our study is that only four percent of the sample had any non-Caucasian ancestry. Of these, only one reported being 100% non-Caucasian (Asian). Four reported being 50% Asian. Two reported being 50% African American, and one reported being 50% Native American. The remainder reported being Caucasian. While this reflects the census records for the geographic region we tested (U.S. Census Bureau, 2016), educators who work in much more diverse school districts will want verification that the associations we found apply to non-Caucasian students as well. We did not include ethnicity in our regression analysis because only one person reported no Caucasian ancestry, which is not enough ethnic variability to explain our findings. Replicating this study in a more diverse school district would address this question. This would be an excellent next step, nevertheless our study is useful in identifying common childhood traits (impulsivity and inhibition) that seem likely to be shared between people from different ethnic groups within the United States.
Related to this lack of diversity is that the children included in this study are children of parents who are interested in research and the parents are possibly quite well educated. That is, economically disadvantaged children might have been unintentionally excluded. Therefore, we examined family income data and determined that the median annual family income was $83,959. This is a 26% higher income per capita than the income reported for Wisconsin for 2013 (U.S. Census Bureau, 2015). However, 13% of the participating families reported an income below the Wisconsin median. This suggests reasonable contribution from less economically advantaged families, who are often less able to participate in research. We included income in our regression analysis. Nevertheless, seeking participants from lower socioeconomic backgrounds seems advisable.
Finally, our study primarily included children from 9 to 16 years old. If we want to be able to catch children who might need intervention, we should replicate this study with a younger population. This would allow us to verify the differences in errors and allow time to train children and/or adjust educational practices to meet their needs while their brains are still developing.
Conclusion
Despite the limitations mentioned above, it is useful to show that parent-rated behaviors are relevant to educational testing since the behaviors do not appear to be related to cognitive skills. Screening children for socioemotional skills early in their education might be important to preparing them for later academic success. As research continues with more diverse populations and younger participants, we approach the possibility of helping students obtain the skills that may help them improve their academic performance. This may be the foundation of achieving academic success for a greater number of students than has been previously possible.
Ethics Statement
This study was carried out in accordance with the recommendations of the Institutional Review Board-Human Subjects at Rice University and the Social and Behavioral Sciences Institutional Review Board at University of Wisconsin-Madison. Additional data analysis was performed under Institutional Review Board approval from Brigham Young University. We obtained written informed consent from all parents. All children gave written informed assent in accordance with the Declaration of Helsinki.
Author Contributions
RAL designed the study, performed the statistical analyses, and wrote the paper. CBH wrote several portions of the paper and assisted with statistical analyses.
Conflict of Interest Statement
The authors declare that the research was conducted in the absence of any commercial or financial relationships that could be construed as a potential conflict of interest.
Acknowledgments
Grants from the Social Sciences Research Institute at Rice University (Dissertation Improvement Grant to RL and Seed Money Grant to James L. Dannemiller) and by the Lynette S. Autrey Fund (to James L. Dannemiller) supported this research. A core grant to the Waisman Center (University of Wisconsin-Madison) from NICHD (P30 HD03352) provided infrastructure support. We express our appreciation to the families who participated through the Waisman Center and to the following research assistants: Alicia Jones, Brian Goldstein, Eva Frantz, Jenna Goebel, Jesse Rhodes, Jake Berkvam, Tom White, Tova Weiss, Jing He, and Alex Tedesco.
References
Allison, P. D. (2000). Multiple imputation for missing data. Sociol. Methods Res. 28, 301–310. doi: 10.1177/0049124100028003003
Andersen, L. (2014). Visual-spatial ability: important in STEM, ignored in gifted education. Roeper Rev. 36, 114–121. doi:10.1080/02783193.2014.884198
Armstrong, D. P., Patberg, J., and Dewitz, P. (1988). Reading guides – helping students understand. J. Read. 31, 532–541.
Arrington, C. N., Kulesz, P. A., Francis, D. J., Fletcher, J. M., and Barnes, M. A. (2014). The contribution of attentional control and working memory to reading comprehension and decoding. Sci. Stud. Read. 18, 325–346. doi:10.1080/10888438.2014.902461
Beach, R. W. (2011). Issues in analyzing alignment of language arts Common Core standards with state standards. Educ. Res. 40, 179–182. doi:10.3102/0013189X11410055
Beane, M., and Marrocco, R. T. (2004). Norepinephrine and acetylcholine mediation of the components of reflexive attention: implications for attention deficit disorders. Prog. Neurobiol. 74, 167–181. doi:10.1016/j.pneurobio.2004.09.001
Bender, S. W., Nibbelink, B., Towner-Thyrum, E., and Vredenburg, D. (2013). Defining characteristics of creative women. Creativity Res. J. 25, 38–47. doi:10.1080/10400419.2013.752190
Bögels, S. M., and Melick, M. V. (2004). The relationship between child-report, parent self-report, and partner report of perceived parental rearing behaviors and anxiety in children and parents. Pers. Individ. Dif. 37, 1583–1596. doi:10.1016/j.paid.2004.02.014
Brown, C. L. (2007). Strategies for making social studies texts more comprehensible for English-language learners. Soc. Stud. 98, 185–188. doi:10.3200/TSSS.98.5.185-188
Bull, R., Espy, K. A., and Wiebe, S. A. (2008). Short-term memory, working memory, and executive functioning in preschoolers: longitudinal predictors of mathematical achievement at age 7 years. Dev. Neuropsychol. 33, 205–228. doi:10.1080/87565640801982312
Bull, R., and Scerif, G. (2001). Executive functioning as a predictor of children’s mathematics ability: inhibition, switching, and working memory. Dev. Neuropsychol. 19, 273–293. doi:10.1207/S15326942DN1903_3
Cantwell, D. P., Lewinsohn, P. M., Rohde, P., and Seeley, J. R. (1997). Correspondence between adolescent report and parent report of psychiatric diagnostic data. J. Am. Acad. Child Adolesc. Psychiatry 36, 610–619. doi:10.1097/00004583-199705000-00011
Caster, J. B., Inderbitzen, H. M., and Hope, D. (1999). Relationship between youth and parent perceptions of family environment and social anxiety. J. Anxiety Disord. 13, 237–251. doi:10.1016/S0887-6185(99)00002-X
U.S. Census Bureau. (2016). State and County Quick Facts. Available at: https://www.census.gov/quickfacts/fact/table/WI,US/PST040216#viewtop
Chen, C.-Y., Chen, C.-L., Wu, C.-Y., Chen, H.-C., Tang, F.-T., and Wong, M.-K. (2002). Visual spatial attention in children with attention deficit hyperactivity disorder. Chang Gung Med. J. 25, 514–521.
Chen, W., Zhou, K., Sham, P., Franke, B., Kuntsi, J., Campbell, D., et al. (2008). DSM-IV combined type ADHD shows familial association with sibling trait scores: a sampling strategy for QTL linkage. Am. J. Med. Genet. B Neuropsychiatr. Genet. 147B, 1450–1460. doi:10.1002/ajmg.b.30672
Collins, L. M., Schafer, J. L., and Kam, C.-M. (2001). A comparison of inclusive and restrictive strategies in modern missing data procedures. Psychol. Methods 6, 330. doi:10.1037/1082-989X.6.4.330
Costa, P., and McCrae, R. (1992). Revised NEO Personality Inventory (NEO PI-R) and NEO Five-Factor Inventory (NEO-FFI) Professional Manual. Lutz, FL: Psychological Assessment Resources: Inc.
CTB/McGraw-Hill. (2012). Wisconsin Knowledge and Concepts Examinations: Fall 2012 WKCE Technical Report. Monterey, CA: CTB/McGraw-Hill.
De Los Reyes, A., Augenstein, T. M., Wang, M., Thomas, S. A., Drabick, D. A. G., Burgers, D. E., et al. (2015). The validity of the multi-informant approach to assessing child and adolescent mental health. Psychol. Bull. 141, 858–900. doi:10.1037/a0038498
Dejarnette, N. K. (2016). America’s children: providing early exposure to STEM (science, technology, engineering and math) initiatives. Read. Improv. 53, 181–187.
DeVito, E. E., Blackwell, A. D., Clark, L., Kent, L., Dezsery, A. M., Turner, D. C., et al. (2009). Methylphenidate improves response inhibition but not reflection–impulsivity in children with attention deficit hyperactivity disorder (ADHD). Psychopharmacology 202, 531. doi:10.1007/s00213-008-1337-y
Diamond, A., and Lee, K. (2011). Interventions shown to aid executive function development in children 4 to 12 years old. Science 333, 959–964. doi:10.1126/science.1204529
Dong, Y., and Peng, C.-Y. J. (2013). Principled missing data methods for researchers. Springerplus 2, 222. doi:10.1186/2193-1801-2-222
Edelbrock, C., Costello, A. J., Dulcan, M. K., Conover, N. C., and Kala, R. (1986). Parent-child agreement on child psychiatric symptoms assessed via structured interview. J. Child Psychol. Psychiatry 27, 181–190. doi:10.1111/j.1469-7610.1986.tb02282.x
Essex, M. J., Armstrong, J. M., Burk, L. R., Goldsmith, H. H., and Boyce, W. T. (2011). Biological sensitivity to context moderates the effects of the early teacher-child relationship on the development of mental health by adolescence. Dev. Psychopathol. 23, 149–161. doi:10.1017/S0954579410000702
Foorman, B. R., and Torgesen, J. (2001). Critical elements of classroom and small-group instruction promote reading success in all children. Learn. Disabil. Res. Pract. 16, 203–212. doi:10.1111/0938-8982.00020
Gottesman, I. I., and Gould, T. D. (2003). The endophenotype concept in psychiatry: etymology and strategic intentions. Am. J. Pscyhiatry 160, 636–645. doi:10.1176/appi.ajp.160.4.636
Horowitz-Kraus, T., and Holland, S. K. (2015). Greater functional connectivity between reading and error-detection regions following training with the reading acceleration program in children with reading difficulties. Ann. Dyslexia 65, 1–23. doi:10.1007/s11881-015-0096-9
Jaekel, J., Wolke, D., and Bartmann, P. (2013). Poor attention rather than hyperactivity/impulsivity predicts academic achievement in very preterm and full-term adolescents. Psychol. Med. 43, 183–196. doi:10.1017/S0033291712001031
Jones, S. A. H., Butler, B., Kintzel, F., Salmon, J. P., Klein, R. M., and Eskes, G. A. (2015). Measuring the components of attention using the Dalhousie Computerized Attention Battery (DalCAB). Psychol. Assess. 27, 1286–1300. doi:10.1037/pas0000148
Kappe, R., and Van der Flier, H. (2012). Predicting academic success in higher education: what’s more important than being smart? Eur. J. Psychol. Educ. 27, 605–619. doi:10.1007/s10212-011-0099-9
Kennett, D. J., and Reed, M. J. (2009). Factors influencing academic success and retention following a 1st-year post-secondary success course. Educ. Res. Eval. 15, 153–166. doi:10.1080/13803610902804382
Krumm, S., Lipnevich, A. A., Schmidt-Atzert, L., and Bühner, M. (2012). Relational integration as a predictor of academic achievement. Learn. Ind. Differ. 22, 759–769. doi:10.1016/j.lindif.2012.05.002
Kwong, D., and Davis, J. R. (2015). School climate for academic success: a multilevel analysis of school climate and student outcomes. J. Res. Educ. 25, 68–81.
Larsson, H., Anckarsater, H., Rastam, M., Chang, Z., and Lichtenstein, P. (2012). Childhood attention-deficit hyperactivity disorder as an extreme of a continuous trait: a quantitative genetic study of 8,500 twin pairs. J. Child Psychol. Psychiatry 53, 73–80. doi:10.1111/j.1469-7610.2011.02467.x
Lauth, B., Arnkelsson, G. B., Magnússon, P., Skarphéðinsson, G. A., Ferrari, P., and Pétursson, H. (2010). Parent–youth agreement on symptoms and diagnosis: assessment with a diagnostic interview in an adolescent inpatient clinical population. J. Physiol. Paris 104, 315–322. doi:10.1016/j.jphysparis.2010.09.004
Lellis, V. R. R., Mariani, M. M. D. C., Ribeiro, A. D. F., Cantiere, C. N., Teixeira, M. C. T. V., and Carreiro, L. R. R. (2013). Voluntary and automatic orienting of attention during childhood development. Psychol. Neurosci. 6, 15–21. doi:10.3922/j.psns.2013.1.04
Lubke, G. H., Hudziak, J. J., Derks, E. M., van Bijsterveldt, T. C., and Boomsma, D. I. (2009). Maternal ratings of attention problems in ADHD: evidence for the existence of a continuum. J. Am. Acad. Child Adolesc. Psychiatry 48, 1085–1093. doi:10.1097/CHI.0b013e3181ba3dbb
Lundwall, R. A., Dannemiller, J. L., and Goldsmith, H. H. (2017). Genetic associations with reflexive visual attention in infancy and childhood. Dev. Sci. 20, e12371. doi:10.1111/desc.12371
Lundwall, R. A., Guo, D.-C., and Dannemiller, J. L. (2012). Exogenous visual orienting is associated with specific neurotransmitter genetic markers: a population-based genetic association study. PLoS ONE 7:e30731. doi:10.1371/journal.pone.0030731
Lynch, C. J. (2014). Towards a reconceptualization of the temporoparietal junction in stimulus-driven attention. J. Neurosci. 34, 13277–13278. doi:10.1523/JNEUROSCI.2996-14.2014
Mathis, W. J. (2010). The “Common Core” Standards Initiative: An Effective Reform Tool? University of Colorado at Boulder and Education Policy Research Unit (EPRU) at Arizona State University. Available at: http://nepc.colorado.edu/publication/common-core-standards
McDonald, S., Bennett, K. M. B., Chambers, H., and Castiello, U. (1999). Covert orienting and focusing of attention in children with attention deficit hyperactivity disorder. Neuropsychologia 37, 345–356. doi:10.1016/S0028-3932(98)00078-5
McLean, J. F., and Hitch, G. J. (1999). Working memory impairments in children with specific arithmetic learning difficulties. J. Exp. Child Psychol. 74, 240–260. doi:10.1006/jecp.1999.2516
Miller, E. K., and Buschman, T. J. (2013). Cortical circuits for the control of attention. Curr. Opin. Neurobiol. 23, 216–222. doi:10.1016/j.conb.2012.11.011
Murrell, A. R., Lester, E. G., and Sandoz, E. K. (2015). Grounding turbulent minds: the challenges of mindfulness-based interventions for college students with ADHD and how to overcome them. J. Coll. Stud. Psychother. 29, 314. doi:10.1080/87568225.2015.1074022
Natale, E., Marzi, C. A., Girelli, M., Pavone, E. F., and Pollmann, S. (2006). ERP and fMRI correlates of endogenous and exogenous focusing of visual-spatial attention. Eur. J. Neurosci. 23, 2511–2521. doi:10.1111/j.1460-9568.2006.04756.x
National Governors Association Center for Best Practices & Council of Chief State School Officers. (2010). Common Core State Standards. Washington, DC: National Governors Association Center for Best Practices, Council of Chief State School Officers.
Nevo, E., and Bar-Kochva, I. (2015). The relations between early working memory abilities and later developing reading skills: a longitudinal study from kindergarten to fifth grade. Mind Brain Educ. 9, 154–163. doi:10.1111/mbe.12084
Nigg, J. T., Swanson, J. M., and Hinshaw, S. P. (1997). Covert visual spatial attention in boys with attention deficit hyperactivity disorder: lateral effects, methylphenidate response and results for parents. Neuropsychologia 35, 165–176. doi:10.1016/S0028-3932(96)00070-X
Oberle, E., and Schonert-Reichl, K. A. (2013). Relations among peer acceptance, inhibitory control, and math achievement in early adolescence. J. Appl. Dev. Psychol. 34, 45–51. doi:10.1016/j.appdev.2012.09.003
Ortlieb, E. (2013). Using anticipatory reading guides to improve elementary students’ comprehension. Int. J. Instruct. 6, 145–162.
Porter, A., McMaken, J., Hwang, J., and Yang, R. (2011). Common core standards the new US intended curriculum. Educ. Res. 40, 103–116. doi:10.3102/0013189X11405038
Posner, M. I. (1980). Orienting of attention. Q. J. Exp. Psychol. 32, 3–25. doi:10.1080/00335558008248231
Posner, M. I. (2016). Orienting of attention: then and now. Q. J. Exp. Psychol. 69, 1864–1875. doi:10.1080/17470218.2014.937446
Posner, M. I., and Rao, S. M. (2012). “Cognitive neuroscience: development and prospects,” in Current Trends In Science: Platinum Jubilee Special, ed. M. Mukunda (Bangalore: Indian Academy of Sciences), 419–429.
Roche, K. M., and Ghazarian, S. R. (2012). The value of family routines for the academic success of vulnerable adolescents. J. Fam. Issues 33, 874–897. doi:10.1177/0192513X11428569
Roemer, M. (2000). Assessing the Quality of the March Current Population Survey and the Survey of Income and Program Participation Income Estimates. Unpublished Paper. US Census Bureau. Available at: https://www.census.gov/content/dam/Census/library/working-papers/2000/demo/assess1.pdf
Roķe, L., and Kālis, E. (2015). Is there a link between creativity and school grades? Research with 9th grade students. Int. J. Psychol. 16, 7–22. doi:10.7220/2345-024X.16.1
Ross, C. E., and Reynolds, J. R. (1996). The effects of power, knowledge, and trust on incone disclosure in surveys. Soc. Sci. Q. 77, 899–911.
Roy-Campbell, Z. (2012). Meeting the needs of English learners. J. Adolesc. Adult Literacy 56, 186–188. doi:10.1002/JAAL.00125
Schafer, J. L., and Graham, J. W. (2002). Missing data: our view of the state of the art. Psychol. Methods 7, 147–177. doi:10.1037/1082-989X.7.2.147
Schroeder, M. A., Lander, J., and Levine-Silverman, S. (1990). Diagnosing and dealing with multicollinearity. West. J. Nurs. Res. 12, 175–187. doi:10.1177/019394599001200204
Silver, R. B., Measelle, J. R., Armstrong, J. M., and Essex, M. J. (2010). The impact of parents, child care providers, teachers, and peers on early externalizing trajectories. J. Sch. Psychol. 48, 555–583. doi:10.1016/j.jsp.2010.08.003
Swan, J. E., and Epley, D. E. (1981). Completion and response rates for different forms of income questions in a mail survey. Percept. Mot. Skills 52, 219–222. doi:10.2466/pms.1981.52.1.219
Tabachnick, B., and Fidell, L. (2012). Using Multivariate Statistics, 6th Edition. Needham Heights, MA: Allyn & Bacon.
Tein, J.-Y., Roosa, M. W., and Michaels, M. (1994). Agreement between parent and child reports on parental behaviors. J. Marriage Fam. 56, 341–355. doi:10.2307/353104
Tienken, C. H. (2011). Common core standards: the emperor has no clothes, or evidence. Kappa Delta Pi Record 47, 58–62. doi:10.1080/00228958.2011.10516562
Trapmann, S., Hell, B., Hirn, J.-O. W., and Schuler, H. (2007). Meta-analysis of the relationship between the Big Five and academic success at university. Z. Psychol. 215, 132–151.
Troia, G. A., and Graham, S. (2016). Common core writing and language standards and aligned state assessments: a national survey of teacher beliefs and attitudes. Read. Writ. 29, 1719–1743. doi:10.1007/s11145-016-9650-z
Valiente, C., Lemery-Chalfant, K., Swanson, J., and Reiser, M. (2008). Prediction of children’s academic competence from their effortful control, relationships, and classroom participation. J. Educ. Psychol. 100, 67–77. doi:10.1037/0022-0663.100.1.67
Van Buuren, S., Boshuizen, H. C., and Knook, D. L. (1999). Multiple imputation of missing blood pressure covariates in survival analysis. Stat. Med. 18, 681–694. doi:10.1002/(SICI)1097-0258(19990330)18:6<681::AID-SIM71>3.0.CO;2-R
Visintin, E., De Panfilis, C., Antonucci, C., Capecci, C., Marchesi, C., and Sambataro, F. (2015). Parsing the intrinsic networks underlying attention: a resting state study. Behav. Brain Res. 278, 315–322. doi:10.1016/j.bbr.2014.10.002
Von Stumm, S., Hell, B., and Chamorro-Premuzic, T. (2011). The hungry mind: intellectual curiosity is the third pillar of academic performance. Perspect. Psychol. Sci. 6, 574–588. doi:10.1177/1745691611421204
Weikum, W. M., Brain, U., Chau, C. M., Grunau, R. E., Boyce, W. T., Diamond, A., et al. (2013). Prenatal serotonin reuptake inhibitor (SRI) antidepressant exposure and serotonin transporter promoter genotype (SLC6A4) influence executive functions at 6 years of age. Front. Cell. Neurosci. 7:180. doi:10.3389/fncel.2013.00180
Wiik, K. L., Loman, M. M., Van Ryzin, M. J., Armstrong, J. M., Essex, M. J., Pollak, S. D., et al. (2011). Behavioral and emotional symptoms of post-institutionalized children in middle childhood. J. Child Psychol. Psychiatry 52, 56–63. doi:10.1111/j.1469-7610.2010.02294.x
Wu, H.-Y., Kung, F. Y., Chen, H.-C., and Kim, Y.-H. (2017). Academic success of “tiger cubs” self-control (not IQ) predicts academic growth and explains girls’ edge in Taiwan. Soc. Psychol. Personal. Sci. 8, 698–705. doi:10.1177/1948550616675667
Appendix
Sample Science Item from Eighth Grade WKCE
Parent Ratings of Impulsivity and Inhibition Predict State Testing Scores, Appendix (p. 42 of the unpublished manuscript). Reproduced with permission from The McGraw-Hill Companies, Inc. Retrieved June 2015 from https://web.archive.org/web/20150501032808/http://oea.dpi.wi.gov/assessment/WKCE/sampleitems/science with permission from the Wisconsin Department of Public Instruction, 125th South Webster Street, Madison, WI, 53703, 1-800-243-8782.
Sample Social Studies Item from Eighth Grade WKCE
Parent Ratings of Impulsivity and Inhibition Predict State Testing Scores, Appendix (p. 42 of the unpublished manuscript). Reproduced with permission from The McGraw-Hill Companies, Inc. Retrieved June 2015 from https://web.archive.org/web/20150501032947/http://oea.dpi.wi.gov/assessment/WKCE/sampleitems/socialstudies with permission from the Wisconsin Department of Public Instruction, 125th South Webster Street, Madison, WI, 53703, 1-800-243-8782.
Keywords: selective attention, orienting, exogenous attention, state academic performance, socioemotional skills
Citation: Lundwall RA and Hodges CB (2018) Parent Ratings of Impulsivity and Inhibition Predict State Testing Scores. Front. Educ. 3:15. doi: 10.3389/feduc.2018.00015
Received: 21 November 2017; Accepted: 15 February 2018;
Published: 26 March 2018
Edited by:
Jesus de la Fuente, University of Almería, SpainReviewed by:
Jie Zhang, State University of New York at Brockport, United StatesPin-Ju Chen, St. Mary’s Junior College of Medicine, Nursing and Management, Taiwan
Copyright: © 2018 Lundwall and Hodges. This is an open-access article distributed under the terms of the Creative Commons Attribution License (CC BY). The use, distribution or reproduction in other forums is permitted, provided the original author(s) and the copyright owner are credited and that the original publication in this journal is cited, in accordance with accepted academic practice. No use, distribution or reproduction is permitted which does not comply with these terms.
*Correspondence: Rebecca A. Lundwall, cmViZWNjYV9sdW5kd2FsbEBieXUuZWR1