 Florian Sense
 Rob R. Meijer
 Hedderik van Rijn
- 1Department of Experimental Psychology, University of Groningen, Groningen, Netherlands
- 2Behavioral and Cognitive Neuroscience, University of Groningen, Groningen, Netherlands
- 3Department of Psychometrics and Statistics, University of Groningen, Groningen, Netherlands
Learners differ in their learning aptitude. Modern computerized fact-learning systems take these individual differences into account by adapting repetition schedules to the learner's characteristics. Adaptation is based on monitoring responses during learning and using these responses to inform the model's decisions about when to introduce and repeat material by updating the model's internal parameters. Typically, adaptive systems start a learning session with a set of default parameters, with these parameters being updated and adapted to the learner's characteristics when responses are collected. Here we explore whether domain-general individual differences such as working-memory capacity or measures of general intelligence, which can be assessed prior to learning sessions, can inform the choice of initial model parameters. Such an approach is viable if the domain-general individual differences are related to the model parameters estimated during learning. In the current study, we asked participants to learn factual information, and assessed whether their learning performance, operationalized as (1) a model-parameter that captures the rate of forgetting, and (2) the results on an immediate and delayed post-test, was related to two common measures of individual differences: working memory capacity (WMC) and general cognitive ability (GCA). We failed to find evidence in favor for such relations, suggesting that, at least in this relatively small and homogeneous sample, executive functioning and attentional control did not play important roles in predicting delayed recall. The model parameters estimated during learning, on the other hand, are highly correlated with delayed recall of the studied material.
Introduction
Individual differences in learning ability are ubiquitous. Adaptive fact-learning systems aim to identify such differences in order to tailor the introduction and repetition of material to the needs of each learner. Ideally, such a personalized approach yields better learning outcomes. Model-based fact-learning systems postulate that learning and forgetting follow general patterns that are qualitatively identical across learners but that the exact quantitative properties of, for example, forgetting curves can vary between learners. One central question in this domain concerns the method for detecting and quantifying individual differences.
There are many adaptive models proposed to optimize fact-learning (e.g., Wozniak and Gorzelanczyk, 1994; Lindsey et al., 2014; Papoušek et al., 2014; Settles and Meeder, 2016). The exact mechanism employed by these models differ, but the overall assumption is that each learner's behavior can be described by a set of equations with free parameters to accommodate between-learner variation. At the start of a learning session, the optimal parameters for a learner are unknown and the systems use the learner's responses during the session to estimate a learner's optimal parameters. Before such responses are collected, however, the systems do typically not have access to any information about the learner and the models use default parameters as starting values. Here, we explore the possibility of using additional information about participants—obtained before the learning session—that could indicate a learner's ability and thus can be used to personalize starting values.
In the present study, we use the estimated learning parameters extracted from the adaptive fact-learning system developed in our lab (van Rijn et al., 2009; Sense et al., 2016a) as a domain-specific, on-task measure of individual differences. As additional ability measures, we will use two well-established domain-general individual differences measures: general cognitive ability (GCA; i.e., fluid intelligence) and working memory capacity (WMC).
Both GCA and WMC have been used extensively as predictors of individual differences in the ability to learn. For example, Gathercole and Baddeley reported that children with lower WMC were slower at learning unfamiliar names of toys (Gathercole and Baddeley, 1990) and demonstrated that WMC can predict the development of vocabulary in young children beyond what chronological age and GCA can predict (Gathercole and Baddeley, 1989). Juffs and Harrington (2011) emphasized that WM plays a central role in second language acquisition and Unsworth et al. (2009) suggested that both individual differences in WMC and the ability to retrieve information from long-term memory account for the link between GCA and WMC (Unsworth and Engle, 2007; Unsworth, 2016). These examples indicate that GCA and WMC are related but not identical constructs (Ackerman et al., 2005; Kane et al., 2005) and that they explain unique aspects of the individual differences in learners' ability. Consequently, they might be related to the memory-based parameters used by adaptive fact-learning models, and hence inform personalized starting parameters for the learning models.
The fact-learning system developed in our lab is based on ACT-R's declarative memory equations (Anderson et al., 1998; Pavlik and Anderson, 2005, 2008). It assumes that each fact presented to a learner is encoded in memory and subsequently decays over time, thus becoming less available for retrieval. Differences in the speed with which item content decays are captured in a single parameter. This parameter is estimated for each item/learner combination separately and is continuously adjusted based on the learner's response accuracy and latency to each test event during learning (van Rijn et al., 2009). Given a learner's response history to an item, the model can predict—for a given moment in the study session—whether an item could be recalled and how long a successful memory retrieval would take. Based on such predictions, the system devises an adaptive practice schedule that repeats an item before it is predicted to be irretrievable. When an item is chosen for rehearsal, only the cue (e.g., a foreign language word) is shown and the learner has to retrieve the correct response (e.g., the correct translation). This approach ensures that the retrieval process is practiced and that learners benefit from the testing effect (see van den Broek et al., 2016 for a review).
On each repetition of an item, the model's predictions are compared with the learner's response and the model's parameters are adjusted as a function of the observed difference: If a response to an item was much slower than the model predicted, that item's parameter would be adjusted upward to reflect faster-than-expected forgetting. This updating takes place after each recorded response and also takes past repetitions into account to best reflect a learner's history with a given item (see Sense et al., 2016a for technical details; van Rijn et al., 2009). Consequently, the model's parameters incorporate the information about a learner's ability that is reflected in their responses during learning. By averaging across the item-specific parameter values at the end of the study session, we can compute a value that indicates how quickly, on average, each learner forgets the items in the studied set. We will refer to this value as the rate of forgetting (see Sense et al., 2016a for a detailed description of the model and similar use of the model parameters/rates of forgetting; van Rijn et al., 2009).
The goal of the present study is to explore the relationship between the rate of forgetting estimated during learning and established measures of individual cognitive differences. This is interesting for two reasons. First, if additional measures of cognitive ability are related to parameter values estimated during the learning session, they might allow the system to pick personalized default values, essentially adapting to the learner before the first session. And second, evidence for a correlation between estimated parameter values and established measures of cognitive ability would be of theoretical interest in the same way that the relationship between WMC and GCA is interesting. Evidence for the lack of a relationship would be similarly interesting, since it would imply that the model's parameters encapsulate individual differences that are orthogonal to WMC/GCA. Either way, the data will shed more light on the processes involved in and producing individual differences in fact learning.
If between-subject variance in executive functioning and attentional control played an important role in fact learning using computerized learning environments, we would expect those processes to exert their influence on two outcome measures: (1) the estimated rate of forgetting should be negatively correlated with GCA and/or WMC, and (2) delayed recall performance could be (partially) predicted by both the estimated rate of forgetting and working memory capacity and GCA (or an interaction between these measures). If, on the other hand, the rate of forgetting did not correlate negatively with either GCA or WMC, we should assume that the model's parameters capture individual differences that are independent of individual differences in GCA and WMC.
Materials and Methods
Procedure
All 126 participants were invited for two sessions that were spaced 3 days apart. This study was part of a larger project assessing predictors of academic success (Niessen et al., 2018). See Figure 1 for an overview of the administered tasks and information about loss of data from each task and between the two sessions.
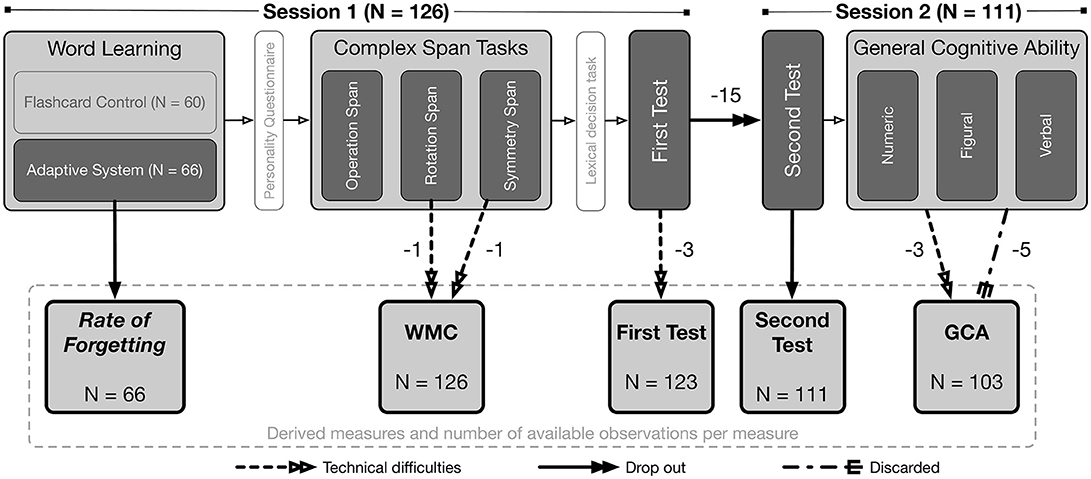
Figure 1. Overview of the administered tasks, of the derived measures, and of how many participants' data was not available and the reasons for data loss. Boxes without fill correspond to tasks that participants completed but that were not relevant for the current study.
Session 1
In the first session participants spent 20 min learning 35 Swahili-Dutch word-pairs. Participants were randomly assigned to study with one of two methods: either they used the adaptive learning method outlined in the Introduction, or digital flashcards. The two conditions only differed in the order in which items were scheduled for repetition. In both conditions, items were presented for the first time as “study trials” (showing both the cue/Swahili word and the response/Dutch word) and all subsequent repetitions were “test trials” (showing only the cue/Swahili word). As we will focus here on the rates of forgetting that are estimated during learning with the adaptive learning method, used by 66 participants, we will refrain from further discussion of the digital flashcard method. We refer the interested reader to the supplement (https://osf.io/yz7bn/), which includes a detailed comparison of the flashcard and adaptive learning conditions.
After the study session, participants completed a personality questionnaire, which took an average of 11.3 min to complete [range = (7; 32) minutes]. The results from the questionnaire will not be discussed here as they were part of another study (Niessen et al., 2018).
Next, to assess working memory capacity, participants completed the three complex span tasks used by Foster et al. (2015). In these tasks, participants were shown items that needed to be recalled in the correct order at the end of each trial. Each to-be-remembered item is followed by a distractor, which requires the participant to engage executive attentional processes. This is to reduce the ability to rehearse to-be-remembered items. In the Operation Span task, for example, to-be-remembered items are letters, and distractors are simple true/false equations [e.g., (2 × 2) −1 = 3]. The order of the tasks was identical across participants (Foster et al., 2015): first Operation Span, followed by Rotation Span, and then Symmetry Span. The computation of a participant's WMC based on performance in these tasks is explained in detail below.
The time it took to complete the personality questionnaire and the complex span tasks varied between participants. To ensure that the retention interval between the word-learning task and the test was identical across participants, a simple lexical decision task was administered as a filler task before the test. The task was setup in such a way that it would end as soon as the retention interval was 80 min, irrespective of the number of trials completed. For the task, five-letter strings were presented on screen and participants had to press one of two buttons to indicate whether the string was a Dutch word or not. By using high frequency words, the task was made relatively easy to avoid fatigue. Although accuracy levels were below 75% for three participants, visual inspection of the response time distributions did not indicate failure to respond to the instructions1. Thus, no participant was excluded based on their performance in the lexical decision filler task. The data from this filler task will not be analyzed or discussed further.
Finally, a test of the word-pairs that were studied at the beginning of the session was administered. All 35 Swahili cues were shown on screen as a list and the participant had to provide the correct Dutch translation. The test was self-paced and all words were visible at the same time: Participants were able to provide answers in any order they preferred. No feedback was provided.
Session 2
Three days later, all but 15 participants returned for the second session, which started with a second test of the Swahili-Dutch word-pairs learned at the beginning of the first session (see Figure 1). The test was identical to the one completed at the end of Session 1.
Subsequently, we assessed the participants' general cognitive abilities (GCA) by administering the Q1000 Cognitive Capacity test (Van Bebber et al., 2010), which took participants between 32 and 87 min to complete. Mean completion time was 56 min. In contrast to more traditional tests of GCA, this test can be administered online at multiple computers simultaneously and upon completion, the website provided participants with feedback about their performance as compared to others in the norm group. For our analyses, we utilized raw scores on the test rather than the normed scores communicated to the participants (details are discussed below).
Materials and Measures
Swahili-Dutch Word-Pairs
The 35 items were a random subset the list of 100 Swahili-English word-pairs provided by Nelson and Dunlosky (1994) (see https://osf.io/yz7bn/ for the exact list). The English responses were translated into Dutch and all participants studied the same subset of 35 word-pairs. The order in which words were introduced throughout the 20 min session was randomized per participant. For the participants that used the adaptive system, the rate of forgetting was estimated using the parameters that are estimated for each item that each participant studied. When a new item is introduced, the parameter starts with the default value of 0.3 and is subsequently updated after each repetition of the item to reflect the response accuracy and latency of the participant. The parameter captures the decay of the memory trace associated with each item such that lower values indicate slower decay. The rate of forgetting is computed by using the parameter value of each studied item at the end of the session and computing the mean across the item-level parameter values such that one measure is derived for each participant. This measure indicates how quickly, on average, the model estimates a participant to forget the studied material (for more details and background, see (Sense et al., 2016a) where we used the same procedure; van Rijn et al., 2009).
Complex Span Tasks
The code for the three complex span tasks was obtained from the Engle lab's website2 and used with permission. This was the same code used by Foster et al. (2015) but all instructions were translated into Dutch by native speakers. Scores reported in Table 1 are partial-credit unit scores (Conway et al., 2005). To express a single measure of WMC, the scores on the three complex span tasks were summarized into a single composite score. This was done by calculating a participant's z-score for each task and then computing a z-score average for each participant (Foster et al., 2015). We refer to the composite score as a participant's WMC (Conway et al., 2005).
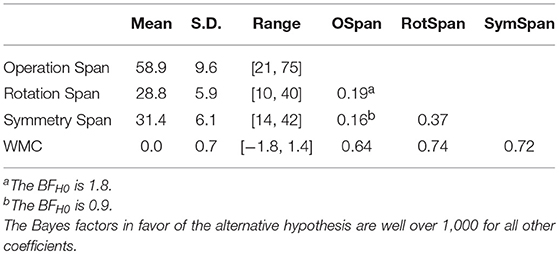
Table 1. Descriptive statistics for the complex span tasks and their composite score (WMC) as well as the correlations between all measures.
General Cognitive Ability
As a measure of GCA, we used Q1000 Capaciteiten Hoog (“High Capacity”; normed for university-educated individuals) developed by Meurs HRM3 The test has seven sub-scales that are ordered hierarchically with the goal of measuring general intelligence. The seven sub-scales can be reduced to reflect three scores for verbal, numerical, and figural capacity, respectively. Those three scores are then averaged to yield a participant's GCA. The Committee on Test Affairs Netherlands (Dutch abbreviation: COTAN4 has certified the test as a valid and reliable measure of GCA (see also Van Bebber et al., 2010). The ability score reported here was the mean across the proportion of correct responses on each subscale. The resulting scores were subsequently multiplied by ten to create an easy to interpret 0-to-10 scale.
Participants
A total of 126 participants were recruited from the Dutch 1st year participant pool at the University of Groningen and participated for course credit. Of those, 89 were female (71%) and the median age was 20 [SD = 1.55; range = (18, 26)]. All participants spoke Dutch and no one indicated any familiarity with Swahili. All participants gave written informed consent and the Ethics Committee Psychology approved the study (ID: 15006-N).
Figure 1 gives an overview of the tasks that were administered and which measures were derived for how many participants. Of the 126 participants in Session 1, 66 studied the Swahili-Dutch word-pairs using the adaptive system, which resulted in estimated rates of forgetting for those participants. Due to technical difficulties, data in the Rotation Span task was lost for one participant and in the Symmetry Span task for another participant. The composite scores (i.e., WMC) for these two individuals were based on the z-score average of the two remaining tasks, thus resulting in WMC measures for all 126 participants. Due to technical difficulties, the responses on the first test were not saved on the server for three participants. A total of 15 participants did not return for the second session5. All 111 participants that did return completed the second test for the Swahili-Dutch word-pairs. On the GCA test, three participants entered invalid participant IDs so their data could not be recovered and five participants finished the test very quickly (in < 30 min) with poor scores so their data were disregarded. Hence, GCA estimates are available for 103 participants.
It is important to note that participants with incomplete data were also included in the analyses reported below. All correlation coefficients and regression models were fit on the maximum amount of data that was available for any given analysis.
Analyses
Our first question—whether the rate of forgetting is related to GCA and/or WMC—was addressed by computing correlations among the measured constructs. More specifically, we computed Pearson's product-moment correlations and employed one-sided tests because we had clear, directional expectations about the relationships among all obtained measures (Cho and Abe, 2013) and we report Bayes factors for these tests (Wagenmakers et al., 2016b).
The second question—whether GCA and/or WMC can make significant contributions to predicting delayed recall—was addressed by fitting multiple linear regression models and comparing them using Bayesian model comparison (Rouder and Morey, 2012) to determine which (combination of) variables can best predict variance in delayed recall performance. This was done using the BayesFactor package (Morey and Rouder, 2015) in R (R Development Core Team, 2016). Again, Bayes factors were used to express the evidence the data provided for each model relative to a reference model. As a reference model, we chose the full model that contains as predictors all three measures—the rate of forgetting, working memory capacity, and general cognitive ability—and all interactions.
We opted to report Bayes factors for all analyses because their ability to express the likelihood of observing the data under the null hypothesis has several theoretical and practical advantages over a “null finding” in the traditional null hypothesis testing framework (Gallistel, 2009; Mulder and Wagenmakers, 2016; Wagenmakers et al., 2016a). Another reason to favor Bayes factors is that they quantify the evidence that observed data provide for competing hypotheses, which avoids certain pitfalls associated with computing power post-hoc (Wagenmakers et al., 2015). We will use the subscript “H0” for Bayes factors expressing evidence in favor of the null model and the subscript “H1” for Bayes factors expressing evidence in favor of the alternative model. When interpreting the strength of the evidence, we will use semantics suggested by Kass and Raftery (1995): 1 < BF < 3 provide anecdotal, 3 < BF < 20 provide positive, 20 < BF < 150 provide strong, and BF > 150 provide very strong evidence. We refer the interested reader to the online supplement at https://osf.io/yz7bn/, which includes traditional null hypothesis significance test equivalents for all analyses, and to https://osf.io/q59p4/ specifically for a version of Figure 2 that includes p-values.
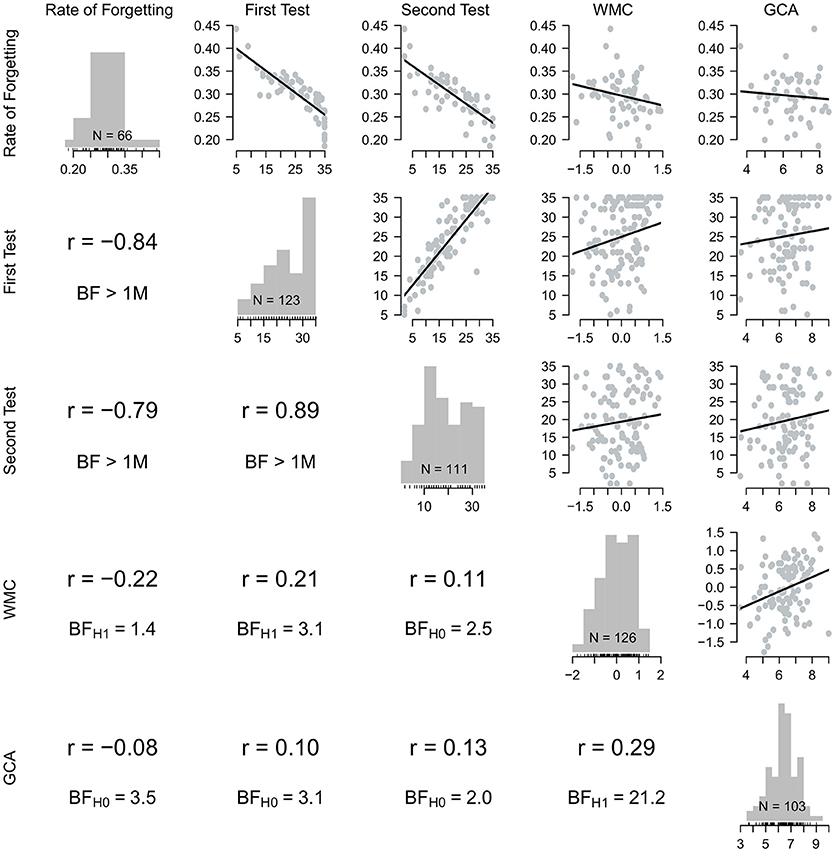
Figure 2. Depicted are the measures of interest: the estimated rate of forgetting, the scores on the first and second Swahili-Dutch test, working memory capacity (WMC), and general cognitive ability (GCA). Note that Bayes factors correspond to the directional hypotheses that correlation coefficients are positive (except for the correlations with the rate of forgetting in the leftmost column: those are expected to be negative).
Results
A participant's WMC, their GCA, and the rate of forgetting were computed as detailed above. Scripts for all reported and additional analyses can be found at https://osf.io/yz7bn/ along with the raw data. Before addressing the two main questions, we will report relevant descriptive statistics for the three most relevant measures, showing that these measures are distributed as we would expect and exhibit the necessary internal consistency. Tables 1, 2 provide descriptive statistics and summarize the correlations among the components of a learner's WMC and GCA, respectively.
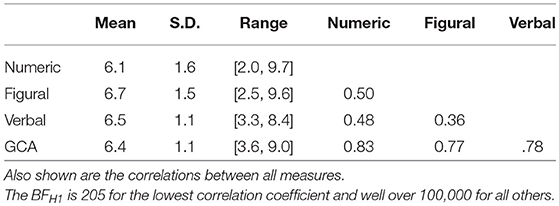
Table 2. Descriptive statistics for the Q1000 Capacity Test for the three components and the combined general cognitive ability (GCA) score.
For WMC, the correlations among scores on the three complex span tasks and their composite scores were all positive. The two correlation coefficients between the scores on the Operation Span task and the other two complex span tasks were relatively low (0.16 and 0.19), most likely due to the participants' relatively high scores, which imposes a limit on observable correlations. Overall, Table 1 confirms the expected pattern for the individual tasks in relation to the composite score: The correlations between the scores on the tasks are relatively low but they all correlate highly with the composite score.
For GCA, the correlations among scores on the three components and their combined score are also all positive and the data provide very strong evidence that all coefficients differ from 0: the Bayes factors for the lowest coefficient is 205 in favor of the alternative model and the Bayes factors for all other coefficients are >100,000.
The 66 participants that used the adaptive method (see Figure 1) studied an average of 31.7 items (out of 35; SD = 10.2). Each item was repeated an average of 7.0 times (SD = 3.99). To compute the rate of forgetting, we averaged the final parameter values estimated by the adaptive fact-learning model for all items that were repeated at least three times (97.9% of item-participant pairs, 43 pairs were discarded; see Sense et al., 2016a for more details on this procedure). The mean rate of forgetting was.296 with a standard deviation of 0.046 [range = (0.186; 0.442)].
Correlational Analyses
The relationships among all measures are summarized in Figure 2. The five measures of interest are arranged from left to right and top to bottom, essentially forming a correlation matrix that is supplemented with additional information. On the diagonal, the figure depicts the distribution of each measure as a histogram. Also shown are the number of observations for each measure (cf. Figure 1). On the upper off-diagonal, scatterplots with fitted linear regression lines are shown (Anscombe, 1973). The corresponding Pearson correlations are shown on the lower off-diagonal, along with Bayes factors (Wagenmakers et al., 2016b). All correlations are expected to be positive (except for the correlations with the rate of forgetting for which we would assume a negative correlation, if any) and the Bayes factors quantify the evidence for these directional hypotheses. The plot can be read both by column (vertically) and by row (horizontally) to give a comprehensive overview of the underlying data: For the rate of forgetting, for example, we can see in the first column the correlation coefficients along with the Bayes factors for the directional hypotheses. For the complete picture, however, one should also consider the first row and inspect the scatterplots of the underlying data (Anscombe, 1973), which reveal, for example, at-ceiling performance on the first test that dissipates for the second test 3 days later.
Since a higher rate of forgetting indicates faster forgetting, we would expect all correlations in the leftmost column of Figure 2 to be negative. This is confirmed for the correlations with both the first and second test scores reported in the second and third row/column, respectively. The correlations are very high, suggesting that the estimated rate of forgetting is a good predictor of test performance both 80 min and 3 days later. The correlation between a learner's rate of forgetting and their WMC is also negative, but evidence for the alternative hypothesis is anecdotal (BFH1 = 1.4). With regards to the correlations between rates of forgetting and GCA, the Bayes factors provide positive evidence that the null model is more likely given the data (BFH0 = 3.5).
The scores from the two Swahili-Dutch tests are highly and positively correlated with each other. We would expect test scores to correlate positively with WMC and GCA and all coefficients are indeed positive (see columns/rows 2 and 3 in Figure 2). The data provide positive evidence that the score on the first test is related to WMC (r = 0.21; BFH1 = 3.1) but the evidence is anecdotal for the test score obtained 3 days later (r = 0.11; BFH0 = 2.5).
To test whether GCA is positively related to immediate and delayed test performance on the Swahili-Dutch vocabulary tests, correlations were computed. The coefficients are low (r = 0.10 for the first and r = 0.13 for the second test) and the Bayes factors are inconclusive (BFH0 = 3.1 and BFH0 = 2.0, respectively). Visual inspection of the corresponding scatter plots in Figure 2 confirms the absence of a clear linear (or any) relationship between GCA and the two test scores.
Given the large body of previous research on the relationship between WMC and GCA (Conway et al., 2003; Kane et al., 2005), we would expect WMC and GCA to be positively correlated. This directional hypothesis is confirmed in our data: The Bayes factor confirms that there is strong evidence for a positive correlation (i.e., BFH1 = 21.2). The magnitude of the correlation coefficient (i.e., 29) is also roughly in the range we would expect (Conway et al., 2005).
Bayesian Model Comparison
To test to which extent the three measures of interest—rate of forgetting, GCA, and WMC—can predict delayed recall6, we fit a series of (multiple) linear regression models and compared them using Bayes factor model selection procedures (Rouder and Morey, 2012). The outcomes are summarized in Figure 3, which shows the Bayes factors (x-axis, log-scaled) for all models (y-axis). The models are labeled according to the included predictors. For models with more than one predictor, plus signs indicate that only main effects were included and an asterisk denotes that both main and interaction effects were included. All models are compared with the full model (which includes all three predictors and their interactions, i.e., ROF * WMC * GCA), which results in a Bayes factor of 1 for that particular model.
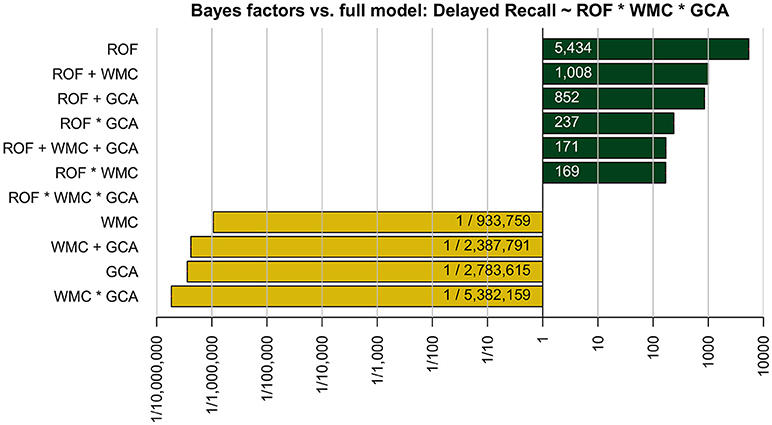
Figure 3. The Bayes factor (x-axis) for each model (y-axis) relative to the full model including the three constructs and all their interactions. In the model names on the y-axis, a “+” denotes that only main effects for the listed variables are included and an “*” denotes that both main and interaction effects are included. The variables abbreviations are ROF, rate of forgetting; WMC, working memory capacity; and GCA, general cognitive ability. The dependent variable in all models is the delayed recall performance 3 days later.
Figure 3 shows that the best-fitting model includes only the estimated rate of forgetting as a main effect. The worst model, on the other hand, includes both main and interaction effects of WMC and GCA but not the rate of forgetting. A striking pattern in Figure 3 is that the full model demarcates two clusters of models: The first cluster has Bayes factors much >1 (i.e., provide better fits relative to the full model) and all models in that cluster contain the rate of forgetting as a predictor. Furthermore, the models in that cluster decrease in complexity as the Bayes factors increase. The best model includes only the rate of forgetting as a predictor and fits the data 5.4 and 6.4 times better than the second and third best models, respectively (i.e., 5,434/1,008 and 5,434/852, respectively, see Figure 3). The second cluster of models has Bayes factors much smaller than 1 and none of the models include the estimated rate of forgetting. The same pattern is apparent: The more complex the model, the worse it does. This pattern suggests that adding either WMC or GCA (and any interaction between the two) increases the complexity of the model without explaining additional variance in delayed recall performance.
To summarize, the results of comparing the models provide clear evidence that the estimated rate of forgetting is the single best predictor of delayed recall. Adding either WMC or GCA (and any interaction) increases the model complexity without explaining more variance in recall performance. This finding is substantiated by the correlations reported in Figure 2. The correlation coefficients can be squared to obtain the amount of explained variance in delayed recall for the three models that only contain a single predictor. This, again, clearly demonstrates that the rate of forgetting can explain a lot more variance in recall 3 days later than WMC or GCA: 62.4% compared to 1.2 and 1.7%, respectively.
Discussion
We explored whether two commonly used measures of individual cognitive differences—WMC and GCA—are related to the rate of forgetting estimated while studying with the adaptive fact-learning system developed in our lab. We also tested whether those measures can predict delayed recall performance independent of or in conjunction with the rate of forgetting. The data presented here, although admittedly derived from a relatively small sample, do not provide strong evidence for either the presence or absence of a negative correlation between the rate of forgetting and GCA or WMC. The data provide strong evidence that the rate of forgetting explains significant amounts of variance in delayed recall performance. Furthermore, neither WMC nor GCA (on their own or together) predicted delayed recall.
The ability to capture individual differences in the mastery of studied material is a crucial benchmark of any adaptive learning system. The high correlations between the rate of forgetting and subsequent test performance on the studied material—a measure of mastery—reported here (see Figure 2) suggest that the model developed in our lab is able to capture relevant individual differences in the homogeneous sample tested here. The high negative correlations suggest that the information encapsulated in the model parameters provide a useful indication of how well a learner will do on a delayed test. This should, in theory, enable the model to recommend to a learner whether they should continue learning or not, based on the current model estimates. Exploring the viability of such an approach would be an interesting extension of the present work and highly relevant in educational practice.
Students typically study material like vocabulary unsupervised and their mastery is assessed by tests that are administered and scored by teachers. With a system like the one presented here, students' behavior during learning can inform both teachers and students: Teachers could see which students struggle with which type of material. Communicating effectively to teachers what the model has learned about a student (or material) during learning would be a prerequisite for this type of software to be used in classrooms in the first place (Bitner and Bitner, 2002) but could benefit both teachers and students, who could receive personalized recommendations for when to repeat material or predictions for how well they would perform in the future. The strong relationship between the estimated model parameters and subsequent performance on a cued delayed recall test presented here are a necessary first step for such applications.
In the setup used here, a learner can employ a number of different mnemonic strategies and all responses are self-paced. This, presumably, leaves room for variation in executive functioning and attentional control between learners to exert their influence on the testable end product of the learning session: delayed recall performance. Thus, we would expect individual differences in cognitive functioning to exercise their influence; both during learning and on subsequent test performance. Surprisingly, we did not find a positive relationship between executive functioning and attentional control—GCA and WMC—and delayed recall performance in the homogeneous sample tested here. The estimated rate of forgetting, on the other hand, made substantial contributions to explaining variance in delayed recall performance. In fact, Figure 3 makes clear that any model that includes the estimated rate of forgetting as a predictor outperformed any model that does not. These findings suggest that—at least in the current sample—GCA and WMC do not play important roles in predicting delayed recall of items studied using the adaptive fact-learning system developed in our lab.
It should be noted that WMC has been repeatedly validated as a domain-general construct (Conway et al., 2005). The adaptive learning model, on the other hand, is based on a theoretical framework specifically designed to trace the temporal dynamics of declarative memory processes (see, e.g., Anderson et al., 1998). As such, it is designed to capture individual differences in the narrow, domain-specific scope of fact learning. We expected that there would be a degree of overlap between the two memory measures but there is no evidence for such a relationship in the data presented herein.
The adaptive system used here currently uses the same starting value for the crucial parameter that captures individual differences, which implies that the model considers all learners to be the same until they provide responses during a learning session. This assumption is obviously wrong. As outlined above, the model parameter ultimately converges on values that capture meaningful individual differences between people. An important open question—both theoretically and practically—is how this process can be sped up such that the model converges on suitable values faster and thus provides better adaptive scheduling. The adaptive learning literature largely focusses on how to use the information from a learner's responses. Here, we explored whether measures on potentially relevant tasks obtained outside the learning session could inform personalized starting values for model parameters. However, given that we did not find a consistent relationship between a participant's WMC or GCA and their final rate of forgetting, we conclude that—at least in the current relatively homogeneous sample—neither of these domain-general measures would be a good candidate. As a result, we believe that focusing on domain- or even task-specific information that might be available for a given learner or the material that is studied is a more fruitful future endeavor.
It is important to note that a certain degree of caution is appropriate when interpreting these results and generalizing them to other samples and contexts. Our sample was relatively small and very homogeneous. We only recruited participants who spoke Dutch because the test of GCA was only available in Dutch. Furthermore, participants had to have completed their pre-university education to be admitted to the Bachelor Psychology program, making prior academic achievement a requirement. The participants in our sample are also around the same age with 80% of the participants between the ages of 18 and 21. Collectively, this results in a reduction of variance on all performance measures in the tested sample, and we belief that not all findings reported here necessarily generalize to the general population. It should be noted, however, that the tasks employed here are calibrated to the type of sample used: The complex span tasks were developed and are routinely used in university student populations (Redick et al., 2012; see section Normative Sample). The test of GCA was originally developed as a selection tool to determine whether a candidate has the necessary intellectual ability to perform well in cognitively demanding jobs and is normed for university graduates (Van Bebber et al., 2010). Thus, while the performance ranges on these measures might be restricted relative to the general population, we believe that the tasks used here are well-calibrated to detect differences within the narrower range of our homogeneous sample.
To summarize, we present data from a correlational study that explores whether the rate of forgetting estimated during fact-learning could serve as a domain-specific individual differences measure. We replicated previous (unpublished) findings showing a high negative correlation between the estimated rate of forgetting and delayed recall. Additionally, we show that—in a restricted, small sample—neither working memory capacity nor GCA are related to delayed recall. Keeping the limitations of the sample in mind, this implies that someone's rate of forgetting is the only individual differences measure tested here that can predict delayed recall.
Author’s Note
We thank Susan Niessen for her invaluable help in planning the experiment, collecting the data, and all aspects related to the Q1000 test. We also thank Atser Damsma, Anna Leonte, and Rob Nijenkamp for their help with the translations and Lukas Preis and Ron Woytaszek for their help with data collection. Supplementary materials, raw data, and code for the analyses are available at https://osf.io/yz7bn/. An earlier version of this work is included in FS's thesis (Sense, 2017) and a short description of the study based on the first 40 participants has been presented at the annual meeting of the Cognitive Science Society (Sense et al., 2016b). Please address correspondence to either FS (f.sense@rug.nl) or HVR (d.h.van.rijn@rug.nl), Grote Kruisstraat 2/1, 9712TS Groningen, The Netherlands.
Author Contributions
FS, RM, and HvR contributed to the conception and design of the study, the planning of the analyses, and the interpretation of the results. FS organized the database, performed the statistical analyses, and wrote the first draft of the manuscript. RM and HvR wrote section of the manuscript. All authors contributed to manuscript revision, read, and approved the submitted version.
Funding
FS and HvR were partially funded by EOARD grant #11926121 and HvR was partially funded by EU Horizon 2020 FET Proactive grant TimeStorm #641100.
Conflict of Interest Statement
The authors declare that the research was conducted in the absence of any commercial or financial relationships that could be construed as a potential conflict of interest.
Footnotes
1. ^One participant started responding randomly after about 500 trials. This participant performed very well in all other tasks and finished them very quickly, which meant the participant had to complete a large number of lexical decision task trials.
2. ^http://englelab.gatech.edu/taskdownloads.html
3. ^https://www.hellotest.nl/assessmentbureaus/meurs-assessment/
4. ^https://www.cotandocumentatie.nl/
5. ^Four of which could not attend the second session because the university building was closed due to extreme weather conditions.
6. ^The score on the second test – i.e., after a three-day delay – is used for these analyses but results are qualitatively identical if the first test score is used. For the sake of brevity, we refer the interested reader to the online supplement (https://osf.io/yz7bn/) for details on the alternate version of these analyses.
References
Ackerman, P. L., Beier, M. E., and Boyle, M. O. (2005). Working memory and intelligence: the same or different constructs? Psychol. Bull. 131, 30–60. doi: 10.1037/0033-2909.131.1.30
Anderson, J. R., Bothell, D., Lebiere, C., and Matessa, M. (1998). An integrated theory of list memory. J. Mem. Lang. 38, 341–380. doi: 10.1006/jmla.1997.2553
Bitner, N., and Bitner, J. (2002). Integrating technology into the classroom: eight keys to succes. J. Technol. Teach. Educ. 10, 95–100. Available online at: https://www.learntechlib.org/primary/p/9304/
Cho, H. C., and Abe, S. (2013). Is two-tailed testing for directional research hypotheses tests legitimate? J. Bus. Res. 66, 1261–1266. doi: 10.1016/j.jbusres.2012.02.023
Conway, A. R. A., Kane, M. J., Bunting, M. F., Hambrick, D. Z., Wilhelm, O., and Engle, R. W. (2005). Working memory span tasks: a methodological review and user's guide. Psychonom. Bull. Rev. 12, 769–786. doi: 10.3758/BF03196772
Conway, A. R. A., Kane, M. J., and Engle, R. W. (2003). Working memory capacity and its relation to general intelligence. Trends Cogn. Sci. 7, 547–552. doi: 10.1016/j.tics.2003.10.005
Foster, J. L., Shipstead, Z., Harrison, T. L., Hicks, K. L., Redick, T. S., and Engle, R. W. (2015). Shortened complex span tasks can reliably measure working memory capacity. Mem. Cogn. 43, 226–236. doi: 10.3758/s13421-014-0461-7
Gallistel, C. R. (2009). The importance of proving the null. Psychol. Rev. 116, 439–453. doi: 10.1037/a0015251
Gathercole, S. E., and Baddeley, A. D. (1989). Evaluation of the role of phonological STM in the development of vocabulary in children: a longitudinal study. J. Mem. Lang. 28, 200–213. doi: 10.1016/0749-596X(89)90044-2
Gathercole, S. E., and Baddeley, A. D. (1990). The role of phonological memory in vocabulary acquisition: a study of young children learning new names. Br. J. Psychol. 81, 439–454. doi: 10.1111/j.2044-8295.1990.tb02371.x
Juffs, A., and Harrington, M. (2011). Aspects of working memory in L2 learning. Lang. Teach. 44, 137–166. doi: 10.1017/S0261444810000509
Kane, M. J., Hambrick, D. Z., and Conway, A. R. A. (2005). Working memory capacity and fluid intelligence are strongly related constructs: comment on Ackerman, Beier, and Boyle (2005). Psychol. Bull. 131, 66–71. doi: 10.1037/0033-2909.131.1.66
Kass, R. E., and Raftery, A. E. (1995). Bayes factors. J. Am. Stat. Assoc. 90, 773–795. doi: 10.1080/01621459.1995.10476572
Lindsey, R., Shroyer, J. D., Pashler, H., and Mozer, M. C. (2014). Improving students' long-term knowledge retention through personalized review. Psychol. Sci. 25, 639–647. doi: 10.1177/0956797613504302
Mulder, J., and Wagenmakers, E.-J. (2016). Editors' introduction to the special issue “Bayes factors for testing hypotheses in psychological research: Practical relevance and new developments.” J. Math. Psychol. 72, 1–5. doi: 10.1016/j.jmp.2016.01.002
Nelson, T. O., and Dunlosky, J. (1994). Norms of paired-associate recall during multitrial learning of Swahili-English translation equivalents. Memory 2, 325–335. doi: 10.1080/09658219408258951
Niessen, A. S. M., Meijer, R. R., and Tendeiro, J. (2018). Admission testing for higher education: a multi-cohort study on the validity of high-fidelity curriculum-sampling tests. PLoS ONE 13:e0198746. doi: 10.1371/journal.pone.0198746
Papoušek, J., Pelánek, R., and Stanislav, V. (2014). “Adaptive practice of facts in domains with varied prior knowledge,” in Proceedings of the 7th International Conference on Educational Data Mining (EDM) (London, UK), 6–13.
Pavlik, P. I., and Anderson, J. R. (2005). Practice and forgetting effects on vocabulary memory: an activation-based model of the spacing effect. Cogn. Sci. 29, 559–586. doi: 10.1207/s15516709cog0000_14
Pavlik, P. I., and Anderson, J. R. (2008). Using a model to compute the optimal schedule of practice. J. Exp. Psychol. Appl. 14, 101–117. doi: 10.1037/1076-898X.14.2.101
R Development Core Team (2016). R: A Language and Environment for Statistical Computing. Manual, Vienna.
Redick, T. S., Broadway, J. M., Meier, M. E., Kuriakose, P. S., Unsworth, N., Kane, M. J., et al. (2012). Measuring working memory capacity with automated complex span tasks. Eur. J. Psychol. Assess. 28, 164–171. doi: 10.1027/1015-5759/a000123
Rouder, J. N., and Morey, R. D. (2012). Default Bayes factors for model selection in regression. Multivar. Behav. Res. 47, 877–903. doi: 10.1080/00273171.2012.734737
Sense, F. (2017). Making the Most of Human Memory: Studies On Personalized Fact-Learning and Visual Working Memory. University of Groningen.
Sense, F., Behrens, F., Meijer, R. R., and van Rijn, H. (2016a). An individual's rate of forgetting is stable over time but differs across materials. Top. Cogn. Sci. 8, 305–321. doi: 10.1111/tops.12183
Sense, F., Meijer, R. R., and van Rijn, H. (2016b). “On the link between fact learning and general cognitive ability,” in Proceedings of the 38th Annual Meeting of the Cognitive Science Society, eds A. Papafragou, D. Grodner, D. Mirman and J. C. Trueswell (Philadelphia, PA: Cognitive Science Society).
Settles, B., and Meeder, B. (2016). A trainable spaced repetition model for language learning. Assoc. Comput. Ling. 1, 1848–1858. doi: 10.18653/v1/P16-1174
Unsworth, N. (2016). Working memory capacity and recall from long-term memory: examining the influences of encoding strategies, study time allocation, search efficiency, and monitoring abilities. J. Exp. Psychol. Learn. Mem. Cogn. 42, 50–61. doi: 10.1037/xlm0000148
Unsworth, N., Brewer, G. A., and Spillers, G. J. (2009). There's more to the working memory capacity-fluid intelligence relationship than just secondary memory. Psychonom. Bull. Rev. 16, 931–937. doi: 10.3758/PBR.16.5.931
Unsworth, N., and Engle, R. W. (2007). The nature of individual differences in working memory capacity: active maintenance in primary memory and controlled search from secondary memory. Psychol. Rev. 114, 104–132. doi: 10.1037/0033-295X.114.1.104
Van Bebber, J., Lem, J., and Van Zoelen, L. (2010). Q1000 Capaciteiten Hoog [Q1000 High Capacities]. Woerden: Meurs HRM.
van den Broek, G. S. E., Takashima, A., Wiklund-Hörnqvist, C., Karlsson Wirebring, L., Segers, E., Verhoeven, L., et al. (2016). Neurocognitive mechanisms of the “testing effect”: a review. Trends Neurosci. Educ. 5, 52–66. doi: 10.1016/j.tine.2016.05.001
van Rijn, H., van Maanen, L., and van Woudenberg, M. (2009). “Passing the test: improving learning gains by balancing spacing and testing effects,” in Proceedings of the 9th International Conference on Cognitive Modeling (Manchester, UK), 110–115.
Wagenmakers, E.-J., Morey, R. D., and Lee, M. D. (2016a). Bayesian benefits for the pragmatic researcher. Curr. Dir. Psychol. Sci. 25, 169–176. doi: 10.1177/0963721416643289
Wagenmakers, E.-J., Verhagen, J., and Ly, A. (2016b). How to quantify the evidence for the absence of a correlation. Behav. Res. Methods 48, 413–426. doi: 10.3758/s13428-015-0593-0
Wagenmakers, E.-J., Verhagen, J., Ly, A., Bakker, M., Lee, M. D., Matzke, D., et al. (2015). A power fallacy. Behav. Res. Methods 47, 913–917. doi: 10.3758/s13428-014-0517-4
Keywords: rate of forgetting, adaptive learning, working memory, general cognitive ability, individual differences
Citation: Sense F, Meijer RR and van Rijn H (2018) Exploration of the Rate of Forgetting as a Domain-Specific Individual Differences Measure. Front. Educ. 3:112. doi: 10.3389/feduc.2018.00112
Received: 02 May 2018; Accepted: 04 December 2018;
Published: 18 December 2018.
Edited by:
Michael S. Dempsey, Boston University, United StatesReviewed by:
Oliver Hardt, McGill University, CanadaPeter Verkoeijen, Erasmus University Rotterdam, Netherlands
Copyright © 2018 Sense, Meijer and van Rijn. This is an open-access article distributed under the terms of the Creative Commons Attribution License (CC BY). The use, distribution or reproduction in other forums is permitted, provided the original author(s) and the copyright owner(s) are credited and that the original publication in this journal is cited, in accordance with accepted academic practice. No use, distribution or reproduction is permitted which does not comply with these terms.
*Correspondence: Florian Sense, Zi5zZW5zZUBydWcubmw=